
 Submit a Paper
 Propose a Special lssue
 Open Access
ARTICLE

Whale Optimization Algorithm-Based Deep Learning Model for Driver Identification in Intelligent Transport Systems
Information Technology Division, Henan Transportation Development Center, Zhengzhou, 450000, China
* Corresponding Author: Yuzhou Li. Email:
Computers, Materials & Continua 2023, 75(2), 3497-3515. https://doi.org/10.32604/cmc.2023.035878
Received 08 September 2022; Accepted 06 January 2023; Issue published 31 March 2023
 View Full Text
 Download PDF
Abstract
Driver identification in intelligent transport systems has immense demand, considering the safety and convenience of traveling in a vehicle. The rapid growth of driver assistance systems (DAS) and driver identification system propels the need for understanding the root causes of automobile accidents. Also, in the case of insurance, it is necessary to track the number of drivers who commonly drive a car in terms of insurance pricing. It is observed that drivers with frequent records of paying “fines” are compelled to pay higher insurance payments than drivers without any penalty records. Thus driver identification act as an important information source for the intelligent transport system. This study focuses on a similar objective to implement a machine learning-based approach for driver identification. Raw data is collected from in-vehicle sensors using the controller area network (CAN) and then converted to binary form using a one-hot encoding technique. Then, the transformed data is dimensionally reduced using the Principal Component Analysis (PCA) technique, and further optimal parameters from the dataset are selected using Whale Optimization Algorithm (WOA). The most relevant features are selected and then fed into a Convolutional Neural Network (CNN) model. The proposed model is evaluated against four different use cases of driver behavior. The results show that the best prediction accuracy is achieved in the case of drivers without glasses. The proposed model yielded optimal accuracy when evaluated against the K-Nearest Neighbors (KNN) and Support Vector Machines (SVM) models with and without using dimensionality reduction approaches.Keywords
Driving is a job that requires continuous, consistent and prolonged concentration wherein drivers have to pay constant attention on the road. It is prevalent for drivers to get fatigued, leading to fatal accidents. Hence, the need for driver identification and detection systems is enormous. This would detect and notify drivers of their physical conditions and reduce the number of fatigue-related accidents. Advanced Driver Assistance Systems (ADAS) in autonomous and intelligent transportation are presently part of extensive research. The sensor-based systems focus on the well-being, safety, and security of the drivers to avoid different unexpected accidents. Most of these accidents are caused due to fatigue, stress, and distractions by the drivers. Driver drowsiness detection and driver behavior analysis is an essential aspect of transportation safety that helps to prevent accidents primarily caused by drivers’ drowsiness.
The automated driver identification system helps to identify drivers by considering their behavior, sleepiness, identity, duration of driving, and individual traveling path to ensure complete safety and security. The driver identification system is deployed in both human-driven and autonomous vehicles, which helps in learning and analyzing the driving patterns of the drivers. Such systems use the learned data to identify the driver. In association with the identification of the driver, such systems can also help in recommending the shortest path to reach a destination, recommending places to visit, and also caters to removing security issues.
The use of an automated driver identification system has many benefits. Such systems allow for identifying the driver assigned or driving a particular vehicle at a specific time. This prevents the possibility of unauthorized or after-hours driving of the car without approval. In advanced real-time systems, there could be provisions to set the alarm if an identified driver starts a journey so that the administration can immediately take the necessary measures or actions. The driver identification systems also help to comply with legislation relevant to the drivers. The drivers working time limits are monitored by automatically recording their durations of driving which are initially recorded, and reported. If we are dealing with a fleet of cars wherein there exists a very high rotation of drivers in a particular vehicle; it is essential to know the level of care taken by a driver while driving. It is often found that cars driven by the driver are returned with damage and immediately get taken over by another driver due to high rotation of duty. In such scenarios, if the driver responsible for such acts or violations remains undetected, there could be future consequences leading to severe risks to the extent of complete vehicle stoppage. The driven identification system helps in more accessible and accelerated identification of transgressors so that actions can be taken promptly. The drivers in such scenarios are aware of being monitored, which significantly impacts their driving behavior. The companies owning the cars are also benefitted due to reduced damage-related costs in association with avoiding possibilities of car misuse. Apart from the perspective of monitoring and risk management, the system allows the recording of mileage travelled by each driver, and the corresponding salary gets automatically calculated. Advanced driver assistance systems (ADAS) also align with fulfilling similar objectives emphasizing driver’s comfort and safety.
It becomes imperative in this context to mention intelligent transportation systems as the driver identification system proposed in this paper that could be used as an essential component of such systems. “Smart transportation systems” use various technologies to monitor, evaluate and manage transportation, to ensure optimum efficiency and safety. The proliferation of Internet of Things (IoT), advanced communication technologies, and machine learning approaches in “smart transportation systems” would help to provide high-speed communication, monitoring, and controlling of real-time transportation systems with minimum latency. The driver detection system proposed in the paper would collect driver data using sensors which would be further processed and analyzed using the WOA-based deep learning framework. The predictions generated by the model would detect driver drowsiness and driver behavior. While considering the attributes mentioned above, in the images, namely their sleepiness, duration of driving, and individual path of driving, a driver, if found sleepy, would be identified. This would aid in determining whether the driver would be permitted to operate a vehicle, maintaining security and safety.
Sophisticated embedded electronic systems have been developed for in-vehicle deployment as part of driver identification models. There are systems created that use artificial neural networks and cepstral feature extraction methods to identify different drivers’ driving styles. These types of systems perform real-time identification of drivers based on non-intrusive driving behavior signals, namely the brake pedal and gas pedal signals [1]. Various studies have been conducted involving machine learning and deep learning techniques in driver identification systems. For example, the article by Abdennour et al. (2021) developed a recurrent neural network-based deep learning framework involving CAN-bus data that enabled driver identification. The framework was an intrinsic part of the advanced driver assistance system that ensured optimum protection and security of the vehicle. The model, when compared with traditional approaches, yielded 99.3% accuracy. The model effectively captured the temporal features to provide driver identification [1]. The study by Farah & Moreira-Matias (2017) developed an off-the-shelf machine learning framework that used inexpensive driver trip data for driver identification. The In-Vehicle Data Recorder (IVDR) technology helped in achieving more than 75% accuracy [2].
Various studies have focused on driver identification using deep learning models. Some of the significant studies are highlighted in the literature review section. The research gaps identified are:
• Although pre-processing was performed, hyper-parameter tuning using a metaheuristic algorithm was absent in the majority of the driver identification studies.
• The majority of the studies did not consider the reduction in training time, and evaluation metrics were limited to accuracy.
• The majority of the studies did not consider multiple cases-“Daytime with Glasses,” “Daytime without Glasses,” “Night time with Glasses,” “Night time without Glasses,” and “Daytime with sunglasses,” for evaluation.
Based on the research mentioned above, the primary objectives of the work include the following:
• Performing hyper-parameter optimization to ensure the most significant features in the dataset are included for further analysis.
• Evaluation of the proposed model considering multiple cases about the driver.
• Evaluation of the proposed model considering all the predominant evaluation metrics–Accuracy, Precision, Recall, Specificity, and Sensitivity.
Considering the same objective, the present study uses a hybrid machine learning-based approach for driver detection in intelligent transport systems. The unique contributions of the paper include the following:
• An exhaustive review of studies conducted on driver identification.
• Implement a Hybrid PCA and WOA based CNN model for driver identification.
• Evaluation of the model against the state-of-the-art models considering Accuracy, Precision, Recall, Sensitivity, and Specificity.
The organization of the paper is as follows. Section 2 presents a detailed review of related studies. Section 3 describes the methodologies followed by the results and analysis in Section 4. Section 5 consolidates the outcome of the study as part of the conclusion.
Various studies have been conducted relevant to driver identification systems, and in most of the research, machine learning and deep learning techniques have been the predominant choices. This section highlights some of the recent studies on driver identification systems where deep learning techniques are implemented.
The study in [3] created an advanced driver assistance system (ADAS) that focused on identifying motorists’ levels of intoxication and warning them to prevent collisions. It is prevalent for drivers to get fatigued and detecting such a state in an intrusive way is extremely important. The driver should avoid being unnecessarily bothered when they are not exhausted. The first approach used in the study was to record the sequence of drivers’ images which were 60 s long, wherein the face would be visible. The framework used two alternatives for detection. The first alternative used recurrent and convolutional neural networks, and the other option used deep learning techniques that extracted numeric features from the analysed images. The extracted features were fed into a fuzzy logic-based system, which yielded enhanced accuracy for training and testing data.
The study in [4] proposed a driver identification system that used deep learning techniques based on CAN data. The CAN data were collected from the vehicles using sensors and were fed into a CNN model that helped to learn and detect a driver. The study was further optimized using one-dimensional CNN, normalization, special section extracting, and post-processing to enhance the accuracy of the generated results. The study was implemented on a real-time vehicle using simulation, and the time required to achieve a particular accuracy level was calculated. The results showed that it took almost 4–5 min to reach an accuracy level of 80%.
The study in [5] highlighted the importance of driver identification in an advanced driver assistance system. Developing in-vehicle networking systems, CAN, smartphones, and the whole range of sensors has enabled easy access to vehicular and driver-related data. The study emphasized the importance of a large volume of labeled data that helped in driver identification and relevant behavior analysis. The proposed architecture in the study performed triplet loss training for time-series-based analysis considering an unsupervised approach. An encoder architecture using exponentially dilated causal convolutions was implemented with support vector machines to predict the driver driving vehicle.
The study in [6] claimed that humans have unique driving styles and behavior that could be used to identify drivers. Various machine learning algorithms have been used that consider human driving style identification for predictions. In the case of advanced driver assistance systems, this attribute enables the protection and security of the vehicles. The drivers create their unique identification profile based on their driving styles, thereby improving the ADAS fidelity. But human behavior sometimes seems to be unpredictable, and there are challenges in capturing the temporal features of the signal, which hinders accurate driver identification. The study in [4] developed a framework that used deep learning techniques for driver identification based on residual convolutional networks (RCN). The architecture was implemented using CAN bus vehicular data, which also removed privacy concerns.
Using a convolutional neural network technique, the study in [7] created a driver activity identification system that assisted in analyzing the behavior of the drivers. The system helped to identify seven driving activities, namely everyday driving, left mirror checking, rear mirror checking and proper mirror checking, use of in-vehicle radio device, and use of the mobile phone–texting and answering, respectively. The four activities in the study were considered normal driving activities, and the last three fell in the group of distraction activities. The data were collected from ten drivers using a simple camera. The raw images were segmented using a Gaussian mixture model and extracted from the driver’s body from the background. This image dataset was fed into the CNN model for behavior recognition. Transfer learning techniques were implemented to reduce the cost of training and to fine-tune the pre-trained model. The pre-trained models involved in the study included AlexNet, GoogleNet, and Residual neural Network (ResNet50). The model generated average accuracy, but when the model was trained for binary classification to detect driver distraction, the generated accuracy was relatively high.
The study in [8] mentions the importance of studies that characterize the driving styles of human drivers using Global Positioning System (GPS) sensor data. These types of implementations are essential for automotive industries. Auto insurance, autonomous driving, and other application scenarios all benefit from the representations of various driving features. The study proposed a deep learning solution for analyzing driving behavior based on GPS data which efficiently extracted high-level features from complex driving patterns.
The study in [9] developed a deep learning architecture entitled Driver2vec for mapping short intervals of driving data into an embedding space that represented drivers’ behavior for identifying drivers. To achieve the highest level of classification accuracy, the system combined a temporal convolutional network and a gradient-boosting technique. The architecture successfully identified the driver from almost 10-s intervals of sensor data ensuring average pairwise driver identification accuracy of 83.1%. This accuracy was relatively superior in comparison to the previous studies conducted.
The study in [10] investigated the postures of distracted drivers and tried to recognize the same as part of the human action recognition framework. Numerous car accidents are caused due to drivers being distracted while driving, and this study aims to resolve this issue by improving the performance of distracted driver detection systems. The framework incorporates the use of a dashboard camera that captures images 2D images of distracted drivers. A combination of three deep learning approaches, namely the inception module with a residual block and a hierarchical recurrent neural network, is implemented to enhance the performance of the distracted drivers. The distracted behaviors of the drivers include texting, talking over the phone, listening to the radio, drinking, talking to passengers, fixing hair, and doing makeup.
The study in [11] offered a distracted driver recognition system using features that were taken from a Visual Geometry Group 19 (VGG-19) convolutional network that had already been trained. A convolutional neural network with 19 layers is called VGG-19. AlexNet was developed in 2012, which was an improvement of the traditional convolutional neural networks. VGG is a successor of AlexNet, which was created by a development group named Visual Geometry group in Oxford. The VGG model uses the ideas of its predecessors, improves on the same, and further uses convolutional neural networks to improve accuracy. Although the variations existed in illumination conditions, camera position, driver’s ethnicity, and gender, the best-fitted model generated a testing accuracy of 95% and average accuracy of 80%. Generalization was tested using the leave-one-driver-out cross-validation method, and the framework aided in removing over-fitting problems, which are common with low-variance datasets. The framework was further evaluated against the Extreme Gradient Boosting (XGBoost) algorithm, wherein the proposed approach outperformed XGBoost by almost 7% accuracy.
The study in [12] implemented a driver identification and verification system using deep learning techniques on tri-accelerometer signals collected from the smartphones used by the drivers. The system architecture used ResNet-50 in association with two stacked gated recurrent units (SGRU) wherein the ResNet-50 formed the deep layer model, and the Gated Recurrent Unit (GRU) layers modeled the dynamic behaviors of the drivers. The Siamese Neural Network, in addition to Triplet loss training, was used for the verification of the drivers. The framework result was found to be competitive with the traditional and state-of-the-art approaches.
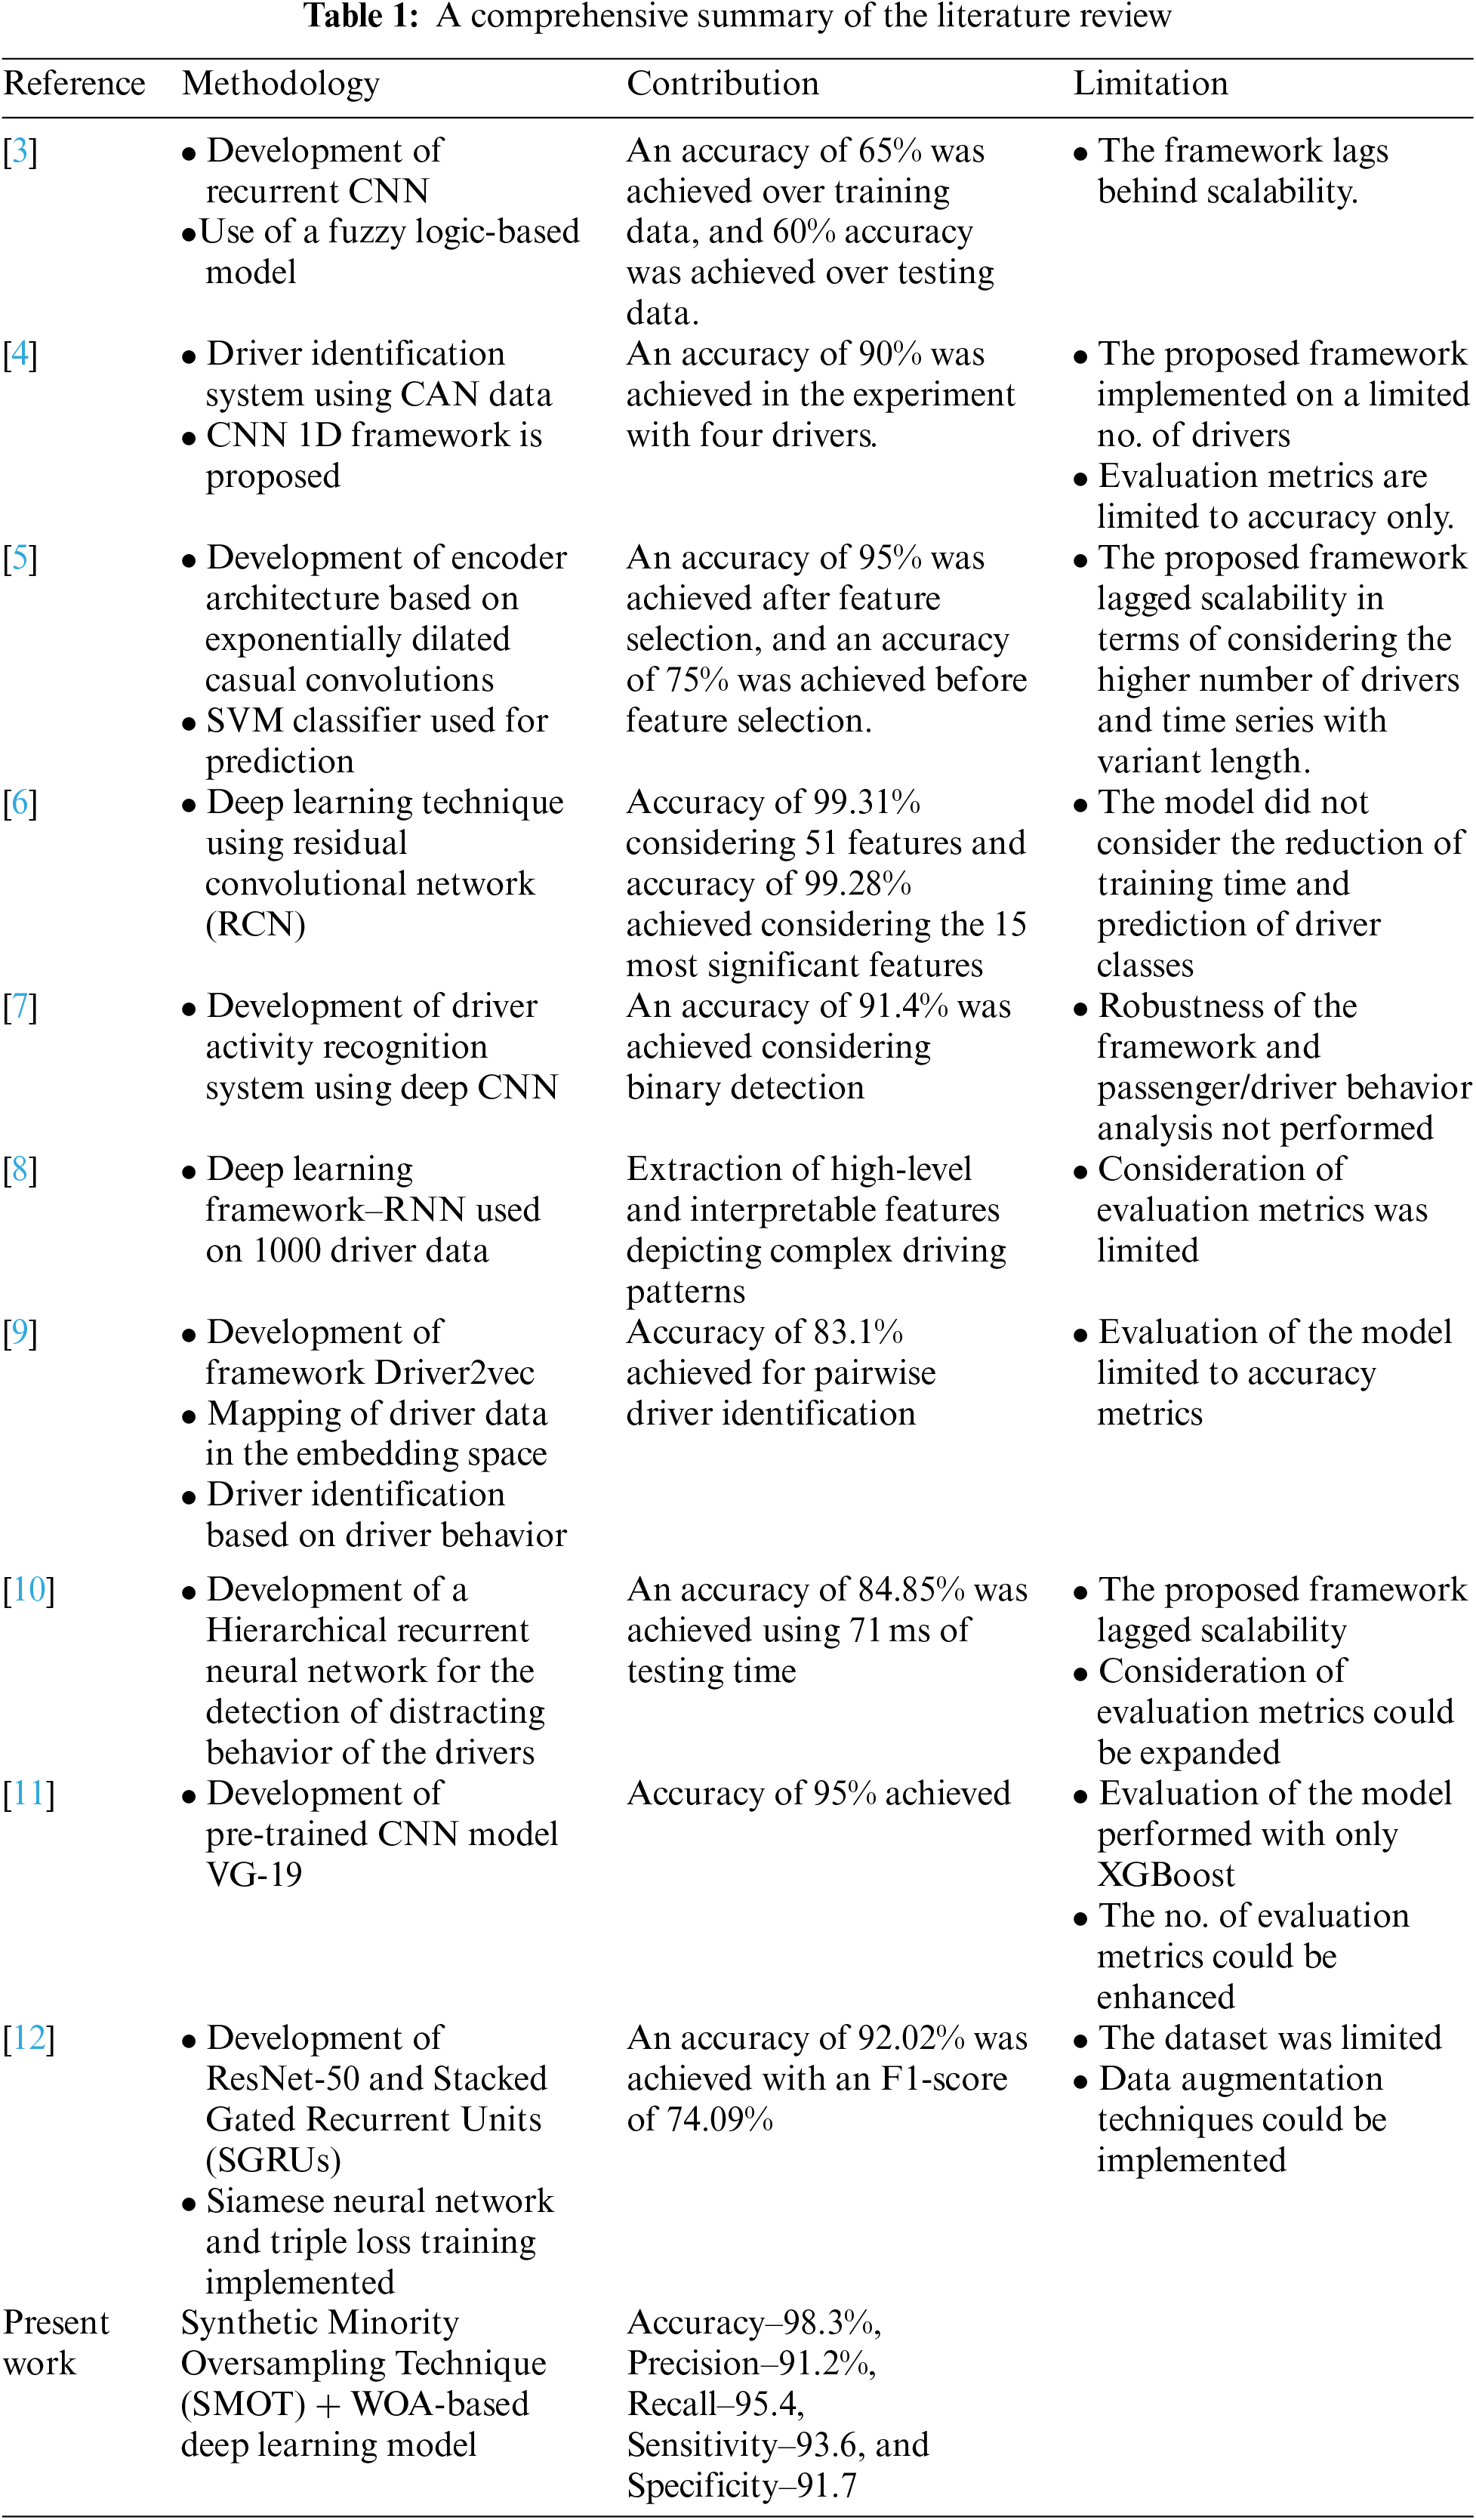
The traditional Machine Learning (ML) approaches perform reasonably well but for achieving enhanced prediction results, the need for optimization algorithms is undeniable. Optimization enables the model’s training iteratively, resulting in a maximum and minimum function evaluation. Thus in this study, WOA is used for solving various constrained and unconstrained optimization problems without enforcing structural reformation to the algorithms. A comprehensive summary of the literature review is presented in Table 1.
Based on the review mentioned above on related studies, it is evident that driver identification is essential as part of safety and security. ML and deep learning techniques have been popular choices in various applications pertinent to driver identification. Thus the present paper also uses a similar technique where optimization algorithms are used on the dataset, which is further fed into a deep neural network model. The details of the methodology are explained in the next section.
3.1 Driver Identification and the Role of Controller Area Network (CAN)
The ability to detect and monitor a driver and their behavior is a basis for several applications and is entitled a Driver Identification system. The main objective of these systems is to detect and monitor the driver’s sleepiness, driver’s identity, driver’s duration of driving, and various other security aspects. It is essential to understand that each driver has a unique way of driving a car. The driver identification system, if appropriately developed, could perform with enhanced accuracy using an optimized classification system. The present system also intends to fulfill a similar objective wherein raw data is collected from in-vehicle sensors using the CAN, which could be elucidated after minutes of driving behind the wheel [13].
3.2 One Hot Encoding Technique
The One hot encoding technique enables the conversion of categorical data variables into a form that is accepted by the deep learning algorithm and also helps in enhancing the accuracy of the prediction. It is often used as a pre-processing technique wherein categorical attributes are converted to a form that is accepted by the ML algorithm. The encoding process includes creating a binary attribute or feature for each category and a value of 1 is assigned to the sample features relevant to the original category. Thus it is considered a predominant part of the feature engineering process wherein the categorical data is converted to numerical data, and further applied to the integer representation of the same. The variable encoded in the form of an integer is eliminated, and a new binary variable is assigned for each of the unique integer values in the dataset. It thus generates various additional features depending on the unique values present as part of the categorical feature. Each of the unique values in the category is included as a feature. Due to this, the one hot encoding technique achieves popularity for its ability to generate dummy variables [14–16].
3.3 Principal Component Analysis (PCA)
Principal Component Analysis (PCA) is a technique commonly used for the dimensionality reduction of a larger dataset. The larger variable dataset is converted into smaller forms that include the majority and essential information of the larger dataset. It is often realized that the reduction in the number of variables in a dataset often compromises the accuracy of the results generated. But this is considered acceptable when simplification is achieved through dimensionality reduction. The reason lies in the ability of smaller datasets to be easily visualized and discovered. This also enhances the output generated by the machine learning algorithm ensuring enhanced accuracy [17]. The PCA includes five stages of implementation, as stated below:
• Standardization: Standardization is done for the range of continuous initial variables so that each variable can uniformly and equally contribute towards the analysis. Standardization incorporates implementing Eq. (1), wherein all the variables are transformed to a similar scale.
• Covariance Matrix Development: The covariance matrix is developed, which helps to understand the relationship existing among the input variables and also find the difference between the same from each other and the mean. The variables sometimes reflect redundant information when there is a high correlation. The covariance matrix is thus an “N * N” matrix wherein N is the number of dimensions. The matrix includes the covariance between the pairs of variables as presented in Eq. (2).
• Calculation of Eigen Vector and Eigen Values to find the principal components from the covariance matrix: The new variables that are developed as a linear combination of the initial variables are called principal components. The new variables in this process are uncorrelated, and most of the information within the initial variables remains compressed within the first component. Thus n-dimensional data have n principal components. The central part of the information gets compressed in the first component and the majority of the rest in the second component, and this process continues till the nth component. Similar to this approach, the Eigenvalue and Eigenvectors also remain paired wherein, each Eigenvector has a respective Eigenvalue, which sums up the dimension of the data. The Eigenvalues act as the coefficient of the Eigenvectors which represent the variance of each of the principal components. The ranking of the Eigenvectors depends on the Eigenvalues which, in descending order, generate the principal components in order of significance [18,19].
3.4 Whale Optimization Algorithm (WOA)
Whales are considered to be one of the fanciest and biggest creatures existing on the planet. The adult whale can grow almost up to 30 m long in terms of length, weighing almost 180 tons. Whales are found in a variety of seven different species, namely the Killer, Minke, Right, Sei, Humpback, and Blue Whales. The most exciting part of the life of a whale is that it never wholly sleeps due to its brain being half active all the time to breathe in from the ocean’s surface. Whales are very intelligent animals with emotions. It is due to the similarities of typical cells known as spindles, which are identical to specific regions of the human brain Whales have almost twice the total number of cells as humans, which is the reason for their smartness and intelligence. They also have their unique dialect which they use during their hunting [20,21]. Whales live alone or in groups wherein, some of their species live in the form of family throughout their lives. The humpback whale has a unique technique of hunting which is called a bubble-net feeding method. The whales use this technique to hunt the school of krill available. The whale creates bubbles in the shape of the number “9” as part of its food-searching process. The bubbles in this technique form upward spirals and double loops. During the upward spiral formation, the whale dives down to 12 meters and then starts creating bubbles in a spiral shape encircling the prey by swimming upwards to the ocean surface. This spiral bubble technique is modeled mathematically to develop a bio-inspired metaheuristic algorithm for optimization. The steps involved in the mathematical model are mentioned below, and the workflow of WOA is presented in Fig. 2.
• Encircling of the prey: The Humpback whale identifies the location of the prey and starts encircling wherein the optimum design position in the search space cannot be found up front. The WOA considers the current best solution as the target or closest to the optimum position. Once the optimum or best search agent is identified, the other agents update their positions automatically to be close to the best search agent [20,21]. This behavior is presented using the following Eqs. (3) and (4):
Here t denotes the current iteration,
The components of
• Bubble-net attacking method: There are two types of strategies that are mathematically modeled to depict the bubble-neck behavior of humpback whales [20,21]. These approaches are mentioned below:
• Shrinking encircling mechanism: In this approach, the value of
• Spiral updating position: This technique helps to calculate the distance between the whale (M, N) and the prey (M*, N*). The helix-shaped movement is depicted using the spiral equation as mentioned below [20,21]:
Here,
• The prey search process: The vector
The whale optimization algorithm (WOA) is a population-based meta-heuristic algorithm that contributes to solving various real-world problems. The workflow diagram of WOA is provided in Fig. 2. The most essential aspect of using WOA is its ability to generate a good convergence rate population-based WOA enables avoidance of local optima, ensuring a global optimum solution is achieved [20,21]. These make WOA an ideal candidate for resolving constrained and unconstrained optimization problems delivering real-time applications without much of a structural reformation of the existing algorithm. The study in [22] developed a WOA-based Restricted Boltzmann machine (RBM) neural network framework considering real-time driver behavior data. The simulation results generated an accuracy of 90% representing human drivers’ operation effectively and efficiently. The study in [23] used WOA to generate the torque demands look-up tables for driver behavior detection in an electric vehicle having the capability of single-pedal driving. The model generated optimal performance when the evaluation of vehicle performance was conducted.
3.5 Convolutional Neural Network (CNN)
The Convolutional Neural Network (CNN) is also termed as ConvNet, which is a type of neural network that focuses on the processing of data that can be fit into a grid-like topology, being in image form. A digital image is a binary representation of visual data wherein there exists a series of pixels that are organized in a grid structure containing pixel values that denote the level of brightness and color of each pixel. The human brain processes an enormous amount of information as soon as an image is seen. Each neuron has its receptive field, and it is connected with the other neurons ensuring coverage of the entire visual field. The neurons respond to the stimuli in the restricted region of the biological visual system. Similarly, each neuron in a CNN processes data only in its related receptive field. The layers are arranged in a way such that they detect simple and complex patterns, thereby enabling sight to the computers.
The CNN consists of three layers, namely the convolutional layer, the pooling layer, and the fully connected layer. The convolutional layer acts as the core building block of CNN, which holds the primary portion of the computational load in a computer. The dot product of the two matrices is performed in this layer, wherein one matrix is the set of learnable parameters termed as the kernel, and the other matrix holds the restricted portion of the receptor field. The pooling layer replaces the output generated from the network at specific locations by computing summary statistics of the nearest outputs. This reduces the spatial size of the representations, the computation, and the weights. The pooling operation gets processed on each slice of representation individually. The fully connected layer has complete connectivity with all the preceding and succeeding layers, wherein it can be computed using matrix multiplication followed by the bias effect. The fully connected layer helps map the representation between the input and the output. CNN plays a significant role in solving various problems and performing diversified tasks like image processing, computer vision, localization and segmentation, video analysis, recognizing obstacles in self-driving cars, speech recognition in natural processing, and various others. One of the significant advantages of using CNN is its ability to achieve spatial invariance, which enables their ability in to learn to recognize and extract image features from anywhere in the image. Hence the need for manual extractions gets eliminated as CNN learns the features from the data, and image extraction is performed directly from the image, which makes it a potential tool for deep learning to generate accurate results.
Driver identification systems are one of the most essential components in intelligent transportation frameworks, which ensures the safety and security of the drivers. As previously mentioned, driving is an activity that requires constant concentration, attention, and a closer look at the road for a prolonged period. In such circumstances, it is incredibly natural for drivers to get fatigued, leading to drowsiness and, thus, unfortunate ramifications of fatal accidents. The present study focuses on developing a framework that would collect driver behavior data in real-time using sensors, which would be transferred to the framework using communication protocols. The data will be further processed, transformed, and analyzed using the proposed framework for generating predictions on driver behavior. The primary focus is on the analytical approach and hence CAN data is used to evaluate the performance of the proposed framework.
Fig. 1 presents the proposed framework, which consists of a PCA-WOA model integrated with CNN for driver detection in vehicles. The raw data is collected from in-vehicle sensors using the CAN, which could be elucidated after minutes of driving behind the wheel. The image data collected is first encoded using the one-hot encoding technique. This technique converts the categorical value of the dataset into binary form. The reason and need behind this transformation lie in the inability of machine learning algorithms to process raw categorical values. The one-hot encoding technique converts these categorical values to “0” and “1”, where “1” denotes existing values and “0” denotes non-existing values. This technique helps in achieving enhanced accuracy in the prediction results.

Figure 1: Proposed framework

Figure 2: Workflow diagram of whale optimization algorithm
After the transformation of the dataset, the PCA technique is implemented for dimensionality reduction. PCA is preferred over the other traditional technique because of its simplistic use, testing capability, and ease of comparative analysis in real-time. The PCA algorithm helps in removing correlated attributes from the dataset ensuring the components are independent of one another. This reduces the training time when fed into a machine learning model and reduces the chances of over-fitting, converting the data from a higher dimension to a lower dimension. The combination of one-hot encoding and PCA has been significantly used in various machine-learning implementations. As an example, the study in [24] proposed a framework involving one-hot encoding and PCA based firefly model for the classification of intrusion detection datasets. The one-hot encoding technique performed data transformation followed by PCA for optimal feature extraction to be fed into the firefly algorithm for hyper-parameter tuning to achieve enhanced accuracy from the ML model. The study in [25] used a similar approach involving one hot encoding, PCA, and Grey Wolf Optimizer (GWO) for detecting intrusions in IoMT (Internet of Medical Things) based architecture. The deep neural network model in the paper enabled the development of an efficient intrusion detection system for the classification and prediction of unexpected cyber-attacks.
Next, the Whale optimization algorithm (WOA) is used to select the optimal features in the dataset, and then the grid search algorithm is used for hyperparameter tuning. The final data set after the hyperparameter tuning completion is fed into a CNN model to predict driver behavior. Finally, the proposed framework is evaluated against state-of-the-art techniques considering accuracy, precision, recall, sensitivity, and specificity. The following steps summarize the proposed approach for driver identification in intelligent transport systems.
• The raw data is collected from in-vehicle sensors using the controller area network (CAN), and the images are loaded into Google Colab, which is a popular graphics processing unit (GPU) enabled python notebook framework.
• The One-hot encoding technique converts the categorical values in the dataset to numerical form.
• Then PCA is implemented for dimensionality reduction to select the most significant attributes from the dataset.
• Then to further select the optimal features, the WOA algorithm is used, which selects the optimal pixels followed by a grid search approach for hyperparameter tuning.
• This data is fed into the CNN Model, and the results are evaluated considering the metrics–accuracy, precision, recall, sensitivity, and specificity.
The study was conducted using raw data collected from in-vehicle sensors using CAN. The experimental analysis of the study was conducted by Google Colab, a popular GPU-enabled python framework incorporating 50 GB hard disk and 25 GB GPU-based random access memory (RAM). The approach was evaluated based on the metric–accuracy, precision, recall, sensitivity, and specificity. A random sample of 6000 images was used, wherein 5000 images were included for training, and the remaining 1000 images were used for testing.
Fig. 3 presents the histogram of the time required to touch a set of pre-defined accuracy values. The histogram clearly states that the most significant volume of data falls within 0–90 s. This reflects the fact that the higher the level of accuracy, the reliability of the system is also higher, and it takes a longer time. Hence similar methodologies are implemented in real-time. It is essential to set reasonable accuracy, and time targets considering the trade-offs between time and accuracy.

Figure 3: Histogram of the time required to touch a pre-defined accuracy
Fig. 4 represents the accuracy level with and without post-processing, and it is identified that with post-processing the accuracy is much higher–98% in comparison to the case without post-processing. The role of post-processing is justified here as it yields better results. Post-processing enables the identification of the most significant attributes in the dataset, ensuring only them to be included in the CNN model for training. Thus, the accuracy level of the prediction results gets enhanced. The post-processing activity converts the data to a much more usable and desired form, ensuring more meaning and information are acquired from the data and the relevant generated results.

Figure 4: Accuracy level post-processing and without post-processing
Fig. 5 compares the performance of the proposed approach in comparison to the other state-of-the-art techniques considering the number of training data. Fig. 4 emphasizes post-processing time, whereas Fig. 5 is generated considering the number of training data as the basis of evaluation. As part of Fig. 5, the model is evaluated against the K-Nearest Neighbour, Support Vector Machines, and CNN model with and without incorporating the WOA. The x-axis represents the number of training data used, and the y-axis represents the accuracy level. The proposed approach yields better accuracy in comparison to the comparable approaches.

Figure 5: Comparative performance of the machine learning approaches
Fig. 6 presents the comparative analysis of the different traditional and state-of-the-art models concerning the PCA-WOA-based CNN model. The model is evaluated by considering Accuracy, Precision, Recall, Specificity, and Sensitivity. The results reveal that the KNN model integrated with WOA has 85.1% accuracy. The SVM model integrated with WOA with 86.7% accuracy. But the proposed PCA-WOA-based CNN model yielded enhanced accuracy of 90.4% compared to the other state-of-the-art approaches. The positivity of using WOA is justified by the generated results, as its use has enhanced the accuracy level. Moreover, using CNN in association with WOA has yielded comparatively better accuracy than the other approaches, which justifies the advantage of using CNN.

Figure 6: Comparison of the proposed approach with state of the art techniques
Although the results were promising, the accuracy of the model was still found to be low in comparison to previous research being conducted. Thus the data was further pre-processed to enhance the performance of the model. In this regard, SMOT was applied to the dataset. This technique helped to synthesize new minority instances between the existing minority instances in the dataset. As part of this technique, the minority classes are randomly picked up and the K-Nearest Neighbour for that specific point is calculated. Then the synthetic points are added between the neighbors and the chosen spot. When SMOT was applied to the data, the event rate was enhanced to 65% with the increase in the no. of observations due to resampling. The model’s performance was further enhanced due to the application of SMOT, as presented in Fig. 7.

Figure 7: Comparison of the CNN + WOA model after SMOT with state of the art techniques
The results reveal that the application of SMOT enhanced the proposed model’s accuracy from 90.4% to 98.3%. The other evaluation metrics, namely precision, recall, sensitivity, and specificity also observed improvement post-application of the SMOT technique.
The proposed model was further evaluated considering the five cases of driver “Daytime with Glasses,” “Daytime without Glasses,” “Nighttime with Glasses,” “Nighttime without Glasses,” and “Daytime with sunglasses” The accuracy of the proposed model in each of the cases is depicted in Table 2 and Fig. 8. The accuracy of the model was found to be highest in the case–“Daytime without glasses” and lowest in the case–“Daytime with Sunglasses”.
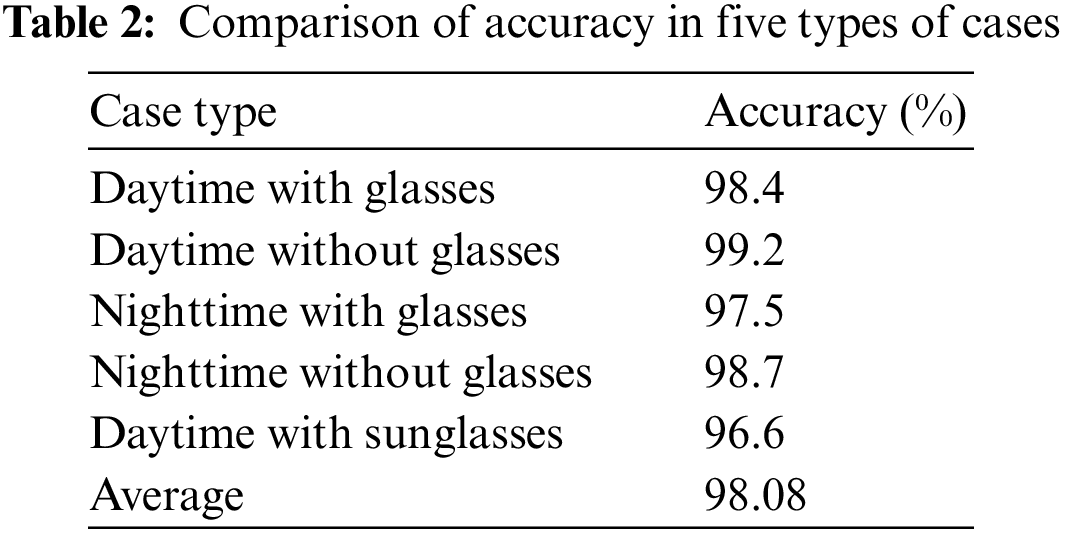

Figure 8: Model accuracy achieved in five different use cases
Fig. 9 displays the model’s temporal complexity for three scenarios: “Without Dimensionality Reduction,” “With Dimensionality Reduction,” and “With Dimensionality Reduction using PCA-WOA.” It is evident in the figure that the Hybrid PCA-WOA-based CNN model performed the analysis in relatively lesser time in comparison to the alternative cases. This justifies the efficiency of the proposed model in comparison to the other approaches. The essence of dimensionality reduction is justified here as the selection of the most appropriate attributes reduces training time and helps in reaching the desired level of accuracy faster.

Figure 9: Time comparison of the model for three cases
The following is the summary of the results generated:
• The largest volume of data falls within 0–90 s.
• The pre-processing enhances the accuracy of the model using PCA-WOA.
• The PCA-WOA-based CNN model yields better accuracy in comparison to the comparable approaches considering the number of training data, yet the values of the accuracy achieved are initially not sufficiently promising.
• Application of the re-sampling technique SMOT enhances the performance of the model.
• The SMO + PCA-WOA-based CNN model yields better accuracy in comparison to the comparable approaches, considering the accuracy metrics.
The novelty of the proposed model lies in its rigorous pre-processing approach, which involves using one-hot encoding, and SMOT followed by PCA for dimensionality reduction. Further, the WOA algorithm is used for hyperparameter tuning and then the dataset is fed into the CNN model. This ensures the use of the dataset in the most appropriate form to ensure that the model yields optimized output.
Driver Identification in intelligent transportation systems is highly relevant considering security aspects. The primary objective of such systems includes monitoring various behavioral attributes of the driver, namely the driver’s sleepiness, driver identity, driver’s duration of driving, and various other aspects that hinder driving performance. The present study proposes a hybrid technique that uses a PCA-WOA-based CNN model for driver detection in intelligent transport systems. At the outset, the raw data was collected from in-vehicle sensors using a controller area network (CAN). This data was subjected to a one-hot encoding technique to convert it to numerical form to be suitable for use in a machine learning model. Once the data is converted to its binary form, PCA is applied to the dataset for dimensionality reduction. This eliminates insignificant and irrelevant attributes from the dataset and ensures the inclusion of only significant ones. To further improve the dataset’s quality, Whale Optimization Algorithm (WOA) is applied to select the optimal features. These optimal features are fed into a CNN model for prediction. The model’s results ensured driver identification with optimal accuracy reducing chances of accidental risks. The accuracy level considering post-processing was found to be higher (98%) than the alternative case. The graph considering training data and accuracy level revealed the advantage of the proposed CNN-WOA model compared to the other approaches. The proposed model was further evaluated against the state-of-the-art techniques, and the results justified the superiority of the model in terms of its accuracy. But the model yielded an accuracy of 90.4%, which was not impressive enough compared to the previous studies conducted. Hence the data set was re-sampled using the SMOT technique, and then WOA, followed by the CNN model, was implemented. The model post implementation of re-sampling yielded enhanced accuracy of 98.3%, which was also superior to the state-of-the-art approaches. The proposed model was also compared considering five use cases, namely Daytime with Glasses,” “Daytime without Glasses,” “Nighttime with Glasses,” “Nighttime without Glasses,” and, “Daytime with sunglasses”. The results highlighted the ability of the model in generating better prediction in the use case–“Daytime without Glasses” and an average of 98.08% accuracy was achieved on average considering all the five use cases. The model generated promising results but had scalability issues due to limitations in the dataset and the unavailability of real-time data. Also, WOA has its challenges associated with slow convergence, lower accuracy, and ease of falling into a locally optimal solution. The system also requires rigorous testing and implementation of real-time driver detection and relevant behavior analysis on automated intelligent transportation systems in the real world. Also, explainable AI techniques could be integrated to achieve enhanced transparency and interpretability of the generated results.
Funding Statement: This work is supported by the Research on Big Data Application Technology of Smart Highway (No. 2016Y4) and Analysis and Judgment Technology and Application of Highway Network Operation Situation Based on Multi-source Data Fusion (No. 2018G6) and Highway Multi-source Heterogeneous Data Reconstruction, Integration, and Supporting and Sharing Packaged Technology (No. 2019G-2-12) and Research on Highway Video Surveillance and Perception Packaged Technology Based on Big Data (No. 2019G1).
Conflicts of Interest: The authors declare that they have no conflicts of interest to report regarding the present study.
References
1. F. Yassin, A. Zribi, A. Atig and R. B. Abdennour, “A neural multicontroller for strongly nonlinear systems,” International Journal of Systems Science, vol. 53, no. 8, pp. 1778–1795, 2022. [Google Scholar]
2. F. M. Ortiz, M. Sammarco, L. H. M. K. Costa and M. Detyniecki, “Applications and services using vehicular exteroceptive sensors: A survey,” IEEE Transactions on Intelligent Vehicles, vol. 8, no. 1, pp. 949–969, 2023. [Google Scholar]
3. M. Elena, M. P. Sesmero, J. M. Alonso-Weber and A. Sanchis, “Driver drowsiness detection by applying deep learning techniques to sequences of images,” Applied Sciences, vol. 12, no. 3, pp. 1145, 2022. [Google Scholar]
4. J. Daun, M. S. Kim, K. T. Kim, T. W. Kim, J. H. Jin et al., “Real-time driver identification using vehicular big data and deep learning,” in IEEE 21st Int. Conf. on Intelligent Transportation Systems (ITSC), Maui, Hawaii, USA, pp. 123–130, 2018. [Google Scholar]
5. A. Mozhgan Nasr and A. Boukerche, “Driver identification using vehicular sensing data: A deep learning approach,” in 2021 IEEE Wireless Communications and Networking Conf. (WCNC), Nanjing, China, pp. 1–6, 2021. [Google Scholar]
6. A. Najmeddine, T. Ouni and N. B. Amor, “Driver identification using only the CAN-bus vehicle data through an RCN deep learning approach,” Robotics and Autonomous Systems, vol. 136, pp. 103707, 2021. [Google Scholar]
7. X. Yang, C. Lv, H. J. Wang, D. P. Cao, E. Velenis et al., “Driver activity recognition for intelligent vehicles: A deep learning approach,” IEEE Transactions on Vehicular Technology, vol. 68, no. 6, pp. 5379–5390, 2019. [Google Scholar]
8. W. S. Dong, J. Li, R. J. Yao, C. S. Li, T. Yuan et al., “Characterizing driving styles with deep learning,” arXiv preprint, arXiv:1607.03611, 2016. [Google Scholar]
9. J. B. Yang, R. G. Zhao, M. X. Zhu, D. Hallac, J. Sodnik et al., “Driver2vec: Driver identification from automotive data,” arXiv preprint, arXiv:2102.05234, 2021. [Google Scholar]
10. A. Munif and B. Alotaibi, “Distracted driver classification using deep learning,” Signal, Image and Video Processing, vol. 14, no. 3, pp. 617–624, 2020. [Google Scholar]
11. K. Arief, S. M. Bedawi, C. J. Ou and F. Karray, “End-to-end deep learning for driver distraction recognition,” in Int. Conf. Image Analysis and Recognition, Cham, Montreal, Canada, Springer, pp. 11–18, 2017. [Google Scholar]
12. S. S. Hernández, R. F. Pozo and L. A. H. Gómez, “Driver identification and verification from smartphone accelerometers using deep neural networks,” IEEE Transactions on Intelligent Transportation Systems, vol. 23, no. 1, pp. 97–109, 2020. [Google Scholar]
13. E. Saad, I. Berrada and M. Ghogho, “Who is behind the wheel? Driver identification and fingerprinting,” Journal of Big Data, vol. 5, no. 1, pp. 1–15. 2018. [Google Scholar]
14. T. R. Gadekallu, D. S. Rajput, M. Reddy, K. Lakshmanna, S. Bhattacharya et al., “A novel PCA–whale optimization-based deep neural network model for classification of tomato plant diseases using GPU,” Journal of Real-Time Image Processing, vol. 18, no. 4, pp. 1383–1396, 2021. [Google Scholar]
15. L. H. Nguyen and S. Holmes, “Ten quick tips for effective dimensionality reduction,” PLoS Computational Biology, vol. 15, no. 6, pp. e1006907, 2019. [Google Scholar] [PubMed]
16. S. Okada, M. Ohzeki and S. Taguchi, “Efficient partition of integer optimization problems with one-hot encoding,” Scientific Reports, vol. 9, no. 1, pp. 1–12, 2019. [Google Scholar]
17. I. Jolliffe, “A 50-year personal journey through time with principal component analysis,” Journal of Multivariate Analysis, vol. 188, pp. 104820, 2022. [Google Scholar]
18. G. T. Reddy, M. P. K. Reddy, K. Lakshmanna, R. Kaluri, D. S. Rajput et al., “Analysis of dimensionality reduction techniques on big data,” IEEE Access, vol. 8, pp. 54776–54788, 2020. [Google Scholar]
19. R. Vidal, Y. Ma and S. S. Sastry, “Principal component analysis,” in The Generalized Principal Component Analysis, New York, NY: Springer, pp. 25–62, 2016. [Google Scholar]
20. S. Mirjalili and A. Lewis, “The whale optimization algorithm,” Advances in Engineering Software, vol. 95, pp. 51–67, 2016. [Google Scholar]
21. M. H. Nadimi-Shahraki, H. Zamani and S. Mirjalili, “Enhanced whale optimization algorithm for medical feature selection: A COVID-19 case study,” Computers in Biology and Medicine, vol. 148, pp. 105858, 2015. [Google Scholar]
22. J. H. Liu, Y. J. Jia and Y. Y. Wang, “Development of driver-behavior model based on WOA-RBM deep learning network,” Journal of Advanced Transportation, vol. 2020, pp. 11, 2020. [Google Scholar]
23. Y. J. Zhang, Y. J. Huang, H. B. Chen, X. X. Na, C. Zheng et al., “Driving behavior oriented torque demand regulation for electric vehicles with single pedal driving,” Energy, vol. 228, pp. 120568, 2021. [Google Scholar]
24. S. Bhattacharya, P. K. Reddy, R. Kaluri, S. Singh, T. R. Gadekallu et al., “A novel PCA-firefly based XGBoost classification model for intrusion detection in networks using GPU,” Electronics, vol. 9, no. 2, pp. 219, 2020. [Google Scholar]
25. R. M. Swarna Priya, P. K. Reddy Maddikunta, M. Parimala, S. Koppu, T. G. Reddy et al., “An effective feature engineering for DNN using hybrid PCA-GWO for intrusion detection in IoMT architecture,” Computer Communications, vol. 160, pp. 139–149, 2020. [Google Scholar]
Cite This Article
 Copyright © 2023 The Author(s). Published by Tech Science Press.
This work is licensed under a Creative Commons Attribution 4.0 International License , which permits unrestricted use, distribution, and reproduction in any medium, provided the original work is properly cited.
 Downloads
 Citation Tools