
 Submit a Paper
 Propose a Special lssue
 Open Access
ARTICLE

A COVID-19 Detection Model Based on Convolutional Neural Network and Residual Learning
1 Luoyang Normal University, Luoyang, 471934, China
2 Southwest Jiaotong University, Chengdu, 611756, China
* Corresponding Author: Bo Wang. Email:
Computers, Materials & Continua 2023, 75(2), 3625-3642. https://doi.org/10.32604/cmc.2023.036754
Received 11 October 2022; Accepted 15 January 2023; Issue published 31 March 2023
 View Full Text
 Download PDF
Abstract
A model that can obtain rapid and accurate detection of coronavirus disease 2019 (COVID-19) plays a significant role in treating and preventing the spread of disease transmission. However, designing such a model that can balance the detection accuracy and weight parameters of memory well to deploy a mobile device is challenging. Taking this point into account, this paper fuses the convolutional neural network and residual learning operations to build a multi-class classification model, which improves COVID-19 pneumonia detection performance and keeps a trade-off between the weight parameters and accuracy. The convolutional neural network can extract the COVID-19 feature information by repeated convolutional operations. The residual learning operations alleviate the gradient problems caused by stacking convolutional layers and enhance the ability of feature extraction. The ability further enables the proposed model to acquire effective feature information at a low cost, which can make our model keep small weight parameters. Extensive validation and comparison with other models of COVID-19 pneumonia detection on the well-known COVIDx dataset show that (1) the sensitivity of COVID-19 pneumonia detection is improved from 88.2% (non-COVID-19) and 77.5% (COVID-19) to 95.3% (non-COVID-19) and 96.5% (COVID-19), respectively. The positive predictive value is also respectively increased from 72.8% (non-COVID-19) and 89.0% (COVID-19) to 88.8% (non-COVID-19) and 95.1% (COVID-19). (2) Compared with the weight parameters of the COVIDNet-small network, the value of the proposed model is 13 M, which is slightly higher than that (11.37 M) of the COVIDNet-small network. But, the corresponding accuracy is improved from 85.2% to 93.0%. The above results illustrate the proposed model can gain an efficient balance between accuracy and weight parameters.Keywords
It has been two years since the outbreak of COVID-19 at the beginning of 2020 [1]. The impact of the epidemic on Chinese and global real economy enterprises is enormous. The impact of COVID-19 on emerging economies is particularly serious. The loss of income caused by the epidemic has increased economic vulnerability [2]. In the COVID-19 environment, many families and enterprises are obviously unable to cope with the impact of the epidemic. According to the report of the organization for economic cooperation and development (OECD) in 2020 [3,4], due to the outbreak of novel coronavirus, the world economy may grow at the lowest growth rate since 2009. The gross domestic product (GDP) of the United States contracted by 4.8% in the first quarter of 2020, ending the longest economic expansion period in history [5]. It is expected that the global economy will shrink by 3% this year, including 6.1% in developed economies and 1% in emerging markets and developing economies [6]. The recession is far more severe than the international financial crisis in 2008. At present, the global economic recession is inevitable. This global pandemic is not only a global public health crisis, but also a severe employment crisis and economic crisis. At the same time, COVID-19 may cause more people to lose their jobs; In the United States, the number of people applying for unemployment has reached a record high, marking the end of a decade of expansion in one of the world’s largest economies [7]. Nevertheless, the future impact of COVID-19 pneumonia on global economy is still uncertain.
Since December 2019, an outbreak of a novel coronavirus disease (COVID-19) has occurred in Wuhan, China, and then COVID-19 has spread and spread throughout the world [8,9]. COVID-19 is a potentially fatal acute disease, with a mortality rate of about 4% in China, the highest mortality rate of about 13% in Algeria and Italy, and about 12% in Italy. Due to severe alveolar injury and progressive respiratory failure, the onset of severe disease may lead to death. Although laboratory tests, such as the use of reverse transcription polymerase chain reaction (RT-PCR) [10], are the gold standard for clinical diagnosis, they may produce false negatives. Moreover, in the case of a pandemic, the shortage of RT-PCR detection resources may also delay subsequent clinical decision-making and treatment. In this case, chest CT imaging has become an important tool for diagnosis and prognosis of patients with COVID-19.
Combining deep learning technology with disease and health is an innovative way to promote cutting-edge technology. It has potential application value and great significance to use advanced technology to strengthen supervised learning to diagnose coronavirus accurately. Deep learning has a great impact and opens up the new research channels on the COVID-19 epidemic [11].
Computer-aided diagnosis (CAD) is an important research topic in medical image processing and clinical diagnosis [12,13]. In recent years, deep neural network structure has made significant progress in object recognition, semantic segmentation, and image classification in image recognition tasks [14–17]. In application, the clinical detection platform used for COVID-19 is a resource-constrained terminal that requires a running program with small weight parameters. Therefore, in addition to paying attention to the recognition accuracy of the deep learning-based model for COVID-19 detection, a model should also balance the weight parameters of the model well and make it apply to the mobile platform. To solve this problem, this study presents a new COVID-19 detection model by using convolution operation, shortcut connection operation, and residual module.
In this paper, the main contributions are the followings:
(I) In this paper, a novel deep learning-based model for COVID-19 detection by fusing convolutional operations, shortcut connections and residual blocks is presented. The proposed model consists of an encoder section and a classification section. The former mainly extracts the feature maps of COVID-19 from chest x-ray (CXR) images, and the latter is responsible for judging and predicting the correct classification from the extracted feature information.
(II) In encoder section, convolutional operations can distill the feature information on COVID-19, shortcut connections provide supplementation for middle results generated by some neural network layers, and residual blocks alleviate the gradient problem caused by stacking convolution operations.
(III) In this work, the design process of the proposed model is discussed based on a large number of experimental results, which further prove the effectiveness of our architecture for COVID-19 detection.
Gu et al. [18] used convolution and long short term memory (LSTM) [19] to detect COVID-19. Convolutional neural networks (CNN) are used to extract features from CXR pictures, and LSTM determined the type of picture by processing the spatial and temporal information in CXR pictures. Hochreiter et al. [20] first used the pre-trained alexnet architecture [21] to extract the depth features of pneumonia from CXR images, then used the relief algorithm to select the significant features of pneumonia from the images, and finally used the support vector machine (SVM) [22] classifier to classify the extracted content. Cortes et al. [23] attempted to explore the scheme and significance of machine learning in solving the COVID-19 pandemic crisis. They studied how to use machine learning algorithms and methods to combat COVID-19 virus and pandemic, and discussed the main machine learning methods that are useful during the COVID-19 pandemic. The algorithms used in machine learning and their important applications are also determined and discussed. Machine learning is a useful technology that can find drugs in various fields, which seems to be beneficial to the treatment of patients with COVID-19. The learning algorithm generates interference from the unlabeled input data set and can be used to analyze the unlabeled data as the input resource COVID-19.
Shaoping Kushwaha et al. [24] proposed a weakly supervised deep learning strategy for detecting and classifying COVID-19 infection from CT images. The proposed method can minimize the requirement of manually labeling CT images, but still can obtain accurate infection detection and distinguish COVID-19 from non COVID-19 cases. Based on the promising results obtained qualitatively and quantitatively, they can envisage the wide application of our developed technology in large-scale clinical studies. In the literature, due to the lack of a published COVID-19 data set, the study was validated on 50 chest x-ray images, of which 25 chest x-ray images were diagnosed as positive. Covidx net contained seven different deep convolution neural network model architectures, such as the improved visual geometry group network (VGG19) and the second version of Google mobilenet [25]. Each deep neural network model was able to analyze the normalized intensity of X-ray images to classify the patient status as COVID-19 negative or positive. The experiment and evaluation of covidx net were successfully completed based on the X-ray images in the model training and testing phases. VGG19 and dense convolutional network (densenet [26]) models show good and similar performance of automatic COVID-19 classification, and the F1 scores of normal and detection of COVID-19 were 0.89 and 0.91, respectively. For the perception of version 3 model, the worst classification performance was: the F1 score under normal conditions was 0.67, and the F1 score under COVID-19 was 0.80. Huang et al. [27] proposed a new lasso logistic regression model based on characteristic time series data to determine the disease severity of patients with coronavirus disease (COVID-19) in 2019 and when to use drugs or upgrade intervention procedures. By providing mortality prediction according to the time-series physiological data, demographics and clinical records of patients with COVID-19, the classification model based on dynamic characteristics can be used to improve the efficacy of treatment of patients with COVID-19, give priority to medical resources and reduce casualties. In the literature [28], for the twitter classification, four different aspects (policy, health, media and others) and four different Bert models (Mbert base [29], biobert [30], clinicalbert [31] and berturk [32]) were used. Six different COVID-19 vaccines with the highest frequency were selected in the data set, and twitter posts were used for emotional analysis of these vaccines. As is known to all, this article is the first intention to understand people’s views on vaccination and vaccine types. After the experiment, the results of people’s opinions on vaccination and vaccine types are listed by country. In the data set divided by country, the success rate of the method proposed in this study in F1 score is between 84% and 88%, and the total accuracy value is 87%.
Frank, Schweter [33] integrated domain knowledge into deep neural networks by inputting anatomical features and Lu artifacts as well as original Lu frames in the form of additional channels containing pleural and vertical artifact masks. By explicitly providing knowledge in this field, the standard off the shelf neural network can be quickly and effectively fine-tuned to complete various tasks on Lu data, such as frame classification or semantic segmentation. They fine-tuned a simple image classification model to predict the severity score of COVID-19 in each frame. They also trained a semantic segmentation model to predict COVID-19 severity annotation per pixel. Frank et al. [34] proposed a network to train the classification network of COVID-19 effectively by using a small number of Computed tomography (CT) examinations and negative sample files of COVID-19. Specifically, a new self-supervised learning method was proposed to extract features from COVID-19 and negative samples. Then, the data “value” of the negative sample can be evaluated by calculating the earth mover distance between the characteristics of the negative sample and the COVID-19 sample. A predetermined number of negative samples are selected accordingly and fed to the neural network for training. Rodrigues et al. [35] introduced the preliminary results of a deep learning model based on X-ray images to classify COVID-19 positives. They provided binary classification (COVID-19 and health, COVID-19 and pneumonia) and multiple classifications (COVID-19 and pneumonia and health) of five indicators: accuracy, perception, sensitivity, specificity and F1 score. The results show that VGG19 model shows the best results, reaching 98.81% accuracy in two classifications and 91.68% accuracy in multi classifications.
In addition, Rai et al. [36] proposed a multi-habitat migration artificial bee colony (MHMABC) algorithm to optimize the training of full connection to obtain better accuracy and convergence speed, while reducing the execution cost. Khan et al. [37] proposed a method to identify the cause of pneumonia from radiological images. Since different variants of novel coronavirus lead to different pneumonia patterns, we used three convolutional neural networks (CNN) at each stage of the proposed method in order to more accurately identify pneumonia. Kushwaha et al. [38] combined residual attention with deep support vector data description (DSVDD) to facilitate network guidance during training, and realize rapid learning. Residual connectivity prevents gradient from disappearing. Our method consists of three models, each of which is dedicated to identifying a disease and classifying other diseases as abnormalities. These models are learned end-to-end. This method has achieved high performance in classifying CT images into complete pneumonia, COVID-19 and non COVID-19. In order to recognize and classify COVID-19 pneumonia from chest radiographs, Ragab et al. [39] proposed an Intelligent Firefly Algorithm Deep Transfer Learning Based COVID-19 Monitoring System (IFFA-DTLMS) model, in which DenseNet121 is used to generate feature vector sets. The automatic encoder short- and long-term memory (AE-LSTM) model is used for COVID19 classification and recognition.
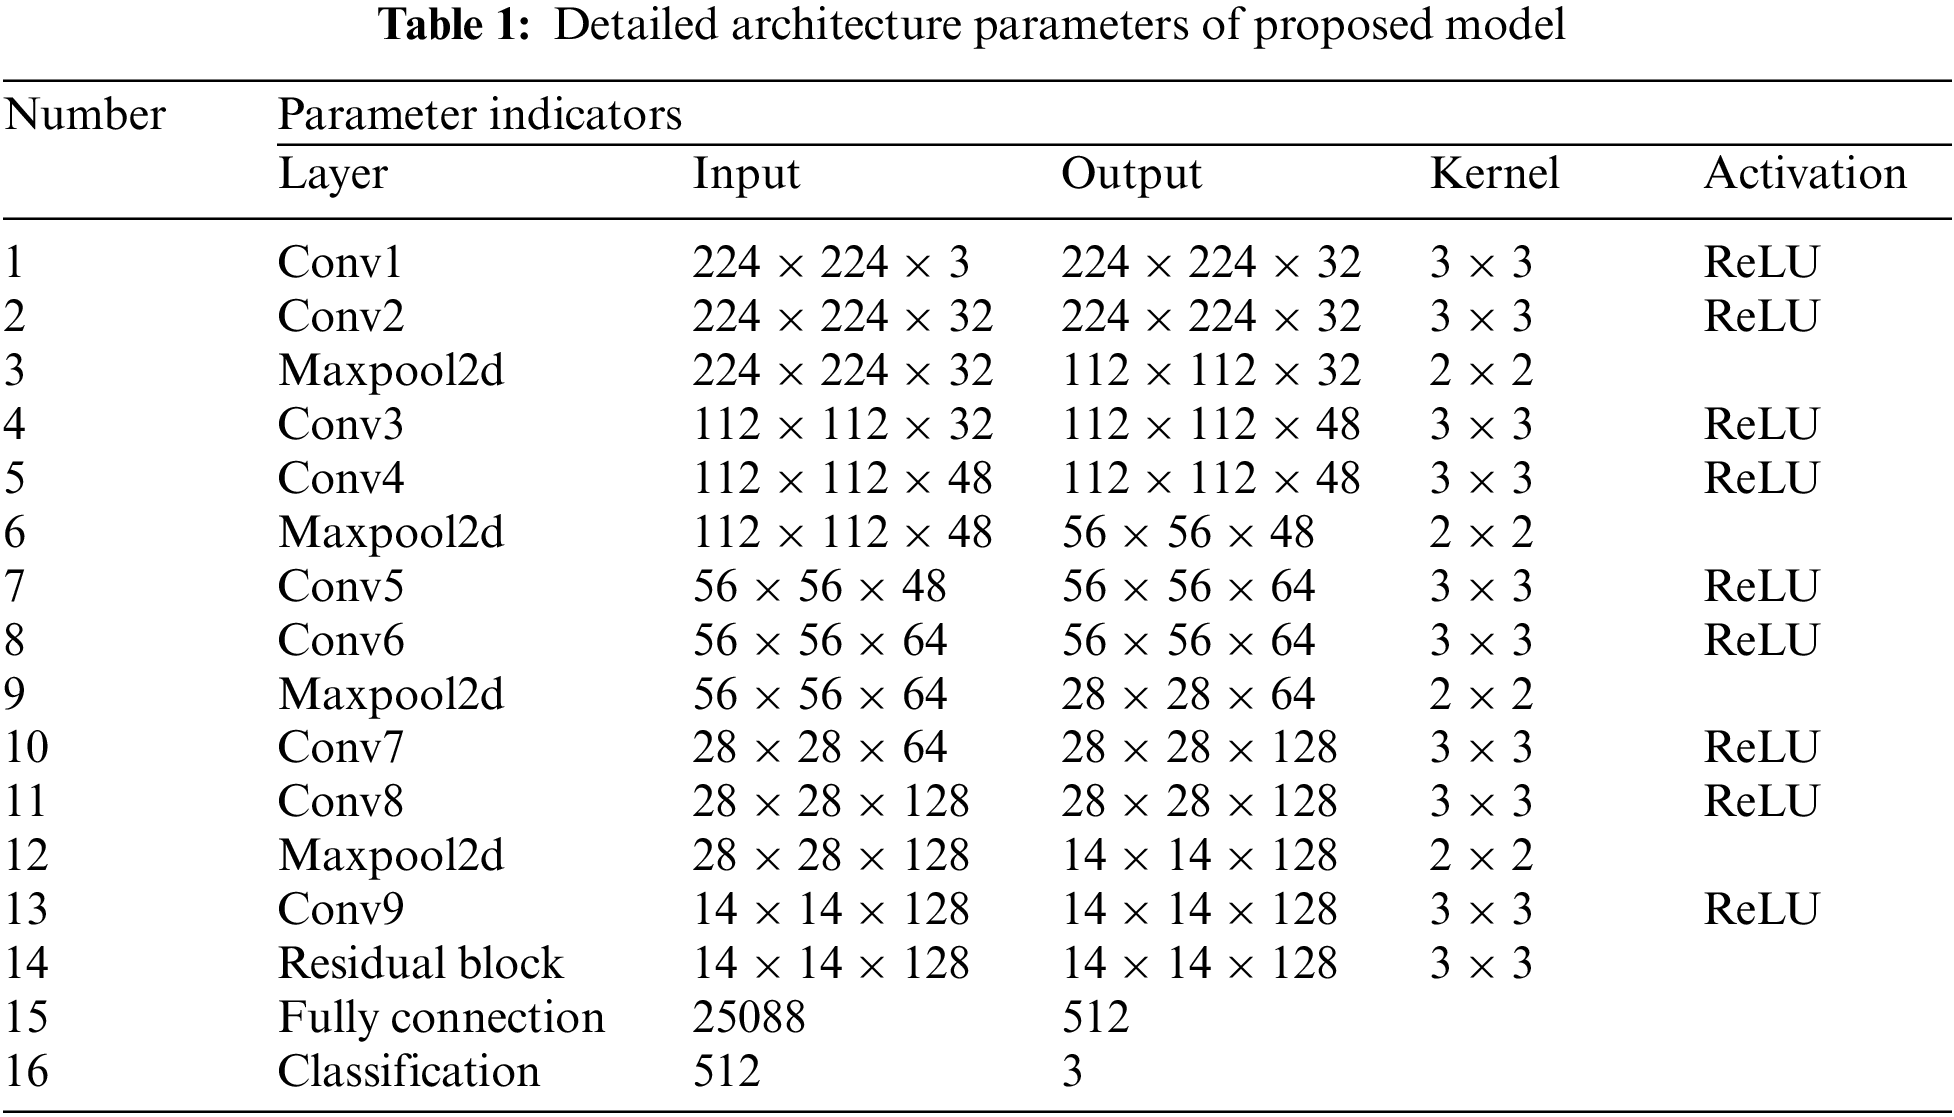
The original U-Net model has excellent target feature detection capability, but it also has many parameters, which need a lot of space to save and run. Considering a model deployed to the mobile terminal can detect COVID-19 pneumonia infection more conveniently, lightweight or less-weight parameters are the premises for the model to be deployed to the mobile terminal. To this end, this work modifies the original U-Net model by fusing residual learning into the convolutional neural networks (CNN) to satisfy the classification tasks of COVID-19 detection. The entire architecture of the proposed model is shown in Fig. 1, and its specific parameters are shown in Table 1.
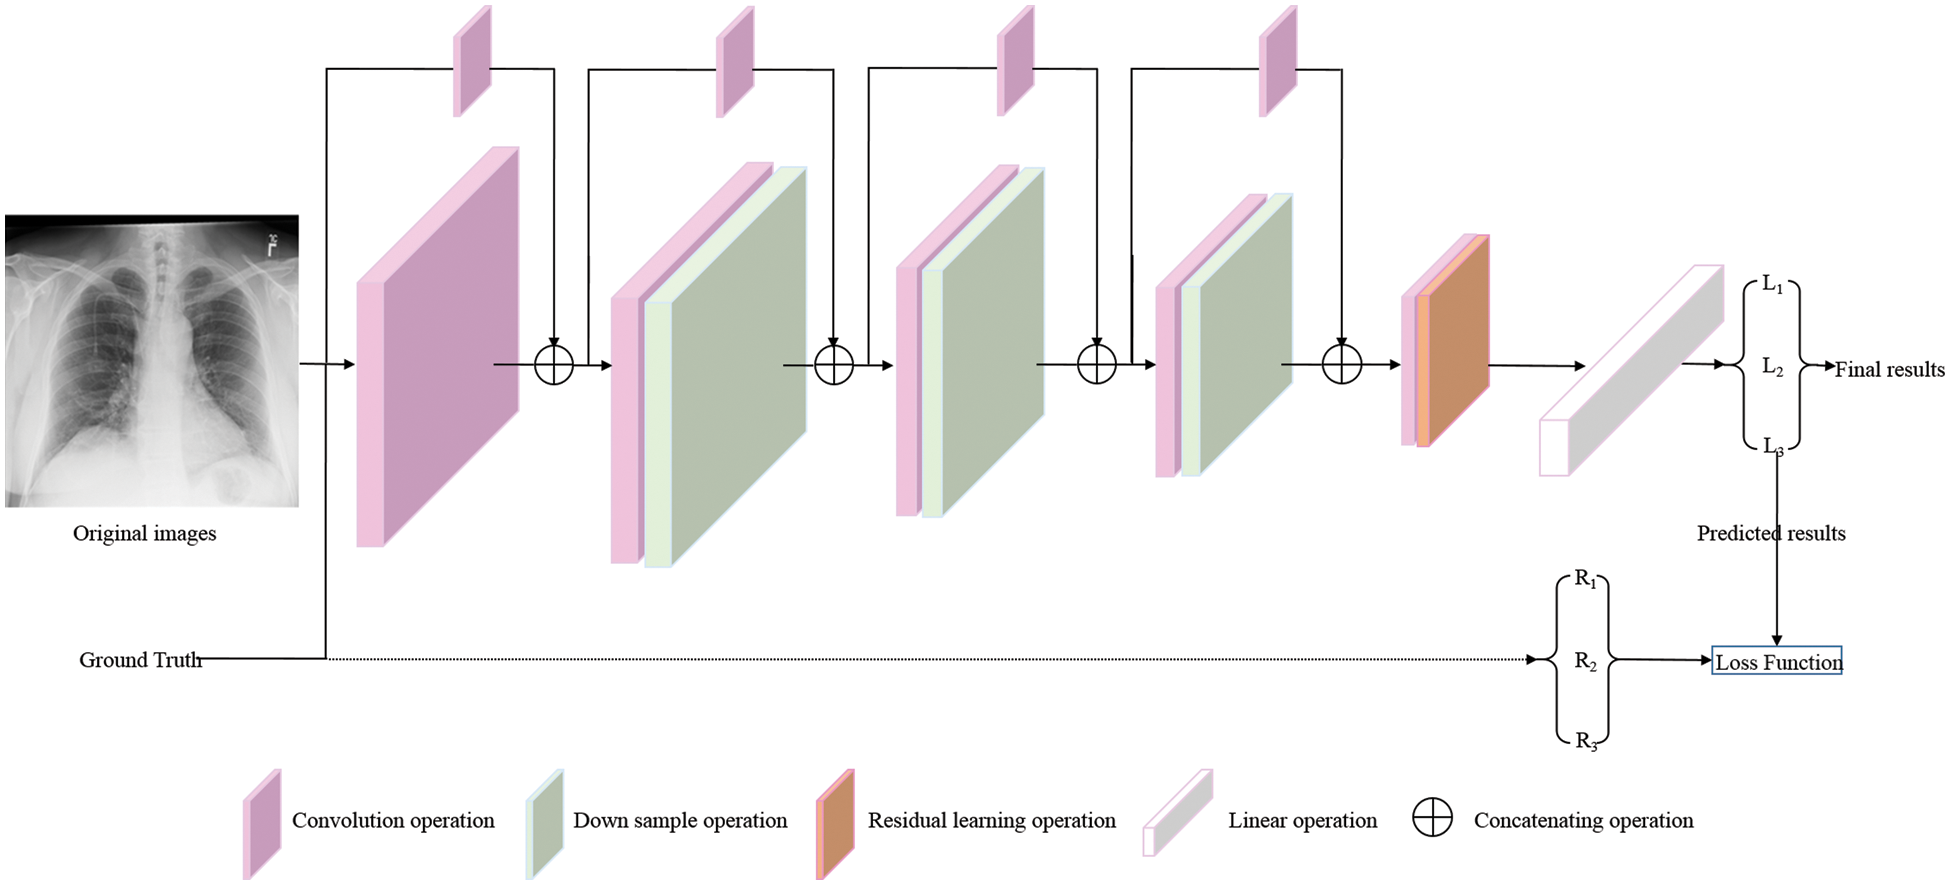
Figure 1: The overview architecture of proposed model. The original images and corresponding ground truths are both input into the proposed model. L1, L2, and L3 are the predicted results, which are directly calculated with the corresponding ground truths (R1, R2, and R3) by Loss Function to mediate the deviation between the prediction results and ground truths (⇢, as shown by the dotted line in the figure). Then, the weight parameters of the proposed model are guided and adjusted by back propagation (BP) algorithm to make the prediction results closer to the real results. At this moment, the predicted results are named final results
3.2 Encoder Network for COVID-19 Feature Extraction
When a CXR image x with shape of
Resource-constrained mobile terminal platform puts forward hard requirements for the parameters of the running program, which makes us take some measures to balance the accuracy and weight parameters of the running program when detecting infection patients. As shown in Fig. 3b, information supplement is given for the convolution feature content to generate the final results
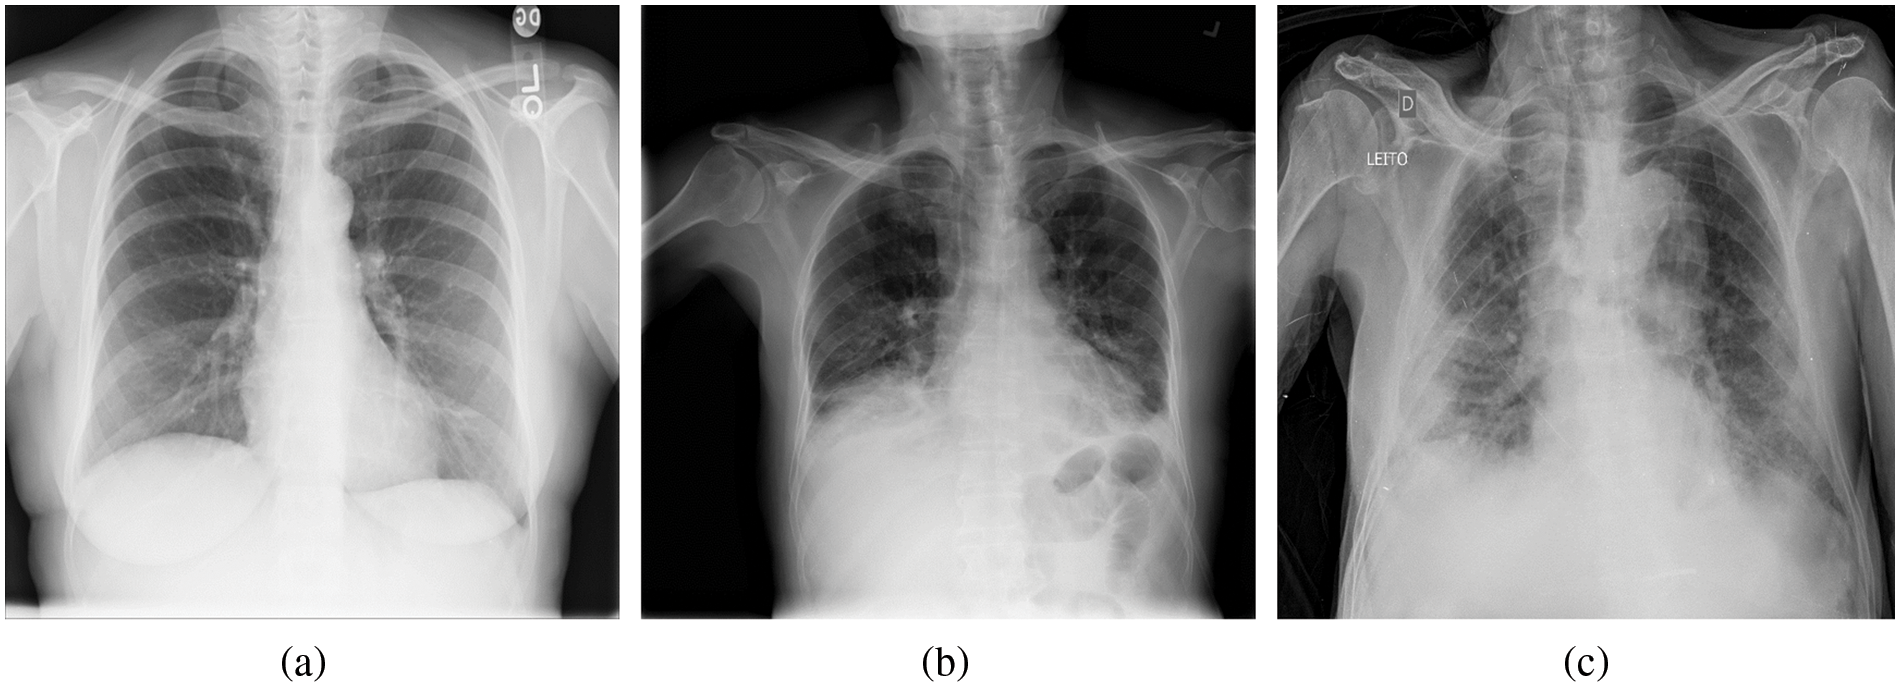
Figure 2: Example of chest X-ray (CXR) images in the COVIDx dataset. (a) Normal or no pneumonia finding, (b) pneumonia infection, (c) COVID-19 viral infection
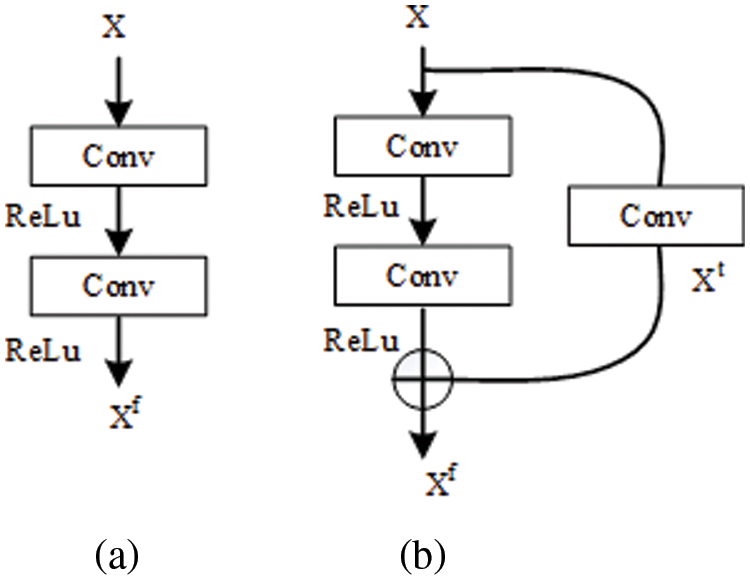
Figure 3: The internal structure of different convolutional operations
Subsequently, the convolutional operations in our proposed model, including conv5, conv6, conv7, and conv8, are repeatedly performed to control the increase of model parameters and ensure the acquisition of effective feature information on COVID-19 pneumonia. Until conv9, the number of feature maps is increased again to obtain high-level semantic feature information on COVID-19 pneumonia contained in the CXR images (channels are from 64 to 128).
The standard convolutional operations make sure the speed of proposed model. However, stacking convolutional operations easily lead to gradient problems (gradient disappearance or explosion), which decrease the performance of a model [40,41]. This is the second problem that must be considered and solved to achieve the goal. To overcome this problem, the residual module (shown in Fig. 4) is introduced into mitigate the adverse results caused by the gradient problem. The whole process of residual learning can be represented as the following:
where H(x) is the desired underlying mapping function that can accurately represent the effective feature information on COVID-19 pneumonia in the CXR images. In reality, H(x) is an unreferenced mapping that is very difficult to optimize [40]. However, its other format (F(x) + x) is relatively easy to learn and optimize for feature information on COVID-19 pneumonia. This confirms the fact stated in the original literature [40]: residual learning can make the depth network obtain better detection results under the same conditions.
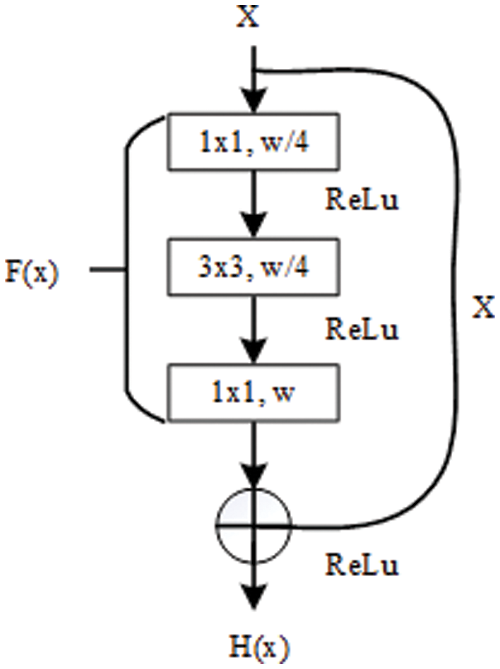
Figure 4: The internal structure of residual block [40]
When designing the proposed model for COVID-19 detection, on the one hand, the paper utilizes residual design to provide information supplement for the possible lost features in the process of convolution operation at each layer, and on the other hand, the paper deploys a residual module at the in-depth neural network layer to alleviate the gradient problem that may occur.
3.3 Classification Network for COVID-19 Detection
To compare with the existing work, the feature maps extracted by the encoder network are fed into the fully connection layer and classification layer. Fully connection (step 15 in Table 1) folds the data dimension from shape B × C × H × W (B means the batch size) to B × K (K = 512), then, the shape with B × K evolves into B × M by the operation at the classification layer. To complete multi-class classification task and compare with the existing models, M is also set to three (normal, non-COVID-19 infection, and COVID-19 pneumonia infection) in this work.
The COVIDx dataset is an open source benchmark dataset and generated by the images that are from different data repositories, as shown in Fig. 5. The COVIDx dataset includes 13,975 CXR images collected from 13,870 patient cases. Especially, The COVIDx dataset comprises a large number of COVID-19 positive patient cases.
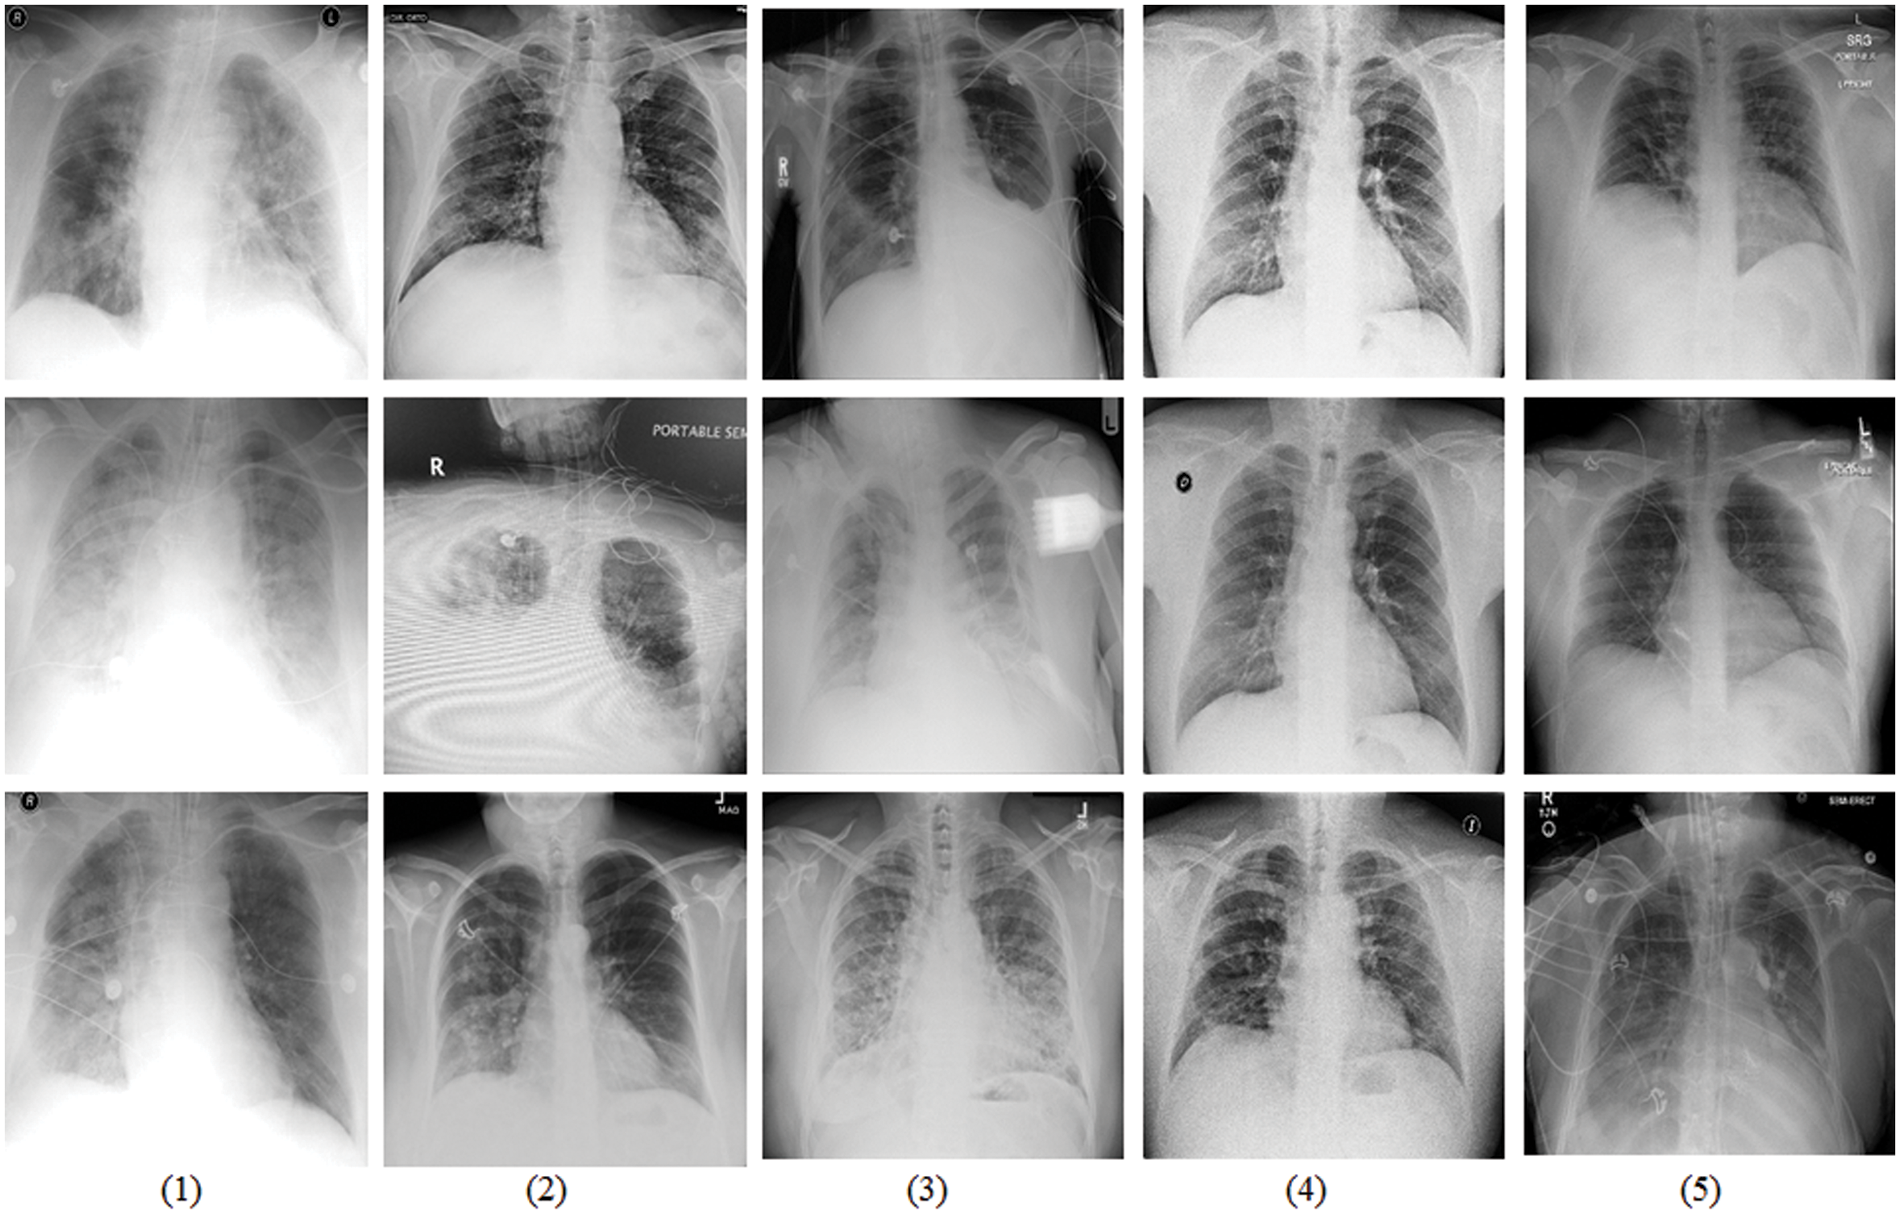
Figure 5: Sample data display from the COVIDx dataset that is tailed from different data repositories [42]. (1) COVID-19 Images collected by [43], (2) COVID-19 Chest X-Ray images from the link [44], (3) The images are from RSNA Pneumonia Detection challenge dataset [45], (4) Providing by ActualMed COVID-19 CXR Dataset [46], and (5) The images are from COVID-19 radiography repositories [47]
All the images of the COVIDx dataset are classified three classifications: normal, non-COVID-19 pneumonia, and COVID-19 viral infection. In detailed, Non-COVID-19 pneumonia patient cases are mainly from the COVID-19 Image Data Collection. The COVID-19 pneumonia cases are from five different data repositories. There are many advantages to use CXR images to study the COVID-19 pneumonia to assist diagnosis and treatment:
(I) The CXR images are cheap and have a wide range of users (hospitals or clinics). The CXR imaging can rapidly classify patients suspected of COVID-19 patients while virus detection, so as to help and alleviate a large number of patients in some areas, especially in the most severely affected remote or economically underdeveloped areas with insufficient capacity.
(II) Because of its low price, CXR images are easy to collect from hospitals or clinics. This makes it possible to gather the latest patient data in time, which is conducive to providing the latest data source for rapid research of COVID-19, thus facilitating the development of new models, and is of great significance for the prevention and treatment of COVID-19 patients.
In the real world, data is usually incomplete, and it is vulnerable to noise (errors, outliers, or other non-target elements), such as CXR images in the COVIDx dataset. Therefore, preprocessing is often performed to remove irrelevant noise data. In this paper, the preprocessing for CXR images is shown in Fig. 6. As can be seen, there are at least three steps to be done before inputting the CXR images into the proposed model: crop operations, converting data types, and normalization.
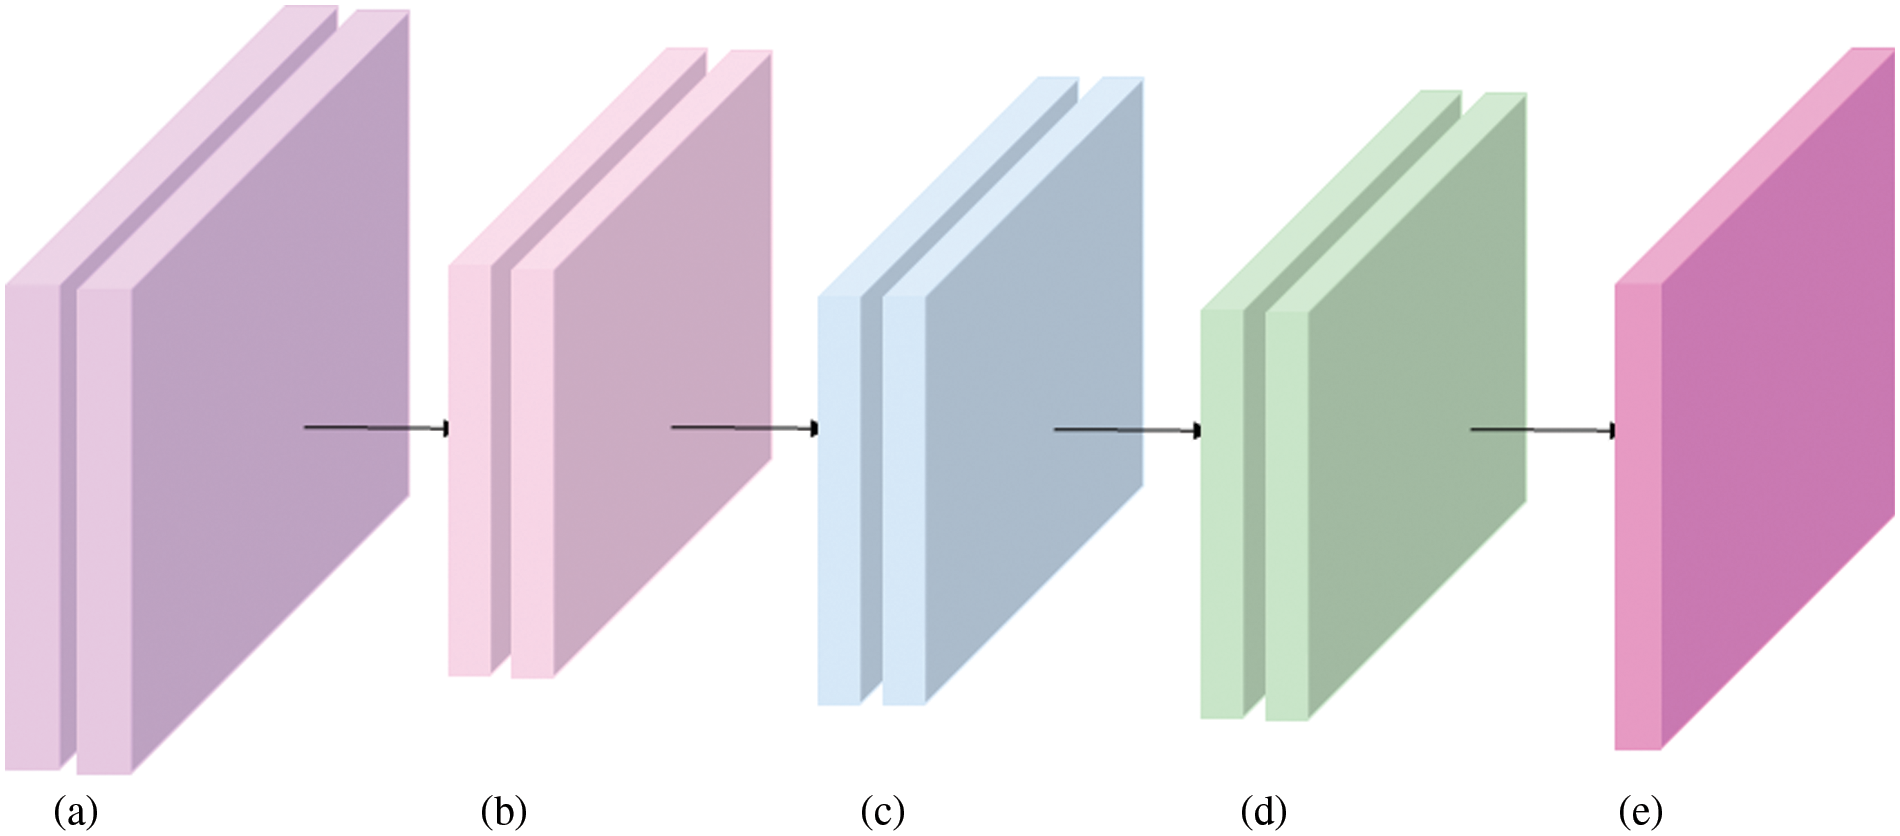
Figure 6: Overview of data augmentation. (a) Original CXR images from the COVIDx dataset. (b) Size clipping, such resize or crop operations. (c) Converting data type into Tensor to calculate on GPU platform. (d) Normalization. (e) Proposed model
To save computing resources and speed up model inference speed, size reduction (shown in Fig. 6b) for the original images is often performed before they are input into a model (the proposed model in this paper). Subsequently, in order to facilitate data operations on the GPU platform, data on the CPU needs to be converted to tensor type. Then, normalization controls the data scale within a reasonable range, mainly to make the gradient near 0.5, not too close to 0 (gradient disappearance), no more than 1 (gradient explosion).
In this work, when a CXR image is from the COVID-19 viral infection, and our model predicts the value 2 (the value 0 means normal, 1 means non-COVID-19 infection, and 2 points to the COVID-19 viral infection), this situation is true positive (TP). But, when the prediction value of the proposed model is 0 or 1, this situation is false negative (FN). If an image is from the normal finding or non-COVID-19 infection, and the prediction value of the proposed model is 2, the situation is false positive (FP). Other cases are true negative (TN). Therefore, the Accuracy can reflect the performance of a model as a whole, while Positive Predictive Value (PPV) represents the proportion of the predicted real results in all predicted COVID-19 infection cases, and Sensitivity means the proportion of the predicted real results in all real COVID-19 infection cases.
The proposed model is implemented using Python 3.7 on the PyTorch framework, and NVIDIA Driver is based on CUDA 11 on an Ubuntu platform with an Intel Core i7 CPU, 64 GB of RAM, and one NVIDIA RTX3090 24 GB GPU. Stochastic gradient descent (SGD) [48] is used as an optimizer to train our model and optimize the gap between the predicted results and corresponding ground truths. When training a model on the COVIDx dataset, this study chooses such a learning rate policy that decreases the current learning rate value based on its previous value in each period. The initial value of learning rate is 0.01, the batch size is 12, and epoch is set 100.
The weight cross-entropy loss function is used to train the proposed model by adjusting the gap between the predicted value and the actual value, its definition can be represented as the following:
where x is the predicted value, y is the corresponding ground truth. N is the number of mini-batch (each mini-batch is a k-dimensional case with d1,..., dk dimension), n means the subscript of each pixel. For COVID-19 detection in this paper, this task is multi-class classification problem (marked by the variable C, which is set to 3 in our work). Additionally, due to the unbalanced COVIDx dataset, the weight argument, a one-dimensional tensor, is assigned to each of three classes (normal, non-COVID-19 infection, and COVID-19 pneumonia infection).
To go deep into the performance of the proposed model, the paper designs and test a number of experiments on the COVIDx dataset. Furthermore, the following evaluation metrics that have been adopted by the existing relative works are calculated respectively: accuracy (Formula (2)), sensitivity (Formula (4)), and positive predictive value (PPV) (Formula (3)).
Table 2 shows the accuracy results of different architectures on the COVIDx test dataset. The models of the VGG19 and ResNet-50 are the classical networks, when they were applied to COVID-19 pneumonia, the corresponding detection results were not ideal. The accuracy of the VGG19 model is only 83.0%, and that of the ResNet-50 is 90.6%. However, their weight parameters are relatively large (from 20.37 M of the VGG19 to 24.97 M of the ResNet-50).
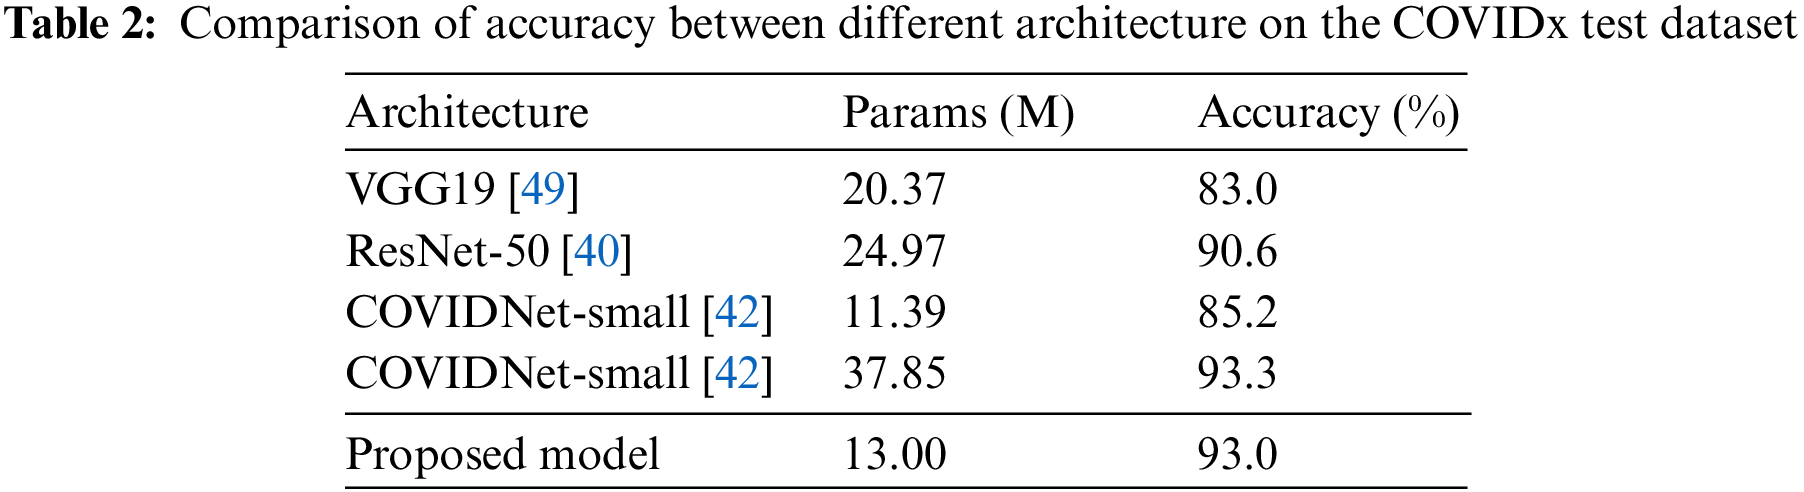
Compared with the COVIDNet-small model, it has the least weight parameters in Table 2, but its accuracy is only 85.2%. And the weight parameters of our model are only 13 M, which is very close to the weight parameters of the COVIDNet-small and is also easier to transplant to mobile terminals. But, the detection accuracy of the proposed model achieves 93.0%, which is almost equal to the one of the COVIDNet-large model (93.3%) that is the highest value in compared models. But, the weight parameters of the COVIDNet-large model reach 37.85 M. Obviously, that is almost three times the value of the proposed model. To make a deeper explanation for the models, this paper studies the evaluation metrics of sensitivity and PPV, as shown in Tables 3 and 4. Table 3 shows that the proposed model has the highest values for non-COVID-19 infection (95.3%) and COVID-19 infection (96.5%). According to the Formula (4), it concludes that the value of TP is high in the predicted results of the proposed model, and the value of FP is low. Taking into the analysis shows that a high TP means many patients with non-COVID-19 and COVID-19 pneumonia are truly predicted by the proposed model. At the same time, a low FP indicates that few patients with normal infection are diagnosed as non-COVID-19 and COVID-19 pneumonia.
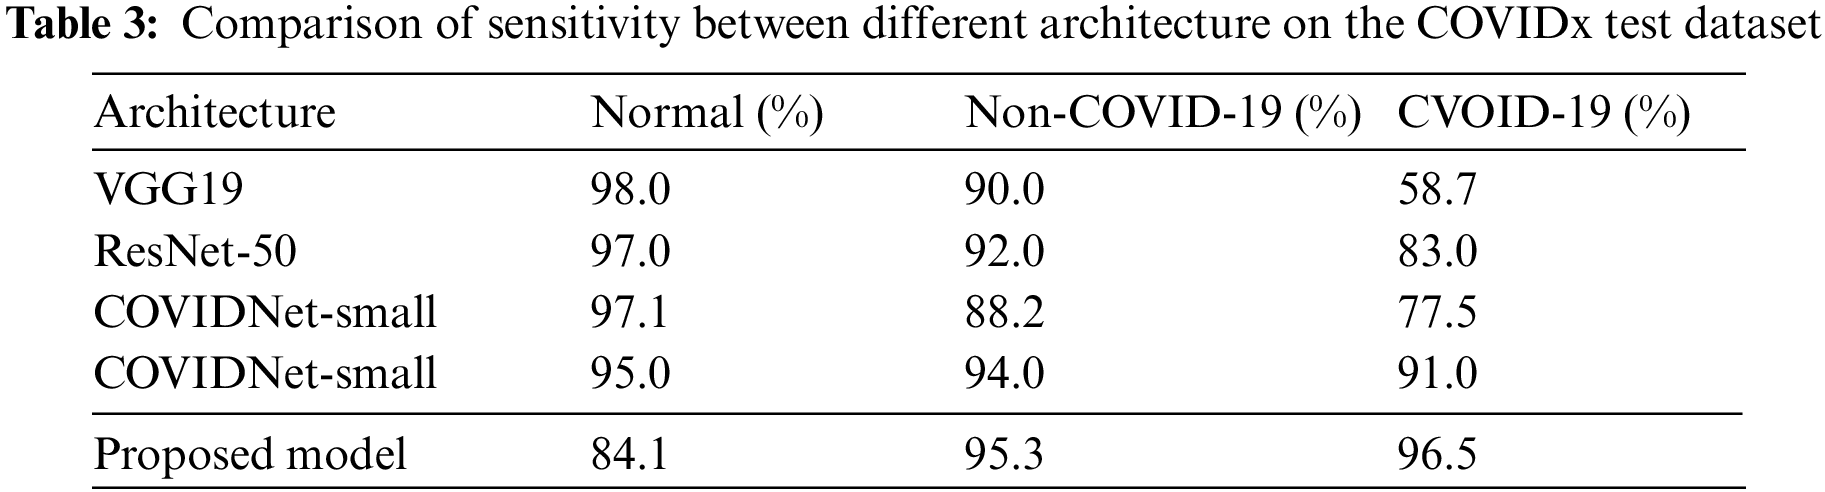
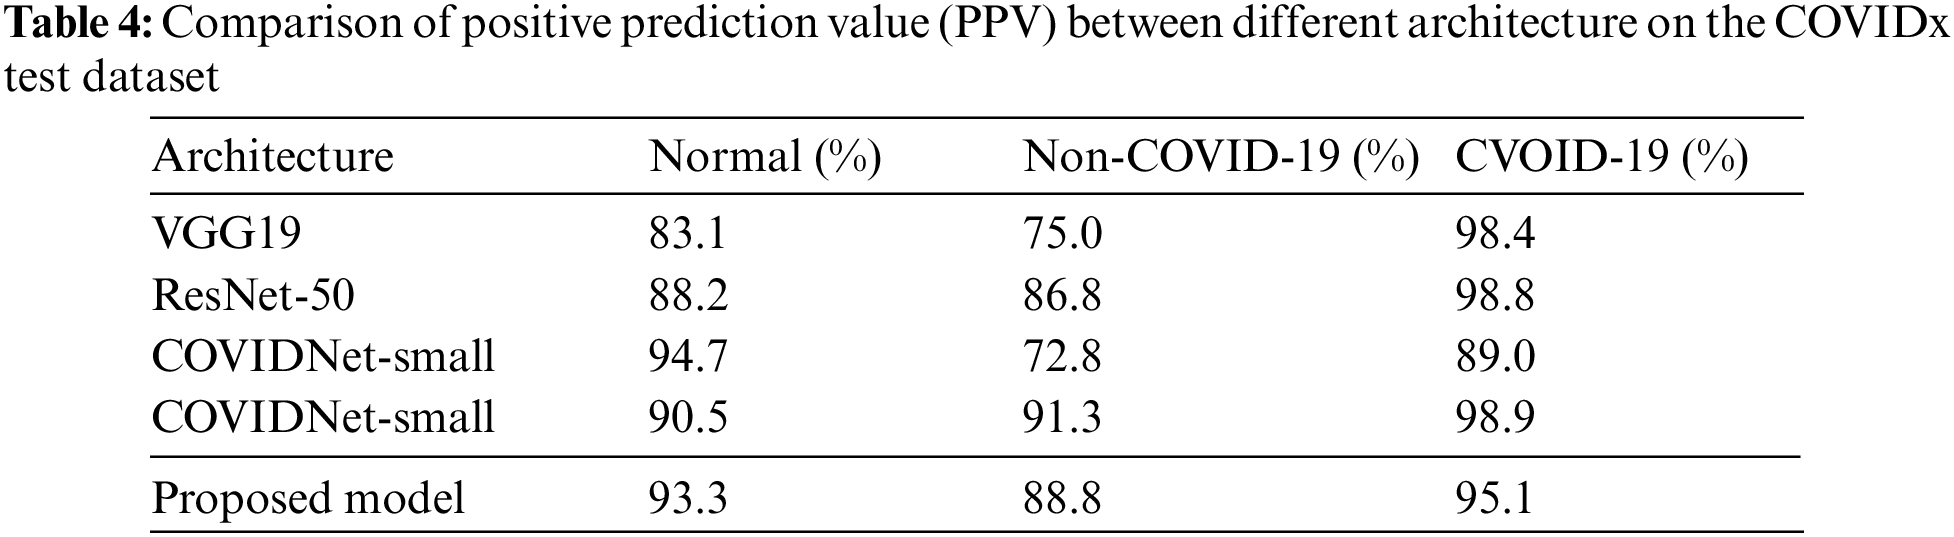
Table 4 shows the PPV values of different models. Compared with other architectures, the normal value of our model achieves 93.3%, which is close to the COVIDNet-small model (it has the highest normal value 94.7%). The non-COVID-19 value of our model is 88.8% that is close to the COVIDNet-large (its value is 91.3%). And, the value of COVID-19 reaches 95.1%. On the whole, all evaluation metrics of the proposed model are relatively balanced, that is, there is little difference between three values (Normal, Non-COVID-19, and COVID-19), and no value is particularly low.
These results from the proposed model verify that our model has the following advantages: (1) balance the accuracy and the weight parameters when detecting COVID-19, because it reaches a high accuracy while keeping a relative low weight parameters. (2) Information supplement and residual learning blocks enhance the learning representation ability of the proposed model to a certain extent, which ensures that our model is not prone to bias towards any party when learning and determining the target category from the CXR images (that is, all evaluation metrics are in a balanced state).
To further prove effectiveness of the proposed model for COVID-19 pneumonia detection, extensive experiments are designed and discussed in this section.
The shortcut connection is proposed to alleviate the problem of gradient disappearance or expansion, or the problem that the model cannot converge when the depth of a model increases [50,51]. The shortcut connection exists between consecutive convolution layers and does not change the data dimension of its input vector. To sum up, shortcut connection is used to maintain the stability of gradient propagation.
After deeply understanding the advantages of shortcut connections, this work wants to fuse them with convolution operation to build a new model for COVID-19 detection, which can not only obtain high detection accuracy, but also avoid too large weight parameters. That means the novel model can better balance the contradiction between accuracy and weight parameters. For the above reason, two problems have attracted our attention: (1) it don’t know which layer needs a shortcut connection; (2) It don’t know a neural network layer needs how many shortcut connections.
Specifically, the contradiction between accuracy and weight parameters requires us to follow the following principles during designing the structure: one shortcut connection in each layer. For the first problem stated before, a large number of experiments are designed and tested in Table 5. Compared with these results, the backbone network with the mark ‡ has a low accuracy, which means stacking standard convolutional operations may cause some problems (information loss, gradient disappearance or explosion).
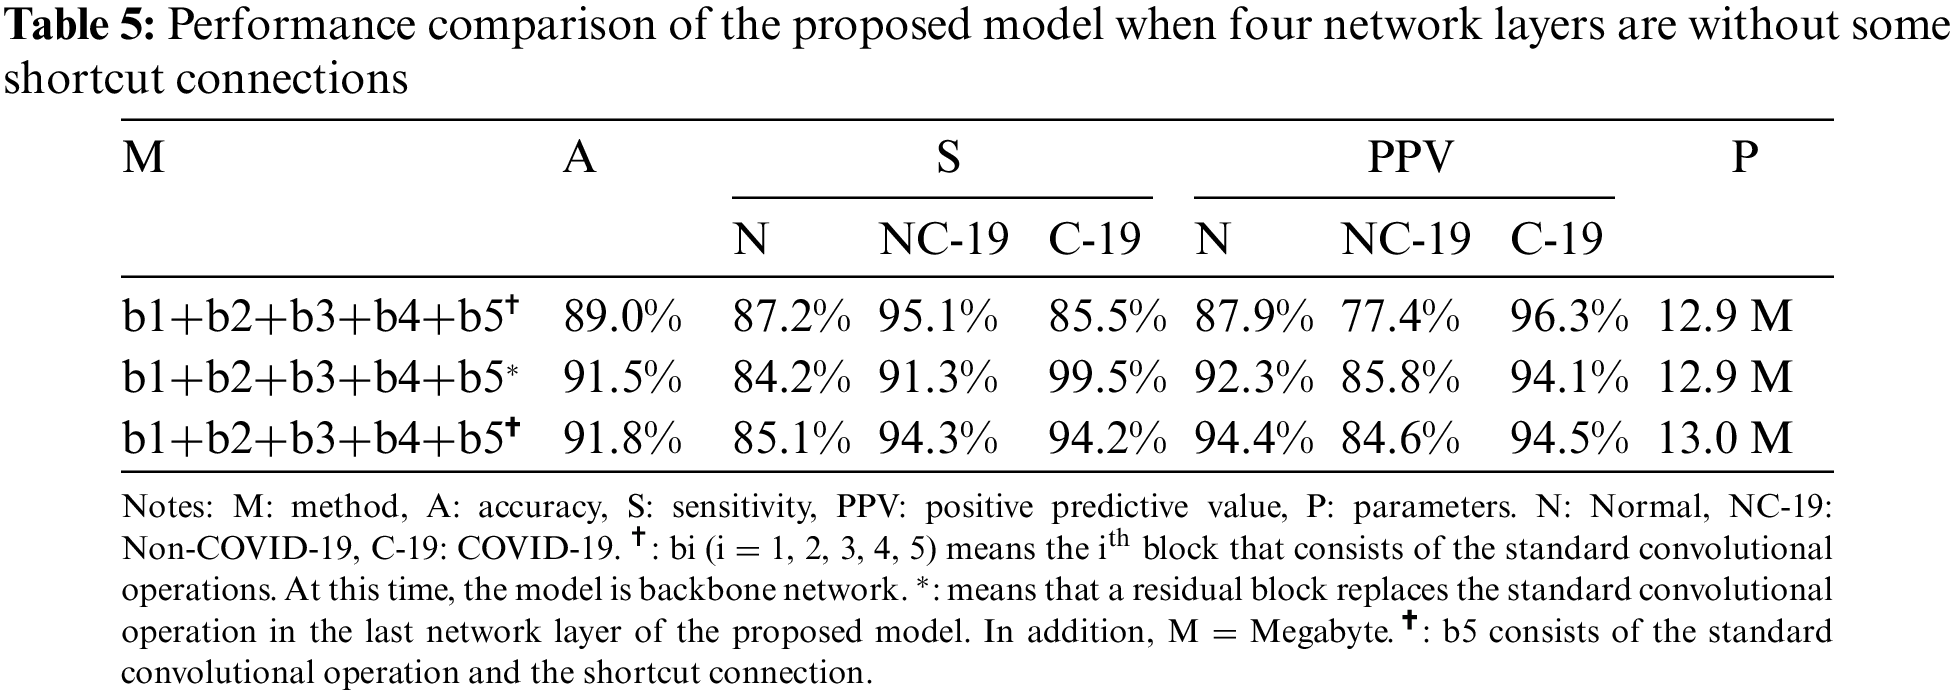
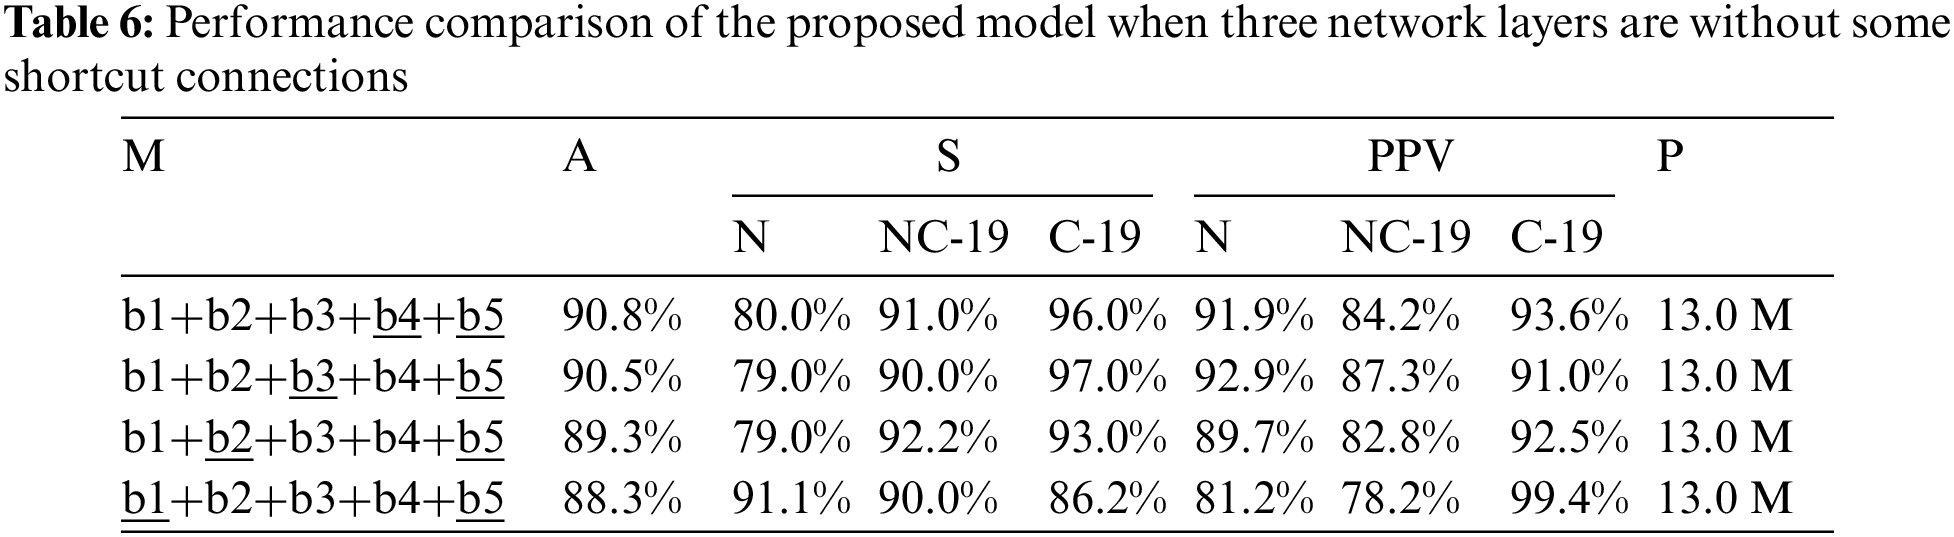
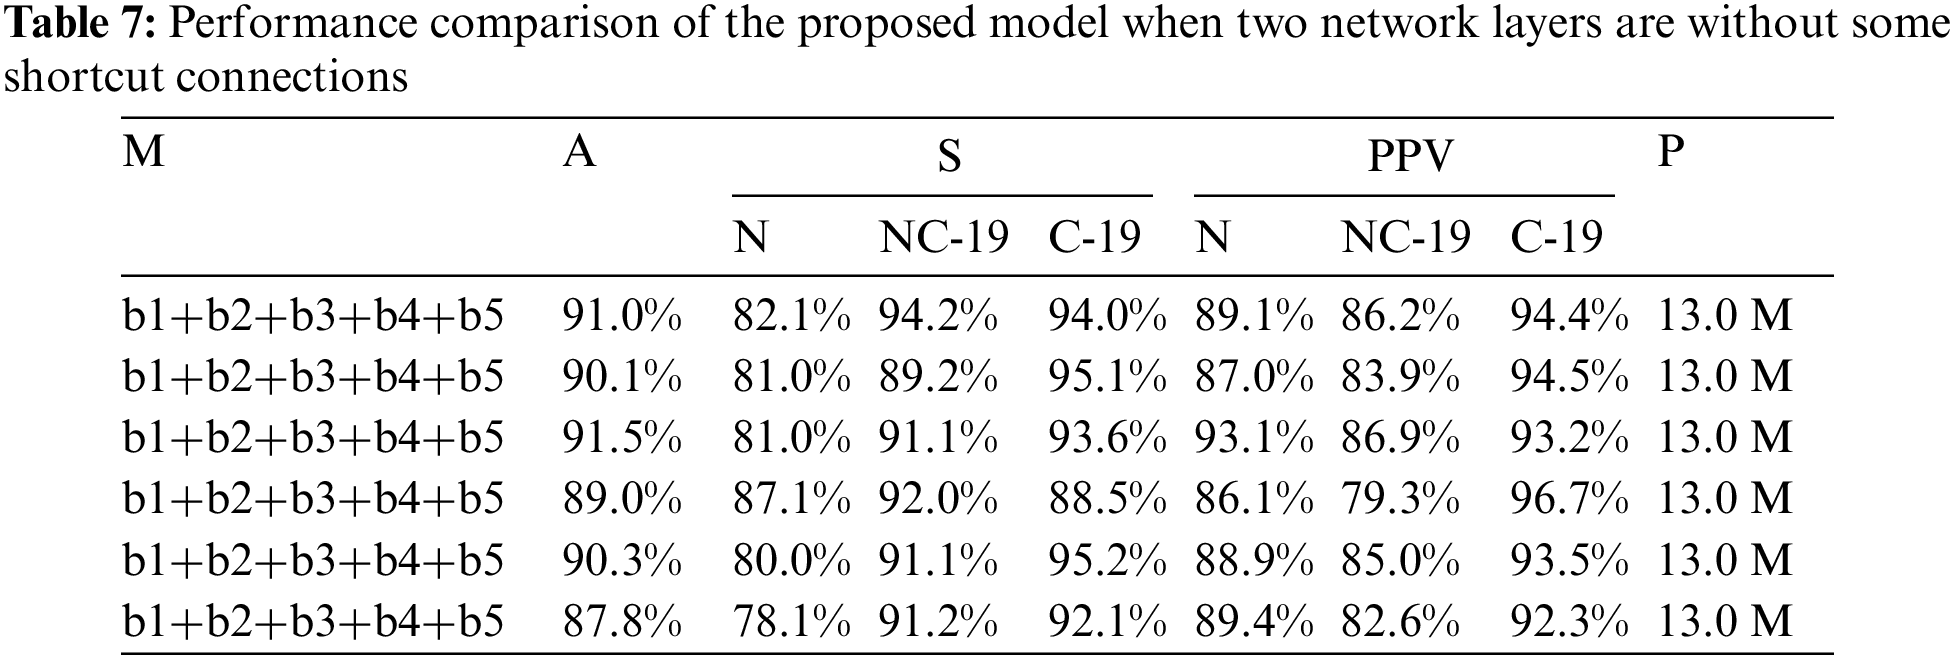
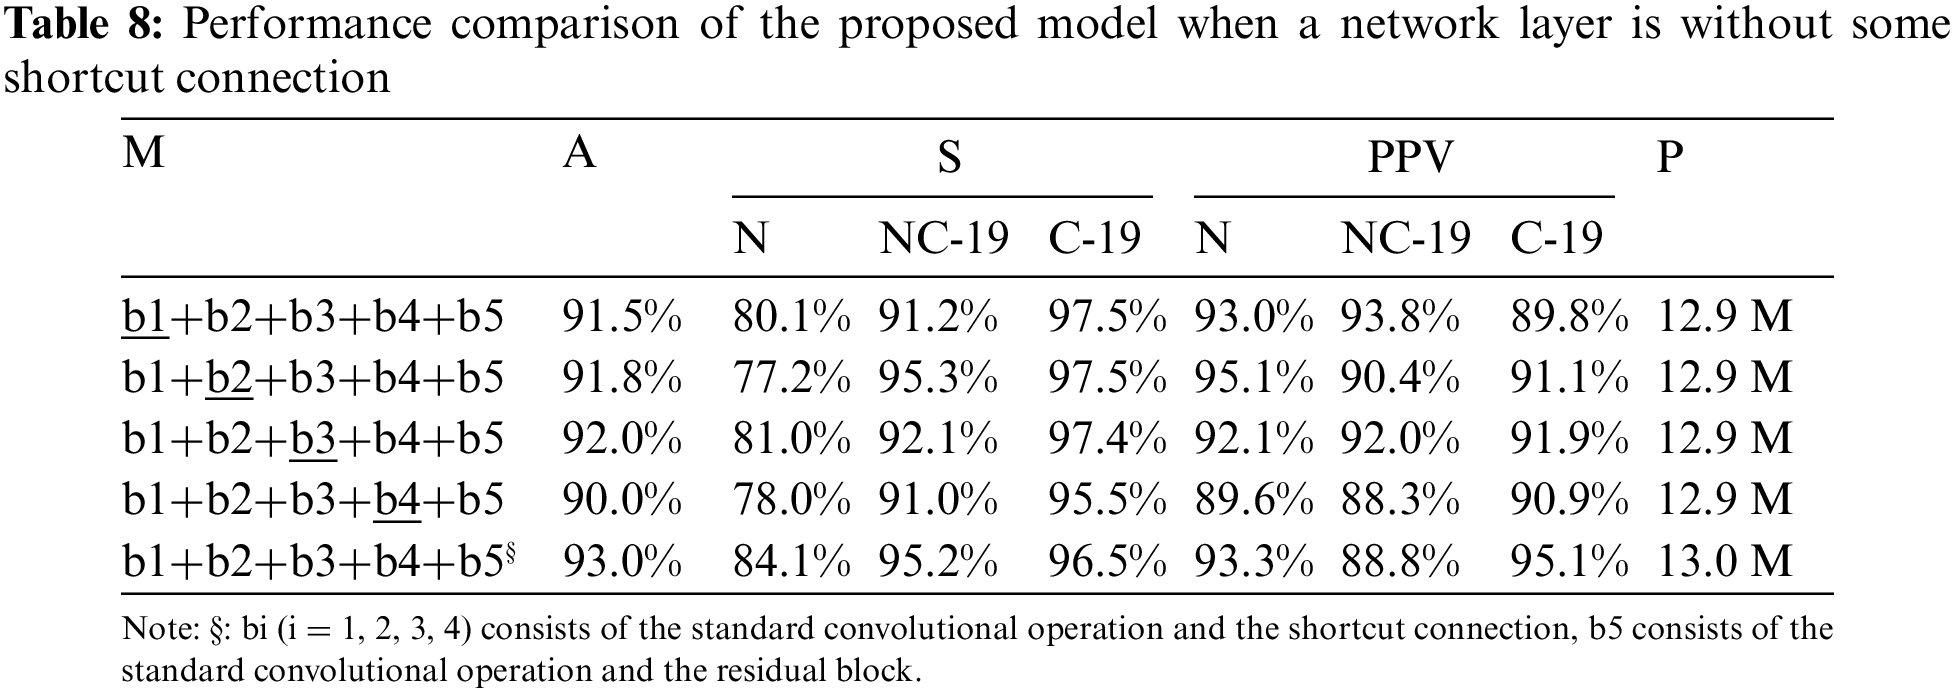
To further discuss the impact of this problem on COVID-19 detection, this study designs a large number of experiments, as shown in Tables 6 and 7. Compared with the results in Tables 6 and 7, the detection accuracy in Table 5 is higher (91.8%) than that of both tables (90.8% and 91.5%). The results confirm that the residual module can help the model extract effective feature information to accurately detect the COVID-19 patients from COVIDX dataset. But, comparing the results in Tables 5 and 8, the proposed model (marked by §) that consists of standard convolutions, shortcut connections and residual blocks achieve the best accuracy (93%). Moreover, comparing with other models, the weight parameters of the proposed model are only increased by 0.1 M (13.0 M vs. 12.9 M).
This paper proposed a novel deep learning-based model for COVID-19 detection. Our model consists of standard convolutions, shortcut connections and residual blocks. Standard convolutions are used to extract feature maps from CXR images by sampling information and increasing the number of channels. Shortcut connections provide supplemental information for the contents generated by some neural network layers of the proposed model. Residual blocks cope with the gradient problem that may be caused by stacking convolutions. Experiments show that our model achieves good detection results while maintaining a small weight parameter.
In the future, the study will optimize our work from the following aspects: (1) continue to improve the detection accuracy of the proposed model for COVID-19; (2) further reduce the weight parameters occupied by the proposed model in order to let our model run on the mobile platform.
Funding Statement: This work was supported in part by the science and technology research project of Henan Provincial Department of science and technology (No. 222102110366), the Science and Technology Innovation Team of Henan University (No. 22IRTSTHN016), the grants from the teaching reform research and practice project of higher education in Henan Province in 2021 [2021SJGLX502].
Conflicts of Interest: The authors declare that they have no conflicts of interest to report regarding the present study.
References
1. A. S. Raamkumar, S. G. Tan and H. L. Wee, “Measuring the outreach efforts of public health authorities and the public response on Facebook during the COVID-19 pandemic in early 2020: Cross-country comparison,” Journal of Medical Internet Research, vol. 22, no. 5, pp. e19334, 2020. [Google Scholar]
2. A. Huang, L. Qiu and Z. Li, “Applying deep learning method in tvp-var model under systematic financial risk monitoring and early warning,” Journal of Computational and Applied Mathematics, vol. 382, no. 3, pp. 113065, 2021. [Google Scholar]
3. M. -A. Galindo-Martín, M. -S. Castano-Martínez and M. -T. Méndez-Picazo, “Effects of the pandemic crisis on entrepreneurship and sustainable development,” Journal of Business Research, vol. 137, pp. 345–353, 2021. [Google Scholar]
4. Y. Ahmad and E. Carey, “Development co-operation during the covid-19 pandemic: An analysis of 2020 figures and 2021 trends to watch,” in Development Co-operation Profiles, OECD Publishing, Paris. 2021. https://doi.org/10.1787/e4b3142a-en [Google Scholar] [CrossRef]
5. P. Basak, T. Abir, A. A. Mamun, N. R. Zainol, M. Khanam et al., “A global study on the correlates of Gross Domestic Product (GDP) and COVID-19 vaccine distribution,” Vaccines, vol. 10, no. 2, pp. 266, 2022. [Google Scholar] [PubMed]
6. A. A. Awosusi, M. N. Mata, Z. Ahmed, M. N. Coelho, M. Altuntaş et al., “How do renewable energy, economic growth and natural resources rent affect environmental sustainability in a globalized economy? Evidence from Colombia based on the gradual shift causality approach,” Frontiers in Energy Research, vol. 9, pp. 905, 2022. [Google Scholar]
7. J. Fang, A. Collins and S. Yao, “On the global covid-19 pandemic and china’s fdi,” Journal of Asian Economics, vol. 74, no. 5, pp. 101300, 2021. [Google Scholar] [PubMed]
8. X. Ren, Y. Li, X. Yang, Z. Li, J. Cui et al., “Evidence for pre-symptomatic transmission of coronavirus disease 2019 (covid-19) in china,” Influenza and Other Respiratory Viruses, vol. 15, no. 1, pp. 19–26, 2021. [Google Scholar] [PubMed]
9. R. K. Farooq, S. U. Rehman, M. Ashiq, N. Siddique and S. Ahmad, “Bibliometric analysis of coronavirus disease (covid-19) literature published in web of science 2019–2020,” Journal of Family & Community Medicine, vol. 28, no. 1, pp. 1, 2021. [Google Scholar]
10. M. Bellon, C. Schweblin, N. Lambeng, P. Cherpillod, J. Vazquez et al., “Cerebrospinal fluid features in severe acute respiratory syndrome coronavirus 2 (sars-cov-2) reverse transcription polymerase chain reaction (rt-pcr) positive patients,” Clinical Infectious Diseases, vol. 73, no. 9, pp. e3102–e3105, 2021. [Google Scholar] [PubMed]
11. M. Singh, S. Bansal, R. Kumar Dubey and B. K. Panigrahi, “Multiobjective genetic algorithm based deep learning model for automated covid-19 detection using medical image data,” Journal of Medical and Biological Engineering, vol. 41, no. 5, pp. 1–12, 2021. https://www.microsoft.com/en-us/research/publication/multi-objective-genetic-algorithm-for-automated-covid-19-detection/ [Google Scholar]
12. S. Nazarian, B. Glover, H. Ashrafian, A. Darzi, J. Teare et al., “Diagnostic accuracy of artificial intelligence and computer-aided diagnosis for the detection and characterization of colorectal polyps: Systematic review and meta-analysis,” Journal of Medical Internet Research, vol. 23, no. 7, pp. e27370, 2021. [Google Scholar] [PubMed]
13. D. A. Zebari, D. A. Ibrahim, D. Q. Zeebaree, H. Haron, M. S. Salih et al., “Systematic review of computing approaches for breast cancer detection based computer aided diagnosis using mammogram images,” Applied Artificial Intelligence, vol. 35, no. 15, pp. 2157–2203, 2021. [Google Scholar]
14. S. Asgari Taghanaki, K. Abhishek, J. P. Cohen, J. Cohen-Adad and G. Hamarneh, “Deep semantic segmentation of natural and medical images: A review,” Artificial Intelligence Review, vol. 54, no. 1, pp. 137–178, 2021. [Google Scholar]
15. Z. Tang, W. Zhao, X. Xie, Z. Zhong, F. Shi et al., “Severity assessment of COVID-19 using CT image features and laboratory indices,” Physics in Medicine & Biology, vol. 66, no. 3, pp. 035015, 2021. [Google Scholar]
16. S. K. Yadav, K. Tiwari, H. M. Pandey and S. A. Akbar, “A review of multimodal human activity recognition with special emphasis on classification, applications, challenges and future directions,” Knowledge-Based Systems, vol. 223, no. 8, pp. 106970, 2021. [Google Scholar]
17. F. N. Al-Wesabi, S. Alzahrani, F. Alyarimi, M. Abdul, N. Nemri et al., “A reliable NLP scheme for english text watermarking based on contents interrelationship,” Computer Systems Science and Engineering, vol. 37, no. 3, pp. 297–311, 2021. [Google Scholar]
18. Y. Gu, J. Chi, J. Liu, L. Yang, B. Zhang et al., “A survey of computer-aided diagnosis of lung nodules from ct scans using deep learning,” Computers in Biology and Medicine, vol. 137, pp. 104806, 2021. [Google Scholar] [PubMed]
19. M. Z. Islam, M. M. Islam and A. Asraf, “A combined deep cnn-lstm network for the detection of novel coronavirus (covid-19) using x-ray images,” Informatics in Medicine Unlocked, vol. 20, pp. 100412, 2020. [Google Scholar] [PubMed]
20. S. Hochreiter and J. Schmidhuber, “Long short-term memory,” Neural Computation, vol. 9, no. 8, pp. 1735–1780, 1997. [Google Scholar] [PubMed]
21. M. Turkoglu, “Covidetectionet: Covid-19 diagnosis system based on x-ray images using features selected from pre-learned deep features ensemble,” Applied Intelligence, vol. 51, no. 3, pp. 1213–1226, 2021. [Google Scholar] [PubMed]
22. A. Krizhevsky, I. Sutskever and G. E. Hinton, “Imagenet classification with deep convolutional neural networks,” Communications of the ACM, vol. 60, no. 6, pp. 84–90, 2017. [Google Scholar]
23. C. Cortes and V. Vapnik, “Support-vector networks,” Machine Learning, vol. 20, no. 3, pp. 273–297, 1995. [Google Scholar]
24. S. Kushwaha, S. Bahl, A. K. Bagha, K. S. Parmar, M. Javaid et al., “Significant applications of machine learning for covid-19 pandemic,” Journal of Industrial Integration and Management, vol. 5, no. 4, pp. 453–479, 2020. [Google Scholar]
25. X. Wang, X. Deng, Q. Fu, Q. Zhou, J. Feng et al., “A weakly-supervised framework for covid-19 classification and lesion localization from chest CT,” IEEE Transactions on Medical Imaging, vol. 39, no. 8, pp. 2615–2625, 2020. [Google Scholar] [PubMed]
26. E. E. -D. Hemdan, M. A. Shouman and M. E. Karar, “Covidx-net: A framework of deep learning classifiers to diagnose covid-19 in x-ray images,” ArXiv preprint arXiv: Arxiv-2003.11055, 2020. [Google Scholar]
27. G. Huang, Z. Liu, L. Van Der Maaten and K. Q. Weinberger, “Densely connected convolutional networks,” in Proc. of the IEEE Conf. on Computer Vision and Pattern Recognition, CVPR 2017, Honolulu, HI, USA, pp. 4700–4708, 2017. [Google Scholar]
28. L. Wang, Z. Yin, M. Puppala, C. F. Ezeana, K. K. Wong et al., “A time-series feature-based recursive classification model to optimize treatment strategies for improving outcomes and resource allocations of covid-19 patients,” IEEE Journal of Biomedical and Health Informatics, vol. 26, no. 7, pp. 3323–3329, 2022. [Google Scholar] [PubMed]
29. R. Aygun, B. Kaya and M. Kaya, “Aspect based twitter sentiment analysis on vaccination and vaccine types in covid-19 pandemic with deep learning,” IEEE Journal of Biomedical and Health Informatics, vol. 26, no. 5, pp. 2360–2369, 2022. [Google Scholar] [PubMed]
30. J. Devlin, M. -W. Chang, K. Lee and K. Toutanova, “Bert: Pre-training of deep bidirectional transformers for language understanding,” ArXiv preprint arXiv:1810.04805, 2018. [Google Scholar]
31. J. Lee, W. Yoon, S. Kim, D. Kim, S. Kim et al., “Biobert: A pre-trained biomedical language representation model for biomedical text mining,” Bioinformatics, vol. 36, no. 4, pp. 1234–1240, 2020. [Google Scholar] [PubMed]
32. K. Huang, J. Altosaar and R. Ranganath, “Clinicalbert: Modeling clinical notes and predicting hospital readmission,” ArXiv preprint arXiv:1904.05342, 2019. [Google Scholar]
33. S. Schweter, “Berturk-bert models for turkish,” Zenodo, 2020. [Online]. Available: https://doi.org/10.5281/zenodo.3770924 [Google Scholar] [CrossRef]
34. O. Frank, N. Schipper, M. Vaturi, G. Soldati, A. Smargiassi et al., “Integrating domain knowledge into deep networks for lung ultrasound with applications to covid-19,” IEEE Transactions on Medical Imaging, vol. 41, no. 3, pp. 571–581, 2022. [Google Scholar] [PubMed]
35. I. Rodrigues, G. L. Santos, D. F. Sadok and P. T. Endo, “Classifying covid-19 positive x-ray using deep learning models,” IEEE Latin America Transactions, vol. 19, no. 6, pp. 884–892, 2021. [Google Scholar]
36. P. Rai, B. K. Kumar, V. K. Deekshit and I. Karunasagar, “Detection technologies and recent developments in the diagnosis of COVID-19 infection,” Applied Microbiology and Biotechnology, vol. 105, no. 2, pp. 441–455, 2021. [Google Scholar] [PubMed]
37. A. A. Khan, M. M. Ali Shahid, R. N. Bashir, S. Iqbal, A. S. Ahmad Shahid et al., “Detection of omicron caused pneumonia from radiology images using convolution neural network (cnn),” Computers, Materials & Continua, vol. 74, no. 2, pp. 3743–3761, 2023. [Google Scholar]
38. S. Kushwaha, S. Bahl, A. K. Bagha, K. S. Parmar, M. Javaid et al., “Significant applications of machine learning for COVID-19 pandemic,” Journal of Industrial Integration and Management, vol. 5, no. 4, pp. 453–479, 2020. [Google Scholar]
39. M. Ragab, M. W. Al-Rabia, S. S. Binyamin and A. A. Aldarmahi, “Intelligent firefly algorithm deep transfer learning based covid-19 monitoring system,” Computers, Materials & Continua, vol. 74, no. 2, pp. 2889–2903, 2023. [Google Scholar]
40. K. He, X. Zhang, S. Ren and J. Sun, “Deep residual learning for image recognition,” in CVPR, pp. 770–778, 2016. [Google Scholar]
41. S. Hochreiter, “The vanishing gradient problem during learning recurrent neural nets and problem solutions,” International Journal of Uncertainty, Fuzziness and Knowledge-Based Systems, vol. 6, no. 2, pp. 107–116, 1998. [Google Scholar]
42. F. Shi, J. Wang, J. Shi, Z. Wu, Q. Wang et al., “Review of artificial intelligence techniques in imaging data acquisition, segmentation, and diagnosis for COVID-19,” IEEE Reviews in Biomedical Engineering, vol. 14, pp. 4–15, 2020. [Google Scholar]
43. J. P. Cohen, P. Morrison and L. Dao, “Covid-19 image data collection,” ArXiv preprint arXiv: Arxiv-2003.11597, 2020. [Google Scholar]
44. L. Wang, Q. L. Zhong and A. Wong, “Covid-net: A tailored deep convolutional neural network design for detection of covid-19 cases from chest x-ray images,” Scientific Reports, vol. 10, no. 1, pp. 1–12, 2020. [Google Scholar]
45. I. Pan, A. Cadrin-Chênevert and P. M. Cheng, “Tackling the radiological society of North America pneumonia detection challenge,” American Journal of Roentgenology, vol. 213, no. 3, pp. 568–574, 2019. [Google Scholar] [PubMed]
46. A. Chung, “Actualmed covid-19 chest x-ray data initiative,” 2020. [Online]. Available: https://github.com/agchung/Actualmed-COVID-chestxray-dataset(2020) [Google Scholar]
47. North America, “R. s. covid-19 radiography database,” 2019. [Online]. Available: https://www.kaggle.com/tawsifurrahman/covid19-radiography-database(2019) [Google Scholar]
48. L. Bottou, “Large-scale machine learning with stochastic gradient descent,” in COMPSTAT, NEC Labs America, Princeton NJ 08542, USA, pp. 177–186, 2010. [Google Scholar]
49. K. Simonyan and A. Zisserman, “Very deep convolutional networks for large-scale image recognition,” in Y. Bengio and Y. LeCun (Eds.3rd Int. Conf. on Learning Representations, ICLR 2015, San Diego, CA, USA, May 7–9, 2015, Conference Track Proceedings, 2015, http://arxiv.org/abs/1409.1556 [Google Scholar]
50. K. He, X. Zhang, S. Ren and J. Sun, “Identity mappings in deep residual networks,” in European Conf. on Computer Vision, Springer, ECCV 2016, Amsterdam, The Netherlands, pp. 630–645, 2016, First Online: 17 September 2016. [Google Scholar]
51. R. K. Srivastava, K. Greff and J. Schmidhuber, “Training very deep networks,” In: Advances in Neural Information Processing Systems, vol. 28, Montreal, Quebec, Canada, 2015. [Google Scholar]
Cite This Article
 Copyright © 2023 The Author(s). Published by Tech Science Press.
This work is licensed under a Creative Commons Attribution 4.0 International License , which permits unrestricted use, distribution, and reproduction in any medium, provided the original work is properly cited.
 Downloads
 Citation Tools