
 Submit a Paper
 Propose a Special lssue
 Open Access
ARTICLE

Data Augmentation Using Contour Image for Convolutional Neural Network
1 Department of Computer Engineering, Anyang University, Anyang-si, 14058, Korea
2 Department of ICT Convergence Engineering, Anyang University, Anyang-si, 14058, Korea
* Corresponding Author: Jeong-Joon Kim. Email:
Computers, Materials & Continua 2023, 75(3), 4669-4680. https://doi.org/10.32604/cmc.2023.031129
Received 11 April 2022; Accepted 12 June 2022; Issue published 29 April 2023
 View Full Text
 Download PDF
Abstract
With the development of artificial intelligence-related technologies such as deep learning, various organizations, including the government, are making various efforts to generate and manage big data for use in artificial intelligence. However, it is difficult to acquire big data due to various social problems and restrictions such as personal information leakage. There are many problems in introducing technology in fields that do not have enough training data necessary to apply deep learning technology. Therefore, this study proposes a mixed contour data augmentation technique, which is a data augmentation technique using contour images, to solve a problem caused by a lack of data. ResNet, a famous convolutional neural network (CNN) architecture, and CIFAR-10, a benchmark data set, are used for experimental performance evaluation to prove the superiority of the proposed method. And to prove that high performance improvement can be achieved even with a small training dataset, the ratio of the training dataset was divided into 70%, 50%, and 30% for comparative analysis. As a result of applying the mixed contour data augmentation technique, it was possible to achieve a classification accuracy improvement of up to 4.64% and high accuracy even with a small amount of data set. In addition, it is expected that the mixed contour data augmentation technique can be applied in various fields by proving the excellence of the proposed data augmentation technique using benchmark datasets.Keywords
Recently, as the importance of data has emerged, solutions related to big data are rapidly developing, and research for efficient data management in various fields such as medical care, finance, security, autonomous driving, robot control, and smart factory is being actively conducted [1,2]. And as artificial intelligence (AI) develops, attempts to apply AI technologies using big data are increasing. Deep learning and neural networks were able to make rapid progress while being used in fields related to computer vision. The first CNN introduced applied filtering techniques to improve image processing efficiency [3]. CNNs such as AlexNet [4], VGGNet [5], GoogLeNet [6], and ResNet [7] won the ImageNet Large Scale Visual Recognition Challenge (ILSVRC) [8] with overwhelming performance in image recognition and classification.
Even if models and algorithms that win the ILSVRC mentioned above are used, if the training data is insufficient, overfitting may occur during neural network training, and high accuracy is difficult to expect. In addition, there are many restrictions on data collection and storage for reasons such as security issues and personal information leakage in various fields, so it is difficult to secure data. Therefore, enough data to prevent the model from overfitting is essential for artificial intelligence-related technologies such as deep learning to achieve high performance, and to solve this problem, various benchmark datasets that can be used for image recognition and classification research are provided. Benchmark datasets commonly used in image recognition and classification research include Modified dataset from National Institute of Standards and Technology (MNIST) datasets, Canadian Institute For Advanced Research (CIFAR)-10 datasets and CIFAR-100 datasets [9], ImageNet datasets, Pascal VOC [10], and MS COCO [11]. However, despite the efforts and dedication of various research institutes, there are several problems to be solved in order to apply deep learning technology to actual services. In order to be applied to actual services, the characteristics of the target to be recognized and classified must appear well, and images collected in various environments are required. Therefore, studies on data augmentation techniques are being actively conducted to solve various problems that may occur due to such a data shortage [12–16].
Therefore, this paper proposes a mixed contour data augmentation technique that mixes original and contour images or mixes contour images and contour images to solve various problems caused by data shortage, and experimentally proves the excellence of the proposed technique. In this study, transfer learning is used to overcome overfitting and allow the model to converge quickly as an experimental performance evaluation strategy. Utilizing pre-trained CNNs is a method adopted by several existing studies [17–20]. In addition, the CIFAR-10 dataset, a famous benchmark dataset, was used for experimental performance evaluation, and the ResNet model that won the ILSVRC was used. Various cases for experimental performance evaluation will be described in detail in Section 4. The four contribution goals of this paper are summarized as follows.
a. Since the contour image represents the shape of the object, it proves that learning the neural network using the contour image is an important factor in improving performance.
b. We prove that the mixed contour image data augmentation technique proposed in this paper is an important factor in improving performance.
c. It is confirmed that high accuracy can be achieved with a small amount of training dataset by applying the mixed contour data augmentation technique as well as the existing data augmentation technique.
d. Using the benchmark dataset for experimental performance evaluation, it is confirmed that it is a technique that can be applied and utilized in datasets in various fields.
This paper consists of the following. Section 2 describes CNN and various data augmentation techniques. Section 3 describes the dataset used in the experiment. Section 4 describes the mixed contour data augmentation technique proposed in this paper, and Section 5 describes the experimental performance evaluation and analysis results to prove the excellence of the proposed method. Finally, Section 6 concludes the paper and presents future research directions.
2.1 Convolutional Neural Network
CNN, which won the ILSVRC and began to attract the attention of academia, is being actively studied in various fields related to computer vision. CNN includes a convolutional layer for extracting features of the input image and a pooling layer for emphasizing the features of the extracted feature map. The pooling layer reduces the number of parameters to learn, and the amount of computation performed in the network by reducing the dimension of the extracted feature map. And through pooling, the model can respond well to changes in the position of features in the input image. Using the feature map derived in this way, the image is configured to be classified.
AlexNet, a CNN architecture that first appeared in 2012 at ILSVRC, overwhelms other models with an error rate of 16.4% and won. And as the depth of the model emerged as an important factor in improving the performance of CNN, VGGNet appeared. VGGNet is a model developed by the University of Oxford Visual Geometry Group and took second place in the 2014 ILSVRC. The VGG team compared the performance of neural networks according to the depth of the model and proposed six models for this purpose. GoogLeNet is a model developed by Google, and in 2014, it overtook VGGNet to win the championship. GoogLeNet introduced the Inception module that can derive various types of characteristics through convolution operation using kernels of different sizes. ResNet is a model developed by Microsoft, and it is the model that won the ILSVRC in 2015. Since there is a limit to performance improvement even if the CNN layer is deep, ResNet achieved performance improvement by introducing a residual block with a shortcut added. In this study, ResNet, which achieved excellent performance, is used for experimental performance evaluation. Even after ResNet, excellent CNN architectures such as ResNeXt [21] and SENet [22] are newly emerging and research is being actively conducted. ResNeXt was the second-place model in the 2016 ILSVRC and improved performance applying grouped convolution to ResNet’s bottleneck. Increasing the cardinality, a hyperparameter that controls how many groups the channel is divided into, was more efficient than increasing the width or depth of the model. That is, when the model complexity is the same, it means that increasing the cardinality exhibits better performance. SENet is a neural network that won the ILSVRC in 2017 and has focused on interaction between channels to improve performance. Interaction between channels can be thought of as a weight, and channels with large weights can be interpreted as meaning that they have important characteristics. That is, SENet may be a model in which performance is improved by calculating weights between channels. SEBlock used by SENet is flexible, so it can be used with models such as residual or inception.
2.2 Data Augmentation Techniques
Various deep learning technologies, including CNN, are achieving successful results in various research fields such as natural language processing, object classification, and emotion analysis. However, in general, it is often difficult to obtain a dataset to use deep learning techniques to solve problems. When learning is performed with a limited training data set, underfitting and overfitting phenomena occur, in which the training is not performed properly, and the classification performance of the data set is deteriorated. To solve this problem, many methods such as dropout have been proposed, and one of them is the data augmentation technique.
Pixel-level transform, which transforms an image in units of pixels, is a technique that typically applies Blur, Jitter, Noise, etc. to an image. Techniques such as Gaussian Blur, Motion Blur, Brightness Jitter, Contrast Jitter, and Saturation Jitter are used. Spatial-Level Transform that changes an image is typically Flip and Rotation, and Crop that cuts out a part of an image is also used a lot. In [23], a technique for randomly shuffled feature values within an N × N non-overlapping sliding window was proposed, and N, the size of the sliding window, is a hyperparameter. However, it is regrettable that the performance is greatly influenced by the value of N. Therefore, it is necessary to apply an appropriate value of N. Another study proposed a method of randomly extracting two images from a training dataset, randomly cropping them to a size of 224, and then applying a random horizontal flip [24]. The average of these two patches is obtained and a mixed patch is generated. In this case, the label of the first image is used as it is. In addition, there is a study that improved the existing methods for mixing two images, and suggested 8 kinds of mixing methods beyond the simple average calculation method [25]. It is characterized by proposing methods to show the shape of CutMix or Mosaic technique. In [26] proposed a method for weighted linear interpolation of two images and labels through lambda values between 0 and 1. Lambda values are extracted through beta distribution, and although this method is very simple, various effects can be obtained, such as improving the generalization performance of the model and being sensitive to adversarial examples. In addition, various data augmentation techniques exist, and their research is still in progress.
Benchmark datasets are very important for the development of artificial intelligence in that they induce good competition among researchers. A community in which idea exchange and research competition take place around the benchmark dataset is formed, and it becomes a means of knowledge exchange between the industry and academia [27].
In fact, several benchmark data sets created in academia are being used by various corporate research teams, making further progress. In addition, as the benchmark data and preprocessing programs and baseline models are released as open sources, it can be of great help to beginners. Therefore, in this paper, CIFAR-10, a famous benchmark data set, is used to evaluate the experimental performance of the mixed contour data augmentation technique. The CIFAR-10 dataset consists of 60,000 images with 32 × 32 resolution and includes 10 classes (airplane, automobile, bird, cat, deer, dog, frog, horse, ship, truck). There are 6000 images for each class, and it is divided into 50000 training datasets and 10000 test datasets. Fig. 1 is a sample of the CIFAR-10 dataset and shows 10 random images for each class.
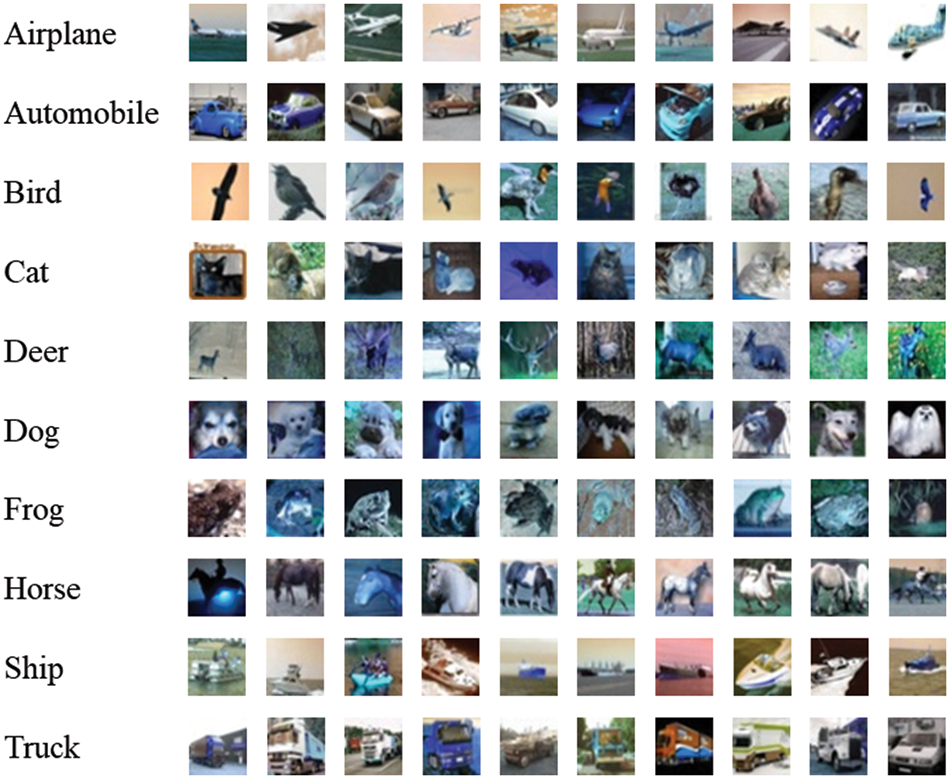
Figure 1: CIFAR-10 dataset sample (10 images per class)
4.1 Mixed Contour Data Augmentation
The mixed contour data augmentation technique proposed in this paper can be divided into two methods. The first method randomly selects two images A and B of different classes from the training dataset. Then, the contour image is extracted from the selected image using the Canny edge detection [28] algorithm. The Canny edge detection algorithm first uses Gaussian kernels to remove noise from the input image and find a point where the pixel value changes rapidly to detect the strength and direction of the edge. In addition, non-maximum suppression is performed to remove non-edge parts, and a threshold is set to determine whether it is an edge or not.
If the contour images extracted from each image are A′ and B′, mix images A and B′ and mix images B and A′ to create new images A + B′ and B + A′. The label value of the newly created image is assigned according to the mixing ratio. For example, if 30% of image A is used and 70% of image B′ is used, it is assigned as [0.3, 0.7]. In the second method, in the same way as in the first method, two images of different classes are randomly selected from the training dataset and a contour image is extracted. Then, a new image A′ + B′ is created by mixing the extracted contour images. The label value is applied in the same way as in the first method. Fig. 2 schematically shows the mixed contour data augmentation technique.
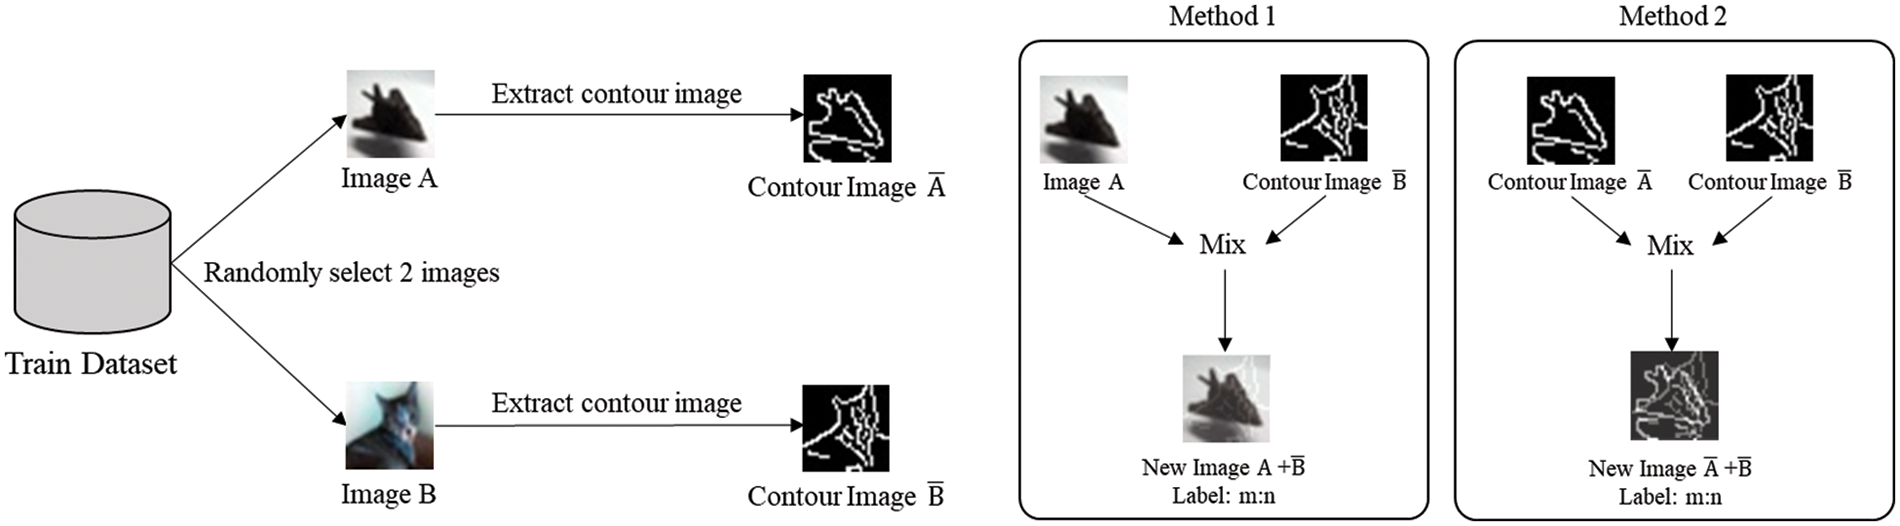
Figure 2: Diagram of mixed contour data augmentation
Fig. 3 shows samples generated in two ways of the mixed contour data augmentation technique.
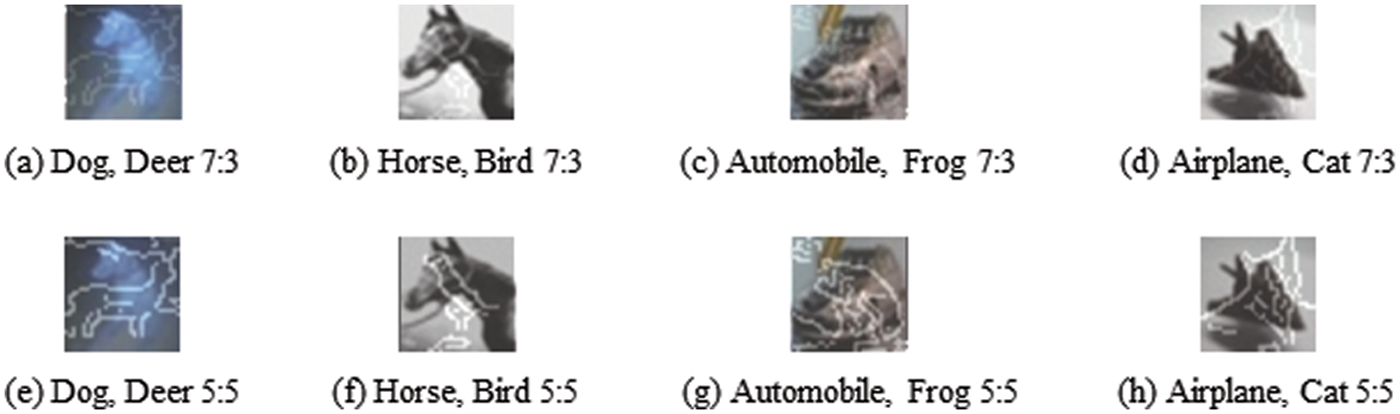
Figure 3: Mixed contour image data augmented sample
Fig. 3a is an image created by mixing the dog class image and deer class contour image at a ratio of 7:3, and the label values are assigned as [0.7, 0.3]. In the case of (b) to (h), as in (a), the original image and contour image of different classes are mixed in a ratio of 7:3 or 5:5, and the label value is [0.7, 0.3] or [0.5, 0.5].
4.2 Experimental Scenarios and Detailed Steps
There are three experimental performance evaluation methods to prove the excellence of the mixed contour data augmentation technique proposed in this paper. In the first experimental performance evaluation, since the contour image represents the shape of the object, it is proved that learning the neural network using the contour image is an important factor in improving performance. To this end, the classification accuracy of the neural network learned using only the original image and the neural network learned using the original image and the contour image is compared. At this time, to prove that high accuracy can be achieved even with a small amount of training dataset, the ratio of the training dataset is set to 70%, 50%, and 30%, respectively, and compared. Table 1 summarizes the first experimental performance evaluation method.

In the second experimental performance evaluation, the classification accuracy of the neural network trained with the image generated by mixing the original image and the contour image (the first method mentioned in Section 3.1) is measured. As in the first method, the ratio of the training dataset is set to 70%, 50%, and 30% for comparison. And to compare the classification accuracy according to the mixing ratio of the newly created image, the ratio of the label value is set to 7:3 and 5:5 and measured. In the third experimental performance evaluation, the classification accuracy of the neural network trained with the image generated by mixing the contour image and the contour image (the second method mentioned in Section 3.1) is measured. Other conditions are the same as the second experimental performance evaluation method, and Table 2 summarizes the second and third experimental performance evaluation methods.

Since this paper uses transfer learning techniques to overcome overfitting and allow the model to converge quickly, the CNN architecture to be used for experimental performance evaluation uses ResNet, a pretrained model with ImageNet datasets, and CIFAR-10. And, as the hyperparameter used for model training, epoch was set to 50 and learning rate was used as 0.0001. Additionally, Adam [29] optimizer was used for fast convergence of the model.
5 Experimental Performance Results and Discussion
The experiment performed in this study was performed on 64-bit Windows 10 OS, and the program for the experiment was implemented using the Keras library. The hardware environment of the PC used for the experiment consisted of NVIDIA GeForce RTX 2070 SUPER 8 GB GPU, AMD Ryzen 7 3700X 8-Core CPU and 32 GB RAM.
5.1 Effect of Contour Image Training on Model Performance
Table 3 and Fig. 4 show the classification accuracy of the model trained using only the original image and the model trained using the original image and the contour image when the ratio of the training dataset is 70%, 50%, and 30%.
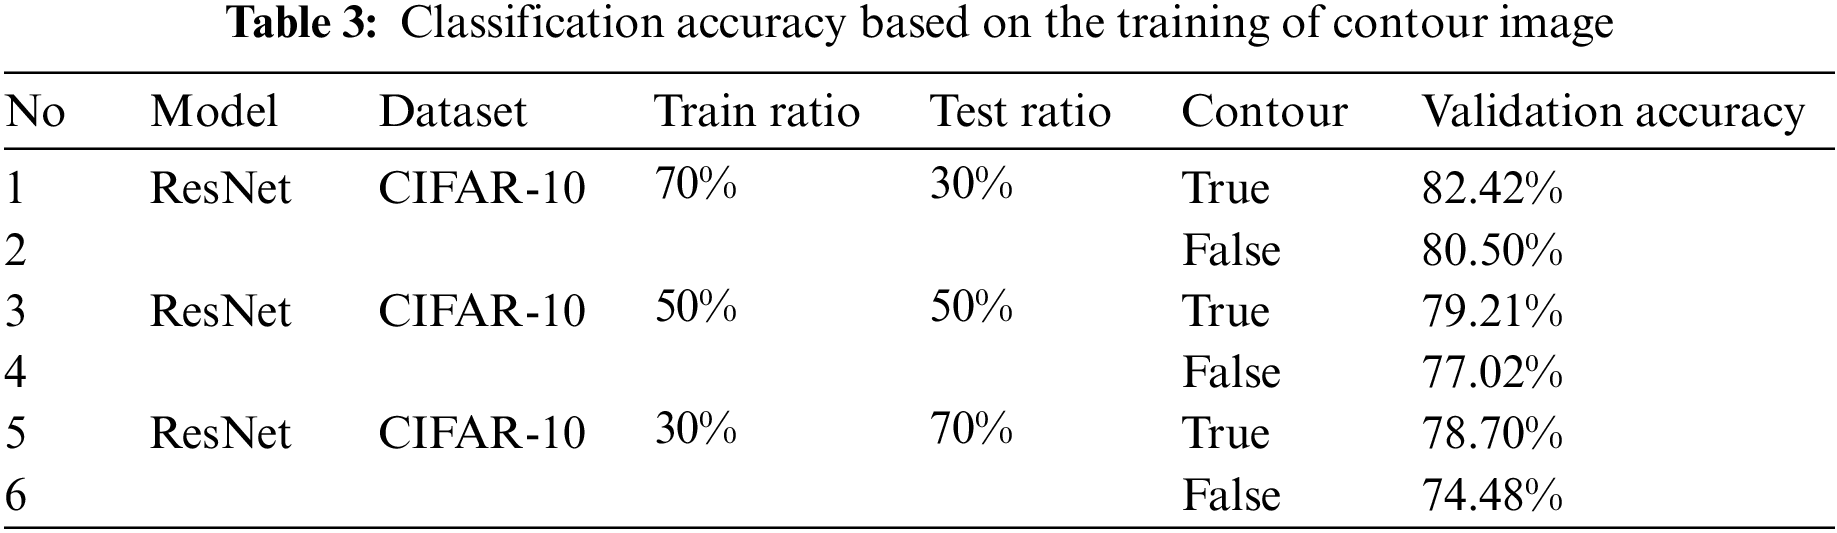
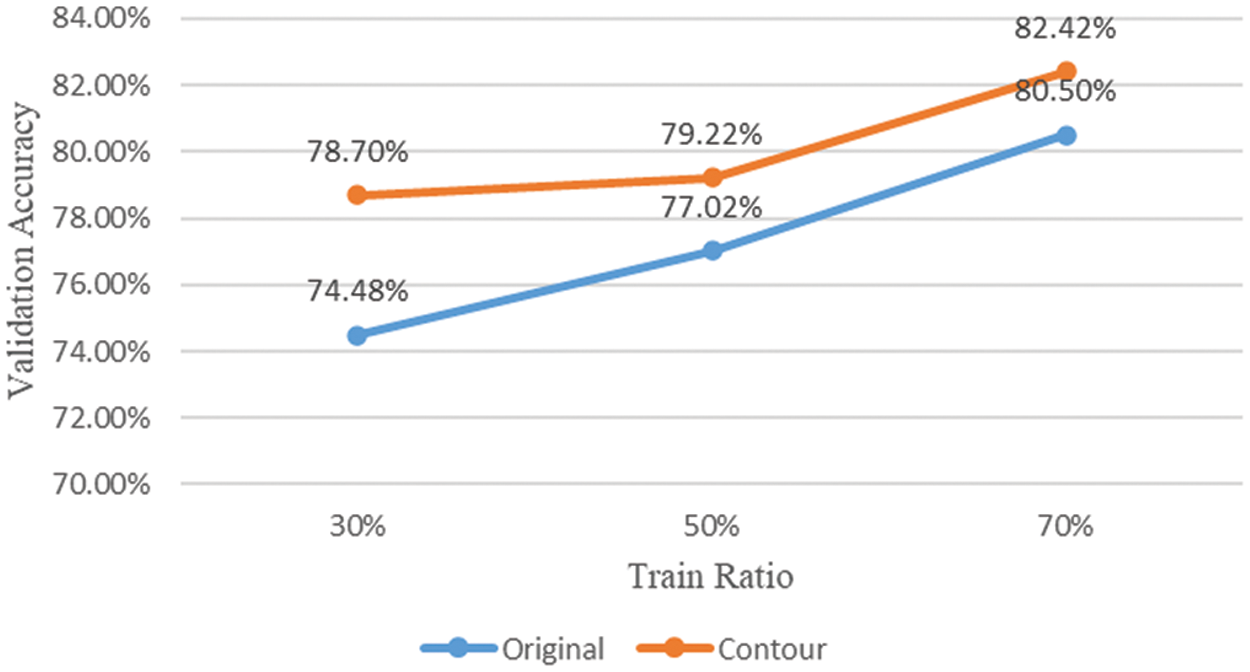
Figure 4: Comparison of accuracy by training dataset ratio and contour image training
When the ratio of the training dataset was 30%, the accuracy of the model that learned the contour image achieved 4.22% higher classification accuracy than the model that learned only the original image. Accuracy was improved by 2.2% when the ratio of the training dataset was 50%, and accuracy was improved by 1.92% when the ratio of the training dataset was 70%. Through the first experimental performance evaluation, it can be confirmed that learning a model using a contour image representing the shape of an object is an important factor in improving classification performance. And when the ratio of training data is 30%, it is judged that it is a data augmentation technique that can be used practically in fields where it is difficult to obtain data through achieving the highest accuracy improvement.
5.2 Mixed Contour Data Augmentation Using Original Image and Contour Image
Table 4 and Fig. 5 show the classification accuracy of the model trained using the original images and images in which the original image and the contour image are mixed at ratio of 7:3 or 5:5 when the ratio of the training dataset is 70%, 50%, and 30%.
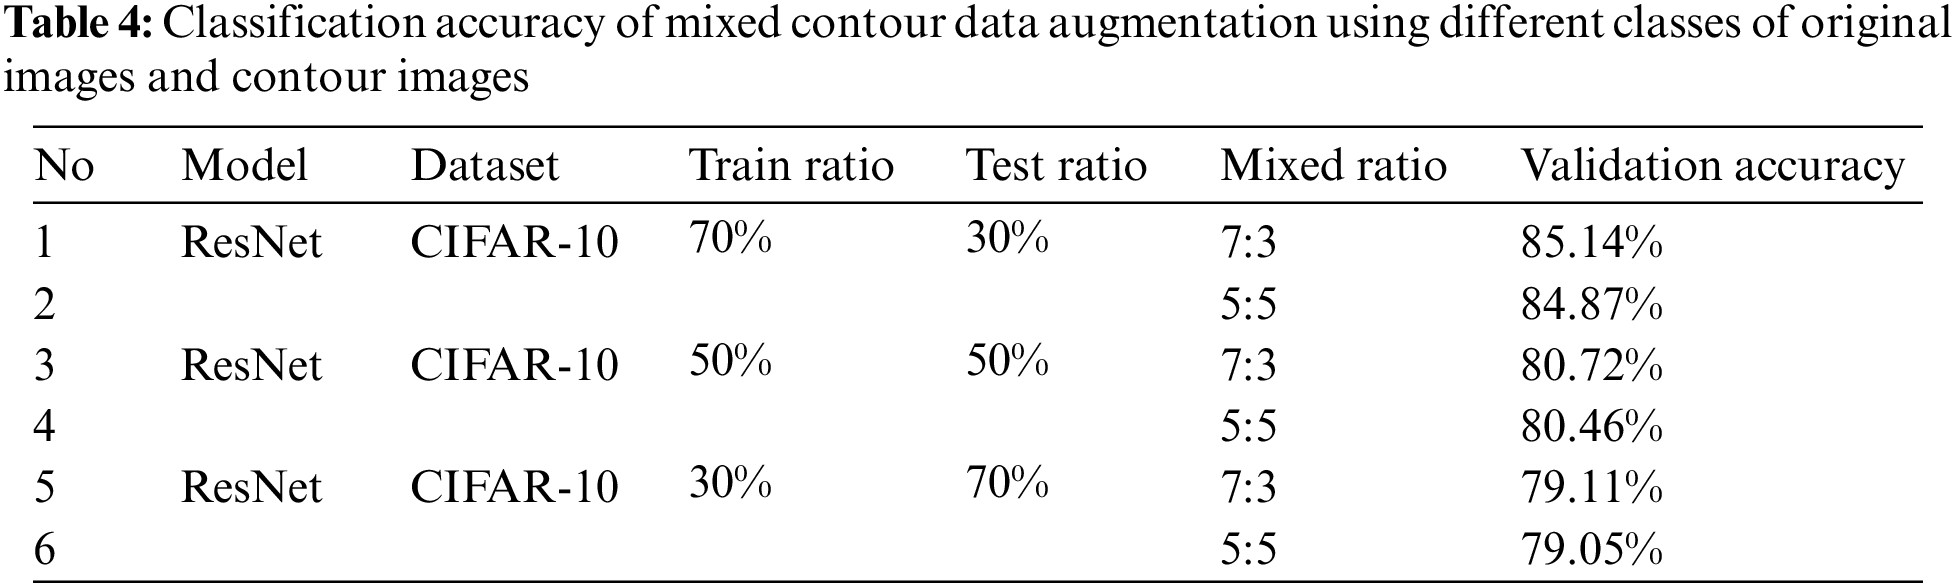
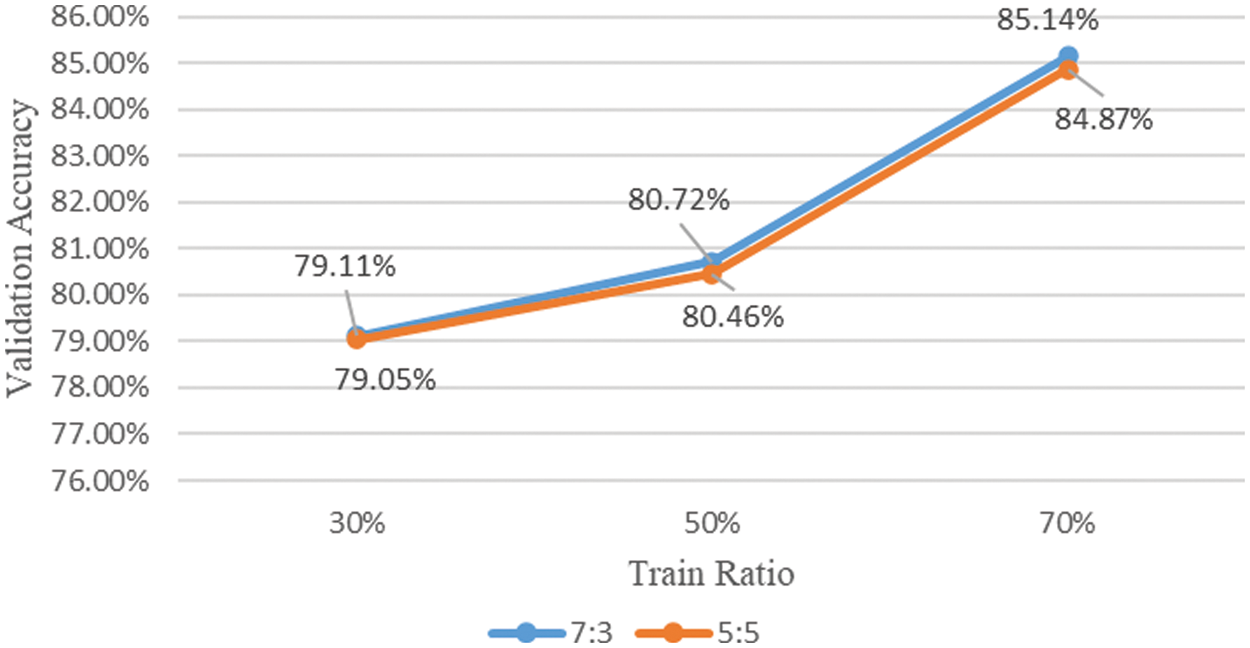
Figure 5: Comparison of accuracy of mixed contour data augmentation using different classes of original image and contour image
When the ratio of training data was 70%, the highest classification accuracy was achieved at 85.14% when the original image and the contour image were mixed at a ratio of 7:3. In addition, when mixed at a ratio of 5:5, the classification accuracy of 84.87% was achieved, and when mixed at a ratio of 7:3, the accuracy was 0.27% higher. When the ratio of the training data was 50%, the classification accuracy of 80.72% was achieved when the original image and the contour image were mixed at a ratio of 7:3. In addition, when mixed at a ratio of 5:5, the classification accuracy of 80.46% was achieved, and when mixed at a ratio of 7:3, the accuracy was 0.26%. When the ratio of the training data is 30%, the classification accuracy of 79.11% was achieved when the original image and the contour image were mixed in a ratio of 7:3. And, when mixing at a ratio of 5:5, a classification accuracy of 79.05% was achieved, and when mixing at a ratio of 7:3, the accuracy was 0.06% higher.
Compared with the model trained using the original image and the contour image (the result of the first experimental performance evaluation), higher classification accuracy was achieved when the mixed contour data augmentation technique was applied regardless of the ratio of the training data. And when the ratio of the training data was 70%, the accuracy was improved by 2.72%, and it was confirmed that the improvement in accuracy was larger than when the ratio of the training data was 50% and 30%. When the ratio of the training data is 30%, the accuracy is improved by 0.46%, so the effect of the mixed contour data augmentation technique is weak, but it is judged to be worthwhile to apply in that the accuracy is improved.
5.3 Mixed Contour Data Augmentation Using Contour Images
Table 5 and Fig. 6 show the classification accuracy of the model learned using the original image and the image mixed with two contour images of different classes at a ratio of 7:3 and 5:5 when the ratio of the training dataset is 70%, 50%, and 30%.
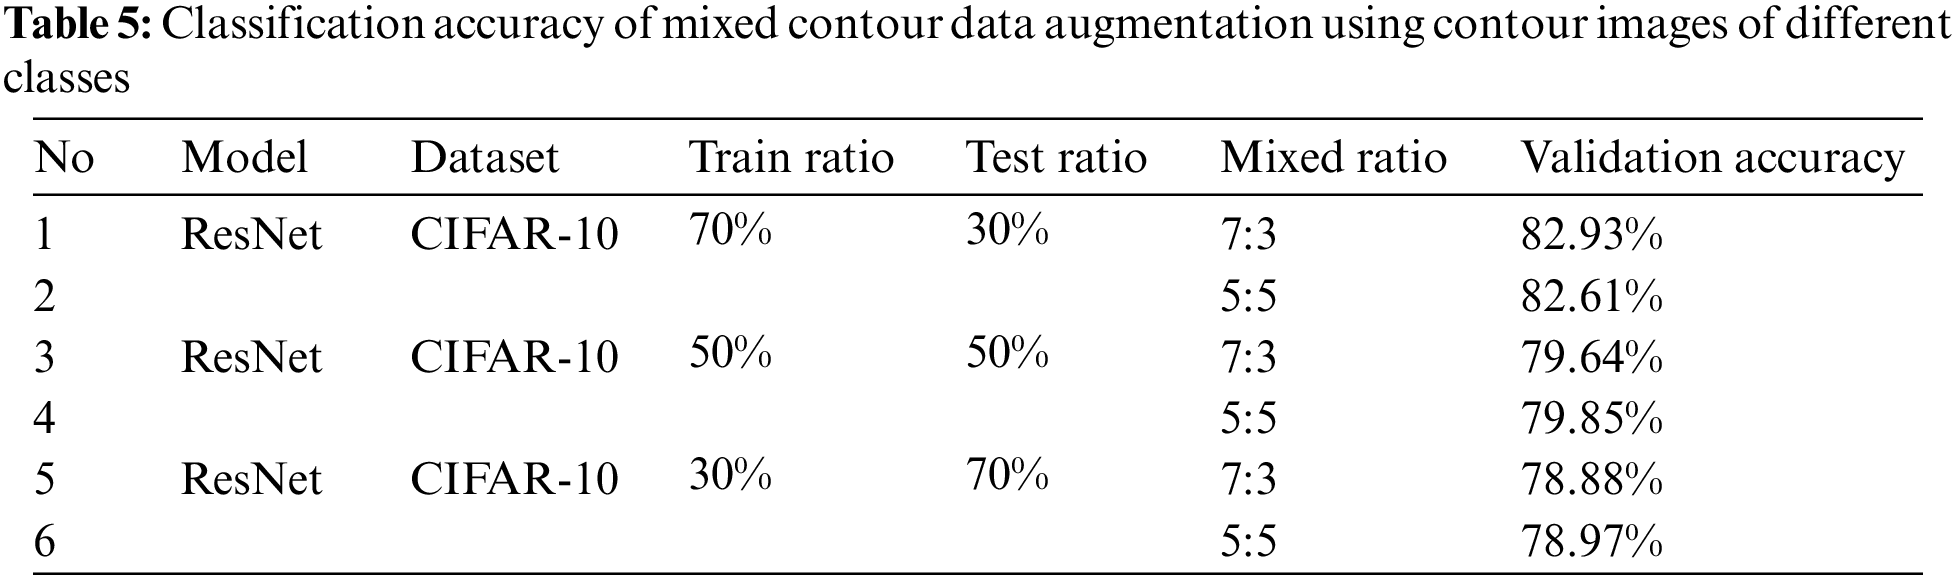
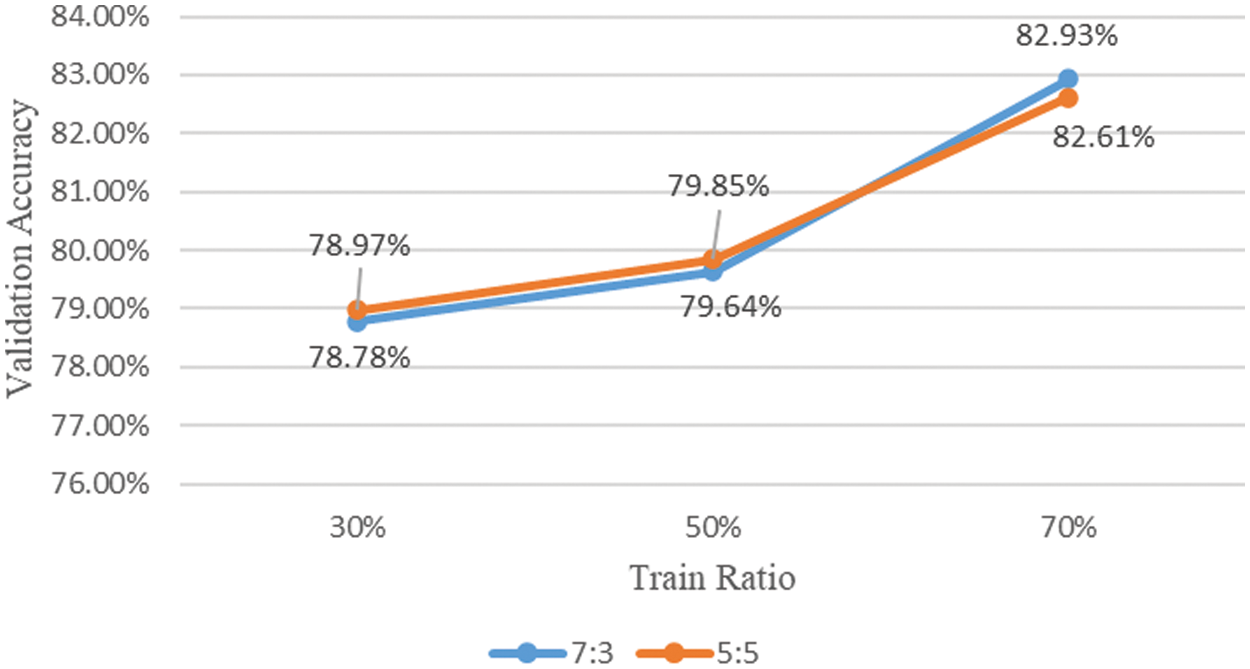
Figure 6: Comparison of accuracy of mixed contour data augmentation using contour images of different classes
The data augmentation technique through mixing between contour images improved slightly compared to the first experimental performance evaluation result, but its performance was degraded compared to a model learned using data mixed with original and contour images. And after learning the model several times, it was confirmed that there was no change in performance according to the image mixing ratio. However, as confirmed in the first experimental performance evaluation, it was confirmed that the model that learned the contour image achieved higher classification accuracy than the model that did not.
In this paper, a mixed contour data augmentation technique, a new data augmentation technique, is proposed to solve problems such as data shortage and overfitting and underfitting that may occur. Through the first experimental performance evaluation, it was proved that learning neural networks using contour images is an important factor in improving performance. And when the ratio of the training data is 30%, the accuracy improvement of 4.22% was achieved, and it is expected that it can be used efficiently in the field with insufficient data. Through the second experimental performance evaluation, higher accuracy was achieved when the mixed contour data augmentation technique was applied regardless of the ratio of training data. A performance improvement of up to 4.64% was achieved when compared to the model trained on only the original image, and a performance improvement of up to 2.72% was achieved when compared with the model trained on the original image and the contour image. Through the third experimental performance evaluation, it was confirmed that the data augmentation technique by mixing the contour images had lower accuracy compared to the data augmentation technique that mixed the original image and the contour image, and there was no performance change according to the image mixing ratio. However, it still achieved higher accuracy than the model that learned only the original image. In conclusion, significant performance improvement could be achieved when learning neural networks using the mixed contour data augmentation technique proposed in this study. In addition, it is expected that the mixed contour data augmentation technique can be applied in various fields by proving performance improvement through benchmark datasets to the experimental performance evaluation of this study. Based on the results of this study, in the future, we aim to improve the performance better by increasing the number of classes to be mixed or changing the mixing methods.
Funding Statement: The authors received no specific funding for this study.
Conflicts of Interest: The authors declare that they have no conflicts of interest to report regarding the present study.
References
1. C. C. Qi, “Big data management in the mining industry,” International Journal of Minerals, Metallurgy and Materials, vol. 27, no. 2, pp. 131–139, 2020. [Google Scholar]
2. J. Chen, Y. Chen, X. Du, C. Li, J. Lu et al., “Big data challenge: A data management perspective,” Frontiers of Computer Science, vol. 7, no. 2, pp. 157–164, 2013. [Google Scholar]
3. Y. LeCun, B. Boser, J. S. Denker, D. Henderson, R. E. Howard et al., “Backpropagation applied to handwritten zip code recognition,” Neural Computation, vol. 1, no. 4, pp. 541–551, 1989. [Google Scholar]
4. A. Krizhevsky, I. Sutskever and G. E. Hinton, “Imagenet classification with deep convolutional neural networks,” Advances in Neural Information Processing Systems, vol. 25, pp. 1097–1105, 2012. [Google Scholar]
5. K. Simonyan and A. Zisserman, “Very deep convolutional networks for large-scale image recognition,” 2014. [Online]. Available: https://arxiv.org/abs/1409.1556 [Google Scholar]
6. C. Szegedy, W. Liu, Y. Jia, P. Sermanet, S. Reed et al., “Going deeper with convolutions,” in Proc. Conf. on Computer Vision and Pattern Recognition, Boston, MA, USA, pp. 1–9, 2015. [Google Scholar]
7. K. He, X. Zhang, S. Ren and J. Sun, “Deep residual learning for image recognition,” in Proc. Conf. on Computer Vision and Pattern Recognition, Las Vegas, NV, USA, pp. 770–778, 2016. [Google Scholar]
8. O. Russakovsky, J. Deng, H. Su, J. Krause, S. Satheesh et al., “Imagenet large scale visual recognition challenge,” International Journal of Computer Vision, vol. 115, no. 3, pp. 211–252, 2015. [Google Scholar]
9. A. Krizhevsky and G. Hinton, “Learning multiple layers of features from tiny images,” 2009. [Online]. Available: http://citeseerx.ist.psu.edu/viewdoc/download?doi=10.1.1.222.9220&rep=rep1&type=pdf [Google Scholar]
10. M. Everingham, L. Van Gool, C. K. Williams, J. Winn and A. Zisserman, “The pascal visual object classes (voc) challenge,” International Journal of Computer Vision, vol. 88, no. 2, pp. 303–338, 2010. [Google Scholar]
11. T. Y. Lin, M. Maire, S. Belongie, J. Hays, P. Perona et al., “Microsoft coco: Common objects in context,” in European Conf. on Computer Vision, Cham, Springer, pp. 740–755, 2014. [Google Scholar]
12. U. Yasmeen, M. A. Khan, U. Tariq, J. A. Khan, M. Asfand et al., “Citrus diseases recognition using deep improved genetic algorithm,” Computers, Materials & Continua, vol. 71, no. 2, pp. 3667–3684, 2022. [Google Scholar]
13. A. Majid, M. A. Khan, M. Alhaisoni, M. Asfand, U. Tariq et al., “An integrated deep learning framework for fruits diseases classification,” Computers, Materials & Continua, vol. 71, no. 1, pp. 1387–1402, 2022. [Google Scholar]
14. J. P. Villa-Pulgarin, A. A. Ruales-Torres, D. Arias-Garzón, M. A. Bravo-Ortiz, H. B. Arteaga-Arteaga et al., “Optimized convolutional neural network models for skin lesion classification,” Computers, Materials & Continua, vol. 70, no. 2, pp. 2131–2148, 2022. [Google Scholar]
15. M. R. Latif, M. A. Khan, M. Y. Javed, H. Masood, U. Tariq et al., “Cotton leaf diseases recognition using deep learning and genetic algorithm,” Computers, Materials & Continua, vol. 69, no. 3, pp. 2917–2932, 2021. [Google Scholar]
16. Y. Fu, M. Gong, G. Yang, H. Wei and J. Zhou, “Evolutionary gan–based data augmentation for cardiac magnetic resonance image,” Computers, Materials & Continua, vol. 68, no. 1, pp. 1359–1374, 2021. [Google Scholar]
17. H. Kutlu and E. Avcı, “A novel method for classifying liver and brain tumors using convolutional neural networks, discrete wavelet transform and long short-term memory networks,” Sensors, vol. 19, no. 9, pp. 1992, 2019. [Google Scholar] [PubMed]
18. F. Özyurt, “A fused CNN model for WBC detection with MRMR feature selection and extreme learning machine,” Soft Computing, vol. 24, no. 11, pp. 8163–8172, 2020. [Google Scholar]
19. H. Kutlu, E. Avci and F. Özyurt, “White blood cells detection and classification based on regional convolutional neural networks,” Medical Hypotheses, vol. 135, pp. 109472, 2020. [Google Scholar]
20. O. A. Penatti, K. Nogueira and J. A. Dos Santos, “Do deep features generalize from everyday objects to remote sensing and aerial scenes domains?,” in Proc. the IEEE Conf. on Computer Vision and Pattern Recognition Workshops, Boston, MA, USA, pp. 44–51, 2015. [Google Scholar]
21. S. Xie, R. Girshick, P. Dollár, Z. Tu and K. He, “Aggregated residual transformations for deep neural networks,” in Proc. the IEEE Conf. on Computer Vision and Pattern Recognition, Honolulu, HI, USA, pp. 1492–1500, 2017. [Google Scholar]
22. J. Hu, L. Shen and G. Sun, “Squeeze-and-excitation networks,” in Proc. the IEEE Conf. on Computer Vision and Pattern Recognition, Salt Lake City, UT, USA, pp. 7132–7141, 2018. [Google Scholar]
23. G. Kang, X. Dong, L. Zheng and Y. Yang, “Patchshuffle regularization,” 2017. [Online]. Available: https://arxiv.org/abs/1707.07103 [Google Scholar]
24. H. Inoue, “Data augmentation by pairing samples for images classification,” 2018. [Online]. Available: https://arxiv.org/abs/1801.02929 [Google Scholar]
25. C. Summers and M. J. Dinneen, “Improved mixed-example data augmentation,” in 2019 IEEE Winter Conf. on Applications of Computer Vision (WACV), Waikoloa, HI, USA, pp. 1262–1270, 2019. [Google Scholar]
26. H. Zhang, M. Cisse, Y. N. Dauphin and D. Lopez-Paz, “Mixup: Beyond empirical risk minimization,” 2017. [Online]. Available: https://arxiv.org/abs/1710.09412 [Google Scholar]
27. M. Hardt and B. Recht, “Patterns, predictions, and actions: A story about machine learning,” 2021. [Online]. Available: https://arxiv.org/abs/2102.05242 [Google Scholar]
28. J. Canny, “A computational approach to edge detection,” IEEE Transactions on Pattern Analysis and Machine Intelligence, vol. PAMI-8, no. 6, pp. 679–698, 1986. [Google Scholar]
29. D. P. Kingma and J. Ba, “Adam: A method for stochastic optimization,” 2014. [Online]. Available: https://arxiv.org/abs/1412.6980 [Google Scholar]
Cite This Article
 Copyright © 2023 The Author(s). Published by Tech Science Press.
This work is licensed under a Creative Commons Attribution 4.0 International License , which permits unrestricted use, distribution, and reproduction in any medium, provided the original work is properly cited.
 Downloads
 Citation Tools