
 Submit a Paper
 Propose a Special lssue
 Open Access
ARTICLE

MSEs Credit Risk Assessment Model Based on Federated Learning and Feature Selection
1 School of Computer and Software, Nanjing University of Information Science & Technology, Nanjing, 210044, China
2 State Key Laboratory Novel Software Technology, Nanjing University, Nanjing, 210023, China
3 Department of Computer and Electronics Systems Engineering, Hankuk University of Foreign Studies, Yongin-si, Gyeonggi-do, 17035, Korea
* Corresponding Author: Jianchun Cheng. Email:
Computers, Materials & Continua 2023, 75(3), 5573-5595. https://doi.org/10.32604/cmc.2023.037287
Received 29 October 2022; Accepted 03 March 2023; Issue published 29 April 2023
 View Full Text
 Download PDF
Abstract
Federated learning has been used extensively in business innovation scenarios in various industries. This research adopts the federated learning approach for the first time to address the issue of bank-enterprise information asymmetry in the credit assessment scenario. First, this research designs a credit risk assessment model based on federated learning and feature selection for micro and small enterprises (MSEs) using multi-dimensional enterprise data and multi-perspective enterprise information. The proposed model includes four main processes: namely encrypted entity alignment, hybrid feature selection, secure multi-party computation, and global model updating. Secondly, a two-step feature selection algorithm based on wrapper and filter is designed to construct the optimal feature set in multi-source heterogeneous data, which can provide excellent accuracy and interpretability. In addition, a local update screening strategy is proposed to select trustworthy model parameters for aggregation each time to ensure the quality of the global model. The results of the study show that the model error rate is reduced by 6.22% and the recall rate is improved by 11.03% compared to the algorithms commonly used in credit risk research, significantly improving the ability to identify defaulters. Finally, the business operations of commercial banks are used to confirm the potential of the proposed model for real-world implementation.Keywords
The expansion of credit to MSEs is not only a regulatory policy objective but also a requirement imposed on commercial banks for sustainable business development to promote supply-side reform. However, given the large number of MSEs and their characteristics, they usually face problems such as a smaller amount of operating capital, limited access to information, difficulty in obtaining guarantees, and high financial risk. The amount and ratio of non-performing loans in China’s commercial banks show an increasing trend annually, resulting in higher risk pressure and a high loss rate for banks [1]. Information asymmetry is the main cause of the risk associated with lending to MSEs [2]. Commercial banks have difficulty collecting sufficient data on MSEs and their owners, which makes it difficult for banks to make reliable assessments of the financial situation and growth trajectory of MSEs. As a result, one of the most serious challenges that banks need to study and address in order to expand their lending business is the establishment of a scientific and efficient system for assessing the credit risks associated with MSEs.
According to the financing practices of MSEs in many countries, bank loans are the most prominent source of external financing for these businesses [3]. As the economy becomes increasingly digitalized, the traditional way of making credit decisions for MSEs is primarily based on information such as audit opinions, which are collected manually, and the process is lengthy, repetitive, and requires complex data verification work. This makes it difficult to extract information with real analytical value to meet actual needs and even more challenging to support the rapid growth of the credit business.
Financial inefficiencies resulting from the increasing inability of the traditional processing model to adapt to the evolving environment are becoming more apparent. Many scholars have successfully applied machine learning techniques to credit risk assessment, including neural networks (NNs) [4], genetic algorithms (GAs) [5], and decision trees (DTs) [6–8]. However, there are still some issues that require further discussion.
On the one hand, there is still a problem of limited data or poor data quality in the field of financial credit, which is not enough to support the realization of artificial intelligence technology. As a reference data reflecting social development and economic operation, electricity data has the characteristics of “fine accuracy” and “wide coverage”, which can effectively reflect the business situation and development trend of various industries. Through collation and modeling based on power file data and power consumption data, from the dimensions of power consumption scale, power consumption stability, power consumption characteristics and power consumption reputation, we can effectively identify stagnant enterprises, empty shell enterprises and enterprises with poor development in various industries, and draw accurate portraits for small and micro enterprises, so as to timely understand the operation status of enterprises and position them for support. Given the lack of symmetry in financial data and the difficulty in obtaining high-quality financial statements for micro and small enterprises, power and credit data should be used as reference dimensions for assessing the credit risk of enterprises. At present, applied research to estimate credit risk based on an enterprise’s electricity consumption and credit data is still insufficient.
On the other hand, features need to be filtered, because when machine learning models are trained using existing credit rating indicators, there are redundant and irrelevant features that could cause the “curse of dimensionality” and hinder model performance. Despite increasing prediction accuracy, the usual feature selection techniques of filters and wrappers do not offer a quantitative opinion on how important a feature is, and are less interpretable. Additionally, current research rarely focuses on both feature selection and model construction.
On the other hand, features need to be filtered because when machine learning models are trained using existing credit indicators, there are redundant and irrelevant features that can cause the “curse of dimensionality” and hinder model performance. Despite increasing predictive accuracy, the common feature selection techniques of filters and wrappers do not provide a quantitative opinion on the importance of a feature and are less interpretable. In addition, current research rarely focuses on both feature selection and model construction.
To address the above issues, one option is to fully utilize external data from the People’s Bank of China (PBC) credit reference and electricity systems to compensate for the lack of subjective empowerment and improve the information asymmetry situation between banks and enterprises. However, it also introduces unprecedented problems such as “data silos” [9], which are impenetrable barriers between data sources that provide data support. Data confidentiality measures are necessary because of market competition, privacy and security concerns, and regulatory requirements [10,11]. Incalculable damage can be caused if sensitive data is compromised. Global attention is focused on data security [12], and the emergence of numerous privacy laws has made “data silos” more commonplace.
How to design a machine learning framework that allows AI systems to work together more efficiently and accurately with their respective data while meeting the privacy, security, and regulatory requirements for corporate financial, credit, and power data is an important topic at hand. We are shifting the focus of our research to how to solve the “data silos” problem. A feasible solution that satisfies privacy and data security is federated learning (FL) [13,14]. As a growing artificial intelligence technique, federated learning has been actively researched and applied in various fields and also provides a new way to build credit models for MSEs.
In this research, we suggest a credit risk assessment model for MSEs based on federated learning and feature selection. This paper’s main points are:
• Based on the bank’s internal loan data and the addition of external data, such as the electricity system and the credit system of the PBC, a model architecture based on federated learning technology was creatively applied to MSEs’ credit scenarios.
• We present a two-stage feature selection algorithm: XGBoost-based mRMR-PCA (XMP) for constructing the optimal feature and a hybrid filter-wrapper feature selection algorithm that combines the benefits of high accuracy and efficiency.
• We propose a local update screening strategy based on a dual subjective logic model to filter trustworthy model parameters for aggregation at each local model update to ensure the quality of the overall model.
The following sections of the paper are structured as follows: In Section 2, we outline earlier initiatives to improve MSEs’ credit model performance. In Section 3, we provide a comprehensive description of the specifics of the proposed framework. As a result, Section 4 provides details on the experimental setups used to produce the findings of this study. Finally, Section 5 concludes our analysis by summarizing its findings.
2.1 Enterprise Credit Risk Assessment Model
From early expert systems and multivariate statistical analysis models to today’s use of machine learning and artificial intelligence in the credit assessment indicator system, there has been extensive research into credit risk assessment methodologies. The ability to effectively use existing technologies to mitigate the impact of bank-enterprise information asymmetry is the key to tackling the problem of financing for MSEs.
The most commonly used algorithm in credit risk research is Logistic Regression (LR) because of its simple structure, high interpretability, and excellent accuracy [15]. Jones et al. [16,17] conducted a thorough investigation of the predictive accuracy of several classifiers using a large number of samples, ranging from the most sophisticated techniques such as Probit, LR, and Linear Discriminant Analysis (LDA) to more sophisticated methods such as Support Vector Machines (SVM), NNs, and statistical learning models such as Random Forests (RF) and Generalized Boosting. They propose that Generalized Boosting and RF outperform conventional LR, Probit, and LDA models and even the popular AI methods NNs and SVM.
Although many cutting-edge AI models have demonstrated exceptional accuracy, their limited interpretability and the data inadequacy of real-world lending scenarios prevent their widespread use in credit assessment. However, machine learning algorithms represented by DT, RF, Gradient Boosting Decision Tree (GBDT), and Extreme Gradient Boosting (XGB) perform better on smaller data sets. They can produce better predictions in a relatively short training period. Nguyen [18] compared XGB with LR, DT, and NNs in recent years to demonstrate its more remarkable results in credit risk analysis. Li et al. [19] explored the theoretical modeling of the XGB algorithm for the big data-based credit assessment classification problem. By comparing the XGB model with the LR, DT, RF, and GBDT models, they found that it performed significantly better in feature selection and data classification. Recent studies have shown that ensemble learning algorithms can effectively help banks reduce credit risk.
The use of financial data alone is far from sufficient to effectively predict credit risk for MSEs. Non-financial considerations are equally important. According to Yang et al. [20], big data credit reference is a powerful complement to traditional credit business and can be used in a wider range of business scenarios. In addition, Ala’raj et al. [21] demonstrated that selecting the optimal subset of features can significantly improve prediction accuracy by relying on the results of experiments. To speed up computation and improve prediction accuracy, Zhang et al. [22] found that the feature selection procedure is crucial. Cui et al. [23] introduced a new multiple structural interaction elastic net model for feature selection that embodies the structural connections between pairs of samples by transforming the initial vector features into a structure-based feature map representation and sets information-theoretic criteria to maximize relevance and minimize redundancy. The approach effectively detects critical elements for credit assessment in Internet finance. However, it does not deal well with noisy data in the credit risk assessment.
Although there have been significant developments in the study of AI-based credit risk assessment models, they have never solved the problem faced by the MSEs credit scenarios, which is the asymmetry of bank-enterprise information. Federated learning technology provides a viable solution to this problem.
Federated learning is defined as a machine learning process in which each participant can build a shared machine learning model using data from other participants. The data within each participant is not local, and no data resources need to be shared. The constraints of the federated learning system are:
where
Federated learning is a machine learning model in which multiple clients collaborate to solve machine learning problems under the coordination of a central server or service provider. Each client’s raw data is stored locally and is not exchanged or transmitted. Under such a federal mechanism, the joint enterprise financial, credit and power data modeling can effectively solve the asymmetry of bank-enterprise information. In turn, the exploration of multi-party data calculation and credit risk prediction can be carried out to deeply explore the value of data. Thus, federated learning technology is a “win-win” model that is extremely valuable for business interests.
With the development of research on federated learning, the projects of federated learning in various application scenarios are coming to the ground. Chen et al. [24] proposed a communication fraud detection model based on federated learning, which allows the federation to jointly model the data sets of telecom operators and public security bureau. In view of the new coronavirus pneumonia, Xu et al. [25] used edge learning and federated learning techniques to design a management model for the prevention and control of the new coronavirus pneumonia epidemic in colleges and universities, and rapidly analyzed the data of teachers and students collected by colleges and universities, in order to arrange the corresponding preventive measures in time to prevent the spread of new pneumonia. According to the current data operation situation of banks and other financial institutions, Zheng [26] actively explores the application of “federated learning + financial recommendation”. Wang et al. [27] also take the insurance industry as the background, under the premise of legal compliance, to build a data fusion architecture based on federated learning and applicable privacy protection tools. Federated learning has been applied to financial, insurance, medical, and other fields.
Based on previous research, this paper analyzes and expands the indicators that affect enterprise credit, adds electricity consumption data and credit data through federated learning, and investigates the SecureBoost algorithm [28] to design a credit evaluation model for MSEs. The SecureBoost algorithm is introduced by WeBank, which performs better in terms of accuracy, differentiation, and stability. In essence, SecureBoost is just a model of the XGBoost algorithm using a federated learning technique. To increase the accuracy of the proposed model, a hybrid mRMR-PCA feature selection strategy based on XGBoost feature importance is also explored.
3 Framework of the Credit Risk Assessment Model Based on Federated Learning and Feature Selection for MSEs
Since the credit evaluation scenario involves data interactions among multiple banks and grids, there are discrepancies in the accuracy and authenticity of the data held by each bank. We hope that each participant can achieve data value fusion through federated learning technology while protecting the privacy of the data. Fig. 1 illustrates how this model uses the electric power system as the federated learning participant and trains the enterprise credit risk assessment model in cooperation with each bank participant.
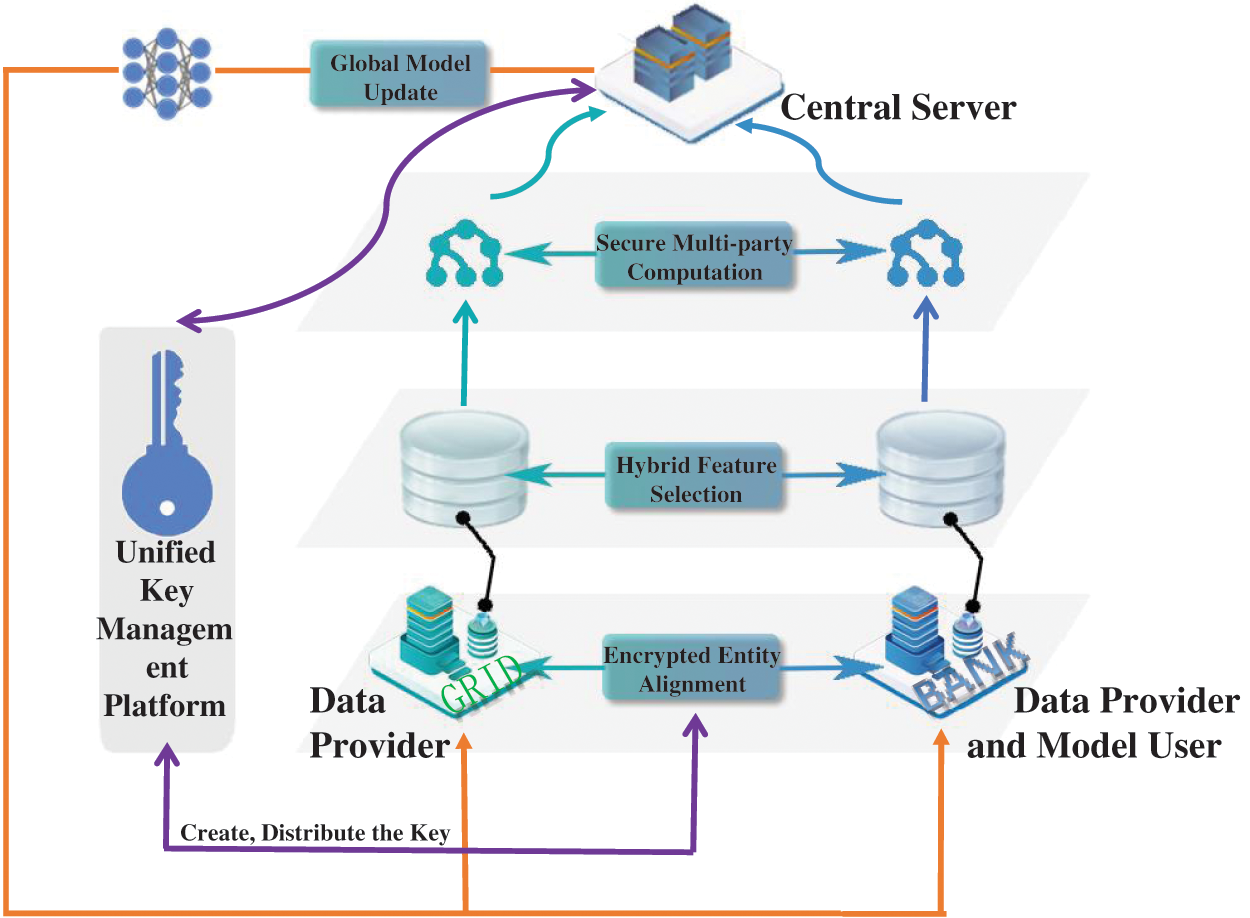
Figure 1: Architecture of the credit assessment model based on federated learning and feature selection
The data provider, the model user, and the central server are the three primary participants in the proposed credit model for MSEs. In addition to providing the data matrix and class labels needed for training as a data provider, each bank participant also serves as a model user. The grid side only serves as a data provider, providing the matrix of power-related data needed for training. Model aggregation, dissemination, validation, and other services are handled by the central server. The proposed model includes four key processes: encrypted entity alignment, hybrid feature selection, secure multi-party computation, and global model updating.
3.1 Encrypted Entity Alignment
Since the data samples between the power company and the bank do not fully overlap, the shared users’ data is extracted using encryption-based sample alignment technology, and the corresponding keys are obtained from the unified key management platform to complete the alignment with the power company’s encrypted sample ID. This ensures that the data of the same person in different dimensions on each node can be correctly matched during training.
The model uses a secure intersection scheme based on RSA and a hashing mechanism. The grid side hashes the ID and multiplies it by a random number mask before sending the encrypted data back to the bank side. The key is first distributed by the unified key management platform, and then the bank side delivers the public key to the grid side. The data is then sent to the grid side, which then performs the power of
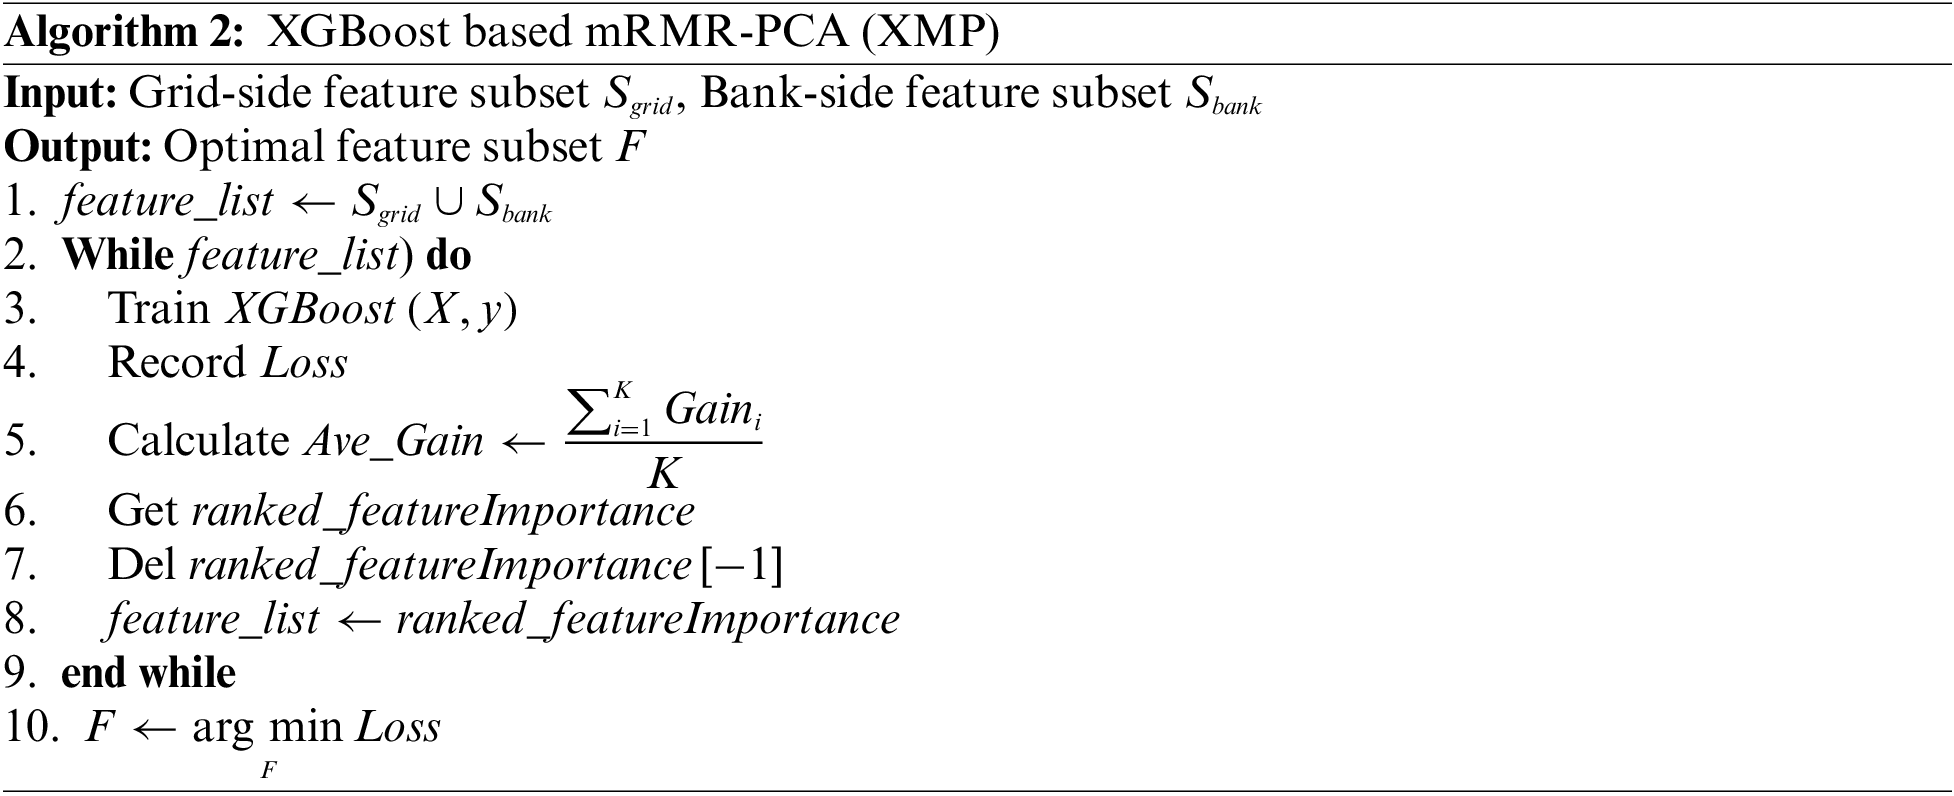
After determining the shared users on both sides, the raw data must be processed to remove redundant data features. Then, using two different feature selection techniques, i.e., integrated filters and wrappers, the best feature set for corporate credit evaluation is created from the raw data. We propose a two-stage feature selection method called XMP, in which the first stage on the bank side generates a candidate feature set using the max-relevance and min-redundancy (mRMR) algorithm [29], and the principal component analysis (PCA) method [30] is used on the grid side to reduce the dimension of power data. In the second stage, the feature importance is determined using the XGBoost average gain. For each training cycle with the XGBoost model, the average gain of the features is calculated, sorted, and the current loss value is recorded. The features corresponding to the most recent minimum average gain are dropped before the next training, and the next round of training is performed with the new feature set until it is completely dropped.
For the data on the grid-side, let there be
Then establish the covariance matrix
Then calculate the eigenvalue
We need to establish a set of feature subsets from the original feature set of the bank side, so that the target output features have a maximum correlation with the class variables and the features have a minimum redundancy with each other. The correlation of the category variables with the feature subsets, and the redundancy of all features in the set are defined as:
The ultimate objective of mRMR is to compute the set that has the maximum correlation minus the minimum redundancy, which can directly optimize the following equation directly:
In these equations,
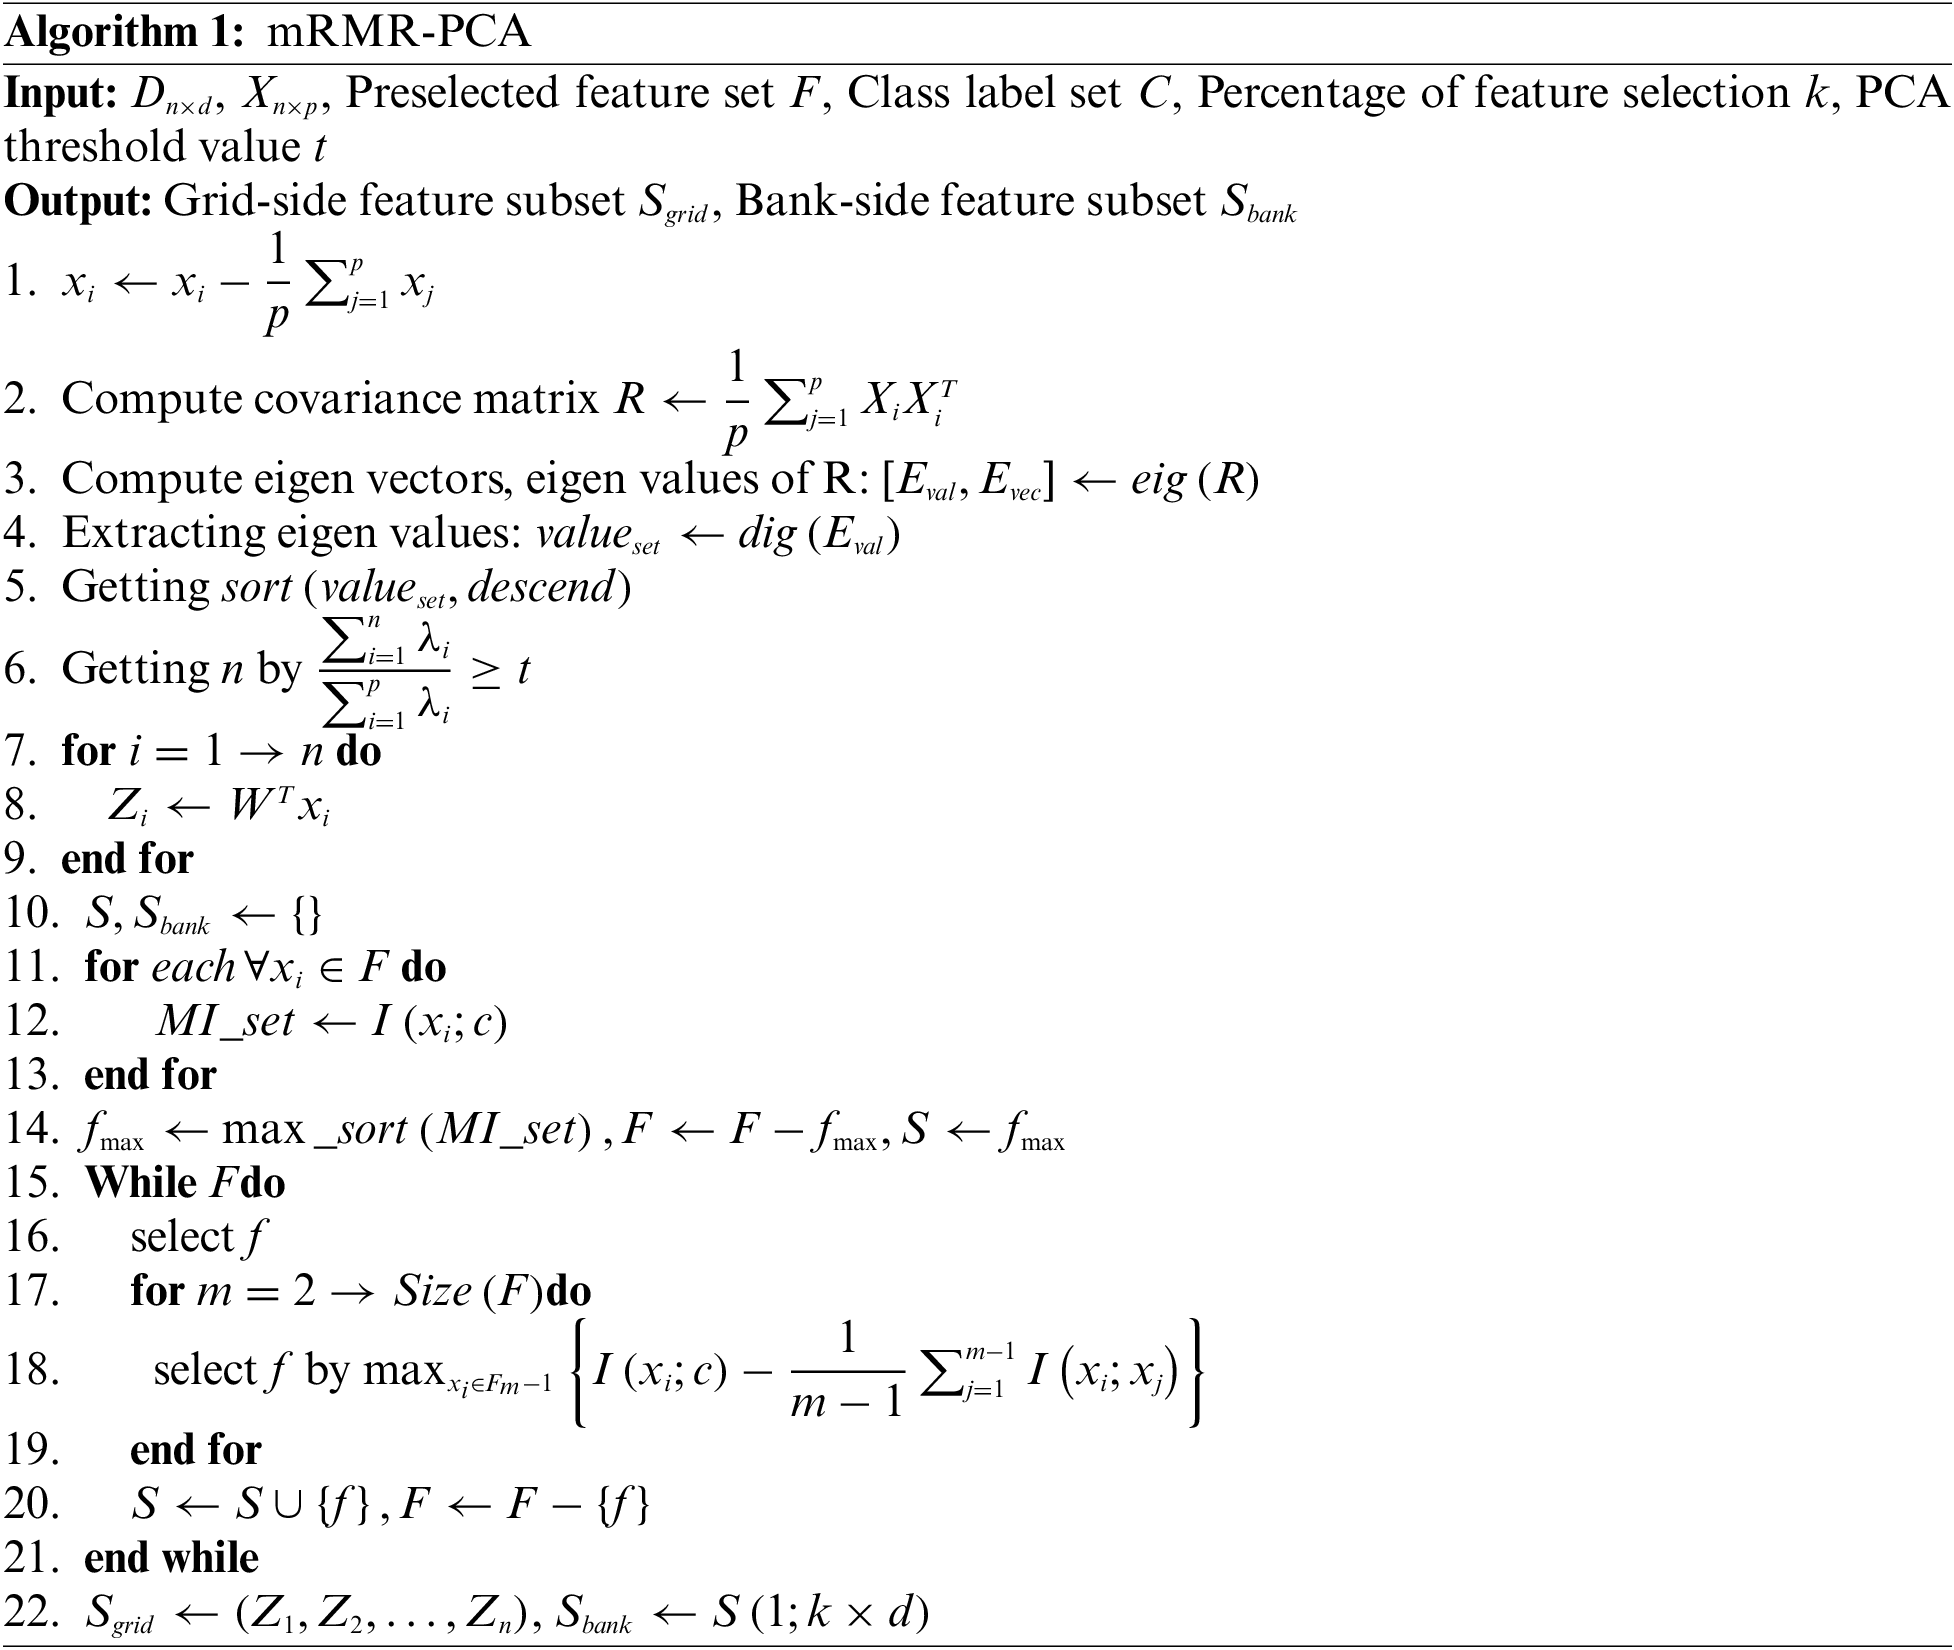
Since mRMR only considers the local optimum, the XGBoost feature importance evaluation method is used to select the optimal set of unique features for corporate credit assessment by multiple rounds of training based on mRMR-PCA. When the model finally has the
Assuming that the feature dimension of the candidate feature set on the bank side is
3.3 Secure Multi-Party Computation
The model can be trained with the optimal feature set after the hybrid feature selection. Encrypted training with a central server’s assistance is necessary to guarantee the data’s secrecy throughout the training. The SecureBoost algorithm is used for training in this paper, which includes a regularization component in the loss function to reduce the complexity and to prevent overfitting. The loss function is expressed as:
Among them,
When the model is updated for each bank participant node, it is assumed that the
Take the second-order Taylor expansion for
where
Among them,
The tree’s structure is better when
When the nodes are split, SecureBoost determines the objective function and information gain depending on
During objective function optimization, the tree structure is introduced into the loss function. When building a new tree with features on the bank side, the information gain of the split point is computed directly without synchronization with the grid side. If the feature is on the grid side, the bank side computes
Due to the requirement of confidentiality of power data, the privacy protection for grid-side features consists of two parts. First, the homomorphic encryption technology ensures the security of the power data. Second, PCA is used to downscale the power data and convert the multivariate into a few key variables that can capture the vast majority of the original data information.
It is clear from the previous study that the gradient updates of each participant’s involvement in the model aggregation affect the goodness of the overall model. As a result, we expect that trustworthy and high-quality model parameters can be selected for aggregation each time to produce superior training results. As a result, when the global model is updated, the central server can help verify the local updates of each member.
After each participant uploads the gradient update model parameters, an aiding node must use its own data as a verification set to confirm each participant’s local update, and the central server determines each participant’s update score. Once a certain qualifying update threshold is reached, the central server aggregates them into a new global model. Training is repeated until it converges or the accuracy of the model reaches a predetermined threshold.
The reputation value (R-score) of each participant in the model training is determined by a dual subjective logic model, which is used to validate each participant’s gradient updates. Each iteration’s participant model updates are verified by a test set, and the quality of their uploaded parameters (Q-score) is directly measured by using the accuracy results of the test. The participants’ R-score and qualitative Q-score are combined to produce the final update score, which also incorporates the effect of the time element.
The R-score attempts to assess the participants’ Credibility. First, it is determines whether the model updates uploaded by each participant in each iteration are beneficial to the overall model. This is the most directly relevant question at hand. Credibility, implausibility, and uncertainty are three vectors that are used to quantify and describe the impact.
In the subjective logic model, the R-score of the central server
The subjective logic model was then used to construct R-scores for the federated learning participants [33].
By establishing particular criteria, the central server confirms the dependability of the local model updates uploaded by the participant
These vectors can generate a reputation value that quantifies the credibility of the participants:
Among them
It also considers the effect of time, since federated learning participants are not always trustworthy, and the more recent the interaction event, the greater the impact on the reputation score. Define a freshness fading function to describe how events affect reputation:
Therefore, the final R-score is expressed as:
The direct quality and the interaction time are taken into account when calculating the Q-score. The direct quality is the accuracy rate
where
Participants’ Q-scores fluctuated throughout the interaction time, which was determined in the same way as the R-score. Therefore, the Q-score is updated to:
The acquired Q-score is then expressed as:
The current update score for the federated learning participant
where
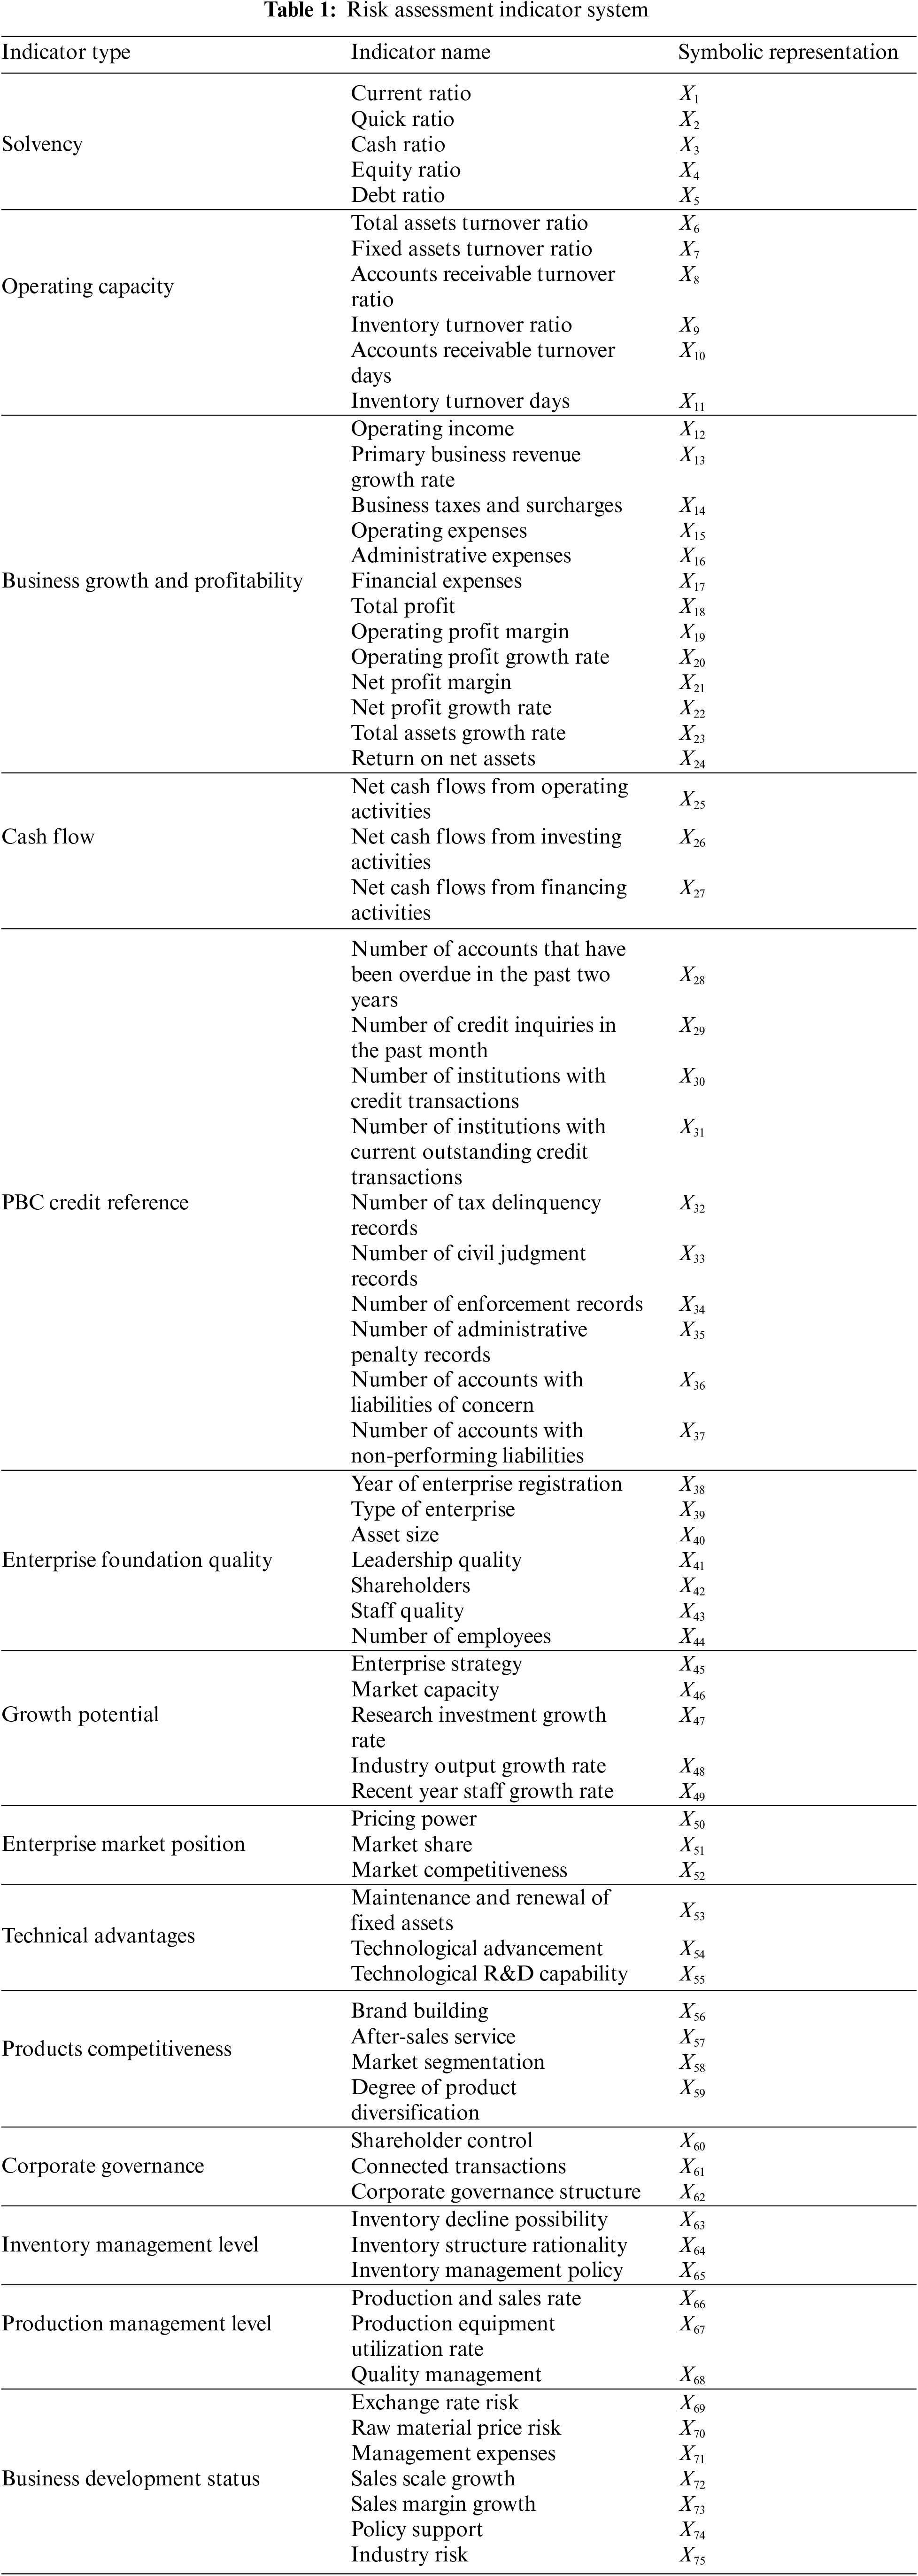
The research subject uses actual enterprise credit data given by a regional branch of the Industrial and Commercial Bank of Lianyungang City to confirm the performance of the proposed model. The time period is from 2018.06 to 2020.06. It includes numerous financial and non-financial characteristics of the lending company and the related evaluation findings. The average loan period is 6 months. Table 1 lists the credit evaluation indicators. 170 corporate loan data points were ultimately selected, including 37 non-performing loans and 133 regular loans, because data security necessitates desensitization of some indicators.
Precision, Recall, F1 score, KS value, and AUC are chosen as the model evaluation indicators during the feature selection procedure. The KS value is the degree of separation employed in the model to discriminate between positive and negative data for prediction, and a higher KS value indicates a stronger ability to discriminate.
where
4.2 Identification of Credit-Related Factors
To begin with, the data gathered from the power system is dedimensionalized using the PCA algorithm. The enterprise electricity consumption data used includes voltage level
The original data sets were standardized using the corresponding principal component analysis function in MATLAB software, and then PCA was applied to the matrix consisting of the 14 indicators of the power data. Table 2 displays the results of the analysis.
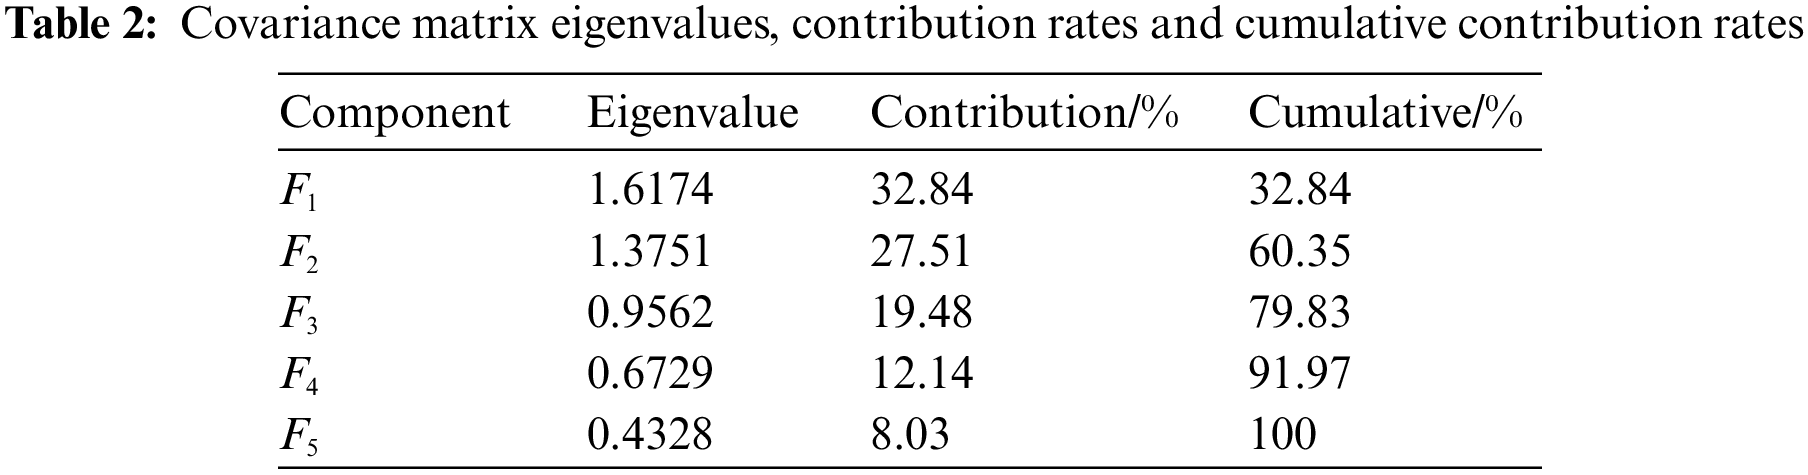
The rule of the cumulative contribution of 90% or more was used to calculate the number of major components. The number of major components is five, as shown in Table 2. From the characteristic roots and contribution rates of the principal components, it can be seen that the characteristic root
Through the analysis of the above principal component factors, it is found that: In the principal component
Second, based on the obtained internal bank data set, the mRMR algorithm is applied to extract characteristics from the information of the borrowing companies and select the indicators that can most comprehensively reflect the financial status of the companies to construct the mRMR feature set. After obtaining the pre-selected feature set using the mRMR-PCA hybrid feature selection algorithm suggested in this research, the important measure of the feature variables is then measured by the XGBoost model. The experiment uses ten-fold cross-validation to determine the optimal parameters of the XGBoost model. The following parameters have been set:
The pre-selected feature set is fed into the XGBoost model, and the best feature set is selected using the AUC, an assessment metric for the binary classification model. Fig. 2 depicts the relationship between feature dimension
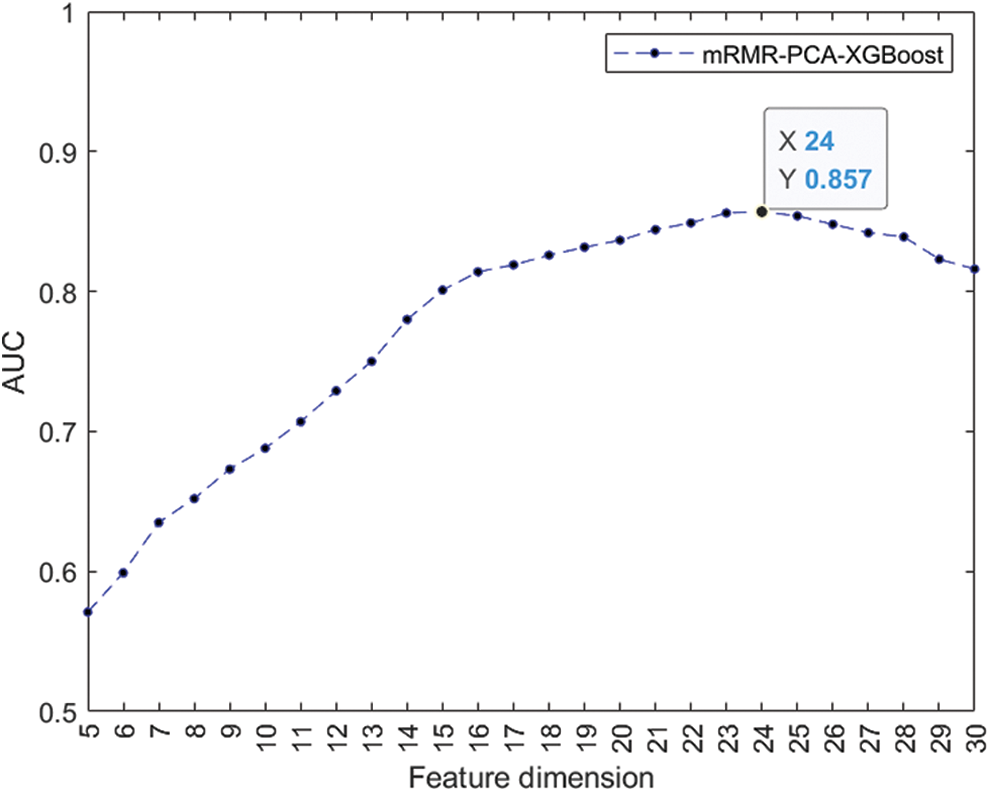
Figure 2: Variation of AUC with feature dimension
In this research, RF and LR are used as controls to indicate the ability of the XGBoost model to identify the best set of features for corporate credit scoring via the feature significance ranking approach. After model training, both classifiers can produce feature significance rankings. The current data sets are randomly sampled into training and test sets, and seventy percent of the data sets are fed into LR, RF, and XGBoost to train the models. Then, the trained models are used to predict the default cases of the test set samples, and the evaluation indicators for the three models under each sample set are recorded. Table 3 shows the final results.
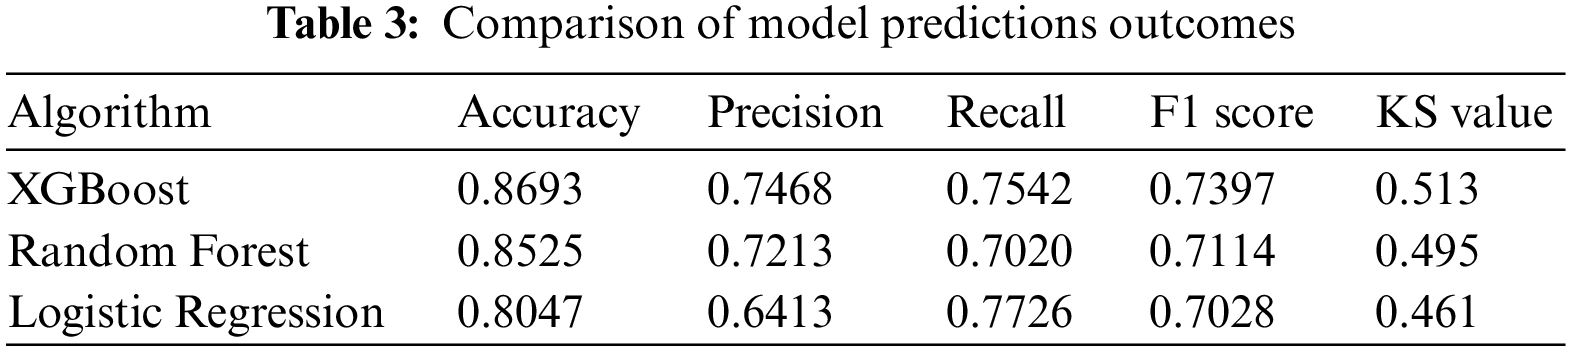
Table 3 suggests that the XMP feature selection method outperforms the RF and LR models in terms of accuracy, precision, and F1 score. The KS value demonstrates that the XGBoost model is more effective than RF and LR in distinguishing between positive and negative samples, and it has a higher degree of discrimination in judging whether a user is in default or not. The comprehensive analysis above shows that the XMP feature selection algorithm performs well.
4.3 Credit Evaluation Model Prediction
The credit assessment model for MSEs based on the SecureBoost algorithm is built using the 24 features of the most optimal collection after screening the indicators using the feature selection method provided in this study. The probability of customer default is predicted using the model from this study as well as the conventional credit risk prediction methods employed by commercial banks and the current methodologies RF [34] and LS-SVM [35]. The prediction results are displayed in Fig. 3.
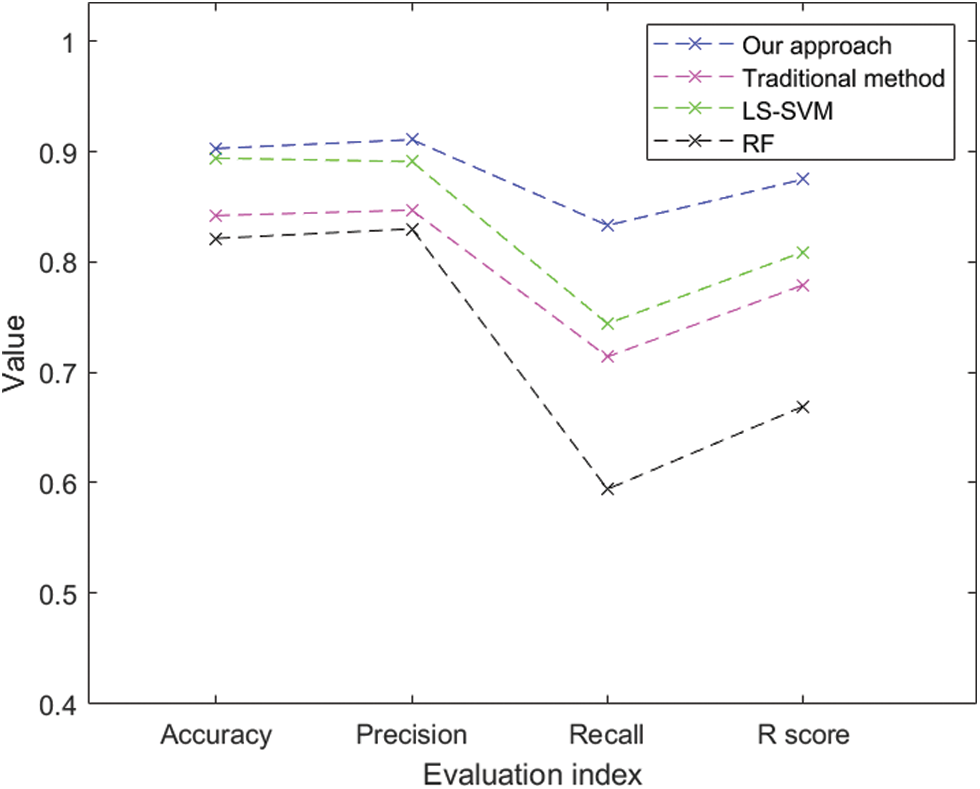
Figure 3: Performance comparison of various models for credit assessment
The experiments suggest that the model proposed in this research has a superior predictive ability than the established credit risk prediction techniques. The higher recall rate shows that the model is more effective in identifying defaulters. The higher recall rate and accuracy of the proposed model for high-risk enterprise samples showed the validity of the credit risk assessment model we developed for the joint modeling of electricity data, bank data, and enterprise credit data.
The results of comparing the suggested model with the traditional federated learning framework [36] are shown in Fig. 4. It can be observed that there isn’t any discernible difference in the overall accuracy between the model which is trained by the scheme proposed in this paper and the typical federated learning scheme. However, the local update screening strategy proposed in this research, which selects trustworthy and high-quality model parameters for aggregation each time, can significantly improve the efficiency of federated learning iterations.
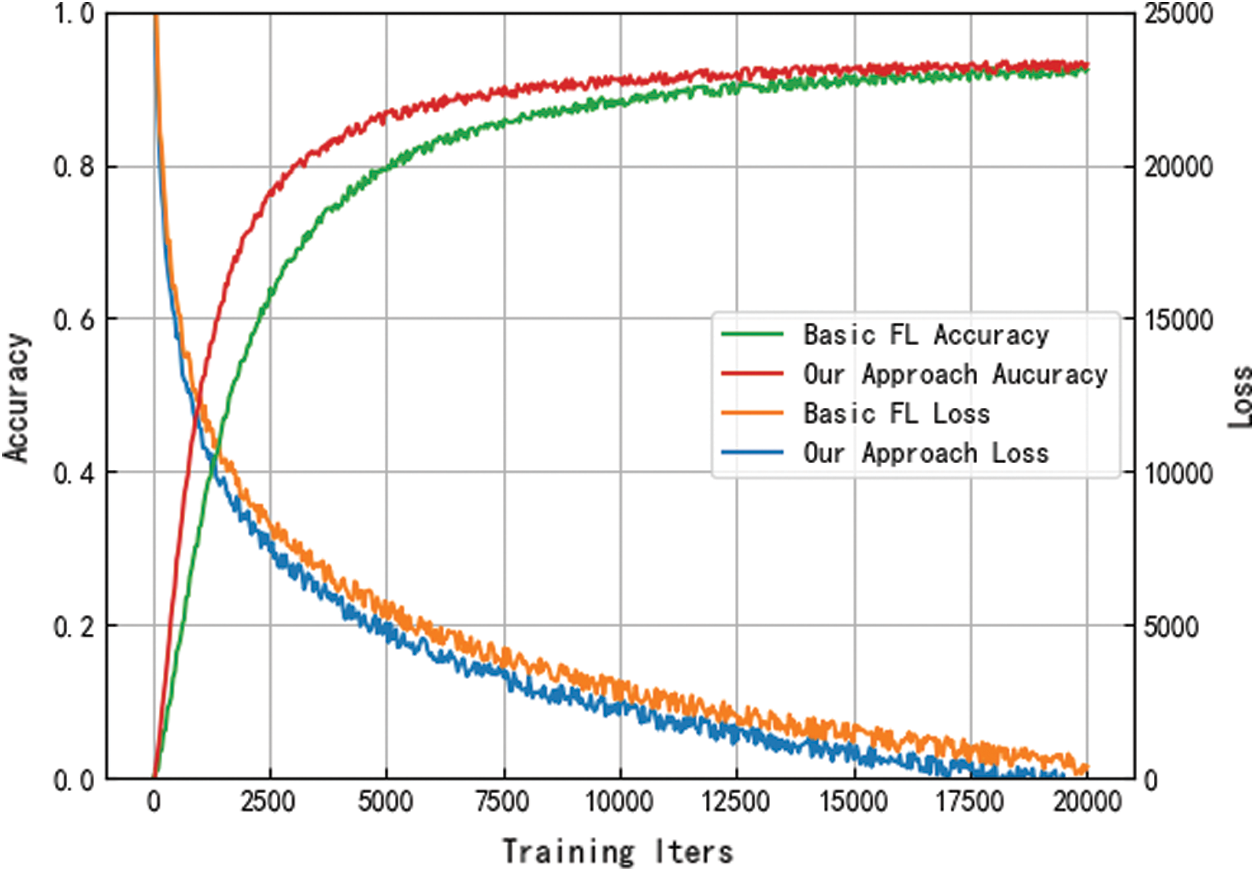
Figure 4: Variation of model accuracy and loss function with the round of iterations
The analysis is conducted by contrasting the actual lending business models of commercial banks, which helps to further demonstrate the effectiveness of the proposed model in predicting the credit rating of lending firms. Ten-fold cross-validation was employed numerous times and the following parameters have been set:
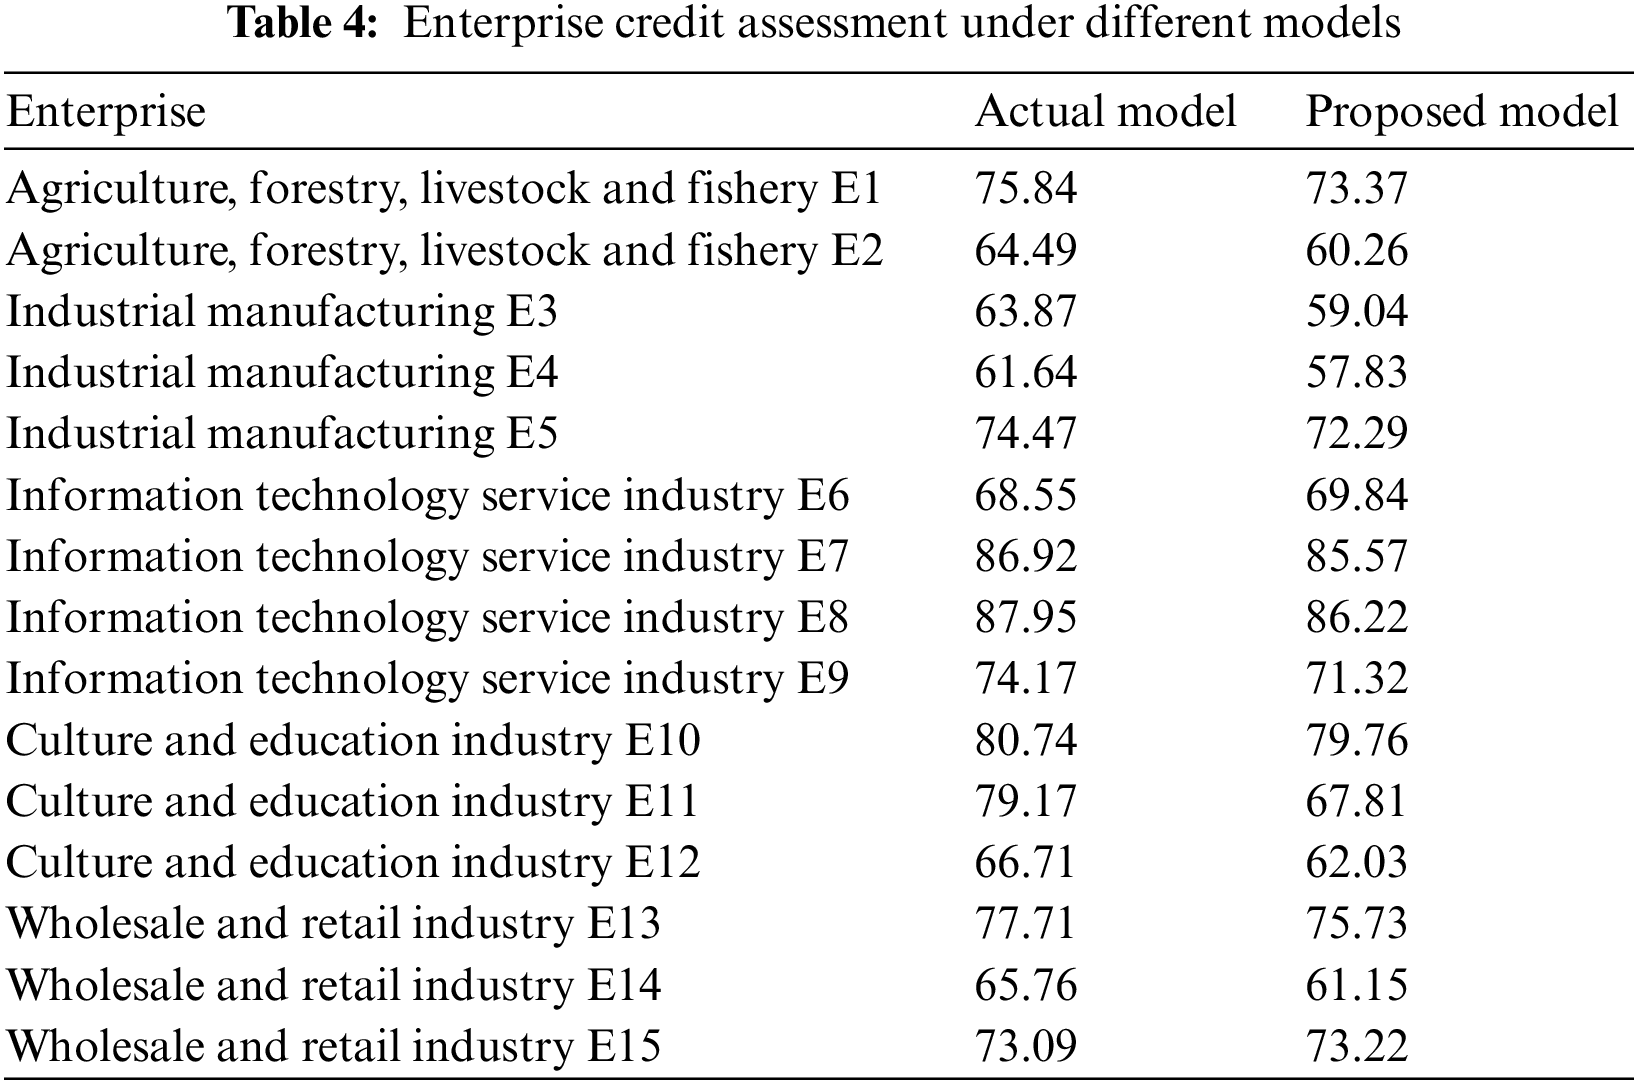
As shown in Table 4, the proposed model and the actual model’s enterprise credit scores are generally consistent in ranking, indicating that the enterprise credit rating predicted by the model in this work is relatively objective. For the default samples of E3 and E4, we found through the subsequent empirical study, we found that the two enterprises’ own market competitiveness and technological progress are lower than the same level in the industry, and the electricity consumption stability factor is relatively low. The XMP feature selection integrates enterprise power consumption factors, so the credit scores of the above enterprises are lower than the traditional method. For the defaulting enterprises E2 and E14, the proposed model also identifies them well and assigns a relatively low credit score.
For commercial banks, effective prediction of enterprise credit risk is a crucial issue for efficient credit operations. Through the above analysis, the proposed model can provide more accurate results on the credit risk assessment of MSEs and effectively discriminate the risks.
This paper develops a privacy preserving credit risk assessment model for MSEs based on the currently popular federated learning to address the issues of bank-enterprise information asymmetry and weak risk identification in the credit scenario of MSEs. For the model aggregation phase, we propose a global model update strategy that can filter high-quality local models. For the feature selection phase, we provide the XMP feature selection algorithm appropriate for corporate credit scenarios. Through the empirical analysis, the results illustrate that the credit risk assessment model for MSEs proposed in this research, which is based on federated learning and feature selection, achieves a higher accuracy rate while protecting the privacy of each participant. The results of this research will serve as a reference for commercial banks in developing a credit risk assessment system, and for electric power companies in deriving value from data related to marketing.
Federated learning and blockchain have a common application foundation, and a trusted network of multi-party cooperation is realized through technical consensus, which has good complementarity. Future related work will further integrate federated learning with blockchain and design a more complete federated learning mechanism that protects user privacy. This will help solve the problem of single point dependency and contribution allocation in federated learning. This work will also explore business innovation scenarios that are broadly applicable to different industries while fully exploiting the value of data.
Acknowledgement: We appreciate NUIST providing us with the chance to carry out this research.
Funding Statement: This research was funded by the State Grid Jiangsu Electric Power Company (Grant No. JS2020112) and the National Natural Science Foundation of China (Grant No. 62272236).
Conflicts of Interest: The authors declare that they have no conflicts of interest to report regarding the present study.
References
1. N. Gulsoy and S. Kulluk, “A data mining application in credit scoring processes of small and medium enterprises commercial corporate customers,” Wiley Interdisciplinary Reviews: Data Mining and Knowledge Discovery, vol. 9, no. 3, pp. e1299, 2019. [Google Scholar]
2. X. Wang and J. Zhang, “On the bank credit rationing and loan of small and medium-sized enterprises,” Economic Research Journal, vol. 4, no. 7, pp. 68–75, 2003. [Google Scholar]
3. T. X. Sheng and C. L. Fan, “Fintech, optimal banking market structure, and credit supply for SMEs,” Journal of Financial Research, vol. 480, no. 6, pp. 114–132, 2020. [Google Scholar]
4. X. Huang, X. Liu and Y. Ren, “Enterprise credit risk evaluation based on neural network algorithm,” Cognitive Systems Research, vol. 32, no. 1, pp. 317–324, 2018. [Google Scholar]
5. P. Golbayani, D. Wang and I. Florescu, “Application of deep neural networks to assess corporate credit rating,” arXiv preprint arXiv:2003.02334, 2020. [Google Scholar]
6. Y. Xia, C. Liu, Y. Li and N. Liu, “A boosted decision tree approach using bayesian hyper-parameter optimization for credit scoring,” Expert Systems with Applications, vol. 78, pp. 225–241, 2017. [Google Scholar]
7. Y. Zhang, G. Chi and Z. Zhang, “Decision tree for credit scoring and discovery of significant features: An empirical analysis based on Chinese microfinance for farmers,” Filomat, vol. 32, no. 5, pp. 1513–1521, 2018. [Google Scholar]
8. J. Sun, J. Lang, H. Fujita and H. Li, “Imbalanced enterprise credit evaluation with DTE-SBD: Decision tree ensemble based on SMOTE and bagging with differentiated sampling rates,” Information Sciences, vol. 425, no. 4, pp. 76–91, 2018. [Google Scholar]
9. A. Mehmood, I. Natgunanathan, Y. Xiang, G. Hua and S. Guo, “Protection of big data privacy,” IEEE Access, vol. 4, no. 4, pp. 1821–1834, 2016. [Google Scholar]
10. C. P. Ge, W. Susilo, J. Baek, Z. Liu, J. Y. Xia et al., “A verifiable and fair attribute-based proxy re-encryption scheme for data sharing in clouds,” IEEE Transactions on Dependable and Secure Computing, vol. 21, no. 7, pp. 1–12, 2021. [Google Scholar]
11. Y. Ren, K. Zhu, Y. Q. Gao, J. Y. Xia, S. Zhou et al., “Long-term preservation of electronic record based on digital continuity in smart cities,” Computers, Materials & Continua, vol. 66, no. 3, pp. 3271–3287, 2021. [Google Scholar]
12. K. A. Houser and W. G. Voss, “GDPR: The end of Google and Facebook or a new paradigm in data privacy,” Rich JL & Tech, vol. 25, no. 3, pp. 1, 2018. [Google Scholar]
13. J. Konečný, H. B. McMahan, D. Ramage and P. Richtárik, “Federated optimization: Distributed machine learning for on-device intelligence,” arXiv preprint arXiv:1610.02527, 2016. [Google Scholar]
14. J. Konečný, H. B. McMahan, F. X. Yu, P. Richtárik, A. T. Suresh et al., “Federated learning: Strategies for improving communication efficiency,” arXiv preprint arXiv:1610.05492, 2016. [Google Scholar]
15. B. W. Chi and C. C. Hsu, “A hybrid approach to integrate genetic algorithm into dual scoring model in enhancing the performance of credit scoring model,” Expert Systems with Applications, vol. 39, no. 3, pp. 2650–2661, 2012. [Google Scholar]
16. S. Jones, D. Johnstone and R. Wilson, “An empirical evaluation of the performance of binary classifiers in the prediction of credit ratings changes,” Journal of Banking & Finance, vol. 56, no. 11, pp. 72–85, 2015. [Google Scholar]
17. S. Jones, D. Johnstone and R. Wilson, “Predicting corporate bankruptcy: An evaluation of alternative statistical framework,” Journal of Business Finance & Accounting, vol. 44, no. 1–2, pp. 3–34, 2017. [Google Scholar]
18. C. Nguyen, “The credit risk evaluation models: An application of data mining techniques,” in Proc. SAIS, Georgia, USA, pp. 36, 2019. [Google Scholar]
19. H. Li, Y. Cao, S. Li, J. Zhao and Y. Sun, “XGBoost model and its application to personal credit evaluation,” IEEE Intelligent Systems, vol. 35, no. 3, pp. 52–61, 2020. [Google Scholar]
20. Y. X. Yang and W. J. Pang, “The development status, problems and countermeasures of big data credit investigation industry in China,” Credit Reference, vol. 38, no. 2, pp. 49–52, 2020. [Google Scholar]
21. M. Ala’raj and M. F. Abbod, “A new hybrid ensemble credit scoring model based on classifiers consensus system approach,” Expert Systems with Applications, vol. 64, pp. 36–55, 2016. [Google Scholar]
22. W. Zhang, H. He and S. Zhang, “A novel multi-stage hybrid model with enhanced multi-population niche genetic algorithm: An application in credit scoring,” Expert Systems with Applications, vol. 121, pp. 221–232, 2019. [Google Scholar]
23. L. X. Cui, L. Bai, Y. C. Wang, X. Jin and E. R. Hancock, “Internet financing credit risk evaluation using multiple structural interacting elastic net feature selection,” Pattern Recognition, vol. 114, pp. 107835, 2021. [Google Scholar]
24. G. R. Chen, M. R. Mu and R. Zhang, “Realization of communication fraud identification model based on federated learning,” Telecommunications Science, vol. 36, no. S1, pp. 304–310, 2020. [Google Scholar]
25. P. Xu, J. J. He and X. Y. Yue, “Study on management model of prevention and control of new coronary pneumonia (COVID-19) in colleges and universities based on marginal learning and federal learning,” Forum on Contemporary Education, vol. 19, no. 2, pp. 76–82, 2020. [Google Scholar]
26. L. Z. Zheng, “The exploration of data security based on federal learning in banking,” China Financial Computer, vol. 20, no. 9, pp. 22–26, 2020. [Google Scholar]
27. C. K. Wang and J. Feng, “An applied study of federal learning in the insurance industry,” Journal of Vocational Insurance College, vol. 34, no. 1, pp. 13–17, 2020. [Google Scholar]
28. K. Cheng, T. Fan, Y. Jin, Y. Liu, T. Chen et al., “Secureboost: A lossless federated learning framework,” IEEE Intelligent Systems, vol. 36, no. 6, pp. 87–98, 2021. [Google Scholar]
29. H. Peng, F. Long and C. Ding, “Feature selection based on mutual information criteria of max-dependency, max-relevance, and min-redundancy,” IEEE Transactions on Pattern Analysis and Machine Intelligence, vol. 27, no. 8, pp. 1226–1238, 2005. [Google Scholar] [PubMed]
30. S. Wold, K. Esbensen and P. Geladi, “Principal component analysis,” Chemometrics and Intelligent Laboratory Systems, vol. 2, no. 1–3, pp. 37–52, 1987. [Google Scholar]
31. C. Gentry, “Fully homomorphic encryption using ideal lattices,” in Proc. of the Forty-first Annual ACM Symp. on Theory of Computing, Maryland, USA, pp. 169–178, 2009. [Google Scholar]
32. Z. Brakerski, “Fully homomorphic encryption without modulus switching from classical GapSVP,” in Annual Cryptology Conf., Berlin, Heidelberg, Springer, pp. 868–886, 2012. [Google Scholar]
33. Y. L. Lu, X. H. Huang, Y. Y. Dai, S. Maharjan and Y. Zhang, “Blockchain and federated learning for privacy-preserved data sharing in industrial IoT,” IEEE Transactions on Industrial Informatics, vol. 16, no. 6, pp. 4177–4186, 2019. [Google Scholar]
34. W. Y. Qiu, S. W. Li, Y. M. Cao and L. Hua, “Credit evaluation ensemble model with self-contained shunt,” in 2019 5th Int. Conf. on Big Data and Information Analytics (BigDIA), Kunming, China, IEEE, pp. 59–65, 2019. [Google Scholar]
35. F. T. Wang, L. H. Ding, H. X. Yu and Y. J. Zhao, “Big data analytics on enterprise credit risk evaluation of e-Business platform,” Information Systems and e-Business Management, vol. 18, no. 3, pp. 311–350, 2020. [Google Scholar]
36. B. McMahan, E. Moore, D. Ramage, S. Hampson and B. A. Arcas, “Communication-efficient learning of deep networks from decentralized data,” Artificial Intelligence and Statistics. PMLR, vol. 54, pp. 1273–1282, 2017. [Google Scholar]
Cite This Article
 Copyright © 2023 The Author(s). Published by Tech Science Press.
This work is licensed under a Creative Commons Attribution 4.0 International License , which permits unrestricted use, distribution, and reproduction in any medium, provided the original work is properly cited.
 Downloads
 Citation Tools