
 Submit a Paper
 Propose a Special lssue
 Open Access
ARTICLE

Container-Based Internet of Vehicles Edge Application Migration Mechanism
State Key Laboratory of Networking and Switching Technology, Beijing University of Posts and Telecommunications, Beijing, 100876, China
* Corresponding Author: Shihan Tian. Email:
Computers, Materials & Continua 2023, 75(3), 4867-4891. https://doi.org/10.32604/cmc.2023.038280
Received 06 December 2022; Accepted 13 February 2023; Issue published 29 April 2023
 View Full Text
 Download PDF
Abstract
Internet of Vehicles (IoV) applications integrating with edge computing will significantly drive the growth of IoV. However, the contradiction between the high-speed mobility of vehicles, the delay sensitivity of corresponding IoV applications and the limited coverage and resource capacity of distributed edge servers will pose challenges to the service continuity and stability of IoV applications. IoV application migration is a promising solution that can be supported by application containerization, a technology forseamless cross-edge-server application migration without user perception. Therefore, this paper proposes the container-based IoV edge application migration mechanism, consisting of three parts. The first is the migration trigger determination algorithm for cross-border migration and service degradation migration, respectively, based on trajectory prediction and traffic awareness to improve the determination accuracy. The second is the migration target decision calculation model for minimizing the average migration time and maximizing the average service time to reduce migration times and improve the stability and adaptability of migration decisions. The third is the migration decision algorithm based on the improved artificial bee colony algorithm to avoid local optimal migration decisions. Simulation results show that the proposed migration mechanism can reduce migration times, reduce average migration time, improve average service time and enhance the stability and adaptability of IoV application services.Keywords
The Internet of Vehicles (IoV) is widely regarded as a key component of the future intelligent transportation system. It supports a variety of application services (broadcasting, navigation, road condition warning, etc.), which can greatly enhance the urban transportation intelligence, relieve traffic pressure and reduce potential traffic safety risks. With growing vehicle users and massive access to new IoV apps, there is a dramatic rise in demand for the abilities of data communication and computation in IoV. As most IoV apps are delay-sensitive, a large number of decisions need to be made in real-time, and users need to access and utilize closer computing and storage resources [1,2]. Edge computing has gotten a lot of attention in delay-sensitive IoV apps as it saves processing time and improves efficiency by running apps or performing partial computations close to the service terminals [3]. However, the limited communication coverage of the distributed and fixed located edge servers makes it hard to provide continuous services from a single edge server for the low-delay IoV apps carried by high-speed vehicles. Furthermore, the limited resource capacity of each edge server makes it hard to guarantee high concurrent application services for multiple vehicles at the same time. Therefore, edge computing-based IoV apps encounter the service continuity and stability challenges.
IoV application migration, enabling IoV apps to migrate from one edge server to the next within the low delay constraints, will be a feasible and inevitable solution to address the above challenges. The hosting application components [4], commonly including virtual machines (VMs), containers and agents, are mainly utilized to implement edge-side application migration. High migration efficiency is necessary since the migration process involves frequent data caches and resource interactions between different edge servers. A ready-made agent framework is yet to be available as the agent is still in the early development stage. Moreover, VMs must adapt to the operating system, which will increase the switching delay while transmitting a large amount of data in the migration process. The excellent features of the container, such as application resource encapsulation, heterogeneous edge server resource shielding and agile start/stop operations, exactly support rapid seamless application migration without user perception in the case of interacting with a small amount of data.
Container-based IoV application migration is to stop the app running in the container of the source server, then save the application context data, and transmit it to a container with the equal capability of the migration target server to continue running this app. The limited coverage of the edge server makes it necessary to stop running and request a migration before the vehicle leaves the coverage area. In addition, the limited resource of the edge server makes it necessary to weigh the application load on candidate target servers to determine whether there are enough container resources to restart the app within the tolerance time range under user no-perception. In essence, container-based IoV application migration needs to solve the issues of when to migrate (migration trigger determination) and where to migrate (migration target decision), that is, how to migrate (migration mechanism).
There are two main migration trigger types involved in current research: Cross-Border Migration (CBM) [3–10] triggered by the vehicle moving out of the edge server coverage, and Service Degradation Migration (SDM) [5], [11–15] triggered by the edge server application support capability degradation.
Fig. 1 shows a container-based IoV edge application migration scenario. Containers are utilized to host apps on edge servers (ES), connected vehicles obtain application services by accessing nearby edge servers, and the service domain coverage and resource capacity of each edge server are limited. The scenarios for these two migration trigger types are described as follows.

Figure 1: Container-based IoV edge application migration scenario
CBM: when the connected vehicle A is about to leave the service domain of the edge server
SDM: when the vehicle A is driving in the service domain of
When the migration is triggered, a new edge server needs to be decided as the migration target, and then the vehicle will obtain services again by accessing the target edge server. Current solutions to the IoV edge application migration decision problem are relatively few and simple. Reference [3] proposed that application data can be cached to all edge nodes that may be reached to ensure the service continuity, but leading to high implementation cost and low resource utilization. Reference [5,16] only considered the distance factor in migration decisions but ignored other influencing factors such as the resource status, typically resulting in more additional migrations. Reference [17] proposed to optimize the migration cost through the greedy algorithm, but it tends to fall into the local optimum and has poor overall performance in the long term. Reference [18] proposed a mobility-aware pre-migration strategy based on Lyapunov, it considered migration accuracy, load balance and migration efficiency from factors such as vehicle trajectory prediction and nearby edge server resource constraints, thus striking a good balance between minimizing the migration cost and losing the service continuity, but it lacks consideration of the stability and adaptability of migration decisions in various migration scenarios. Therefore, it is necessary to study a more accurate, efficient, highly-adaptive, and globally-optimal migration decision strategy.
To this end, this paper adopts the “When-Where-How” 3-step decision mindset to study the container-based IoV edge application migration mechanism. The main contributions are as follows:
1) Migration trigger determination algorithm based on trajectory prediction and traffic awareness is designed respectively for CBM and SDM to improve the accuracy of the trigger determination.
2) Migration target decision calculation model oriented to minimize the average migration time and maximize the average service time is constructed, which optimizes the accuracy of migration target decisions while reducing migration times and improving the stability and adaptability of migration decisions.
3) Migration decision algorithm based on the improved artificial bee colony algorithm is proposed, where the fitness function and search update method are modified to reduce the possibility of optimal local decisions. Simulation results show that the algorithm can reduce the average migration time and migration times, improve the average service time, and enhance the stability and adaptability of IoV application services.
The rest of this paper is organized as follows. Section 2 reviews the related works. Section 3 presents the migration trigger determination algorithm. Section 4 constructs the migration target decision calculation model. Section 5 proposes the migration decision algorithm. Section 6 shows the simulation results and analysis. Section 7 draws the conclusion.
This section introduces the research backgrounds, existing solutions in the field and the overall research process of this paper.
Edge Computing in IoV: With the dramatic increase in demand for massive real-time decisions and strong process abilities in urban vehicle networks nowadays, some studies [3,5] suggest it is more beneficial to process the computation at the edge of networks owing to the cooperability, proximity to terminals and dense distribution of edge devices, where the network edge components are typically located on cellular base transceiver stations (BTSs) or roadside units (RSUs) [19]. Edge computing helps to overcome the contradiction between limited resources and heavy computing tasks of some terminals (e.g., Global Positioning System (GPS) devices) [20], thus helping to reduce the data transmission cost and improve the process efficiency in distributed vehicle task processing scenarios [21]. Recently, several countries [22–24] have already deployed their joint projects of edge computing and IoV in practical field tests.
Container in Edge IoV: Hosting applications via VMs or containers is a common means to improve the efficiency of task execution and switching for edge computing nodes [25]. VM is the most common way in the early years, but it will lead to higher deployment delays and resource consumption relatively when hosting edge-side services, and most IoV terminal devices still lack the resource ability to support efficient downloads and startups of heavy VMs [26]. Recently, some studies [9,27–29] suggest that the container is more suitable to deploy on edge platforms than the VM due to the features of lightweight, isolation and agility, and it has more potential to enable seamless service migration across edge servers without user perception. Many institutions have successfully designed and deployed their containerized edge computing platforms for IoV, such as the CUTE from Shenzhen University [30] and the Connected Vehicle Platform from Google [31], and verified the benefits of containers applied to edge IoV.
2.2 Solutions to IoV Edge Application Migration
When applying edge computing to IoV, the contradiction between the high-speed vehicles carrying delay-sensitive IoV apps and the distributed edge servers with limited communication coverage and limited resource capacity triggers the demand for IoV edge application migration. This migration issue should be divided into 3 sub-issues: migration trigger determination, migration target decision, and migration optimization mechanism.
For the first sub-issue, the movement of the vehicle [32] and the service density of the current server [33] are generally considered to be the key trigger conditions.
For the second sub-issue, the suitability of the candidate target servers should be comprehensively weighed by some factors such as the vehicle moving direction, migration cost, user Quality of Service (QoS), reliability, migration frequency, and resource status [7,32,34–36]. For example, the source server should negotiate with target servers before migrations to determine whether there is enough processing power and storage space, if not, other running containers may be paused or stopped depending on priority to make room [35]. Reference [37] selects target servers based on the user’s moving speed and the delay requirements of the offloading tasks.
For the third sub-issue, the reliable optimization goal is generally to reduce the average total cost. For example, Reference [38] proposes a migration scheme based on the local dynamic optimal algorithm, aiming to optimize the average delay of multiple services with different QoS. Reference [39] proposes a load-balancing optimization scheme to reduce the total response time of IoV apps. Reference [34] evaluates three service migration schemes in terms of the end-to-end delay, reliability, migration time and frequency: no service migration, service migration triggered by VM handover, and QoS-aware service migration. Reference [36] proposes a four-stage loop migration framework: monitor-analyze-plan-execute. Reference [6] models the container migration strategy as a multi-dimensional Markov decision process (MDP) space and utilizes the deep learning algorithm to make decisions rapidly, aiming to reduce the delay, computation consumption and migration cost.
The above research reveals the challenges in the IoV edge application migration scenario and proposes corresponding solutions. However, some studies are not comprehensive and detailed enough to describe their migration mechanisms. Therefore, it is necessary to further study the migration mechanism in the IoV edge application migration scenario.
The main contribution and overall research process of this paper is shown in Fig. 2.

Figure 2: The overall research process
3 Migration Trigger Determination Algorithm
In this section, this paper proposes the migration trigger determination algorithm to answer when to migrate. To describe trigger conditions conveniently, this paper sets all models to be based on the two-dimensional plane road scenes, covered densely and seamlessly by edge servers, then defines the following variables.
3.1 CBM Trigger Determination Algorithm Assisted by Trajectory Prediction
This section discusses a trajectory prediction method first and then brings out the CBM trigger determination process based on that.
The moving directions of vehicles on urban roads are variable, especially at crossroads, there are four possible directions: straight ahead, left turn, right turn and U-turn. The vehicle trajectory is a key condition in the CBM trigger determination process. However, the possible measurement errors and determination delays for trigger distance, driving trend and direction change in the driving process may cause higher risks of misjudgments or redundant migrations. To improve the accuracy and timeliness of determinations and reduce error or unnecessary migrations, this paper utilizes trajectory prediction results trained by the long short-term memory (LSTM) model [40] to help CBM trigger determination.
In the LSTM model, the input data is historical trajectories of the object vehicle in the past few seconds, and the output data is predicted trajectories in the next few seconds. As the future trajectory of the object vehicle
• Step 1: Preliminarily predict trajectories of
• Step 2: Evaluate impacts of the spatial interaction between
• Step 3: Weighted correct the above predicted trajectories
3.1.2 CBM Trigger Determination Process
The CBM trigger determination process is shown in Fig. 3. The steps of Algorithm 1 (CBM trigger determination algorithm) are as follows:
• Step 1: Determine whether the vehicle has arrived near the current service domain border. If
• Step 2: Identify the road property.
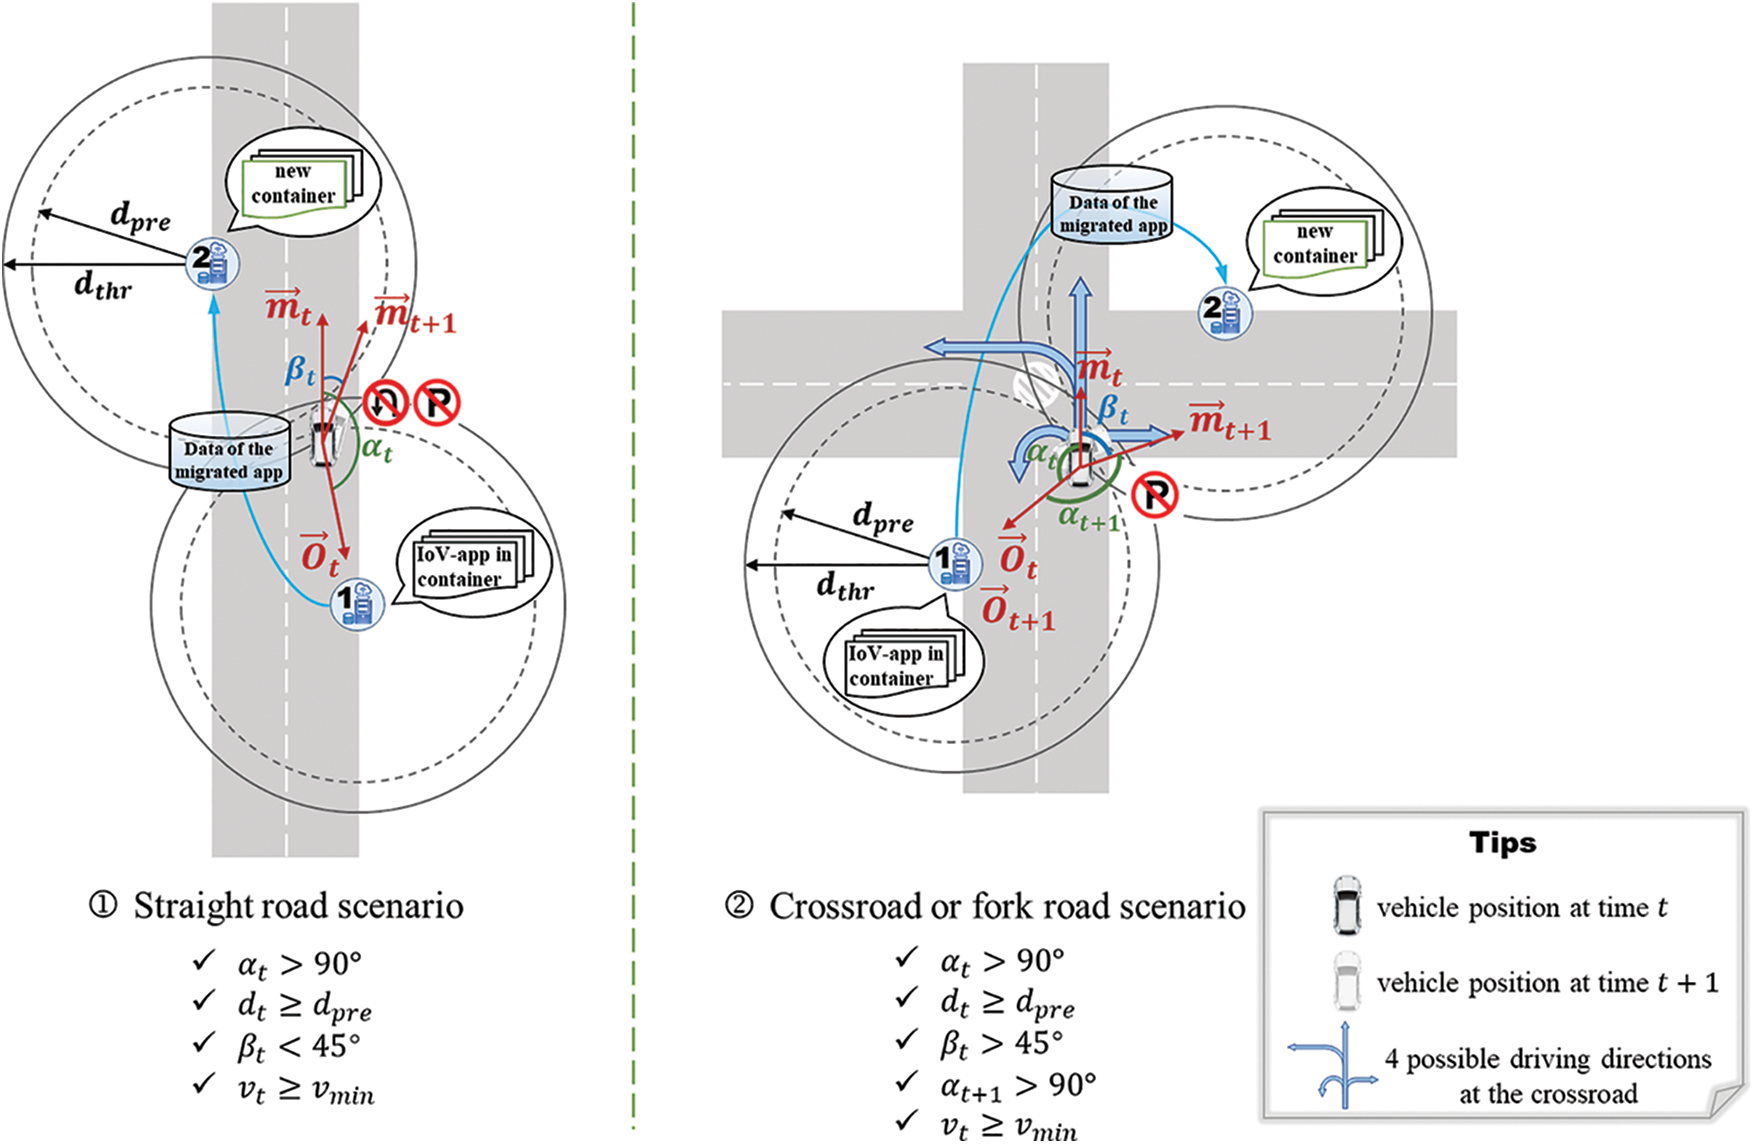
Figure 3: CBM trigger determination process
If
Note: the road property is only for model analysis and sometimes may differ from actual roads. For example, if the vehicle drives straight on a cross or fork road, it can be analyzed as a straight road; similarly, if the vehicle turns around on a straight road, it can be analyzed as a cross or fork road.
Significantly, the direction change behaviors that occur near the current service domain border, which may cause a mutation in
• Step 3: Determine whether the vehicle maintains leaving the current service domain.
If
• Step 4: Determine whether the vehicle maintains a normal driving status.
If
3.2 SDM Trigger Determination Algorithm Based on Traffic Awareness
This section discusses a traffic awareness method first and then brings out the SDM trigger determination process.
The traffic of each edge server on urban roads is variable, especially around the commonly congested roads with heavy traffic flow where high traffic concurrency is prone to occur on edge servers, thus easily leading to traffic surged or crowded. The real-time traffic status on edge servers is a key condition in the SDM trigger determination process. However, along with the fast traffic in-out flows, the possible measurement errors and determination delays for real-time traffics may cause higher risks of misjudged migrations or service degradation. To improve the accuracy and timeliness of determinations, this paper introduces a traffic-aware method [41] to help SDM trigger determination.
First, define the traffic status factor as
3.2.2 SDM Trigger Determination Process
The SDM trigger determination process is shown in Fig. 4. The steps of Algorithm 2 (SDM trigger determination algorithm) are as follows:
• Step 1: Determine whether the traffic on
If
• Step 2: Determine the scope of target applications to be migrated according to the traffic load.

Figure 4: SDM trigger determination process
If
If

4 Migration Target Decision Calculation Model
In this section, this paper constructs the migration target calculation model to answer where to migrate. The key is to clarify decision factors and optimization goals. As mentioned in Section 2, current research regards migration time and energy consumption as major decision factors involved in the application migration problem. Since it is relatively easy to replenish energy in IoV edge computing scenarios, this paper focuses more on reducing time than saving energy during designing decision factors and optimization goals. Of course, it’s not enough to only rely on migration time.
Suppose the edge server quantities in the map area to be
Since the source server usually has more than one candidate target server, and the small gap between migration time from the source server to each candidate target server is typically at the millisecond level, moreover, where different candidate target servers may even have equal migration time. Therefore, this paper can’t distinguish the pros and cons degree of different migration targets just depending on migration time alone.
Migration time can be regarded as a cost metric to measure the consumption level of different migration target decisions, while the consumption level is almost equal, there is a need for a reward metric such as service time in each candidate target server for an additional evaluation to measure the sustainability level of different migration target decisions. That means the evaluation criteria should be composed of two decision factors (migration time and service time) and a two-objective optimization problem should be formed to achieve the Pareto optimal solution.
4.1 Decision Factors: Migration Time and Service Time
This section discusses respectively how to measure the two decision factors: migration time as a cost metric and service time as a reward metric.
This paper summarizes the migration time components and their calculation equations by splitting and analyzing the migration process, then determines the impact of each part on migration decisions. As shown in Fig. 5, the container-based IoV edge application migration process will go through 8 steps, which are: ① Freeze the container and hold the state on the source server; ② Create a new container on the target server; ③ Queuing for transmission on the source server; ④ Transmit data from the source server to the target server; ⑤ Queuing for computation on the target server; ⑥ Compute and process the data of this application; ⑦ Connect the vehicle to the target server; ⑧ Return the relevant application data back to the vehicle from the target server.

Figure 5: Container-based IoV edge application migration process
Steps ① and ② generate container delay; steps ③ and ⑤ generate queuing delay; step ④ generates transmission delay; step ⑥ generates computation delay; step ⑦ generates access delay; step ⑧ generates return delay. These six parts together constitute the migration time, analyzed respectively as follows.
1) Container delay
Container migration is the process of migrating its hosted app by freezing, saving, rebuilding and restoring containers from source to target servers without service interruptions. Container delay includes two major parts: holding state delay and creating container delay, denoted as
The rapid process of container migration [42] is almost no gap between container delays of different migration processes. Therefore, container delay is not a major factor in optimizing migration time, so set
2) Queuing delay
The total migration data amount includes the app data, container resource status, etc., that is required to re-run the migrated app on the target server. There are queuing processes on both source and target servers before transmitting and computing data, thus queuing delay includes two parts: transmission queuing delay on the source server and computation queuing delay on the target server, denoted as
The strong computing and load capacity of edge servers make a rapid queuing process of transmission and computation, which accounts for a small proportion of overall migration time, and there is almost no gap between the queuing delays of different migration processes. Therefore, queuing delay is not a major factor in optimizing migration time, so set
3) Transmission delay
The consuming time of transmitting data from the source to the target server is the transmission delay, denoted as
where
4) Computation delay
The received total migration data will be computed and processed by the target server. The consuming time is the computation delay, denoted as
where
5) Access delay
During migrating apps, the connected vehicle should request access to the target server once it obtains the target server ID before leaving the source service domain, and ensure the successful connection to the target server while driving into the target service domain. The consuming time is the access delay, denoted as
The tiny gaps between access delays of different migration processes make it not a major factor in optimizing migration time, so set
6) Return delay
The target server will return the required information to the connected vehicle after processing the total migration data of app A. The consuming time is the return delay, denoted as
The tiny gaps between return delays of different migration processes make it not a major factor in optimizing migration time, so set
Overall, migration time includes six parts: container delay, queuing delay, transmission delay, computation delay, access delay and return delay. The symbol
The time interval between the vehicle accessed and disconnected to the candidate target server
where n denotes the migration number experienced in time order,
However, at the migration trigger moment in the source server
The above 3 parameters can reflect the size of service time
4.2 Optimization Goal: Minimize the Average Migration Time and Maximize the Average Service Time
Current studies for IoV edge application migration decision problems typically focus on the single migration decision, actually a kind of optimal local decision, which only guarantees the immediate reward of individual migration decisions but ignores the long-term reward of overall migration decisions, thus easily leading to the case where the loss outweighs the gain. To optimize the long-term average performance of overall migration decisions, this paper regards that as a series of migration target optimization problems oriented for all edge servers involved in the vehicle journey from the current vehicle position. Then this paper designs the optimization goal (OG) from the long-term average perspective based on the decision factors in subsection 4.1 as follows.
4.2.1 Min-Cost: Minimize the Average Migration Time
where t denotes the current migration trigger moment; n denotes the migration number experienced in time order; i and j respectively denote the source server ID and the target server ID corresponding to each migration.
To minimize the long-term average migration time, it is necessary to make the migration time of each migration as small as possible. However, different migration target path schemes may also cost equal average migration time. Therefore,
As the service interruption risk is closely related to the trigger frequency of migrations and the service support capacity of edge servers, except for optimizing the average migration time, it is necessary to minimize migration times and improve the stability and adaptability of migration decisions.
4.2.2 Max-Reward: Maximize the Average Service Time
The longer the service time on
In summary, the optimal global solution refers to the next edge server that minimizes the long-term average migration time and maximizes the long-term average service time, which is the best migration target server at the current migration trigger moment. However, since the condition long-term is infinite in the time dimension, it is hard to verify in practice whether the obtained solution is globally optimal. Therefore, this paper limits a time interval as the observation period to express long-term.
Thus, the approximate global optimal solution, actually a Pareto optimal solution, refers to the next edge server that minimizes the average migration time and maximizes the average service time within the observation period, namely the best migration target server denoted as
where
5 Migration Decision Algorithm
In this section, this paper designs the migration decision algorithm to answer how to migrate. This paper modifies the artificial bee colony algorithm to design the IoV edge application migration decision algorithm. The artificial bee colony algorithm can find the optimal solution by iterating the behaviors of individual bees, the key elements are the nectar source and the bee colony. The details of the migration decision algorithm Algs. 3 and 4 based on the improved artificial bee colony algorithm are as follows.
A nectar source corresponds to a feasible solution, namely the migration selection from the source server
1) Nectar source location
It records the server IDs and deployment positions of
2) Nectar source quality
It records the suitable degree of
where
Eq. (13) shows that within the valid migration range, the less the migration time
3) Nectar source mining degree
It records the un-updated times of the feasible migration solution from

There are 3 kinds of bees in the colony. The employed bee is responsible for discovering excellent solutions. The onlooker bee is responsible for speeding up the convergence. The scout bee is responsible for avoiding local optimal traps.
The initial colony size is

1) Employed phase
At the migration trigger moment of the IoV app A in
If the
The employed bees will transfer their latest matched nectar source information to onlooker bees after the above process.
2) Onlooker phase
Based on the information shared by employed bees, onlooker bees first calculate the quality level evaluated value (the individual selected probability)
Then N onlooker bees select the solution according to the probability
3) Scout phase
Scout bees are not present at the beginning, their numbers will be adjusted dynamically in the iteration as following rules.
When the
Simulation experiments are carried out via MATLAB to verify the performance of the proposed migration strategy based on IABC. The comparative strategies include 4 kinds.
1) Nearest selection (NS) migration strategy aiming to minimize the distance from the vehicle to the target server.
2) Greedy selection (GS) migration strategy aiming to minimize the current migration time at the migration trigger moment.
3) Shortest path (SP) migration strategy aiming to minimize the sum of migration time within the observation period.
4) Discrete particle swarm (DPS) migration strategy aiming to minimize the current ratio of migration time to service time at the migration trigger moment.
The simulation map contains 2 crossroads and 30 edge servers. The edge servers are seamlessly deployed on both roadsides (sparsely and evenly beside straight roads and more densely near the crossroads or fork roads). The vehicle drives at a constant speed of 10

To show the performance of each strategy in various migration trigger situations more clearly, this paper sets two simulation backgrounds: (a) only CBMs occur; (b) both CBMs and SDMs occur. 20 groups of tests are conducted under the conditions of the same observation period and same vehicle route, where each strategy in each test group faces the same state of edge servers and networks that will change after each test group. Then this paper compares the performance of each strategy in terms of average migration time, migration times, the sum of migration time, average service time and frequency of SDM. Finally, this paper analyzes the adaptability and stability of each strategy for various migration situations.
Fig. 6 compares the average migration time of each strategy within the observation period. GS is basically the smallest, but the overall gaps between NS, GS, SP, DPS and IABC are not significant. It indicates that this paper can’t accurately distinguish the merits of each strategy via average migration time alone.

Figure 6: Comparison of average migration time within observation period of different strategies in 20 test groups, evaluated under two migration situations
Fig. 7 compares migration times of each strategy within the observation period. In Fig. 7a, IABC, DPS and SP always generate the lowest migration times and remain stable enough, NS is also stable but somewhat higher, while GS shifts frequently and is often the highest. In Fig. 7b, IABC varies little and is obviously less than NS, GS, SP and DPS, where DPS is slightly less than GS and both SP and NS are higher, but SP is slightly less than NS. It indicates that IABC performs excellently and stably in terms of migration times.

Figure 7: Comparison of migration times within observation period of different strategies in 20 test groups, evaluated under two migration situations
Fig. 8 compares the sum of migration time within the observation period for each strategy. In Fig. 8a, IABC, DPS and SP are always in the smallest value echelon where SP is occasionally slightly less than IABC and DPS, while NS and GS are obviously larger where GS fluctuates the most. In Fig. 8b, IABC is still the smallest; and the fluctuation range of DPS becomes larger, which is significantly higher than IABC and appears to be similar to GS; while both the result value and fluctuation range of SP are significantly larger; although NS fluctuates smaller than SP, its value remains the largest in the long term. It indicates that IABC performs best and stably in terms of the sum of migration time.

Figure 8: Comparison of sum of migration time within observation period of different strategies in 20 test groups, evaluated under two migration situations
Fig. 9 compares the average service time of each strategy within the observation period. The average service time can also be reflected by migration times, where lower migration times mean longer average service time. Therefore, it also indicates that IABC performs best and stably in terms of average service time.
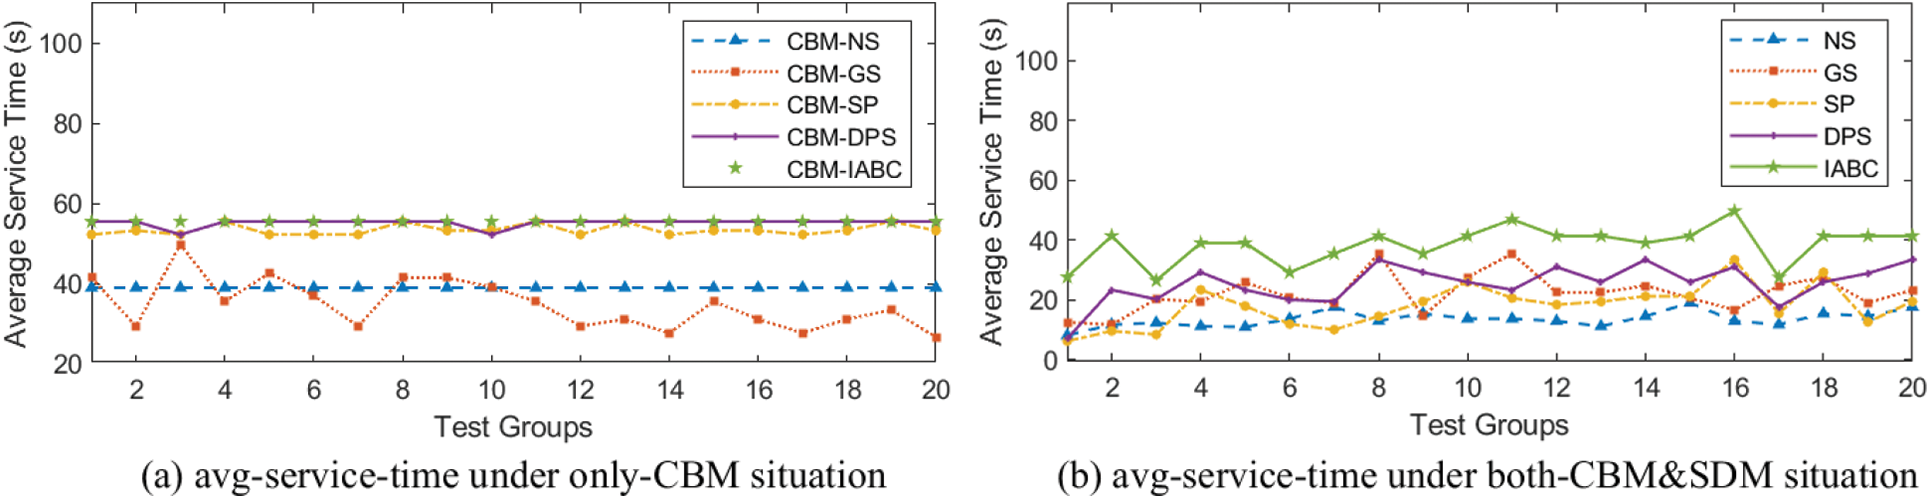
Figure 9: Comparison of average service time within observation period of different strategies in 20 test groups, evaluated under two migration situations
Fig. 10 compares the frequency of SDM within the observation period for each strategy. As each strategy in each test group faces the same state of edge servers and networks, it means that all existed moments and positions that can trigger SDMs are fixed. Therefore, the ratio of SDM times triggered by each strategy to the total migration times, namely the frequency of SDM, can reflect its ability to avoid SDMs. This critical ability is directly related to the adaptability and stability of the strategy in situations where existing high risk of triggering SDMs. The results indicate that IABC has the best ability to avoid SDMs.
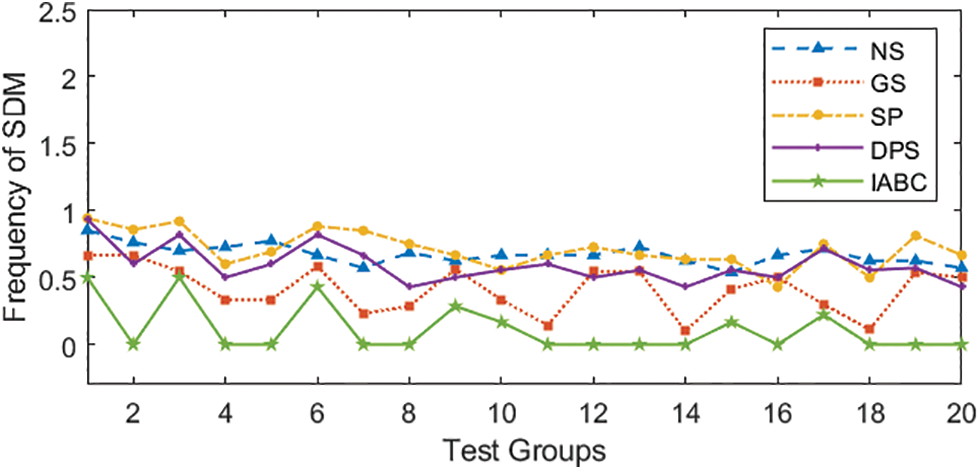
Figure 10: Comparison of frequency of SDM within observation period of different strategies in 20 test groups, evaluated under the situation where both CBMs and SDMs occur
Fig. 11 averages the results of the above indicators separately and directly displays the long-term average performance of each strategy through the bar charts, which verifies the above analysis.

Figure 11: Comparison of long-term average performance of each indicator within observation period of different strategies
This paper also carried out corresponding simulation experiments under the conditions of different vehicle speeds or different edge server coverage radius, as shown in Fig. 12, which verifies the applicability of the above conclusions in more variable scenarios.

Figure 12: Comparison of each indicator within observation period of different strategies under the conditions of different vehicle speeds or different edge server coverage radius
This paper studies the IoV edge application migration mechanism, focusing on optimizing the migration cost and reward in the migration process. First, a migration trigger determination algorithm for CBM and SDM is separately proposed to improve the determination accuracy. Then, a migration target decision calculation model oriented to minimize the average migration time and maximize the average service time is constructed to reduce migration times while optimizing the migration decision. Finally, a migration decision algorithm based on the improved artificial bee colony algorithm is proposed to avoid local optimal migration decisions. Simulation results show that the proposed migration mechanism can reduce the average migration time and migration times, improve the average service time and the ability to avoid SDMs, and enhance the stability and adaptability of IoV application services.
In future work, this research will investigate the IoV edge application migration problem under more complex scenarios to further optimize the performance and availability.
Acknowledgement: This work was supported in part by the National Natural Science Foundation of China under Grant 62071070.
Funding Statement: The authors received no specific funding for this study.
Conflicts of Interest: The authors declare that they have no conflicts of interest to report regarding the present study.
References
1. X. Hou, Y. Li, M. Chen, D. Wu, D. Jin et al., “Vehicular fog computing: A viewpoint of vehicles as the infrastructures,” IEEE Transactions on Vehicular Technology, vol. 65, no. 6, pp. 3860–3873, 2016. [Google Scholar]
2. N. Kumar, S. Zeadally and J. J. Rodrigues, “Vehicular delay-tolerant networks for smart grid data management using mobile edge computing,” IEEE Communications Magazine, vol. 54, no. 10, pp. 60–66, 2016. [Google Scholar]
3. W. Shi, J. Cao, Q. Zhang, Y. Li and L. Xu, “Edge computing: Vision and challenges,” IEEE Internet of Things Journal, vol. 3, no. 5, pp. 637–646, 2016. [Google Scholar]
4. S. Wang, J. Xu, N. Zhang and Y. Liu, “A survey on service migration in mobile edge computing,” IEEE Access, vol. 6, pp. 23 511–23 528, 2018. [Google Scholar]
5. M. Islam, A. Razzaque and J. Islam, “A genetic algorithm for virtual machine migration in heterogeneous mobile cloud computing,” in Proc. NSysS, Dhaka, Bangladesh, pp. 1–6, 2016. [Google Scholar]
6. Z. Tang, X. Zhou, F. Zhang, W. Jia and W. Zhao, “Migration modeling and learning algorithms for containers in fog computing,” IEEE Transactions on Services Computing, vol. 12, no. 5, pp. 712–725, 2018. [Google Scholar]
7. A. Machen, S. Wang, K. K. Leung, B. J. Ko and T. Salonidis, “Live service migration in mobile edge clouds,” IEEE Wireless Communications, vol. 25, no. 1, pp. 140–147, 2017. [Google Scholar]
8. Q. Peng, Y. Xia, Z. Feng, J. Lee, C. Wu et al., “Mobility-aware and migration-enabled online edge user allocation in mobile edge computing,” in Proc. ICWS, Milan, Italy, pp. 91–98, 2019. [Google Scholar]
9. L. Ma, S. Yi and Q. Li, “Efficient service handoff across edge servers via docker container migration,” in Proc. SEC’17, New York, NY, USA, pp. 1–13, 2017. [Google Scholar]
10. Y. Mao, C. You, J. Zhang, K. Huang and K. B. Letaief, “A survey on mobile edge computing: The communication perspective,” IEEE Communications Surveys & Tutorials, vol. 19, no. 4, pp. 2322–2358, 2017. [Google Scholar]
11. A. Bala and I. Chana, “Prediction-based proactive load balancing approach through vm migration,” Engineering with Computers, vol. 32, no. 4, pp. 581–592, 2016. [Google Scholar]
12. Z. Ma, S. Shao, S. Guo, Z. Wang, F. Qi et al., “Container migration mechanism for load balancing in edge network under power internet of things,” IEEE Access, vol. 8, pp. 118405–118416, 2020. [Google Scholar]
13. S. Maheshwari, S. Choudhury, I. Seskar and D. Raychaudhuri, “Traffic-aware dynamic container migration for real-time support in mobile edge clouds,” in Proc. ANTS, Indore, India, pp. 1–6, 2018. [Google Scholar]
14. D. Baburao, T. Pavankumar and C. Prabhu, “Survey on service migration, load optimization and load balancing in fog computing environment,” in Proc. I2CT, Bombay, India, pp. 1–5, 2019. [Google Scholar]
15. W. Zhang, Y. Hu, Y. Zhang and D. Raychaudhuri, “Segue: Quality of service aware edge cloud service migration,” in Proc. CloudCom, Luxembourg, Luxembourg, pp. 344–351, 2016. [Google Scholar]
16. S. Wang, R. Urgaonkar, M. Zafer, T. He, K. Chan et al., “Dynamic service migration in mobile edge computing based on markov decision process,” IEEE/ACM Transactions on Networking, vol. 27, no. 3, pp. 1272–1288, 2019. [Google Scholar]
17. J. Xia, Z. Cai and M. Xu, “Optimized virtual network functions migration for nfv,” in Proc. ICPADS, Wuhan, China, pp. 340–346, 2016. [Google Scholar]
18. I. Labriji, F. Meneghello, D. Cecchinato, S. Sesia, E. Perraud et al., “Mobility aware and dynamic migration of mec services for the internet of vehicles,” IEEE Transactions on Network and Service Management, vol. 18, no. 1, pp. 570–584, 2021. [Google Scholar]
19. D. Grewe, M. Wagner, M. Arumaithurai, I. Psaras and D. Kutscher, “Information-centric mobile edge computing for connected vehicle environments: Challenges and research directions,” in Proc. MECOMM’17, Los Angeles, LA, USA, pp. 7–12, 2017. [Google Scholar]
20. C. Chen, Y. Ding, Z. Wang, J. Zhao, B. Guo et al., “Vtracer: When online vehicle trajectory compression meets mobile edge computing,” IEEE Systems Journal, vol. 14, no. 2, pp. 1635–1646, 2019. [Google Scholar]
21. M. Nikodem, M. Słabicki, T. Surmacz, P. Mrowka and C. Dołega, “Multi-camera vehicle tracking using edge computing and low-power communication,” Sensors, vol. 20, no. 11, pp. 3334, 2020. [Google Scholar] [PubMed]
22. Continental, Award-Winning Connected Car Project: “Real-Time Communication via the LTE Mobile Network” Wins Best-Practice Competition, 2016. [Online]. Available: https://www.continental.com/en/press/press-releases/award-winning-connected-car-project-real-time-communication-via-the-lte-mobile-network-wins-best-practice-competition/ [Google Scholar]
23. iTWire, Sydney and Newcastle use artificial intelligence and edge computing to improve road mobility, 2021. [Online]. Available: https://itwire.com/government/sydney-and-newcastle-use-artificial-intelligence-and-edge-computing-to-improve-road-mobility.html [Google Scholar]
24. Huawei, Wuxi Internet of Vehicle (C-V2X) Project, 2018. [Online]. Available: https://www.huawei.com/en/technology-insights/industry-insights/outlook/mobile-broadband/lte/use-cases/wuxi-internet-of-vehicle-c-v2x-project [Google Scholar]
25. X. Huang, P. Li and R. Yu, “Social welfare maximization in container-based task scheduling for parked vehicle edge computing,” IEEE Communications Letters, vol. 23, no. 8, pp. 1347–1351, 2019. [Google Scholar]
26. H. Sami, A. Mourad and W. El-Hajj, “Vehicular-obus-as-on-demand-fogs: Resource and context aware deployment of containerized micro-services,” IEEE/ACM Transactions on Networking, vol. 28, no. 2, pp. 778–790, 2020. [Google Scholar]
27. Z. Khan, F. Abbas and H. Hamidullah, “A conceptual framework of virtualization and live-migration for vehicle to infrastructure (v2i) communications,” in Proc. ICCSN, Chongqing, China, pp. 590–594, 2019. [Google Scholar]
28. K. Tocze and S. Nadjm-Tehrani, “A taxonomy for management and optimization of multiple resources in edge computing,” Wireless Communications and Mobile Computing, vol. 2018, pp. 23, 2018. [Google Scholar]
29. B. I. Ismail, E. M. Goortani, M. B. Ab Karim, W. M. Tat, S. Setapa et al., “Evaluation of docker as edge computing platform,” in Proc. ICOS, Melaka, Malaysia, pp. 130–135, 2015. [Google Scholar]
30. L. Cui, Z. Chen, S. Yang, Z. Ming, Q. Li et al., “A Blockchain-based containerized edge computing platform for the internet of vehicles,” IEEE Internet of Things Journal, vol. 8, no. 4, pp. 2395–2408, 2020. [Google Scholar]
31. Google, Connected vehicle platform, 2021. [Online]. Available: https://cloud.google.com/architecture/designing-connected-vehicle-platform [Google Scholar]
32. H. Yao, C. Bai, D. Zeng, Q. Liang and Y. Fan, “Migrate or not? exploring virtual machine migration in roadside cloudlet-based vehicular cloud,” Concurrency and Computation: Practice and Experience, vol. 27, no. 18, pp. 5780–5792, 2015. [Google Scholar]
33. L. Yin, P. Li and J. Luo, “Smart contract service migration mechanism based on container in edge computing,” Journal of Parallel and Distributed Computing, vol. 152, pp. 157–166, 2021. [Google Scholar]
34. J. Li, X. Shen, L. Chen, D. P. Van, J. Ou et al., “Service migration in fog computing enabled cellular networks to support real-time vehicular communications,” IEEE Access, vol. 7, pp. 13 704–13 714, 2019. [Google Scholar]
35. A. E. Elgazar and K. A. Harras, “Enabling seamless container migration in edge platforms,” in Proc. CHANTS’19, Los Cabos, Mexico, pp. 1–6, 2019. [Google Scholar]
36. J. P. Martin, A. Kandasamy and K. Chandrasekaran, “Mobility aware autonomic approach for the migration of application modules in fog computing environment,” Journal of Ambient Intelligence and Humanized Computing, vol. 11, no. 11, pp. 5259–5278, 2020. [Google Scholar]
37. R. Yang, H. He and W. Zhang, “Multitier service migration framework based on mobility prediction in mobile edge computing,” Wireless Communications and Mobile Computing, vol. 2021, pp. 13, 2021. [Google Scholar]
38. X. Yu, M. Guan, M. Liao and X. Fan, “Pre-migration of vehicle to network services based on priority in mobile edge computing,” IEEE Access, vol. 7, pp. 3722–3730, 2018. [Google Scholar]
39. H. Zhao, Y. Ding, M. Zhang, Q. Wang, X. Shi et al., “Multipath transmission workload balancing optimization scheme based on mobile edge computing in vehicular heterogeneous network,” IEEE Access, vol. 7, pp. 116 047–116 055, 2019. [Google Scholar]
40. S. Dai, L. Li and Z. Li, “Modeling vehicle interactions via modified lstm models for trajectory prediction,” IEEE Access, vol. 7, pp. 38 287–38 296, 2019. [Google Scholar]
41. H. El-Sayed, M. Chaqfa, S. Zeadally and D. Puthal, “A Traffic-aware approach for enabling unmanned aerial vehicles (uavs) in smart city scenarios,” IEEE Access, vol. 7, pp. 86 297–86 305, 2019. [Google Scholar]
42. A. Saboor, A. K. Mahmood, A. H. Omar, M. F. Hassan, S. N. Shah et al., “Enabling rank-based distribution of microservices among containers for green cloud computing environment,” Peer-to-Peer Networking and Applications, vol. 15, pp. 77–91, 2022. [Google Scholar]
Cite This Article
 Copyright © 2023 The Author(s). Published by Tech Science Press.
This work is licensed under a Creative Commons Attribution 4.0 International License , which permits unrestricted use, distribution, and reproduction in any medium, provided the original work is properly cited.
 Downloads
 Citation Tools