
 Submit a Paper
 Propose a Special lssue
 Open Access
ARTICLE

Vehicle Detection and Tracking in UAV Imagery via YOLOv3 and Kalman Filter
1 Department of Computer Science, Air University, Islamabad, 44000, Pakistan
2 Department of Computer Science, College of Sciences and Humanities in Aflaj, Prince Sattam Bin Abdulaziz University, Al-Kharj, Saudi Arabia
3 Department of Computer Engineering, College of Computer Engineering and Sciences, Prince Sattam Bin Abdulaziz University, Al-Kharj, 11942, Saudi Arabia
4 Department of Computer Engineering, Tech University of Korea, 237 Sangidaehak-ro, Siheung-si, 15073, Gyeonggi-do, Korea
* Corresponding Author: Jeongmin Park. Email:
Computers, Materials & Continua 2023, 76(1), 1249-1265. https://doi.org/10.32604/cmc.2023.038114
Received 28 November 2022; Accepted 20 April 2023; Issue published 08 June 2023
 View Full Text
 Download PDF
Abstract
Unmanned aerial vehicles (UAVs) can be used to monitor traffic in a variety of settings, including security, traffic surveillance, and traffic control. Numerous academics have been drawn to this topic because of the challenges and the large variety of applications. This paper proposes a new and efficient vehicle detection and tracking system that is based on road extraction and identifying objects on it. It is inspired by existing detection systems that comprise stationary data collectors such as induction loops and stationary cameras that have a limited field of view and are not mobile. The goal of this study is to develop a method that first extracts the region of interest (ROI), then finds and tracks the items of interest. The suggested system is divided into six stages. The photos from the obtained dataset are appropriately georeferenced to their actual locations in the first phase, after which they are all co-registered. The ROI, or road and its objects, are retrieved using the GrabCut method in the second phase. The third phase entails data preparation. The segmented images’ noise is eliminated using Gaussian blur, after which the images are changed to grayscale and forwarded to the following stage for additional morphological procedures. The YOLOv3 algorithm is used in the fourth step to find any automobiles in the photos. Following that, the Kalman filter and centroid tracking are used to perform the tracking of the detected cars. The Lucas-Kanade method is then used to perform the trajectory analysis on the vehicles. The suggested model is put to the test and assessed using the Vehicle Aerial Imaging from Drone (VAID) dataset. For detection and tracking, the model was able to attain accuracy levels of 96.7% and 91.6%, respectively.Keywords
With each passing day, the use of Unmanned Aerial Vehicles (UAVs) for traffic monitoring is growing in popularity. It entails finding and following the things of interest, such as vehicles. These traffic monitoring systems are frequently used for security, traffic management, oil spill management, vehicle accident management, and the determination of traffic flow metrics [1]. In order to detect and track cars and analyze their trajectories, this paper employs road traffic to evaluate the suggested model [2]. The exponential growth of vehicle traffic necessitates the installation of an efficient and autonomous traffic monitoring system. The people would benefit greatly from the detection and tracking of the vehicles since it would improve traffic flow management [3] and make it easier to spot accidents and traffic jams.
Despite the numerous applications and intensive study in this area, there is still much space for development. The current methods are imperfectly accurate and perform poorly in actual use [4,5]. The numerous obstacles existing in this field are one of the primary causes. These difficulties include occlusion, scale variety, an abundance of objects, and shifting lighting. Another major issue is the lack of publicly accessible, large-scale datasets that address all of the aforementioned difficulties, preventing the development of a reliable system for dealing with difficulties in the actual world. We have developed a successful system for vehicle detection and tracking in UAV imagery, taking into consideration all the difficulties.
There are six basic steps in the suggested model. Georeferencing and coregistration of the photos make up the first phase. The images are subsequently coregistered using an affine transformation. The Region of Interest (ROI), which is the road and its items, is retrieved using the GrabCut method in the second phase [6]. Through the use of Gaussian Blur [7], the noise is reduced, the image is made grayscale [8], and it is then sent for morphological processing [9]. Utilizing the You Only Look Once (YOLO) algorithm, automobiles are found in the fourth step [10]. The tracking of discovered automobiles is done in the fifth stage. The Kalman filter and centroid tracking are used to accomplish this [11,12]. Finally, the Lucas-Kanade algorithm is used to calculate the trajectory of the vehicles [13].
The remainder of this study is recommended to be read as follows: A portion of the related research is covered in Section 2. The proposed approach and its many phases are thoroughly explained in Section 3. After that, part 4 evaluates the suggested model. The experimental conditions, dataset, and findings are all discussed. The section on this model’s shortcomings and potential future research directions that could enhance the current model are covered in Section 5. The research is concluded in Section 6 of the text.
The YOLO technique, a cutting-edge technology, has been used to detect automobiles in this article, and Kalman filtering and centroid tracking have been suggested as methods for tracking them. In the past, numerous studies in the fields of image processing and computer vision have been done to detect and track automobiles using a variety of algorithms and techniques. Below is a thorough review of these studies:
Currently, there are two main approaches to vision-based vehicle object recognition: basic machine vision techniques, and sophisticated deep learning techniques. Traditional machine vision has the benefit of greatly reducing human error and flaw detection, and it can even find the location of a specific object. However, conventional machine vision is less successful in scenarios with changing lighting and is not very good at handling color variations. These methods use a vehicle’s motion to set it apart from a background image that is static. Three subcategories of this strategy can be identified [14]: backdrop removal [15], continuous video frame difference [16], and optical flow [17]. The video frame difference method uses the pixel values of two or three subsequent video frames to calculate the variance. Additionally, the moving foreground zone is divided by the threshold. Using this technique and noise suppression, the vehicle’s pausing can also be detected [18]. Background information is utilized to create the background model after the video’s backdrop image has been fixed. Then, moving objects may be segmented after each image frame is compared to the backdrop model. The motion region in a video may be found using the optical flow method. Each pixel’s motion direction and velocity are represented by the optical flow field that was created. It is common practice to use techniques like the Scale Invariant Feature Transform (SIFT) and Speeded Up Robust Features (SURF) procedures for vehicle recognition based on vehicle characteristics. For instance, the classification and identification of vehicles have been done using 3D models [19]. Cars, Sports Utility Vehicles (SUVs), and minibusses can be identified from one another using the correlation curves of 3D ridges on the exterior of the vehicle [20].
Deep convolutional networks (CNNs) have produced impressive outcomes in the detection of vehicle objects. CNNs can handle a wide range of related tasks, such as classification and bounding box regression, and have a significant ability for learning picture features [21]. The detecting techniques can generally be divided into two categories. The two-stage method creates a candidate box for the object using a variety of techniques; a convolutional neural network then classifies it. The one-stage method converts the object bounding box placement problem directly into a regression problem for processing instead of creating a candidate box. The two-stage method used by Region-CNN (R-CNN) [22] makes use of picture-selective region search [23].
A convolutional network requires a set input picture size, a long training period, and a large amount of storage space due to its deeper structure. Spatial Pyramid Pooling (SPP NET) [24] enables the network to accept images of various sizes and produce fixed outputs by utilizing the idea of spatial pyramid matching. Differently, the approaches for feature extraction, feature selection, and classification of convolutional networks have been improved by Region-based Fully Convolutional Network (R-FCN), Feature Pyramid Network (FPN), and Mask Region-based Convolutional Neural Network (RCNN). The Single Shot Multibox Detector (SSD) [25] and You Only Look Once (YOLO) [26] frameworks are the most well-known one-stage methods.
2.2 Vehicle Tracking and Trajectory Analysis
Object tracking has been the subject of extensive research during the past ten years [27,28]. Recently developed ConvNet-based methods frequently use trained object recognition networks. From the very first frame of a movie, certain general object trackers are trained online [29]. A typical tracker will sample background patches that are farther away and foreground patches that are closer to the target item. The classifier that can differentiate between the foreground and background is then trained using these patches. However, present methods of online training are unable to fully utilize enormous amounts of video data. When testing neural networks, Wang et al. [30] proposed a regression-based method that tracks novel objects at 100 frames per second. There are other Siamese networks used, including tracking by object verification [31], tracking by correlation [32], and tracking by detection [33]. Redmon et al. [34] method of explicitly learning a Markov Decision Process (MDP) for state transition and modeling a track-let as several states improve tracking. Only 2D location is used to assess whether a track let is obscured because there isn’t any 3D information.
There are six distinct steps in the suggested system. First, the gathered dataset’s photos are precisely overlaid into their real-world locations, given the proper coordinate systems, and given the required geometric transformations. Feature extraction is done in the subsequent stage. In this, the region of interest is extracted (ROI). The segmented images are sent for preprocessing in the third stage. The photos are cleaned of noise and converted to grayscale before being sent on for additional morphological procedures. The fourth stage is where the article’s most important task, vehicle detection, is completed. The tracking of the cars found in the fourth phase is the focus of the fifth. The examination of the traffic’s trajectory is the subject of the last step. Fig. 1 depicts a comprehensive overview of the suggested system design.
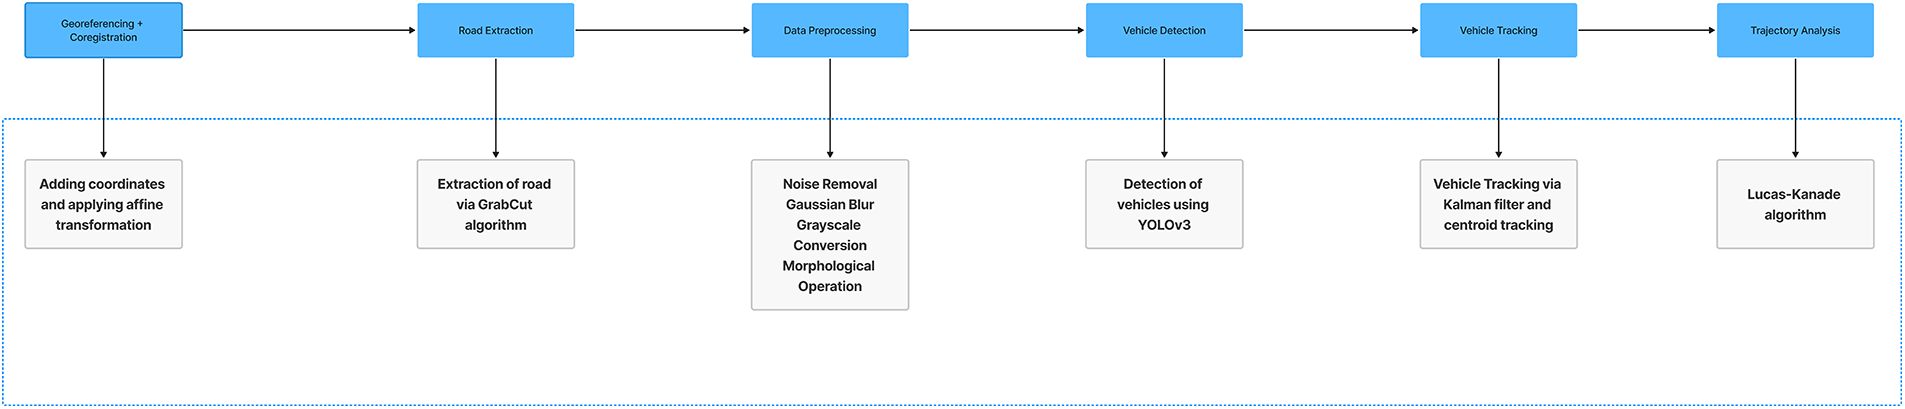
Figure 1: A complete overview of the proposed system architecture
3.1 Georeferencing and Coregistration
The obtained photos are given an appropriate coordinate system and georeferenced to their actual locations. The images are then coregistered using geometric transformations to correct for geometric distortions brought on by unfavorable camera angles. These techniques are covered in more detail in the ensuing subsections.
Typically, drone data is collected without any geographic information. As a result, it is essential to give the data spatial context. QGIS, an open-source program, is used to carry out this task [35]. By superimposing the photographs with their actual locations, the images were georeferenced [36], and the proper coordinate system was then allocated to them. The mathematical equations for georeferencing, which adapt the ideas of linear algebra, are given below.
where (i′, j′ and k′) are the projections in the XYZ frame and cos Aaxis′−axis represents the direction cosines of the vector on the axis.
The photos were coregistered after the georeferencing phase. The photos were subjected to affine adjustments [37] to achieve this. In the case of UAVs, the distortions or deformations brought about by various less-than-ideal camera angles are corrected using affine transformations. The Direction Cosine Matrix, or rotation matrix from the XYZ frame to the X′Y′Z′ frame, is obtained by simplifying Eqs. (1)–(3) and is shown below.
Eq. (4) is the Direction Cosine Matrix that transforms one match frame to another, hence performing the gyration of vectors between the frames. This is appertained to as Euler angle sequences and is used due to its relationship with the movements of upstanding vehicle’s yaw, pitch, and roll. Yaw is the turn to the right or left, the pitch is the over or down movement and the roll is the gyration along the longitudinal axis. Fig. 2. below shows the reels of the UAV.
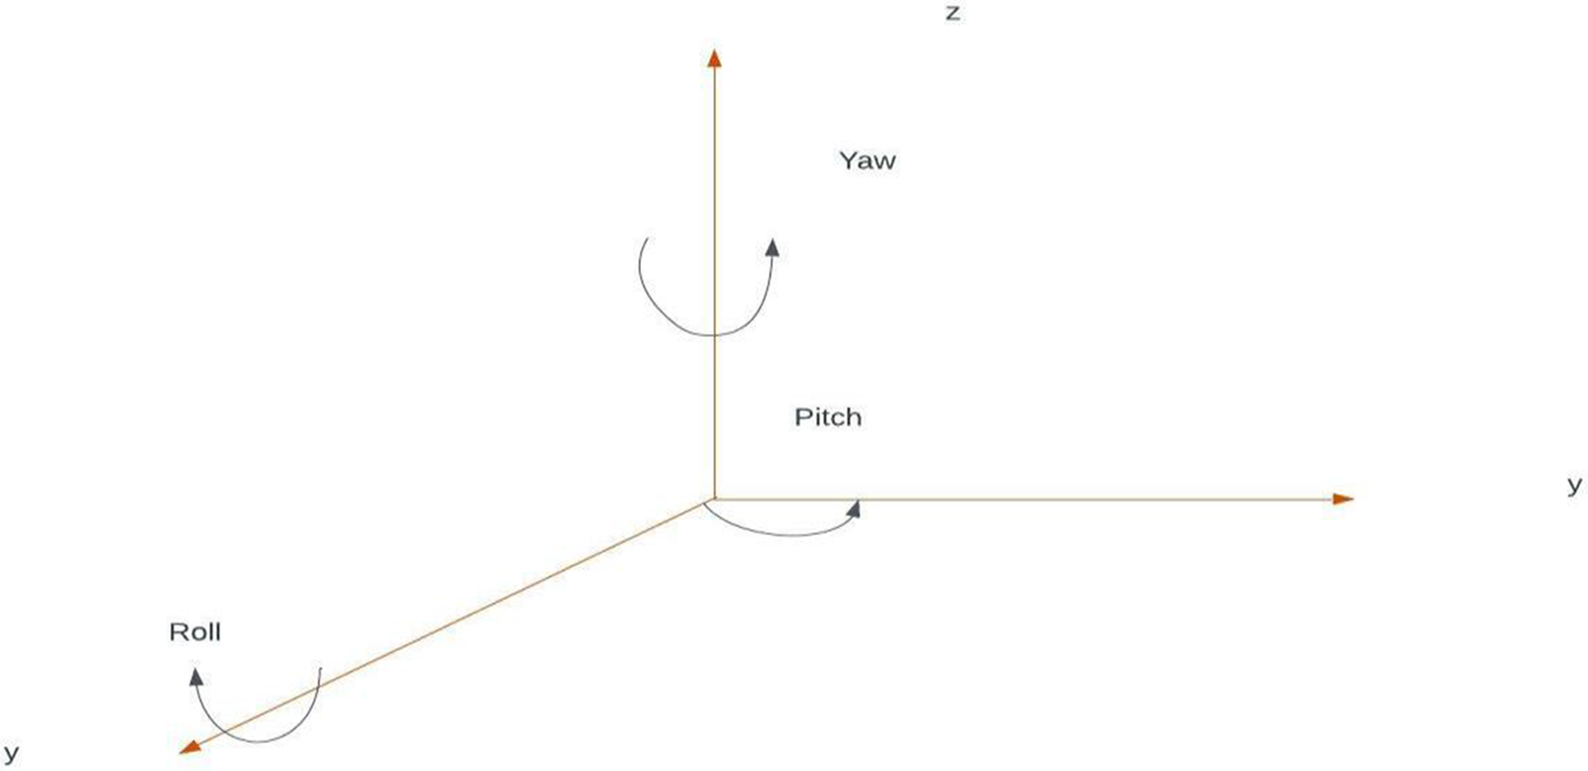
Figure 2: Demonstration of UAV yaw, pitch and roll
The rotation matrix for the yaw, pitch and roll angles in the Euler sequence is provided.
The co-registration of the upright images was done using the aforementioned formulae.
The next step was to split off the ROI after the images had been georeferenced and co-registered. To achieve this, we used the GrabCut algorithm. Based on the ideas of Graph Cuts, the GrabCut is an image segmentation algorithm. This algorithm is not computationally extensive and produces consistent results in varied lightening conditions, as it works on the coordinates rather than on the color spaces, thus we opted for it and it produced consistent results. By taking advantage of the connections between the nodes, this technique uses the image’s graph-like structure to classify the pixels into the background and foreground. Fig. 3. demonstrates the GrabCut algorithm’s general architecture.
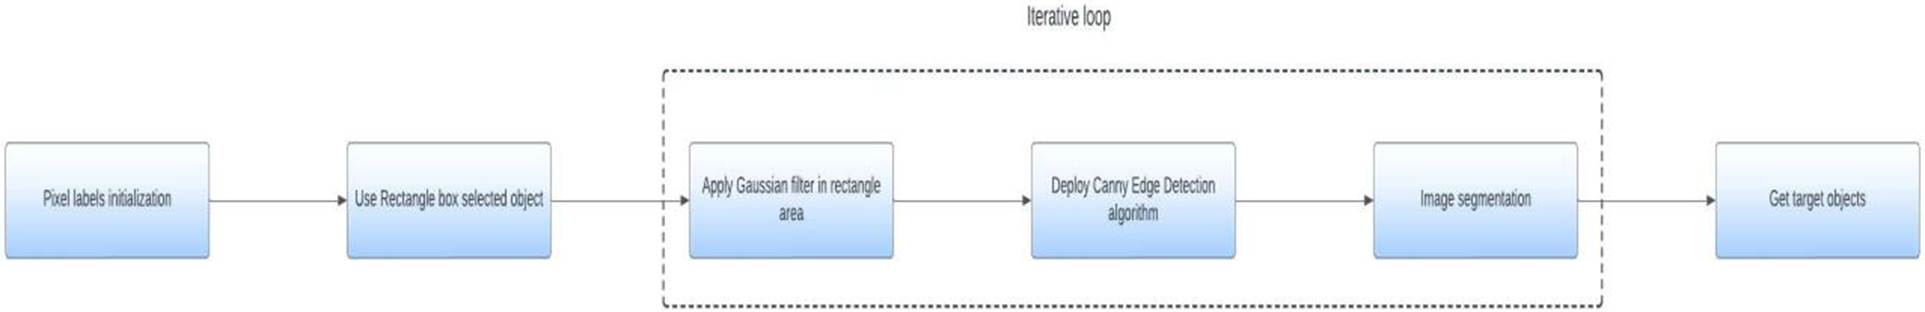
Figure 3: Overall flow of the GrabCut algorithm
The algorithm was practically implemented through OpenCV. The initial coordinates were provided to the algorithm, and then the area within the boxes was segmented out. Fig. 4. shows the result of performing road extraction via the mentioned algorithm.
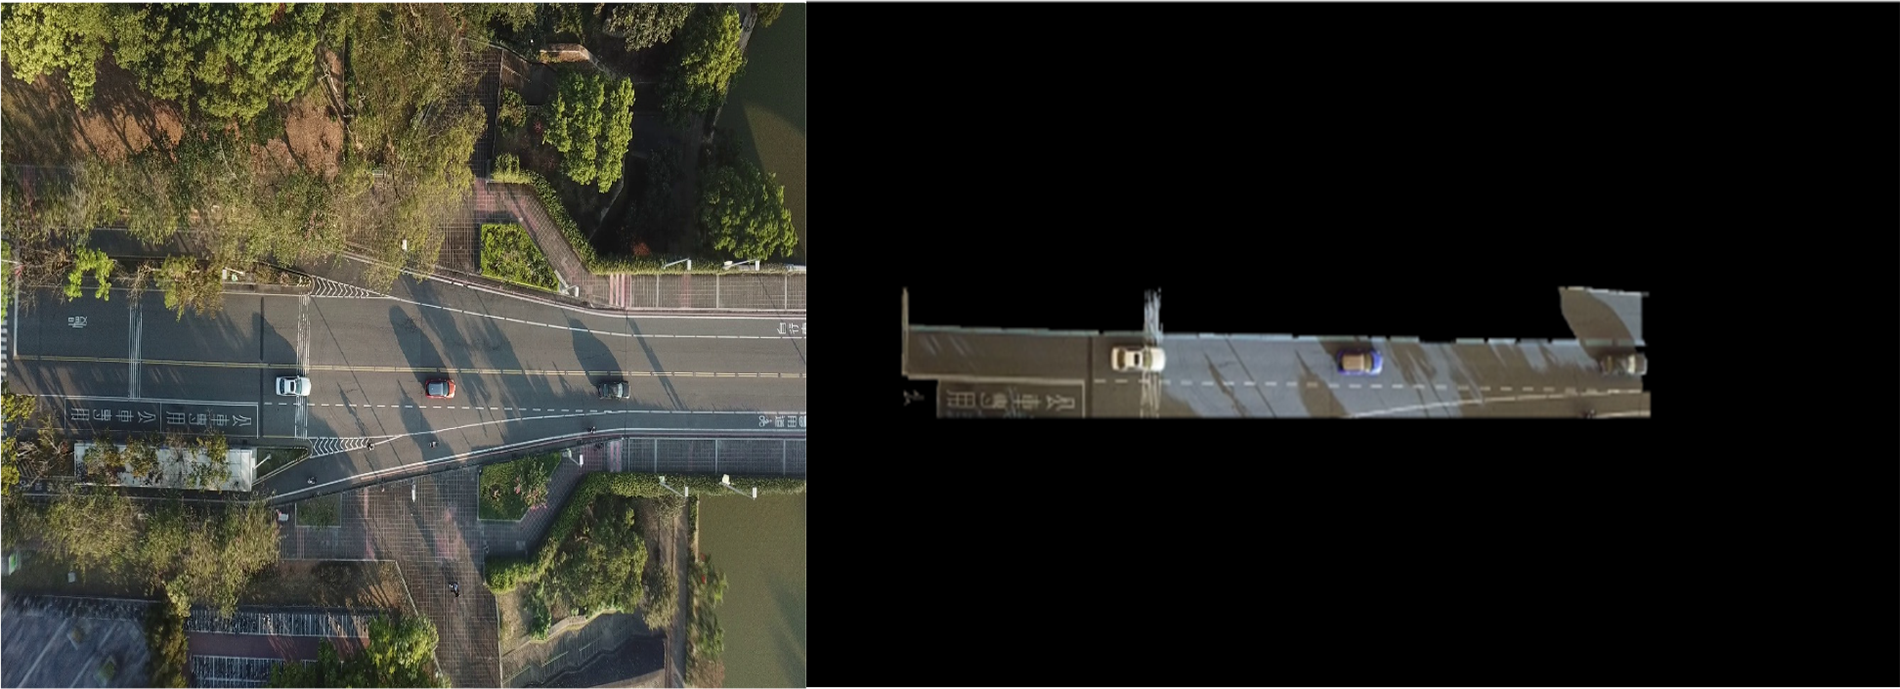
Figure 4: Road Extraction (a) original image, (b) segmented image
The above figure shows the result of Road Extraction via the GrabCut algorithm. It shows that through this algorithm our ROI i.e., road and its objects were successfully segmented out.
The photos were sent for preprocessing once the ROI was segmented. The elimination of noise was the stage’s first phase. There is a great deal of noise in aerial photos obtained by UAVs, which must be eliminated. This was made possible by Gaussian blur. Smoothness and blurring were applied to the final photos. A 2-D convolutional operator called gaussian blur is used to blur pictures. The Gaussian distribution is shown in Fig. 5.
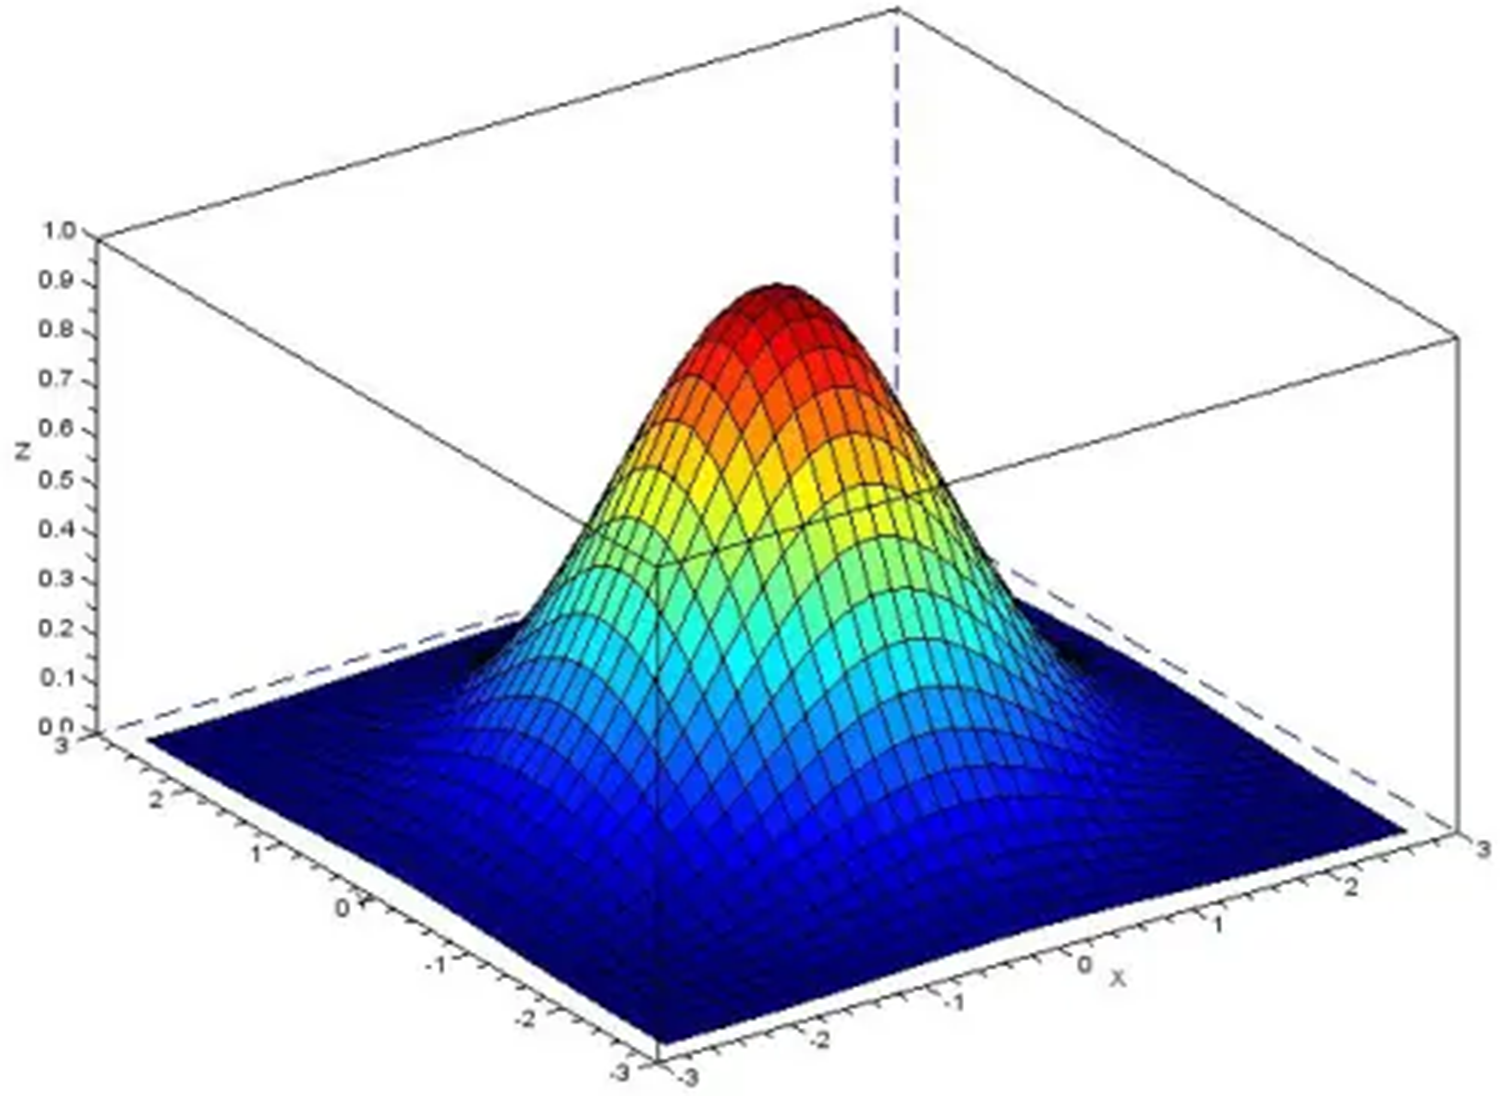
Figure 5: Distribution of Gaussian
The mathematical equation for Gaussian blur is given below
The equation given above was used to calculate the weights of each point. The photographs were then given to be subjected to the morphological operation of dilation, which is mathematically described as
To identify automobiles in aerial photos, the suggested architecture makes use of the YOLOv3 algorithm. Convolutional neural networks (CNN) are used to detect objects in r-time by a single forward propagation through the neural network in the YOLO object detection regression issue. The convolutional layer, which CNN uses as its fundamental building piece, is a layer. Because the convolutional layer’s local connectivity considerably reduces the likelihood of overfitting, CNN offers decreased parameters compared to a fully-connected multi-layer perceptron (MLP) neural network. Another sort of layer in the CNN architecture called the pooling layer’s function is to downsample data. Convolutional and pooling layers work together to make feature learning and feature selection more effective. The general architecture of CNN is shown in Fig. 6.
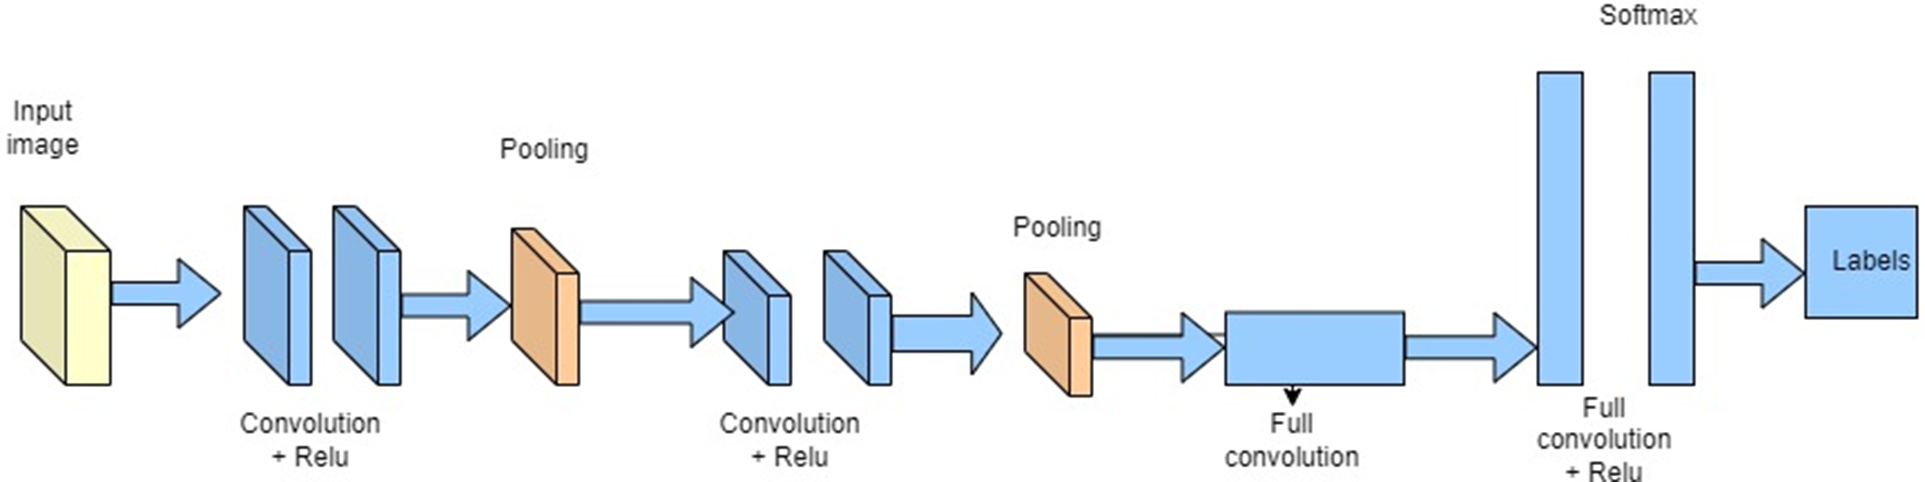
Figure 6: Generic CNN architecture
Fig. 7 below demonstrates the flowchart of the training process of our model.
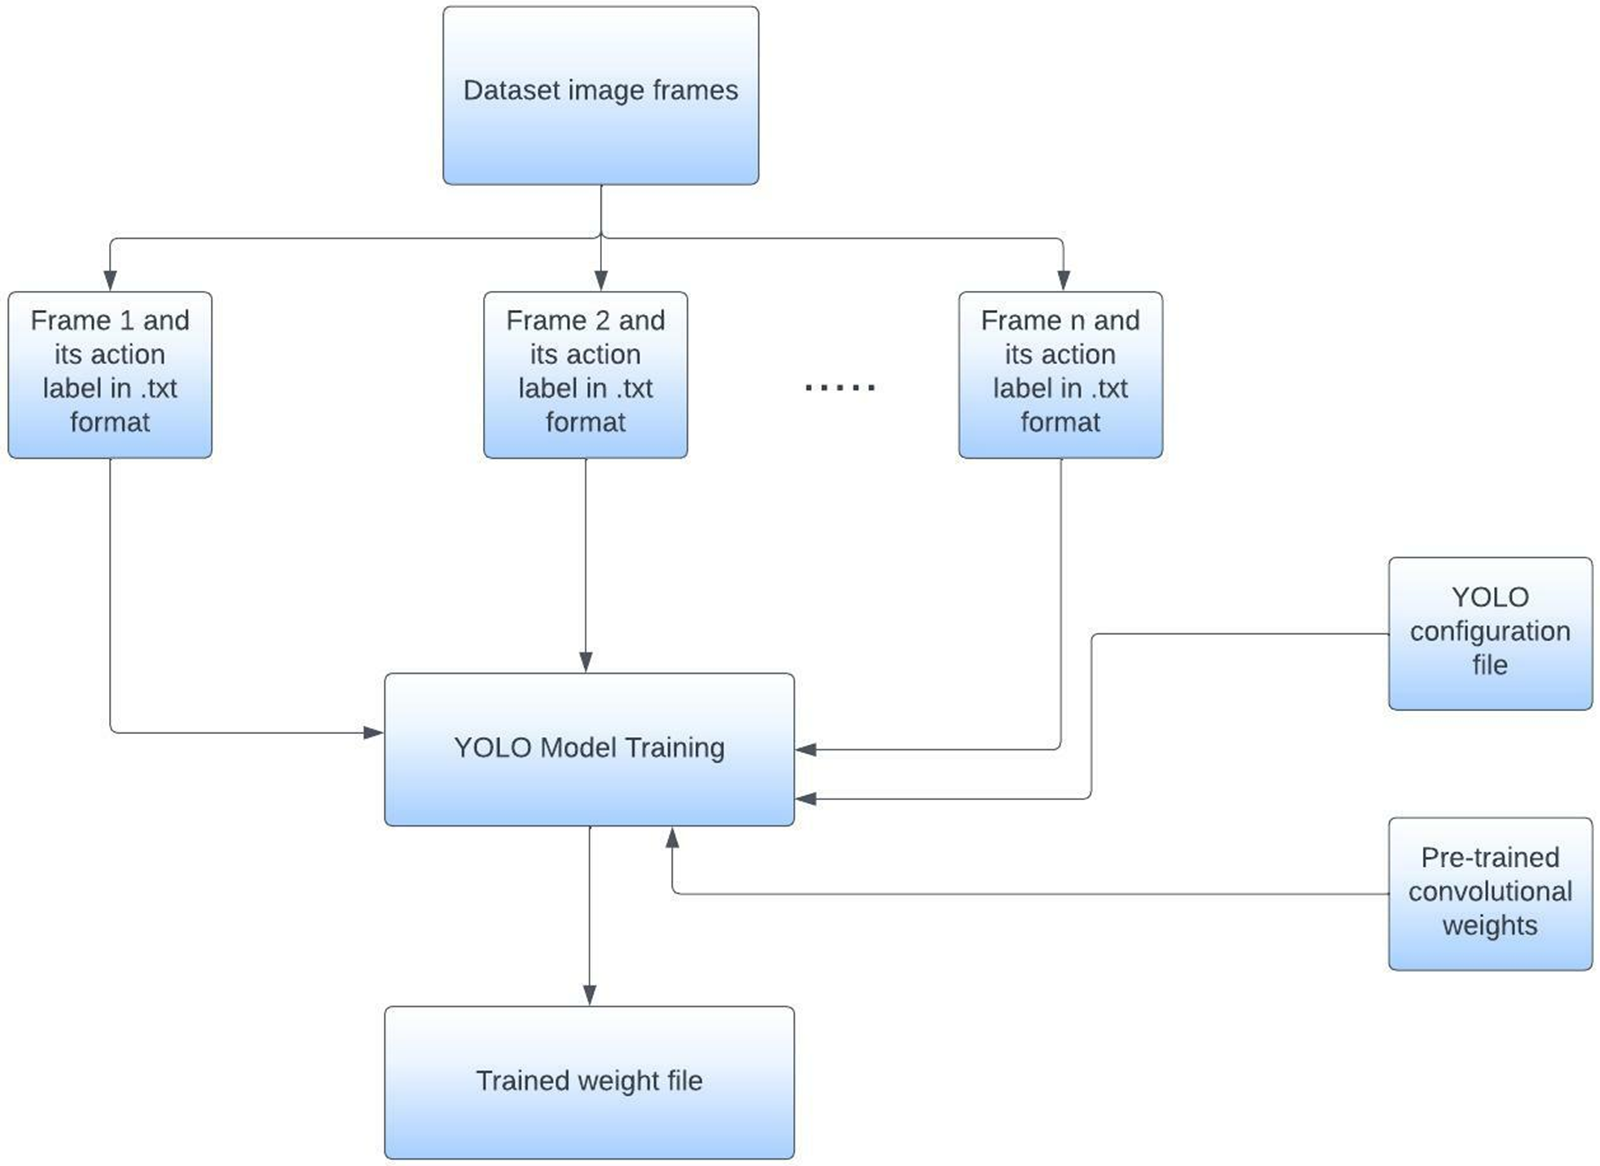
Figure 7: Flowchart of YOLO model training
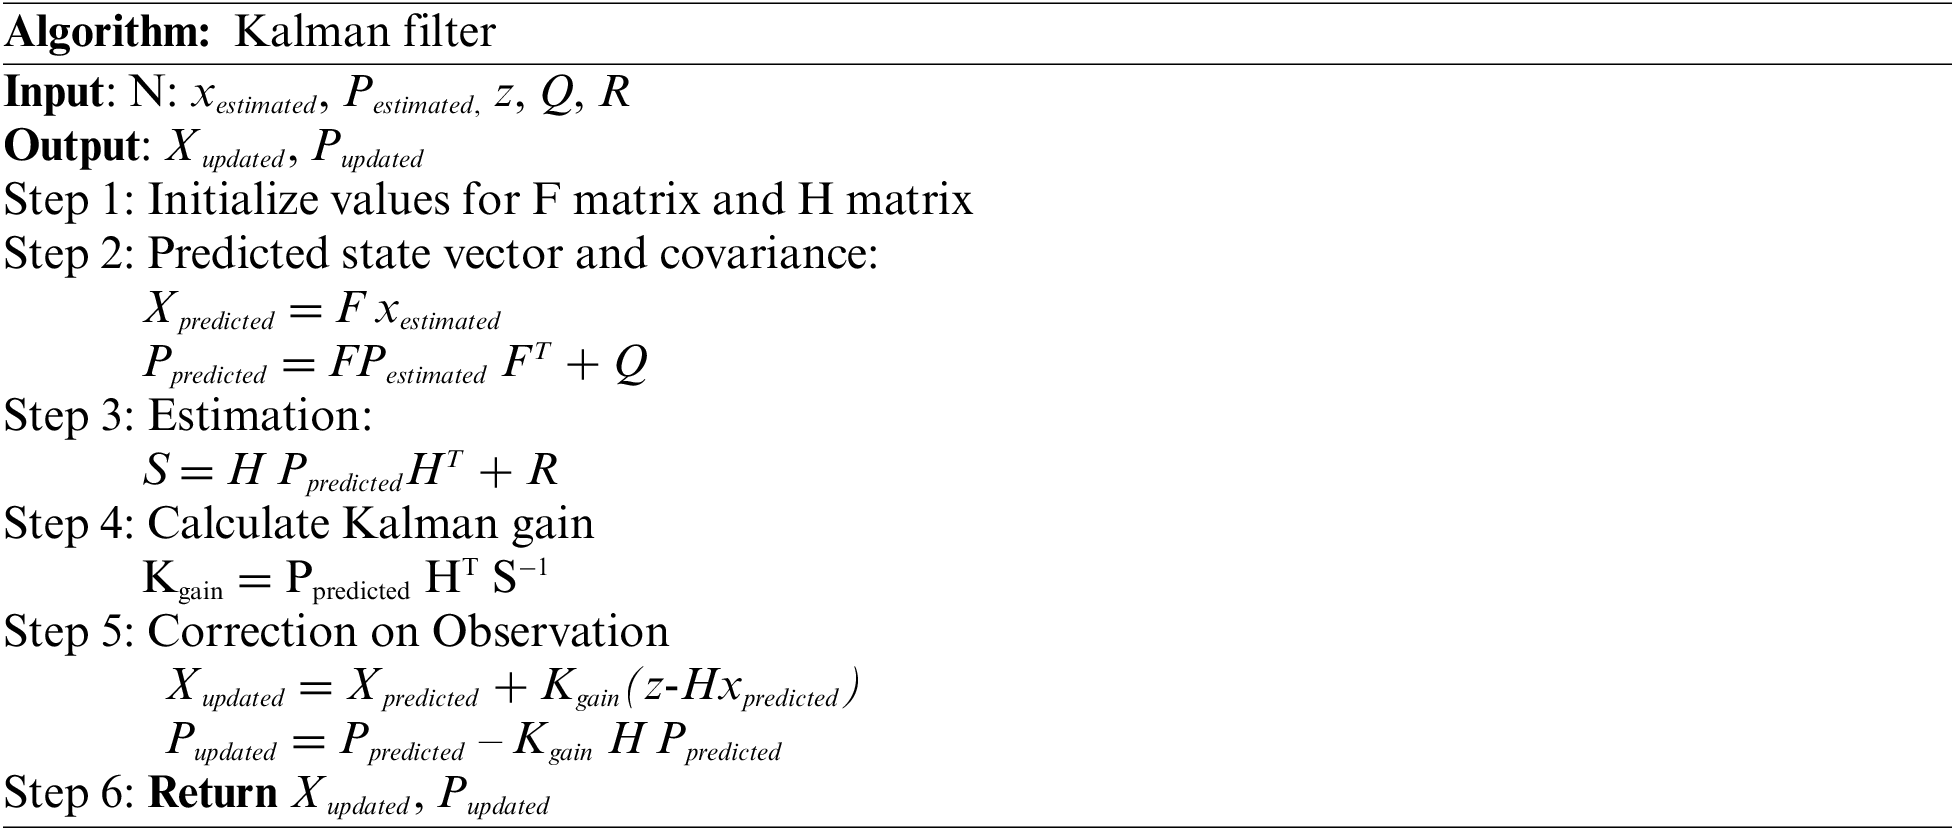
After the vehicles were detected successfully, the tracking was accomplished through Kalman filtering and centroid tracking. Kalman filtering is used for the system parameter estimation and in our case it is used to predict the position of the detected object. Fig. 8 shows the overview of the Kalman filter algorithm.
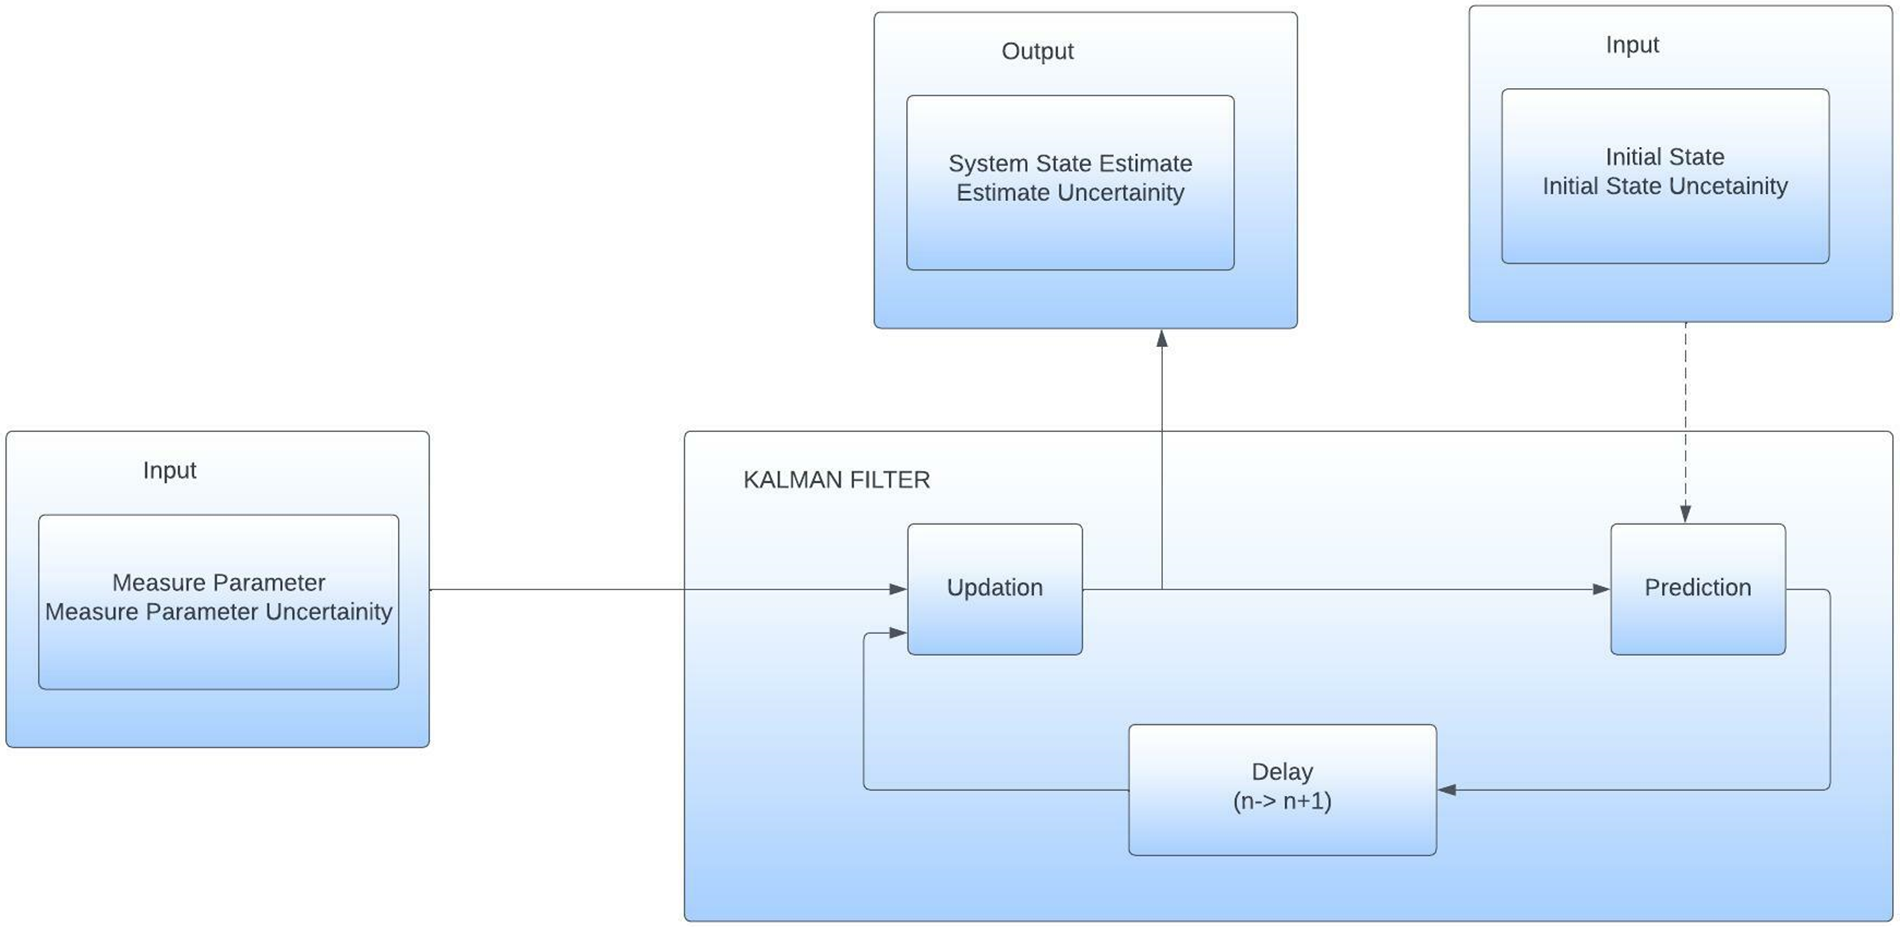
Figure 8: Kalman filter overview
The mathematical equations for the kalman filter are given as:
Here Eq. (8) is the State update equation. Kalman gain equation is given as
The Covariance update equation is given by:
The Covariance Extrapolation equation is given as:
where Kalman is the Kalman gain, Pn,n−1 is the estimated uncertainties during the previous filter, and Pi is the estimated uncertainty of the current state.
So along with predicting the position of bounding boxes, the proposed system architecture also consists of assigning unique ids to the bounding boxes whose position has been predicted through the kalman filter. This allows for efficient tracking of the objects with unique numbers assigned to each object. This is accomplished through centroid tracking. This algorithm operates by accepting the bounding box coordinates and then computing the respective centroids of each bounding box. This process is shown in Fig. 9.
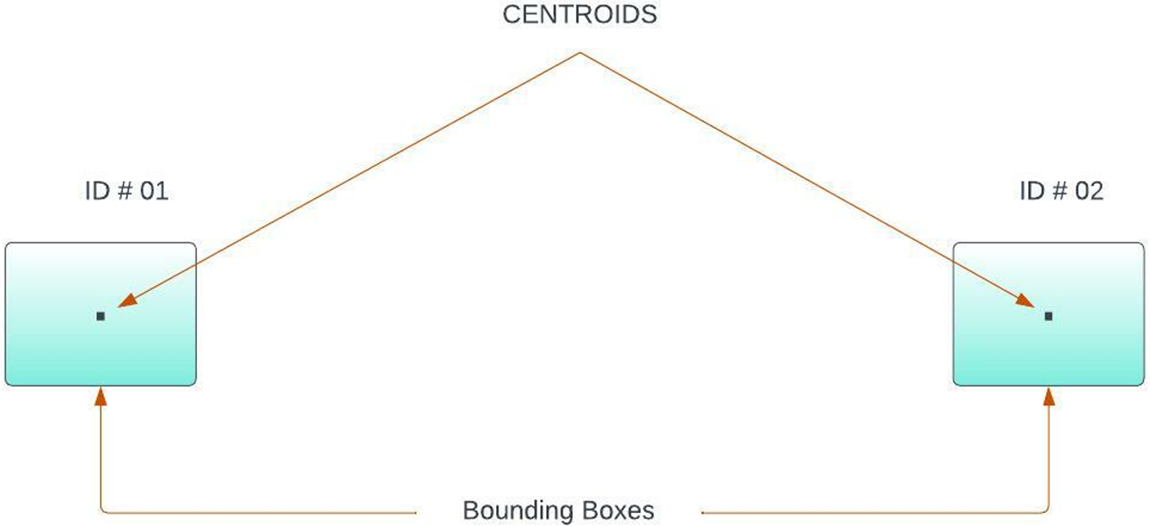
Figure 9: Accept bounding box coordinates
The method then determines the Euclidean distance between each existing object and the new bounding box after accepting the bounding box coordinates. This makes it possible to monitor objects using their Euclidean distance across a series of frames.
The algorithm given below sums up the tracking procedure
After the detection and tracking of vehicles, the next step was to analyze the trajectories of vehicles. The trajectories of the vehicle passing on the road were determined by the Lucas-Kanade method for optical flow. This is used for calculating the motion of each pixel between frames and thus is efficient in gaining the trajectories of objects that are later used for smart traffic management.
This section explains the dataset that was utilized for the proposed model’s training and testing, as well as the specifics of the numerous experiments carried out. It is set up so that a brief explanation of the dataset comes first. The outcomes of object detection are then displayed. Additionally, values for precision, recall, and accuracy are provided. The tracking results and a briefing on trajectory analysis follow.
4.1 VAID: An Aerial Image Dataset for Vehicle Detection and Classification
The suggested model is trained and tested using VAID [27]. The collection includes over 6000 aerial photos that were all taken in Taiwan under various lighting and viewing angle situations. The acquired photographs are in JPG format and have a resolution of 1137 × 640 pixels. A DJI Mavic Pro drone is used to capture the pictures. The dataset photographs are displayed in various settings in Fig. 10.
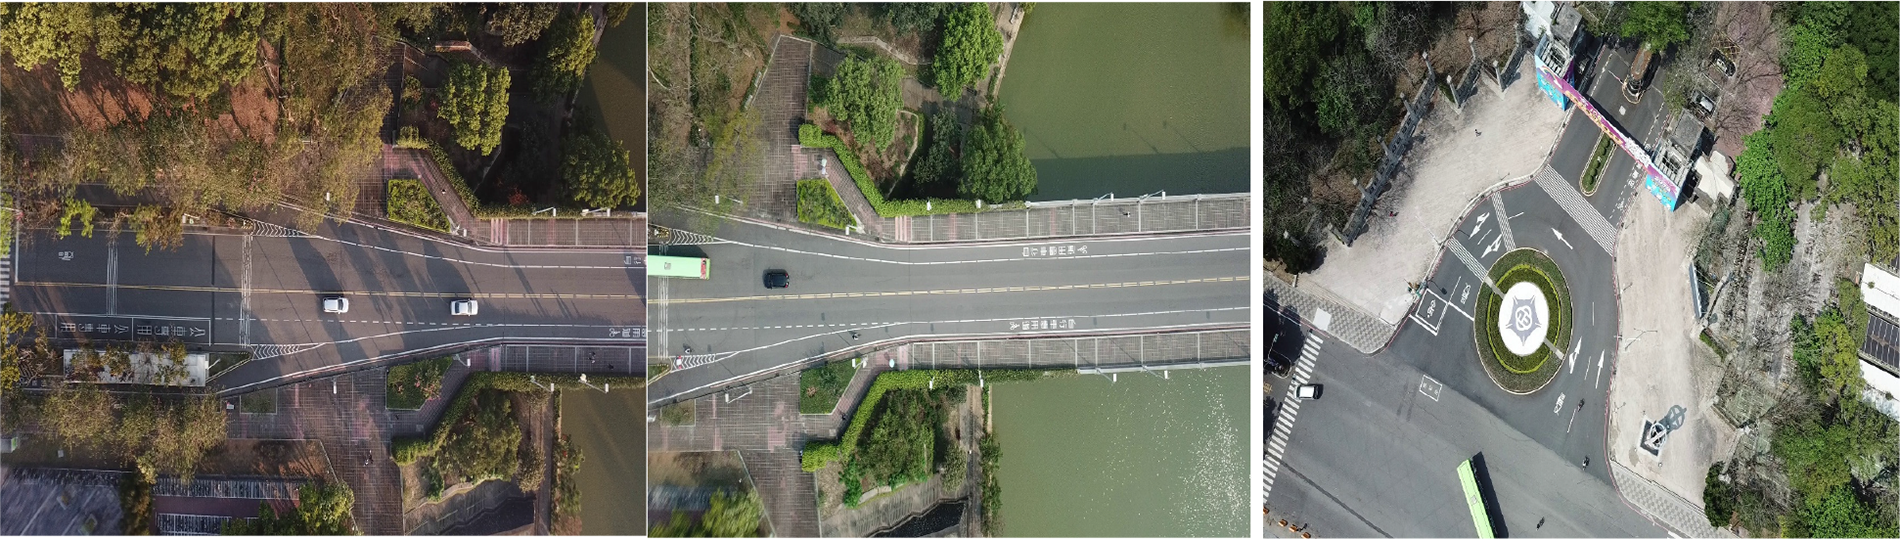
Figure 10: Sample images from the VAID dataset
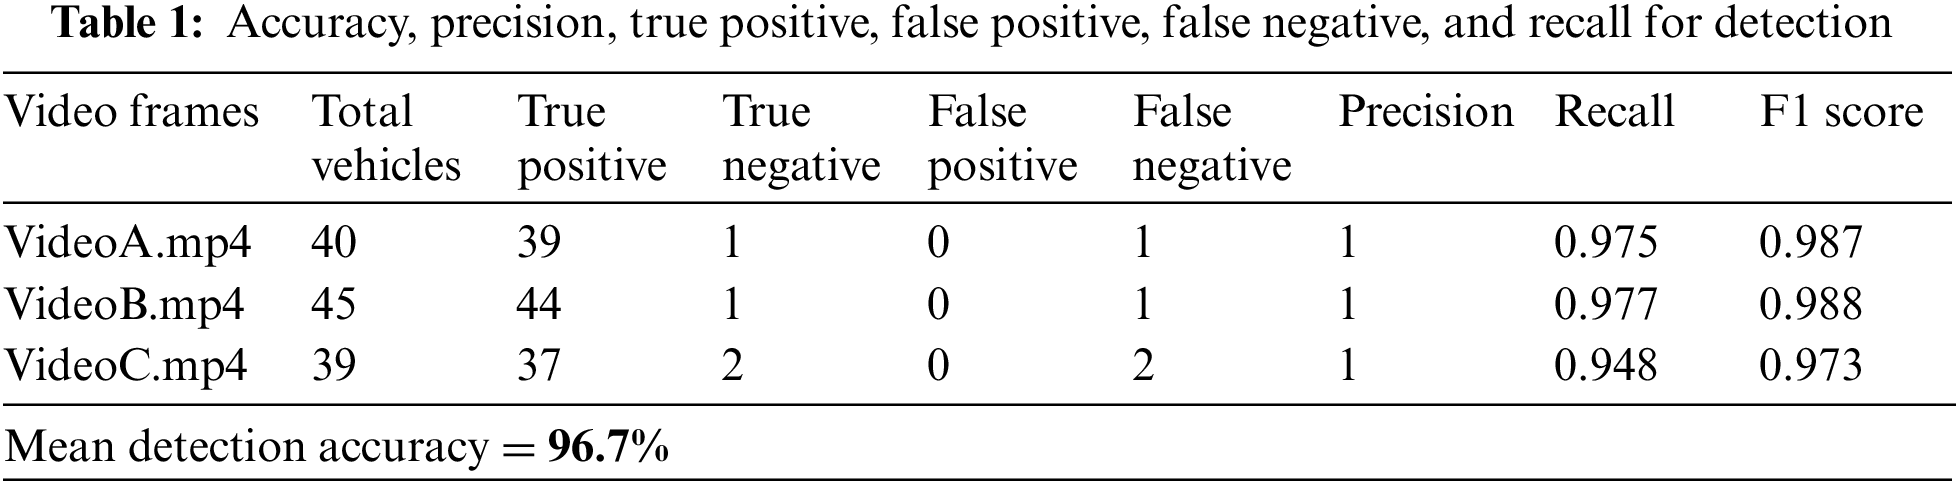
This section discusses the training and testing process for the detection phase as well as the detection results obtained on the VAID dataset. Furthermore, measures like precision, recall, and F1 score is used to assess the detection results. The following formulae are used to calculate these measures.
For the detection, we manually annotated the dataset images using an online labeling tool. A text file containing the coordinates of bounding boxes was created against each image frame. The training of the model was done through Google Colab [38,39] by utilizing the NVIDIA Tesla t4 Graphics Processing Unit (GPU) provided and by using darknet 53 [40,41] as the backbone of our YOLOv3 model. The model was trained in the Colab environment using Tensorflow version 2.9 in python version 3.9.6. The training was done on 4000 image samples from our dataset and for testing, the video was created by taking the frames together and the code was implemented in OpenCV 4.7.0 python in a jupyter notebook [42]. Fig. 11, below shows the detection results and evaluation of different metrics in tabular form is given in Table 1.
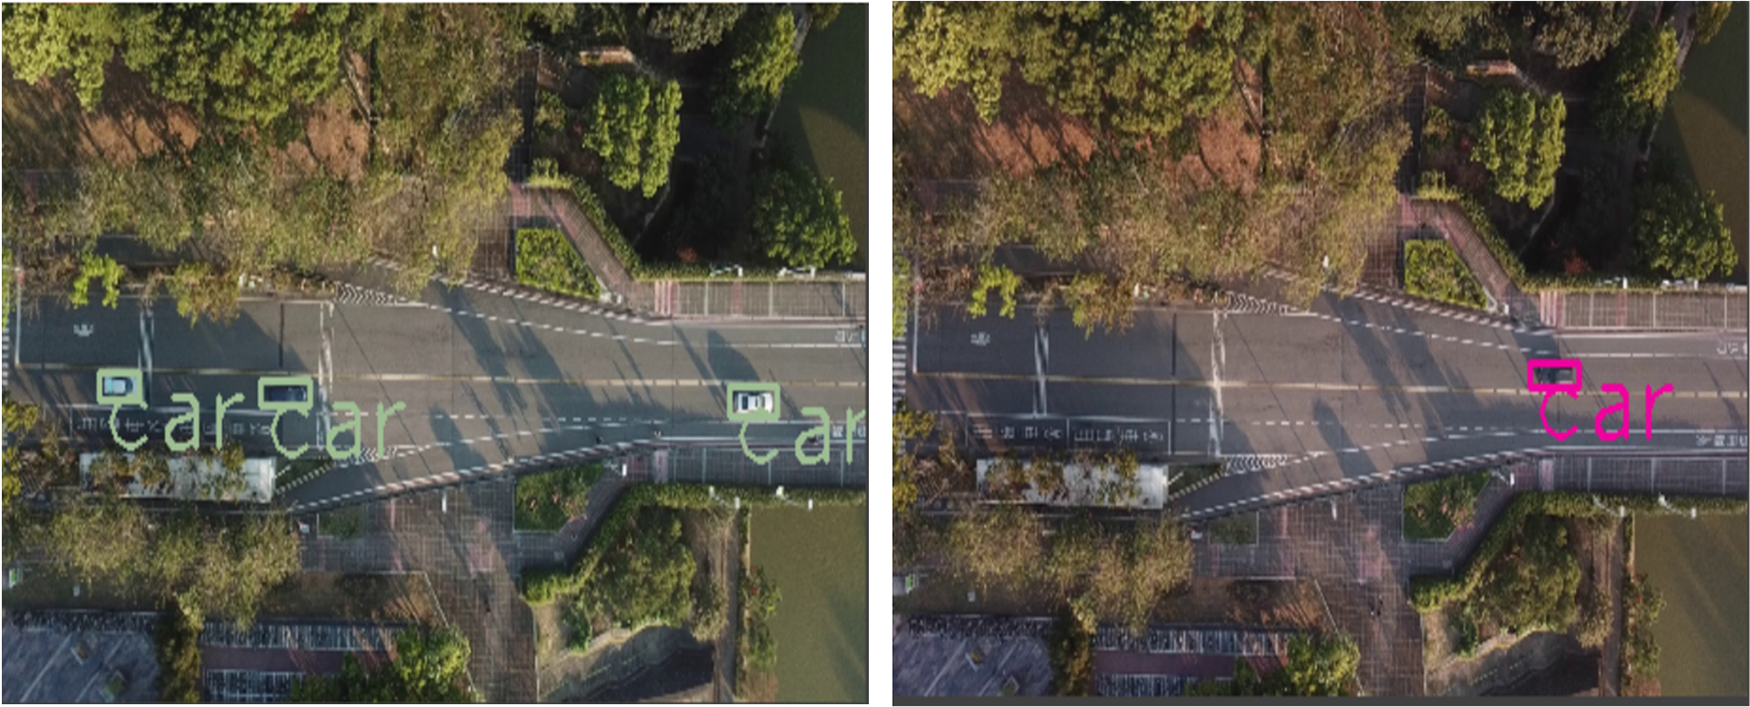
Figure 11: Yolov3 detection results
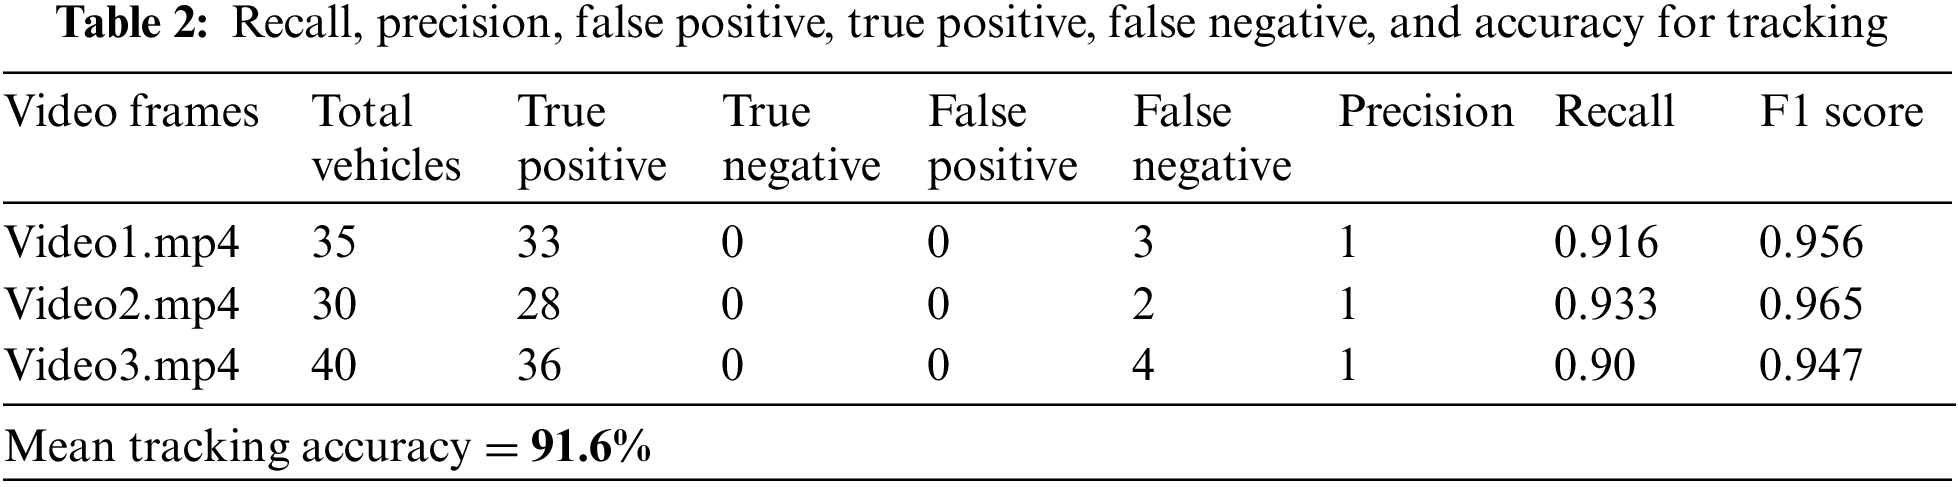
In this section, the outcomes of vehicle tracking on the VAID dataset are described in detail and assessed using metrics including precision, recall, and F1 score using Eqs. (12)–(14). The proportion of true positive values among all obtained positive values that determine a class’s accuracy. The Recall is the proportion of true positive values among all true positive and false negative values. Precision and recall values are used to calculate the F1 score.
The Kalman filter and centroid tracking were used to track the cars. Each car received a special id. The code was implemented in a Jupyter notebook using OpenCV Python on a Windows device with 8 GB of RAM [29,30]. Fig. 12 shows the tracking results and evaluation of metrics is displayed in Table 2.
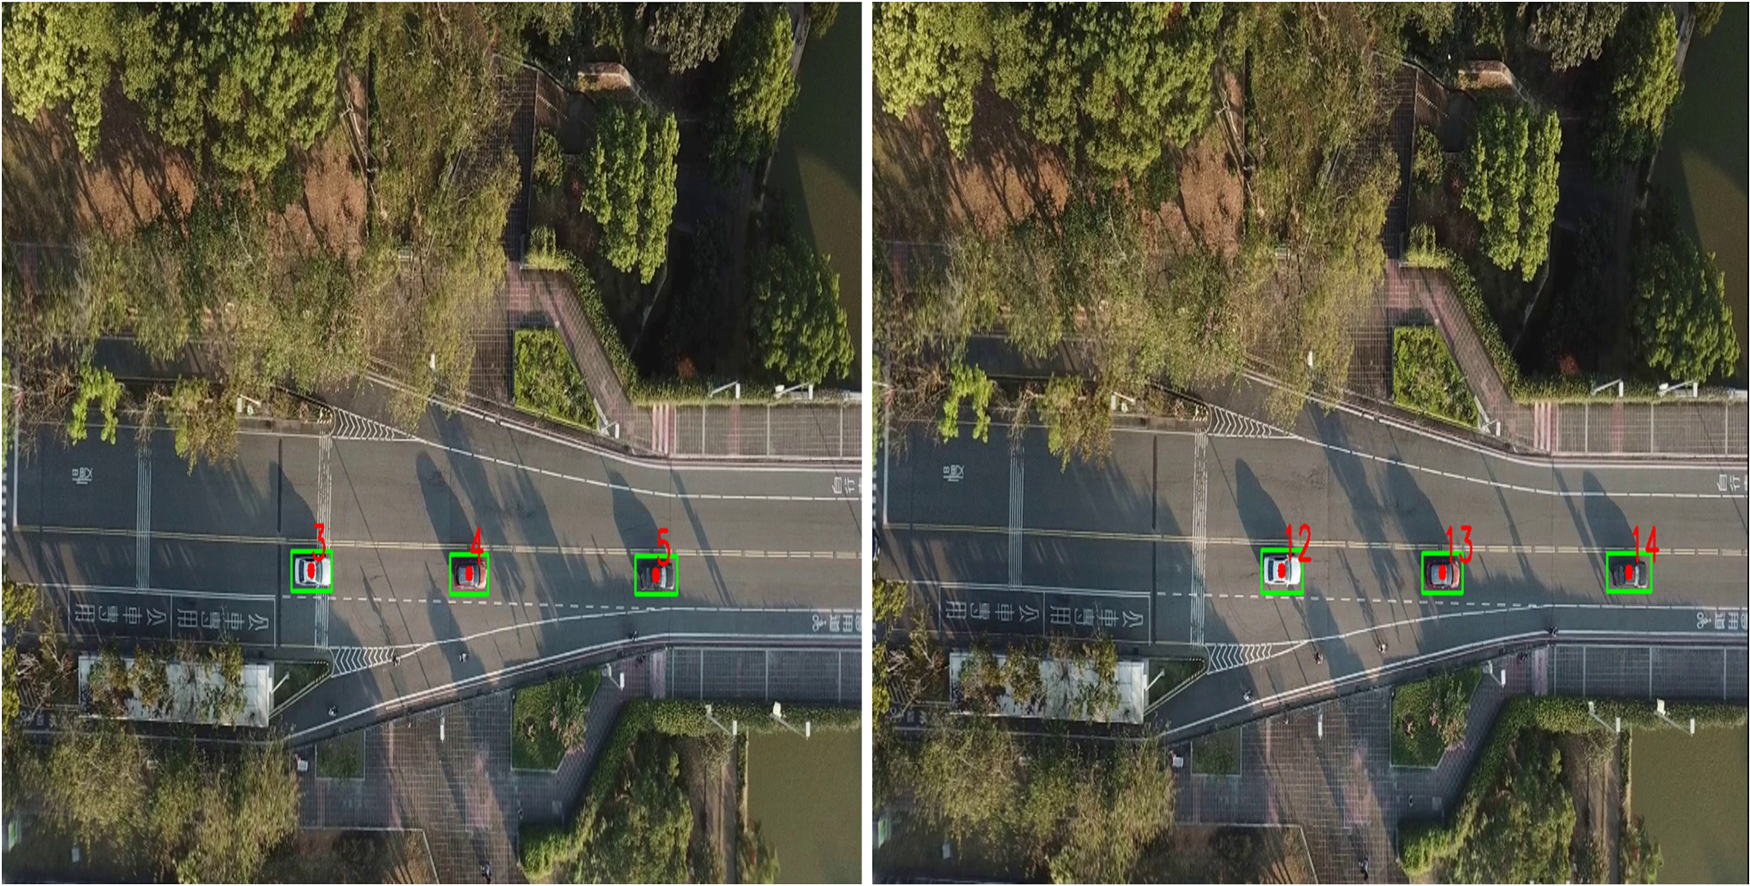
Figure 12: Vehicle tracking results in sequences of frames
4.4 Trajectory Analysis Evaluation
This section describes how to analyze moving vehicle trajectory data to determine driving direction. The findings of the Lucas-Kannade optical flow method utilized to get the trajectories are shown in Fig. 13.
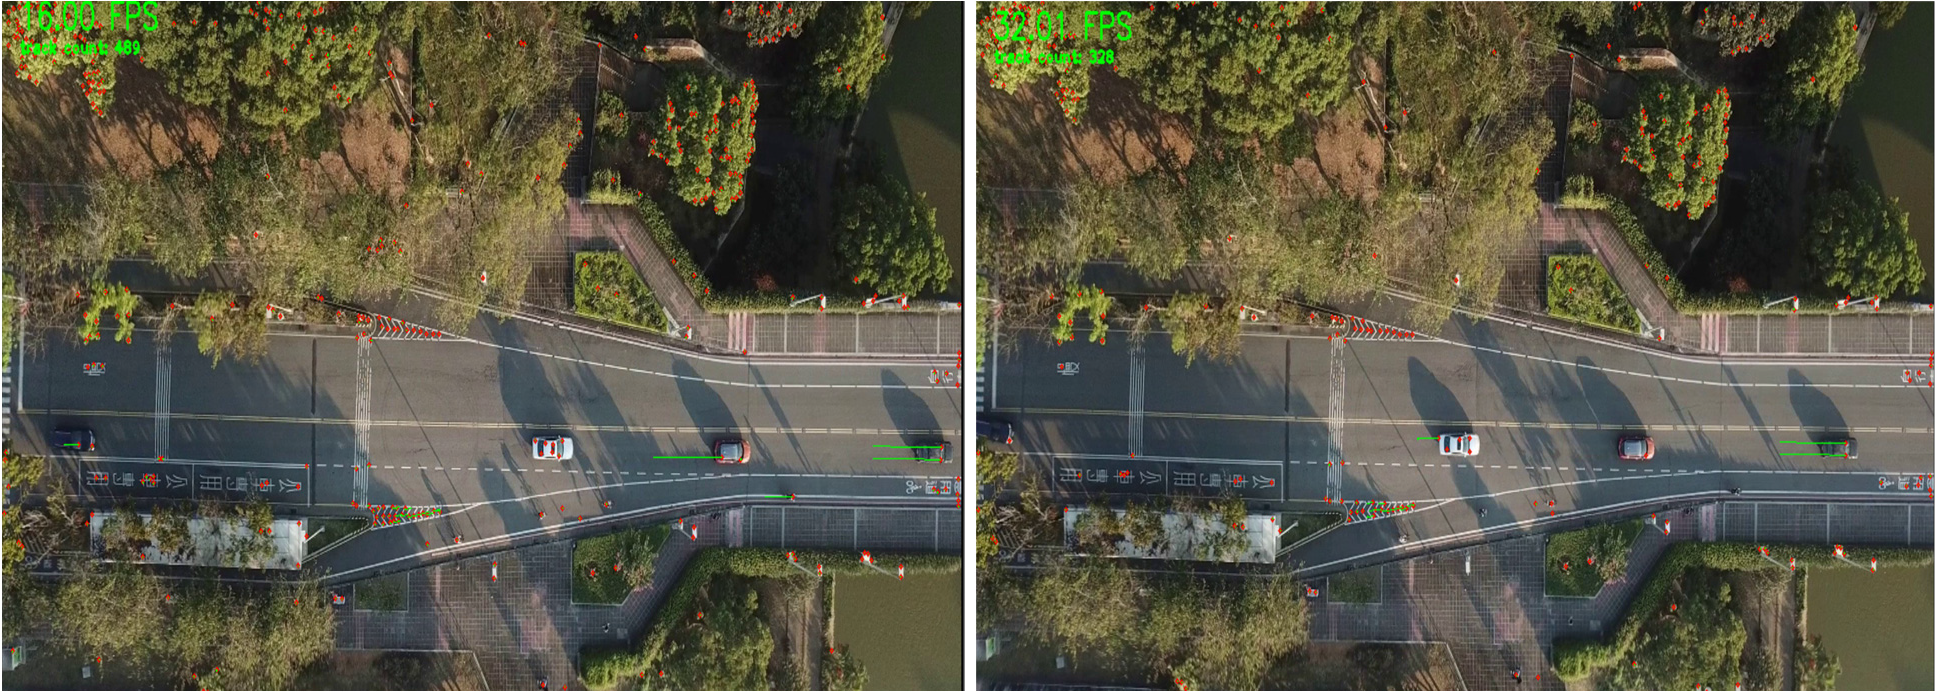
Figure 13: Optical flow results
The majority of highways have barriers separating the two travel directions. We distinguish the driving instructions into two directions, namely direction A and direction B, keeping this supposition in mind. Therefore, if the distance between the car and the camera is gradually decreasing, the vehicle is driving in direction A, and if it is gradually growing, the vehicle is moving in direction B. And therefore, by calibrating the camera for the desired output, many parameters can be obtained.
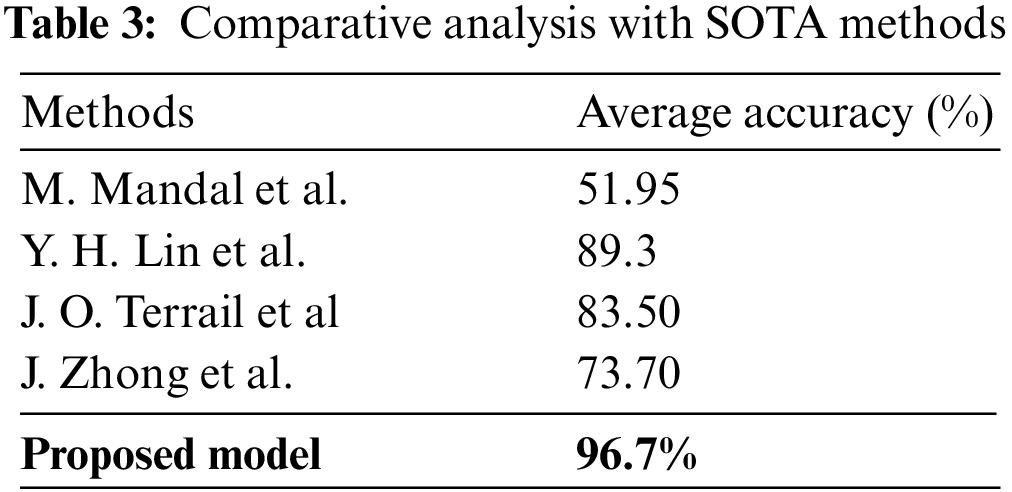
4.5 Comparison with State-of-the-Art Methods
This section compares the proposed model with other recent state-of-the-art methods. The comparison is shown in Table 3, and it shows that the proposed model outperforms them.
In this article, a model for locating and locating automobiles using aerial images was proposed. However, there is still potential for improvement. The experimental findings demonstrate that the suggested model is capable of identifying and tracking the cars with high accuracy and also aids in driving direction analysis. For instance, cars were currently categorized under a single umbrella category. To further improve the efficacy of our model, we will integrate categorization approaches in the future. The suggested model was tested on a single dataset, however, evaluating it on more complicated datasets can help identify its limitations when facing a variety of difficulties. This dataset included UAV-shot pictures of cars. It will be helpful to establish the suggested model’s general applicability by using various datasets, such as those from even more difficult angles or those with more varied illumination.
In this paper, a vehicle detection and tracking model was proposed using the VAID dataset. The method involved the various steps of georeferencing and coregistration of the input frames, segmenting out the road, preprocessing the segmented frames, performing the detection and tracking on the dataset, and analyzing the driving directions. Detailed experiments of this model using the above-mentioned dataset have shown that the system is efficient and robust against many challenges. Moreover, it has achieved high accuracy for both detection and tracking purposes. Hence, this research proves that combining state-of-the-art methods for detection with traditional methods for segmentation and tracking yields more fruitful results.
Funding Statement: This research was supported by the MSIT (Ministry of Science and ICT), Korea, under the ICAN (ICT Challenge and Advanced Network of HRD) program (IITP-2023-RS-2022-00156326) supervised by the IITP (Institute of Information & Communications Technology Planning & Evaluation).
Conflicts of Interest: The authors declare that they have no conflicts of interest to report regarding the present study.
References
1. M. Elloumi, R. Dhaou, B. Escrig, H. Idoudi and L. Saidane, “Monitoring road traffic with a UAV-based system,” in Proc. IEEE Wireless Communications and Networking Conf. (WCNC), Barcelona, Spain, pp. 1–6, 2018. [Google Scholar]
2. R. Reshma, T. Ramesh and P. Sathishkumar, “Security situational aware intelligent road traffic monitoring using UAVs,” in Proc. on VLSI Systems, Architectures, Technology and Applications (VLSI-SATA), Bengaluru, India, pp. 1–6, 2016. [Google Scholar]
3. E. I. Grøtli, J. Haugen, T. Johansen and L. Imsland, “Adaptive sampling for UAV sensor network in oil spill management,” in Proc. American Control Conf. (ACC), New Orleans, LA, USA, pp. 1515–1522, 2021. [Google Scholar]
4. C. Raj, B. Sree and R. Madhavan, “Vision based accident vehicle identification and scene investigation,” in Proc. IEEE Region 10 Symp. (TENSYMP), Cochin, India, pp. 1–5, 2017. [Google Scholar]
5. R. Ke, Z. Li, J. Tang, Z. Pan and Y. Wang, “Real-time traffic flow parameter estimation from UAV video based on ensemble classifier and optical flow,” IEEE Transactions on Intelligent Transportation Systems, vol. 20, no. 1, pp. 54–64, 2019. [Google Scholar]
6. A. A. Rafique, A. Jalal and K. Kim, “Statistical multi-objects segmentation for indoor/outdoor scene detection and classification via depth images,” in Proc. of 17th Int. Bhurban Conf. on Applied Sciences and Technology (IBCAST), Islamabad, Pakistan, pp. 271–276, 2020. [Google Scholar]
7. A. Jalal, Y. Kim and D. Kim, “Ridge body parts features for human pose estimation and recognition from RGB-D video data,” in Proc. of Fifth Int. Conf. on Computing, Communications and Networking Technologies (ICCCNT), Hefei, China, pp. 1–6, 2014. [Google Scholar]
8. I. Akhter, A. Jalal and K. Kim, “Adaptive pose estimation for gait event detection using context-aware model and hierarchical optimization,” Journal of Electrical Engineering & Technology, vol. 9, pp. 1–9, 2021. [Google Scholar]
9. A. Nadeem, A. Jalal and K. Kim, “Human actions tracking and recognition based on body parts detection via artificial neural network,” in Proc. of 3rd Int. Conf. on Advancements in Computational Sciences (ICACS), Lahore, Pakistan, pp. 1–6, 2020. [Google Scholar]
10. A. Ahmed, A. Jalal and K. Kim, “Region and decision tree-based segmentations for multi-objects detection and classification in outdoor scenes,” in Proc. of Int. Conf. on Frontiers of Information Technology (FIT), Islamabad, Pakistan, pp. 209–214, 2019. [Google Scholar]
11. A. Ahmed, A. Jalal and K. Kim, “A novel statistical method for scene classification based on multi-object categorization and logistic regression,” Sensors, vol. 20, no. 14, pp. 3871, 2020. [Google Scholar] [PubMed]
12. Y. Ghadi, I. Akhter, M. Alarfaj, A. Jalal and K. Kim, “Syntactic model-based human body 3D reconstruction and event classification via association based features mining and deep learning,” PeerJ Computer Science, vol. 7, pp. e764, 2021. [Google Scholar] [PubMed]
13. A. Jalal, N. Sarif, J. T. Kim and T. S. Kim, “Human activity recognition via recognized body parts of human depth silhouettes for residents monitoring services at smart home,” Indoor and Built Environment, vol. 22, pp. 271–279, 2013. [Google Scholar]
14. M. Smadi, K. Abdulrahim and R. Salam, “Traffic surveillance: A review of vision based vehicle detection, recognition and tracking,” International Journal of Applied Engineering Research, vol. 11, pp. 713–726, 2016. [Google Scholar]
15. M. Radhakrishnan, “Video object extraction by using background subtraction techniques for sports applications,” Digital Image Processing, vol. 5, pp. 91–97, 2013. [Google Scholar]
16. L. Lin and H. Feng, “Vehicles detection based on three-frame-difference method and cross-entropy threshold method,” Computer Engineering, vol. 37, pp. 172–174, 2011. [Google Scholar]
17. Y. Liu, Y. Lu, Q. Shi and J. Ding, “Optical flow based urban road vehicle tracking,” in 2013 Ninth Int. Conf. on Computational Intelligence and Security, Emeishan, China, pp. 391–395, 2013. [Google Scholar]
18. K. Park, D. Lee and Y. Park, “Video-based detection of street-parking violation,” in Int. Conf. on Image Processing, IPCV, Las Vegas, Nevada, USA, pp. 152–156, 2007. [Google Scholar]
19. K. Park, D. Lee and Y. Park, “Video-based detection of street-parking violation,” in 2007 Int. Conf. on Image Processing, Computer Vision, and Pattern Recognition, IPCV, Las Vegas, NV, USA, pp. 152–156, 2007. [Google Scholar]
20. D. Han, M. J. Leotta, D. B. Cooper and J. L. Mundy, “Vehicle class recognition from video-based on 3D curve probes,” in 2005 IEEE Int. Workshop on Visual Surveillance and Performance Evaluation of Tracking and Surveillance, Beijing, China, pp. 285–292, 2005. [Google Scholar]
21. Z. Zhao, P. Zheng, S. Xu and X. Wu, “Object detection with deep learning: A review,” arXiv e-prints, arXiv:1807.05511, 2018. [Google Scholar]
22. G. Ross, J. Donahue, T. Darrell and J. Malik, “Rich feature hierarchies for accurate object detection and semantic segmentation,” in Proc. of the IEEE Conf. on Computer Vision and Pattern Recognition, Columbus, Ohio, USA, pp. 580–587, 2014. [Google Scholar]
23. A. Kumar, S. Bhatia, K. Kaushik, S. Gandhi, S. Devi et al., “Survey of promising technologies for Quantum drones and networks,” IEEE Access, vol. 9, pp. 125868–125911, 2021. [Google Scholar]
24. D. Turner, A. Lucieer and L. Wallace, “Direct georeferencing of ultrahigh-resolution UAV imagery,” IEEE Transactions on Geoscience and Remote Sensing, vol. 52, pp. 2738–2745, 2014. [Google Scholar]
25. A. A. Rafique, A. Jalal and A. Ahmed, “Scene understanding and recognition: Statistical segmented model using geometrical features and gaussian naïve bayes,” in Proc. of IEEE Conf. on Int. Conf. on Applied and Engineering Mathematics, Islamabad, Pakistan, pp. 1–6, 2019. [Google Scholar]
26. A. Jalal and Y. Kim, “Dense depth maps-based human pose tracking and recognition in dynamic scenes using ridge data,” in Proc. of 11th IEEE Int. Conf. on Advanced Video and Signal Based Surveillance (AVSS), Seoul, South Korea, pp. 119–124, 2014. [Google Scholar]
27. H. Lin, K. Tu and C. Li, “VAID: An aerial image dataset for vehicle detection and classification,” IEEE Access, vol. 8, pp. 212209–212219, 2020. [Google Scholar]
28. M. Javeed, A. Jalal and K. Kim, “Wearable sensors based exertion recognition using statistical features and random forest for physical healthcare monitoring,” in Proc. of 17th Int. Bhurban Conf. on Applied Sciences and Technology (IBCAST), Islamabad, Pakistan, pp. 2512–2517, 2020. [Google Scholar]
29. M. Gochoo, I. Akhter, A. Jalal and K. Kim, “Stochastic remote sensing event classification over adaptive posture estimation via multifused data and deep belief network,” Remote Sensing, vol. 13, pp. 1–29, 2021. [Google Scholar]
30. J. Wang, T. Kuo, L. Li and A. Zeller, “Assessing and restoring reproducibility of Jupyter notebooks,” in Proc. on Automated Software Engineering (ASE), Rochester, MI, USA, pp. 138–149, 2020. [Google Scholar]
31. J. Uijlings, K. Sande, T. Gevers and A. Smeulders, “Selective search for object recognition,” International Journal of Computer Vision, vol. 104, pp. 154–171, 2013. [Google Scholar]
32. H. Kaiming, Z. Xiangyu, R. Shaoqing and S. Jian, “Spatial pyramid pooling in deep convolutional networks for visual recognition,” IEEE Transactions on Pattern Analysis & Machine Intelligence, vol. 37, pp. 1904–1916, 2016. [Google Scholar]
33. W. Liu, D. Anguelov, D. Erhan, C. Szegedy, S. Reed et al., “SSD: Single shot multibox detector,” in 2016 European Conf. on Computer Vision, Amsterdam, Netherlands, 2016. [Google Scholar]
34. J. Redmon, S. Divvala, R. Girshick and A. Farhadi, “You only look once: Unified, real-time object detection,” in 2016 IEEE Conf. on Computer Vision and Pattern Recognition (CVPR), Las Vegas, NV, USA, pp. 779–788, 2016. [Google Scholar]
35. A. Yilmaz, O. Javed and M. Shah, “Object tracking: A survey,” ACM Computing Surveys (CSUR),vol. 222, no. 4, pp. 1–45, 2006. [Google Scholar]
36. S. Salti, A. Cavallaro and L. Di Stefano, “Adaptive appearance modeling for video tracking: Survey and evaluation,” IEEE Transactions on Image Processing, vol. 21, no. 10, pp. 4334–4348, 2012. [Google Scholar] [PubMed]
37. S. Hare, A. Saffari and P. H. S. Torr, “Struck: Structured output tracking with kernels,” in 2011 Int. Conf. on Computer Vision, Barcelona, Spain, pp. 263–270, 2011. [Google Scholar]
38. H. David, S. Thrun and S. Savarese, “Learning to track at 100 FPS with deep regression networks,” in Computer Vision–ECCV 2016: 14th European Conf., Amsterdam, The Netherlands, October 11–14, 2016, Proc., Part I, Amsterdam, The Netherlands, Springer International Publishing, vol. 14, pp. 749–765, 2016. [Google Scholar]
39. T. Ran, E. Gavves and A. W. M. Smeulders, “Siamese instance search for tracking,” in Proc. of the IEEE Conf. on Computer Vision and Pattern Recognition, Las Vegas, NV, USA, pp. 1420–1429, 2016. [Google Scholar]
40. B. Luca, J. Valmadre, J. F. Henriques, A. Vedaldi and P. H. S. Torr, “Fully-convolutional siamese networks for object tracking,” in Computer Vision–ECCV 2016 Workshops: Amsterdam, The Netherlands, October 8–10 and 15–16, 2016, Proc., Part II, Amsterdam, The Netherlands, Springer International Publishing,vol. 14, pp. 850–865, 2016. [Google Scholar]
41. F. Christoph, A. Pinz and A. Zisserman, “Detect to track and track to detect,” in Proc. of the IEEE Int. Conf. on Computer Vision, Venice, Italy, pp. 3038–3046, 2017. [Google Scholar]
42. X. Yu, A. Alahi and S. Savarese, “Learning to track: Online multi-object tracking by decision making,” in Proc. of the IEEE Int. Conf. on Computer Vision, Santiago, Chile, pp. 4705–4713, 2015. [Google Scholar]
Cite This Article
 Copyright © 2023 The Author(s). Published by Tech Science Press.
This work is licensed under a Creative Commons Attribution 4.0 International License , which permits unrestricted use, distribution, and reproduction in any medium, provided the original work is properly cited.
 Downloads
 Citation Tools