
 Submit a Paper
 Propose a Special lssue
 Open Access
ARTICLE

MVCE-Net: Multi-View Region Feature and Caption Enhancement Co-Attention Network for Visual Question Answering
1 School of Information Science and Engineering, Xinjiang University, Urumqi, 830046, China
2 Xinjiang Key Laboratory of Multilingual Information Technology, Urumqi, 830046, China
* Corresponding Author: Yanbing Li. Email:
Computers, Materials & Continua 2023, 76(1), 65-80. https://doi.org/10.32604/cmc.2023.038177
Received 30 November 2022; Accepted 17 February 2023; Issue published 08 June 2023
 View Full Text
 Download PDF
Abstract
Visual question answering (VQA) requires a deep understanding of images and their corresponding textual questions to answer questions about images more accurately. However, existing models tend to ignore the implicit knowledge in the images and focus only on the visual information in the images, which limits the understanding depth of the image content. The images contain more than just visual objects, some images contain textual information about the scene, and slightly more complex images contain relationships between individual visual objects. Firstly, this paper proposes a model using image description for feature enhancement. This model encodes images and their descriptions separately based on the question-guided co-attention mechanism. This mechanism increases the feature representation of the model, enhancing the model’s ability for reasoning. In addition, this paper improves the bottom-up attention model by obtaining two image region features. After obtaining the two visual features and the spatial position information corresponding to each feature, concatenating the two features as the final image feature can better represent an image. Finally, the obtained spatial position information is processed to enable the model to perceive the size and relative position of each object in the image. Our best single model delivers a 74.16% overall accuracy on the VQA 2.0 dataset, our model even outperforms some multi-modal pre-training models with fewer images and a shorter time.Keywords
Visual question answering (VQA) [1] models must have a solid knowledge of the image content while reading text questions, and use the information from two models to obtain the correct answer. Therefore, the rapid advancement of computer vision and natural language processing favors the development of VQA. VQA has great application potential in helping visually impaired people understand the world, building intelligent question-answering systems, and improving the human-computer interaction experience.
The typical representatives of models based on the co-attention mechanism for VQA are deep Modular Co-Attention Network (MCAN) [2], Dynamic Fusion with Intra- and Inter-modality Attention Flow (DFAF) [3], and so on. These models all use the region features [4], and they not only get the region features but also the spatial position coordinates corresponding to these region features. However, these models generally ignore the position information of these visual features, or simply concatenate the coordinate information behind the visual features, which makes the model unable to perceive the spatial position of each region feature in the image well. In addition, these models only use the question and image as the input and do not further mine other information, such as optical character recognition (OCR) text in the image, image description text, and external knowledge. To make the VQA model better understand an image, we introduce image description as an auxiliary method of image understanding. First, the image description generation model [5,6] is used to generate the image description; then, the question-guided feature representation of the image description is generated based on the co-attention mechanism, so that the model can more fully learn the alignment information of the image and text. Compared with previous models using image description information, we tried to use a multi-modal pre-training model to obtain image description information and explore the impact of different models on the results of VQA. In addition, we explored whether adding image description data and integrating it with other innovative points of our model may increase the model’s accuracy even more.
Most of the early models extracted grid features of images from the convolution network [7], and each grid was of equal size. Later, the bottom-up attention based on Faster region-convolutional neural network (Faster R-CNN) [8] was used to extract region features from an image. The VQA model’s accuracy depending on region features has been greatly improved compared with the simple grid features obtained through convolution networks. Since then, visual region features based on bottom-up attention has become popular. Based on the bottom-up attention method, the grid model [9] extracts an “enhanced grid feature”, and the performance of the VQA model using this grid feature becomes significantly improved. However, the size of this “enhanced grid feature” is (608, 2048), which is 6 times that of the region feature of bottom-up attention (100, 2048). Moreover, there are only 36 region features in some images; thus, the training time is prolonged by approximately 6 times. Based on the optimization of this model and a bottom-up attention model, this paper proposes two models to extract region features, and these two models extract region features at the same position in an image and concatenate the two features as the final visual region features. In the future, we intend to investigate the effects of one-objective detection models [10,11] on extracting visual features, such as visual features obtained using mask region-convolutional neural network (Mask Refined R-CNN) [10].
When extracting region features based on Faster R-CNN, we also obtain the position coordinate information of each region feature. We further process the position coordinates to obtain the width, height, and center coordinate position of each region feature. Then, we calculate the relative size and relative distance between each region feature and all other region features in an image. Each region feature can perceive which region is relatively close, which is relatively far, which is larger and which is smaller. Regarding locations, each region feature can answer the questions more accurately.
Our innovations and contributions are summarized below:
1) Given that a larger image feature dimension can better represent the features of an image, we used two improved extractors to obtain two vision features at the same location, concatenating the two features as the final feature that can better represent the image.
2) The vision features alone cannot represent the image information comprehensively, so we introduce the implicit knowledge in the images. Based on the image caption generation model, image description texts are introduced to improve the model’s understanding of the image information.
3) Based on spatial position information, we designed a dense co-attention model to enhance the perception of spatial position. The model includes three units: a text self-attention (SA) module, an image self-attention module based on spatial position, and a question guided attention (GA) module. Due to the incorporation of spatial position information, the model is able to better answer counting-type questions.
4) Ablation experiments show that the methods this paper proposes are effective. Moreover, the effects of these methods can be superimposed. Our model has significantly improved the performance on the VQA 2.0 [12] and generative question answering (GQA) [13] datasets.
The attention mechanism [14,15] in deep learning places more attention resources into a certain area, and is similar to human attention mechanism. For example, people can quickly browse a whole image to obtain the focus area; then, focus on this area to obtain the information of the target of interest while ignoring other unnecessary information. In the paper [14], a hierarchical relational attention mechanism is suggested to accomplish a comparable capability. The paper [15] suggests a VQA model that makes use of the Bidirectional Encoder Representation from Transformers (BERT) to embedding question and the stacking self-attention. In particular, the model can concentrate on both the relationships between objects and a single object due to the stacking self-attention mechanism.
The majority of VQA approaches employ word embedding for linguistic features and a visual model trained on ImageNet [16] and Visual Genome (VG) [17] as distinct pre-training models. First, we will explain why we need to conduct a pre-training study of visual language. It is well known that pre-training models [18,19] such as BERT have significantly improved the effect of the text-downstream task. In fact, the effect is very important because the data volume of the downstream task is relatively small because it is manually annotated, and the effect is limited only by a small amount of data. Similarly, in the downstream task of learning visual language, it is also limited by the data volume of labeled training samples, and there is no way to further break through the effect.
We introduce our model structure in this section. Fig. 1 depicts the suggested model’s overall structure.
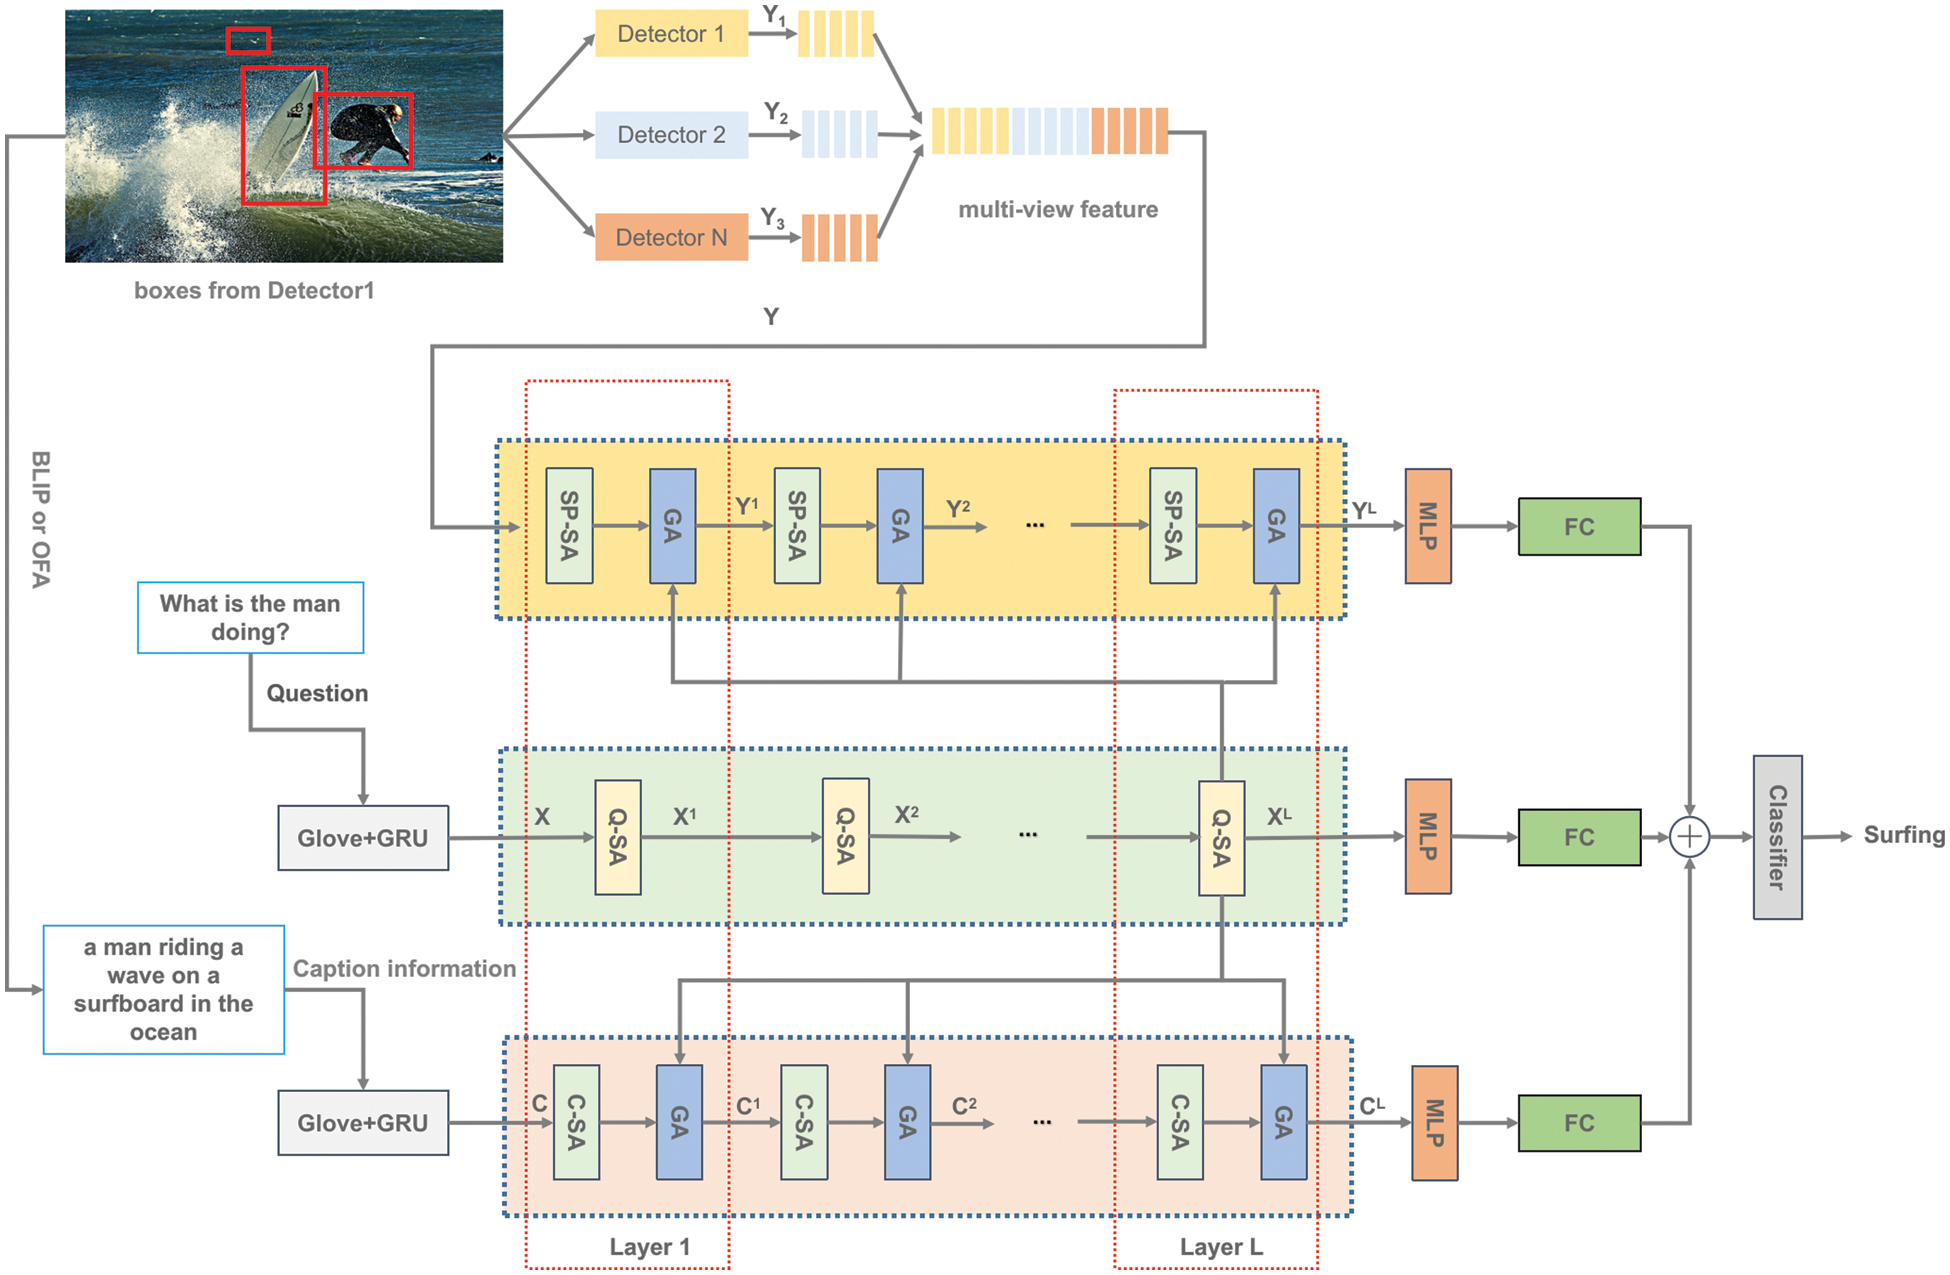
Figure 1: The structure of our proposed model, SA represents self-attention unit, and GA represents guided-attention unit
3.1 Text Question Representation
All questions are specified to a maximum of M words. Each question is encoded as a global vectors for word representation (GloVe) [20], which uses a public version of pre-training based on the Wikipedia corpus. If the length of the question is less than M, it is extended with a zero vector. The sequence after word embedding is encoded by the gated recurrent unit (GRU), and following is the calculating formula:
where
3.2 Image Description Text Extraction and Representation
The image description text depends on the image caption generation model. We use the bootstrapping language-image pre-training (BLIP) [5] and OFA [6] models to extract the corresponding two description texts. After obtaining the image description text, we use the GloVe word vector to encode and then use GRU for further processing to obtain the final feature C. The following is the calculating formula:
where
3.3 Image Feature Representation
At the moment, popular image feature extraction algorithms use the bottom-up attention to identify specific objects in an image and output the residual network (ResNet) feature of the image’s Top-k target regions. Based on the bottom-up attention, we made a modification and extracted the first new enhanced visual region feature. In a recent paper [9], grid features were extracted using the Faster R-CNN, and the result was noticeably better. However, the size of the grid features increased sharply, resulting in a training time that was too long. Therefore, we extracted a new visual region feature based on this model. All the detectors are pretrained on the VG dataset.
3.3.1 Improved Visual Region Features Based on Bottom-Up Attention
As shown in Fig. 2a, we modify based on bottom-up attention. First, we use the ResNeXt [21] C1−5 module to extract the feature map, and integrate the C5 module with C1−4. The initial region features are obtained by processing the 14 × 14 region of interest (ROI) Pooling operation. Finally, we employed the mean-pooled method to achieve the final region feature, which is our first target detector that extracts the region feature. The image’s feature can be expressed as follows:
where
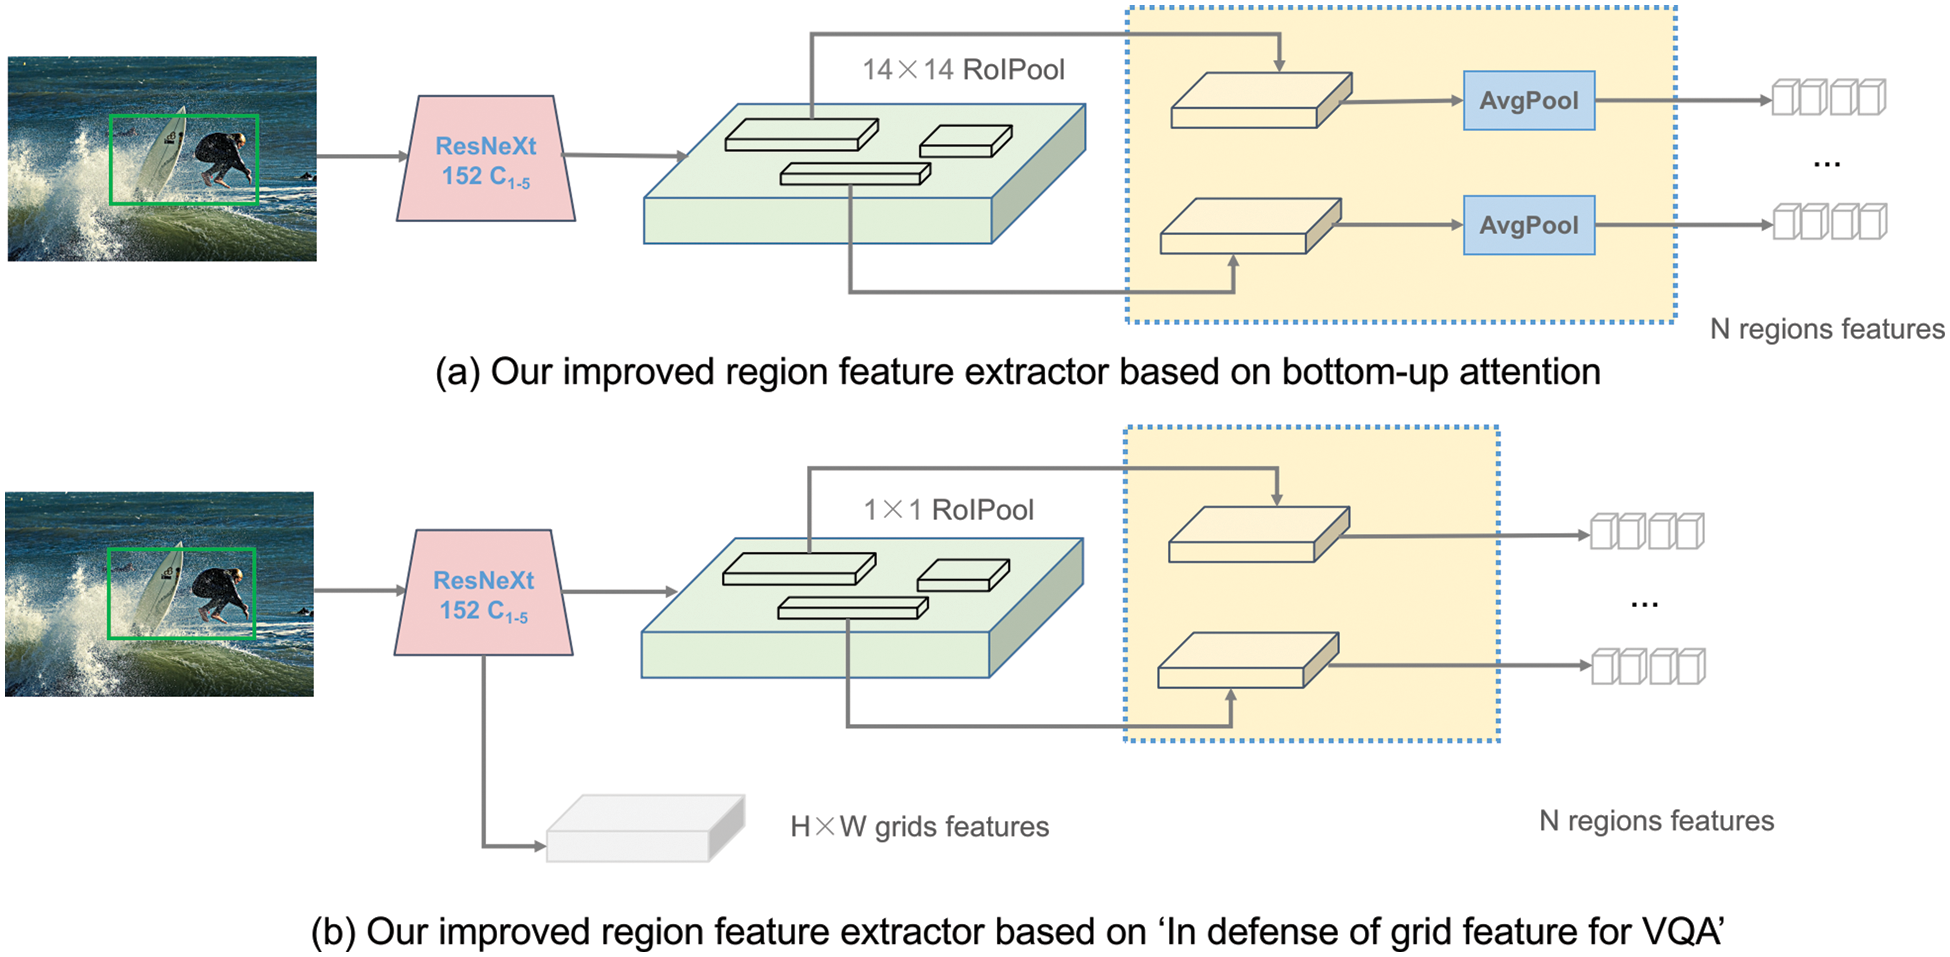
Figure 2: Overview of the extraction region model
3.3.2 Improved Visual Region Features Based on the Grid Model
As shown in Fig. 2b, the “In Defense of Grid Feature for VQA” model first uses the ResNet C1−5 module to extract the feature map and then uses 1 × 1 ROI Pooling operation to achieve the initial region feature; then two 1024-dimensional fully-connected (FC) layers are used. When extracting grid features, only the feature processed by ResNet is needed. To extract new visual region features, as shown in Fig. 3b, we first obtain the features processed by ResNet and then use the 1 × 1 ROI Pooling operation as the final visual region features. The image’s feature can be expressed as:
where
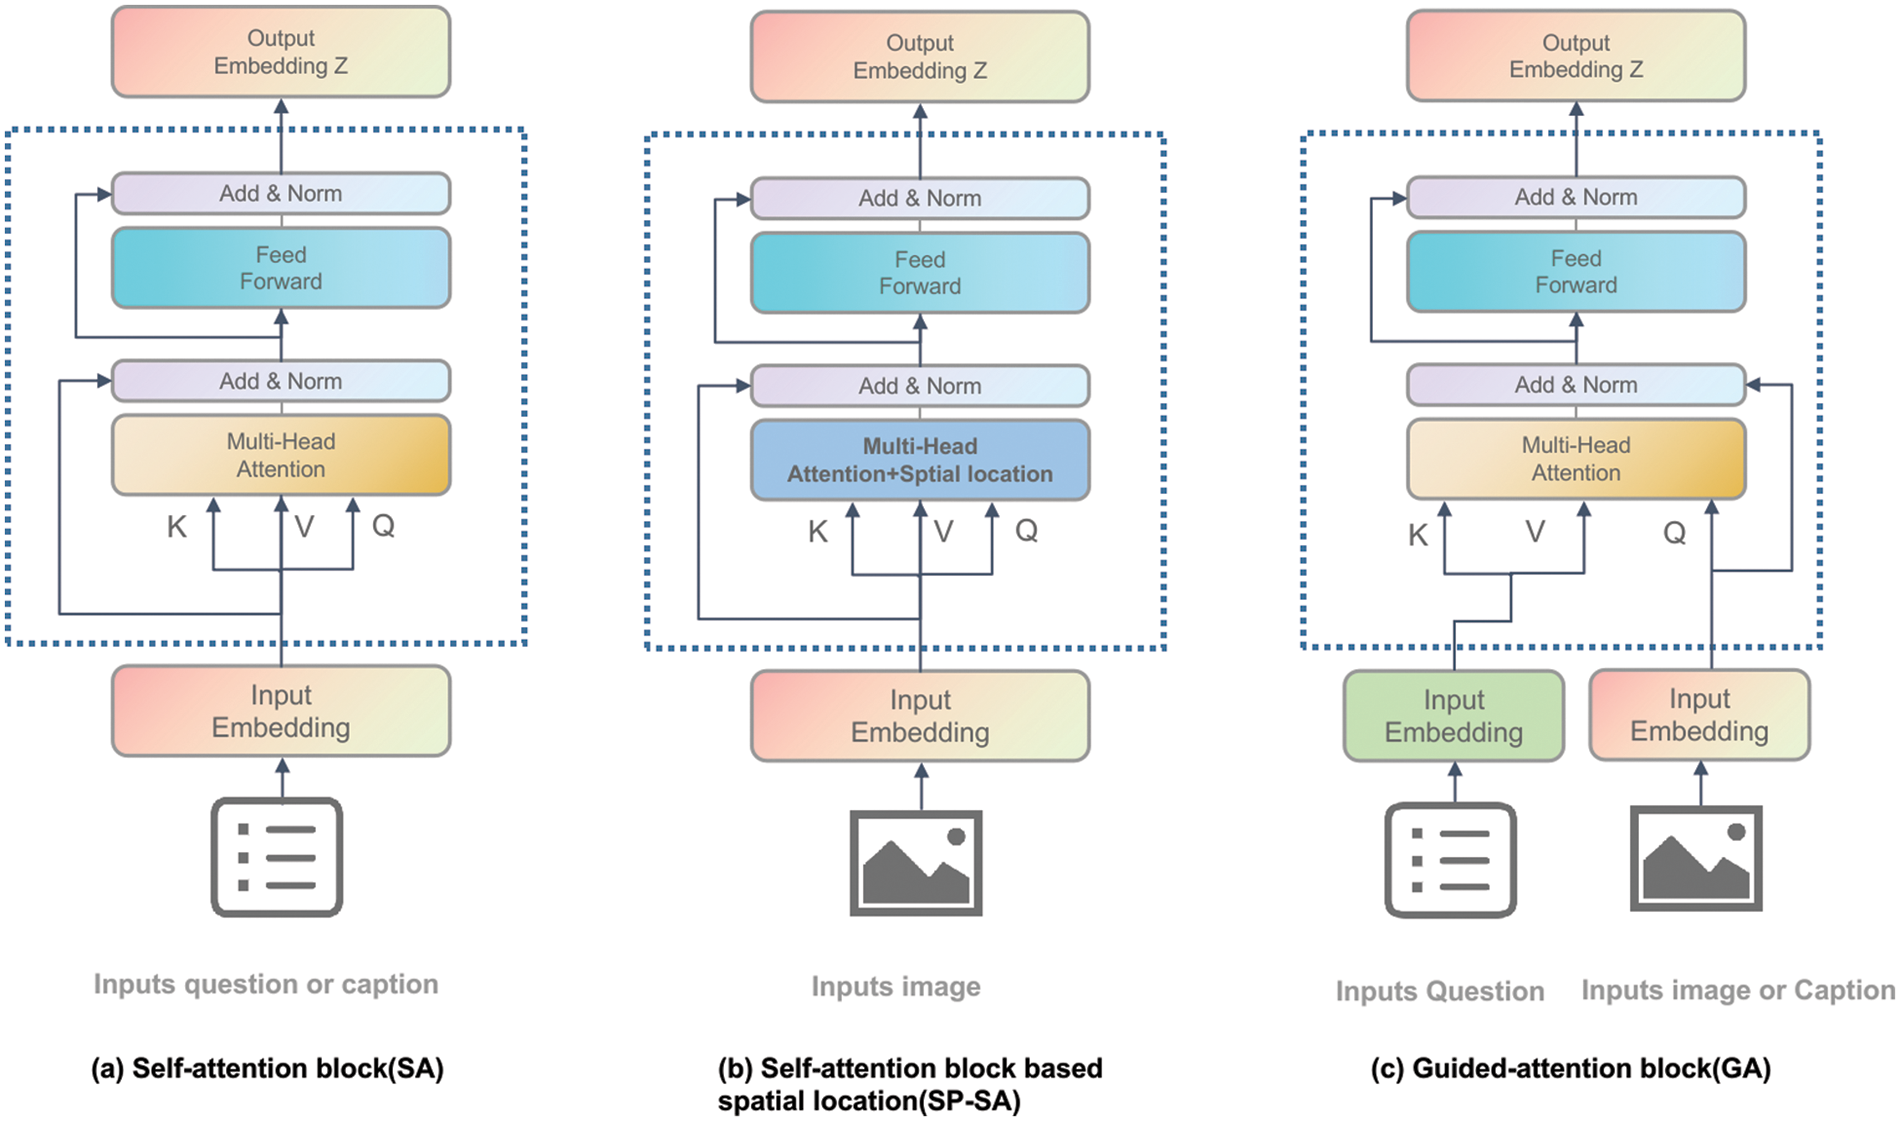
Figure 3: The three basic attention units’ architecture
3.3.3 Concatenating Two Region Features in the Same Spatial Position
We use the improved method based on the bottom-up attention to extract the first visual feature as the main feature and obtain the corresponding spatial position of the region feature (unified bounding box). The second visual feature extraction model based on the grid model obtains the second visual region feature of the same spatial position with the unified bounding box. Then, after obtained the two visual features, we concatenate in the first dimension of the two visual features and calculate the formula as follows:
where
3.4 Co-Attention Model Based on Image Description and Spatial Position
Our multi-modal attention model includes a text self-attention unit and a question-guided attention unit. The interaction information is learned between the same modal or different modal through the attention mechanism. The question-guided image attention has the same implementation method as the question-guided image description attention, except that the image feature representation is replaced by the image description text feature representation.
3.4.1 Multi-Head Self-Attention Mechanism
Before introducing the basic units of the co-attention mechanism of the model, we introduce multi-head self-attention. Because all the basic units of attention in the model are based on it, which includes a multi-head attention layer, a layer normalization layer, a residual link layer, and a forward layer. The input feature X is mapped by three matrices to obtain the corresponding matrices Q, K and V, which are calculated by a scaled dot-product. The calculation formula is as follows:
where Q represents the Query, K represents the key, V represents the Value, dk represents the dimension of the Query, Key and Value.
Using the multi-head attention mechanism which includes h attention operations, the model’s presentation ability is further enhanced. and each attention operation corresponds to a scaling dot product operation. The output representation of the multi-head attention layer is created by concatenating the operation results:
where
3.4.2 Text Self-Attention and Guide-Attention
As shown in Fig. 3a, we introduce text self-attention. The formula used to calculate SA is as follows:
where
The difference between the guide-attention mechanism module and the self-attention module lies in the input of two different features. As shown in Fig. 3c, the corresponding matrices of the question feature X as the guidance feature are K and V, and the corresponding matrix of the visual feature (or image description feature) is Q:
where
3.4.3 Image Self-Attention Based on Spatial Position Information
If spatial location information is not added to self-attention, the use of image self-attention is basically the same as that of text self-attention. Only the data input to the self-attention unit is different.
When acquiring the visual region features, we obtain the bounding box coordinates [xmin, ymin, xmax, ymax] of the object; thus, using the region feature over the grid feature is more advantageous. After the image self-attention is integrated into the spatial location information, it can better realize the size of all objects and the relative distances between objects in the image.
Given the coordinate position information of the regions in the image, the coordinates of the center point of the region are first calculated, and the distance between the two features of all regions in the image are calculated. Then the distance is divided by the width and height for standardization to obtain the relative distance. As a result, each region can detect its relative distance from other regions:
where [
Secondly, the width and height of each region are divided by the widths and heights of the other regions; thus, the relative size of each region is obtained to determine which regions are larger and which regions are smaller. Similarly, we can also obtain w, h.
Then, the above four vectors are concatenated together:
Finally, we use two fully-connected layers for processing:
where
We obtain spatial information and incorporate it into the self-attention unit. The self-attention based on spatial position (SPSA) is calculated using the following formula:
where Y represents the input features, only SP_ MHA and multi-head attention (MHA) have different calculation methods of attention, while others remain unchanged.
3.4.4 Cascade of the Attention Modules
To further improve the representation ability of the feature, we use a cascade approach to combine the attention modules. The output of the upper layer is used as the input of the lower layer. For the text attention mechanism, a total of L layers are stacked as the final text feature:
where
Then, the final image features are obtained by using the SPSA and GA:
where
Similarly, after obtaining the image description text feature C processed by GRU, the self-attention unit is used for processing and then input into the attention module GA:
where
4 Feature Fusion and Answer Prediction
After obtained the three features, we need to fuse them. We need to use multilayer perceptron (MLP) to process these three types of features to get the final features.
Moreover, the vector
where the vectors are
After the final fusion feature is obtained, the answer can be predicted. We receive a set of A candidate answers if the answer appears more than 8 times in the dataset. We categorize it using a linear classifier, and then we calculate the predicted probability value using a sigmoid function:
where vector
The VQA 2.0 dataset consists of 40,504 verification images, 81,434 test images, and 82,783 training images. All question sets’ answers are manually compiled, and the yes/no, number, and other answer categories make up the question-answer group. Ten volunteers answered each question. There were ten potential responses. The response chosen as the correct one was the one that appeared the most frequently out of the possible 10.
The GQA dataset contains 22 million questions as well as over 110 k images. The GQA dataset has more questions with multistep reasoning requirements and more evenly distributed answers. 51% of its questions focus on the relationships between the objects, while 94% demand multistep reasoning.
The hyperparameters of our model used in the experiments follow the MCAN model. The GQA dataset offered A = 1878 potential responses. The length of a tokenized word is 14 characters. The GQA dataset also used the VQA 2.0 learning rate technique. We applied cross-entropy (CE) loss to improve our model.
Based on the MCAN model, we conducted the following ablation experiments:
• MCAN: Denotes a benchmark model.
• MCAN + SPSA: MCAN combined with the SPSA module.
• MCAN + OFA: Refers to that extracts image description text based on the OFA model and introduces question-guided image description.
• MCAN + BLIP: Refers to the that extracts image description text based on the BLIP model and introduces question-guided image description.
• MCAN + vision feature1 (VF2): Denotes the use of the improved bottom-up attention to extract the region feature VF1 to replace the original bottom-up attention’s visual feature.
• MCAN + vision feature2 (VF2): Denotes the use of improved Faster R-CNN based on Grid model [14] to extract the region feature VF2 to replace the visual feature of the original bottom-up attention.
• MCAN + Concat (VF1, VF2): Indicates the features of VF1 and VF2 are concatenated as input visual features.
• MCAN + SPSA + OFA + Concat (VF1, VF2): All of the methods proposed in this paper are combined.
The ablation results are shown in Table 1. In the first row, the MCAN model is used as the benchmark model. In the second row, after introducing the SPSA module based on the MCAN, the accuracy is improved by 0.42%, indicating that the SPSA module is effective. In the third row, the OFA model is used to extract the image description text, and the accuracy is improved by 1.5%, which verifies that the question-guided image description attention mechanism module is effective. In the fourth line, the BLIP model is used to extract the description information, but the accuracy is only improved by 0.93%, indicating that different caption generation models have an impact on the accuracy. The fifth to seventh lines show that our two visual feature extractors are effective, and the accuracy is further improved after concatenating the two image features. Through ablation experiments, we found that the image description text of the OFA model is more effective than that of the BLIP model. Each method we proposed contributes to the improvement of the model, and the three methods can overlay the effects.
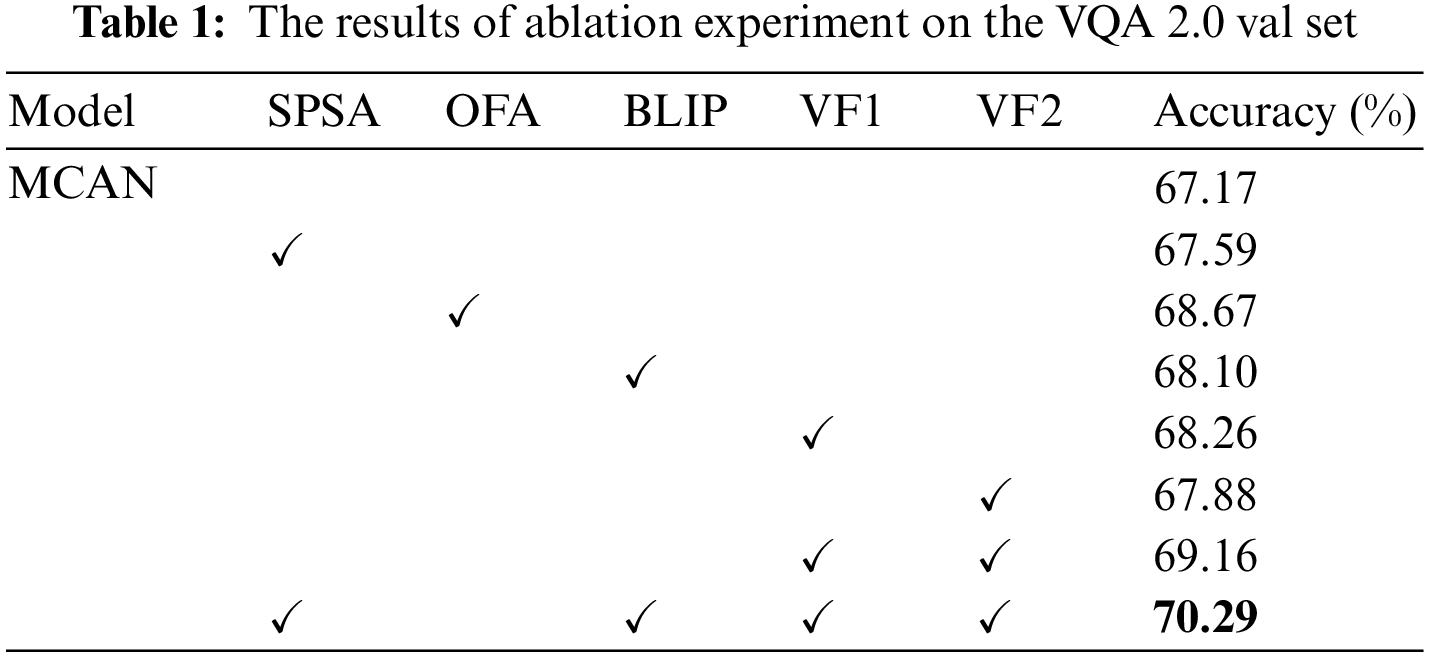
Fig. 4 shows the self-attention map of the question, the image description, the vision feature, and the guide-attention mechanism. With an increasing number of stacking layers, the keywords in the questions will be found, and some areas of the image will be focused on. We chose 4 questions at random and showed the image attention to exhibit the effects of our model (Fig. 5). The top three regions in the box with the best scores have something to do with the inquiries. The incorrect examples revealed the flaw in our model: 1) The model lacks certain common sense, as evidenced by its inability to detect the wording on the sign in the third example (e.g., in the fourth example, the model is unfamiliar with the famous people). The inadequacies mentioned here serve as a foundation for future advancements in VQA.

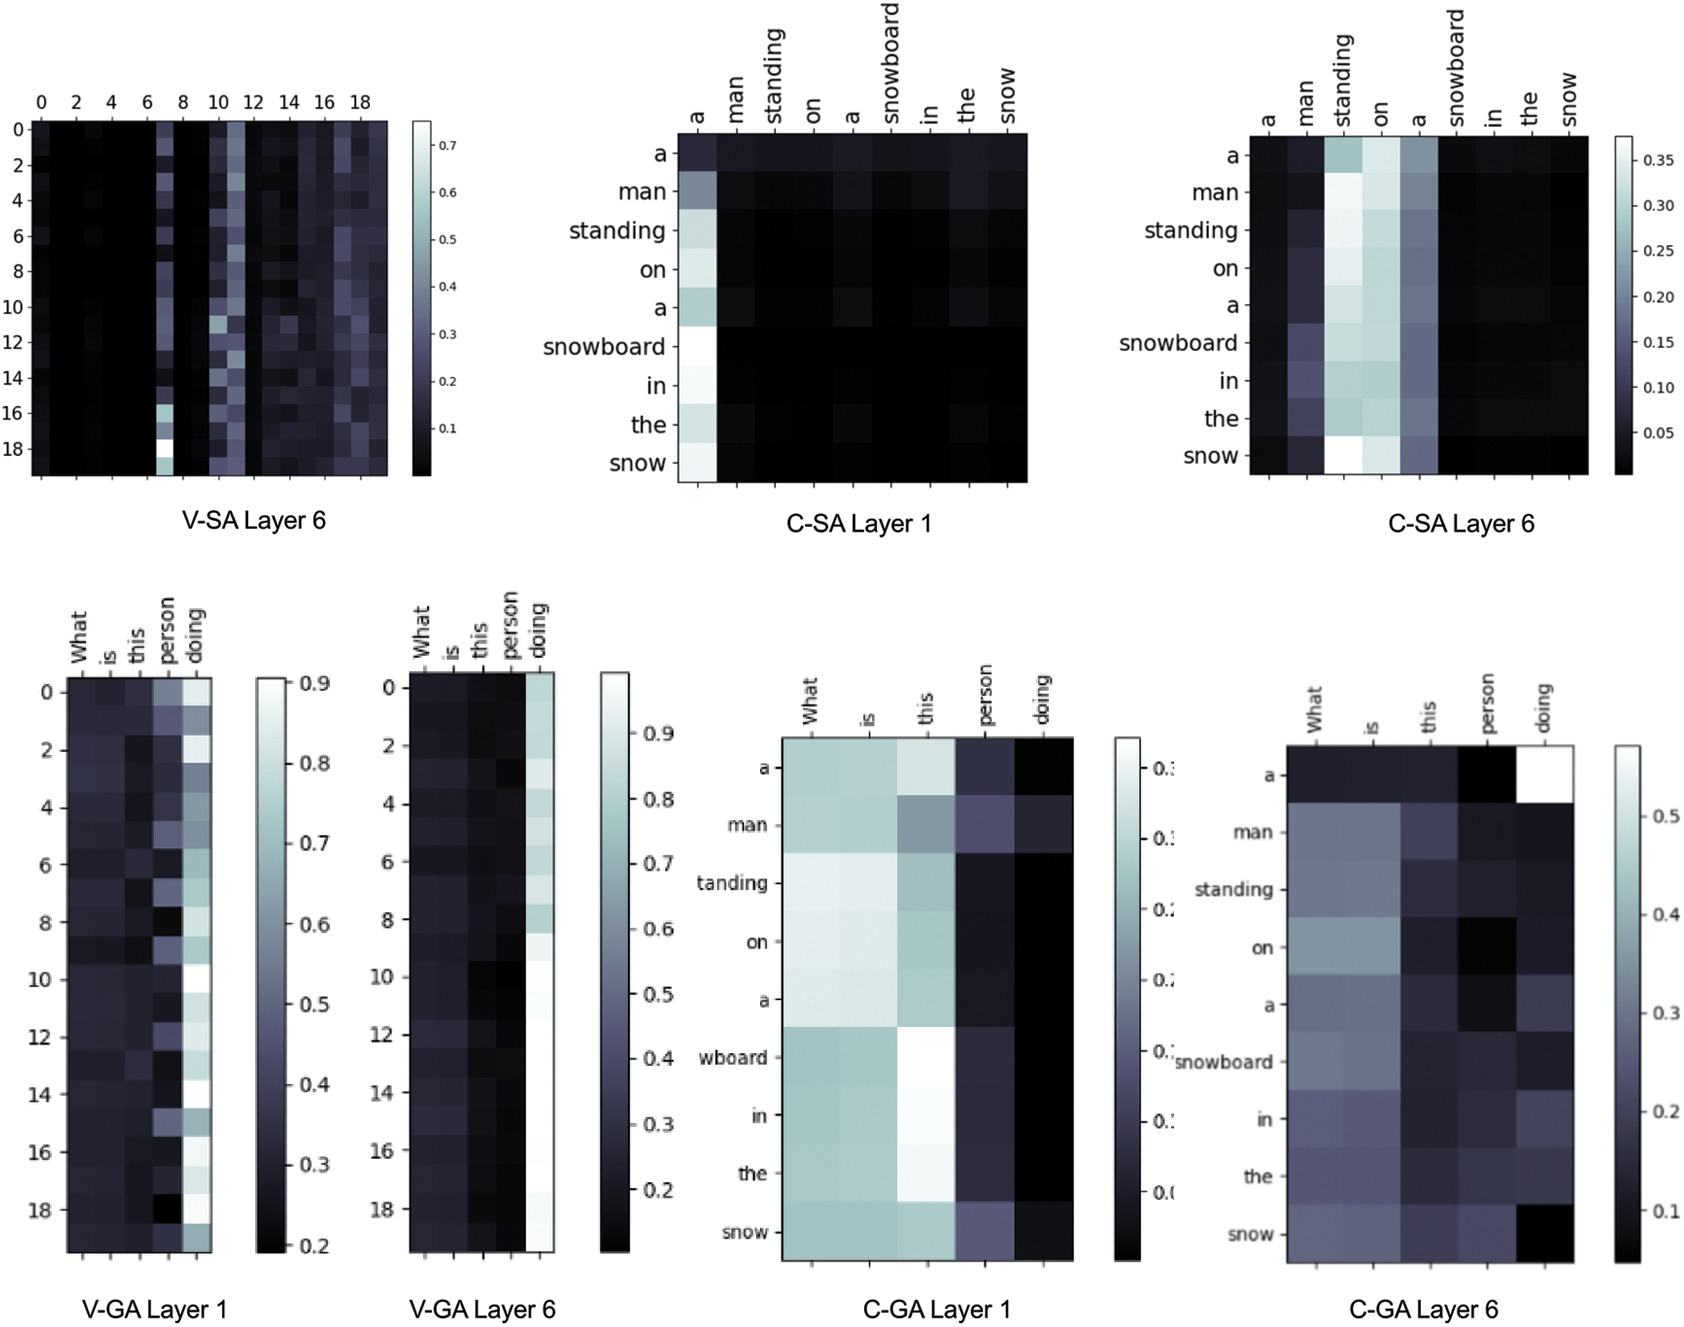
Figure 4: The number of layers of the attention is six. In the first and sixth layers, attention maps are displayed
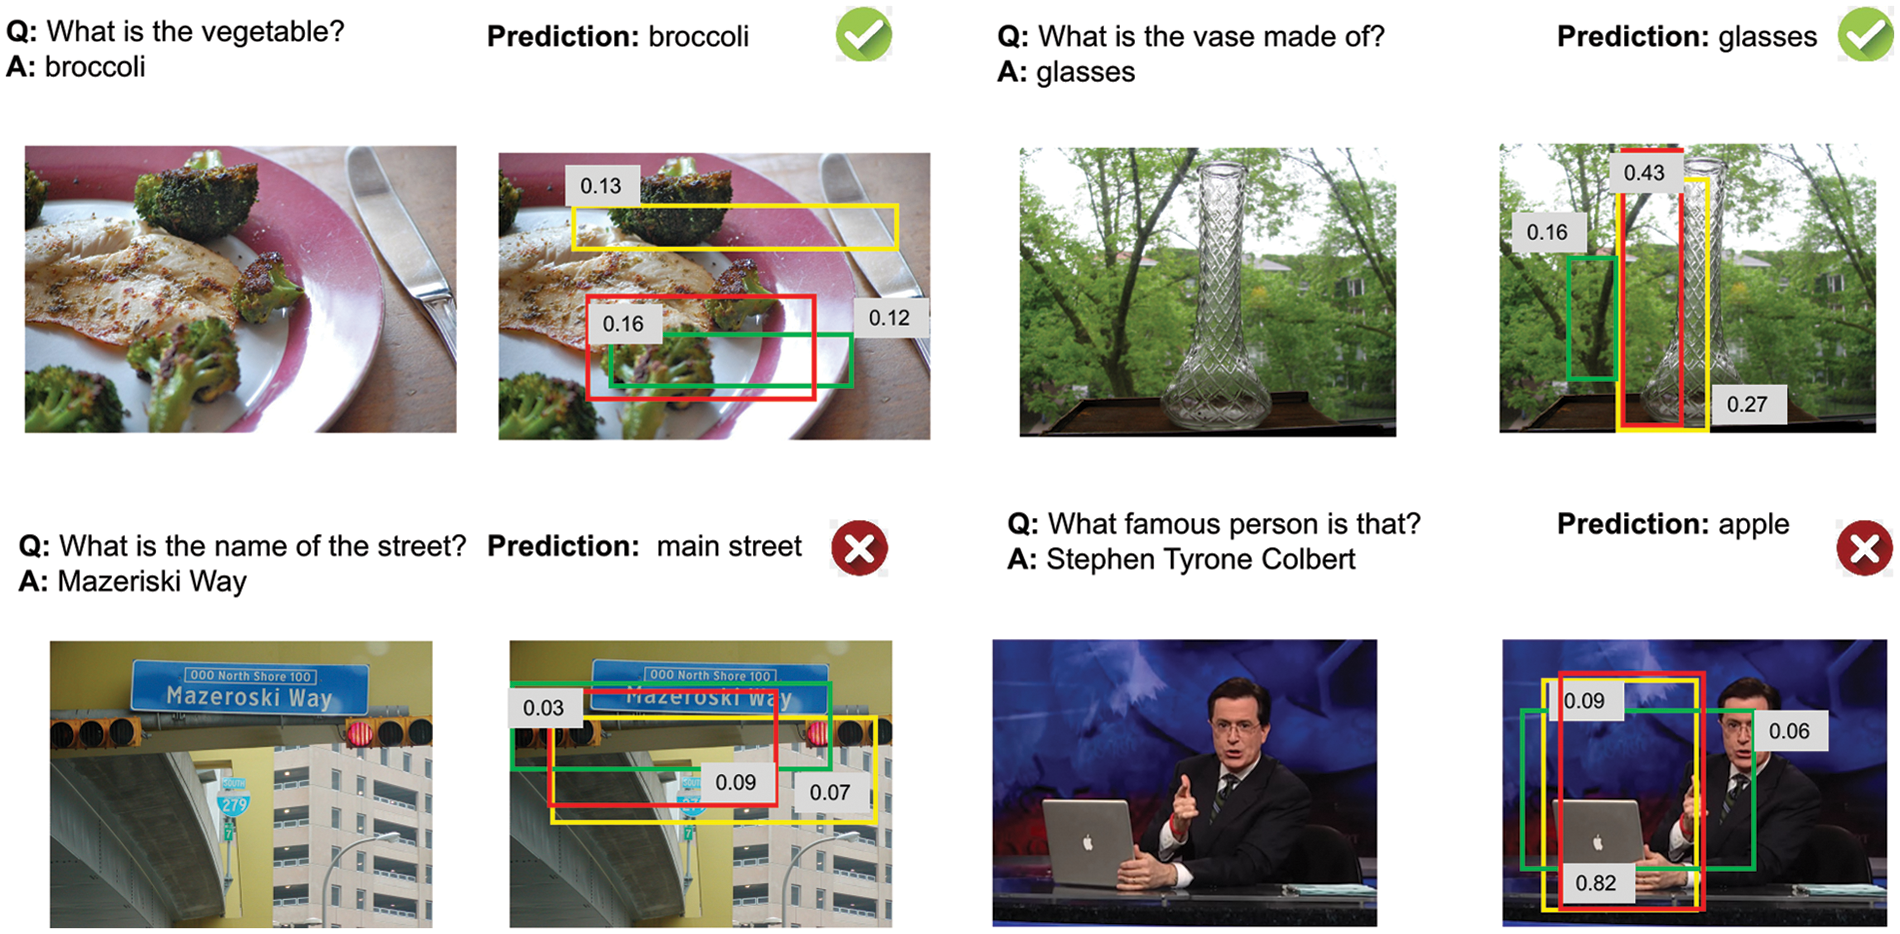
Figure 5: Typical illustrations of what our model predicts. The first two instances are accurate forecasts, but the final two are false. Each sample only displays the top three regions, with boxes highlighting the object regions. The number next to each box in the image denotes how much attention is paid to each region
5.5 Comparison with the State-of-the-Art Models
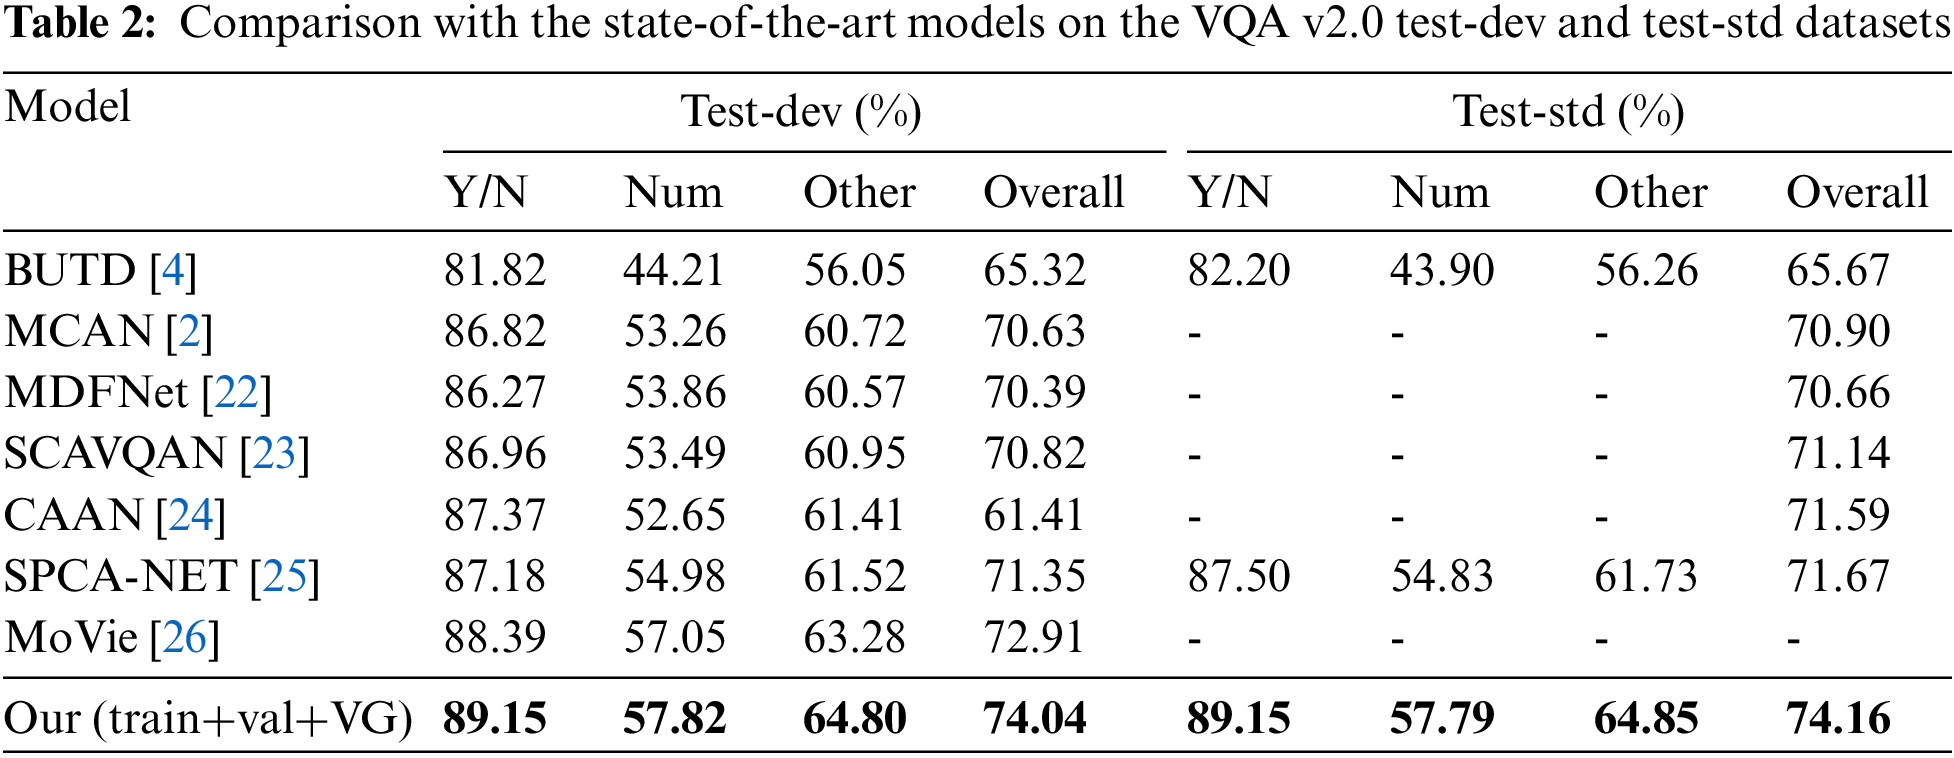
On VQA 2.0, we compare our model against the state-of-the-art in Table 2. Bottom-Up and Top-Down (BUTD) [4] is the challenge model of 2017, it also extracts the region features for the first time, and our model is 8.49% more efficient. Multimodal deep fusion network (MDFNet) [22] proposes graph reasoning and fusion layer (GRFL) to reason complex spatial and semantic relations, our model improves 3.5%. Sparse co-attention visual question answering network (SCAVQAN) [23] proposes a sparse co-attention visual question answering network based on thresholds, our model improves by 3.02%. Context-aware attention network (CAAN) [24] developed a novel absolute position computation approach based on the coordinates of each image region and the image’s real size, the accuracy of the model is just 71.59%, our model exceeds it by 2.57%. MCAN [2] and spatial position relationship co-attention network (SPCA-Net) [25] explore the attention mechanism within and between modals, for the two models, there is an efficiency improvement of 3.26% and 2.49%, respectively. Based on the use of grid features, Movie [26] designs a model to improve the count category, our model improves by 1.13%.
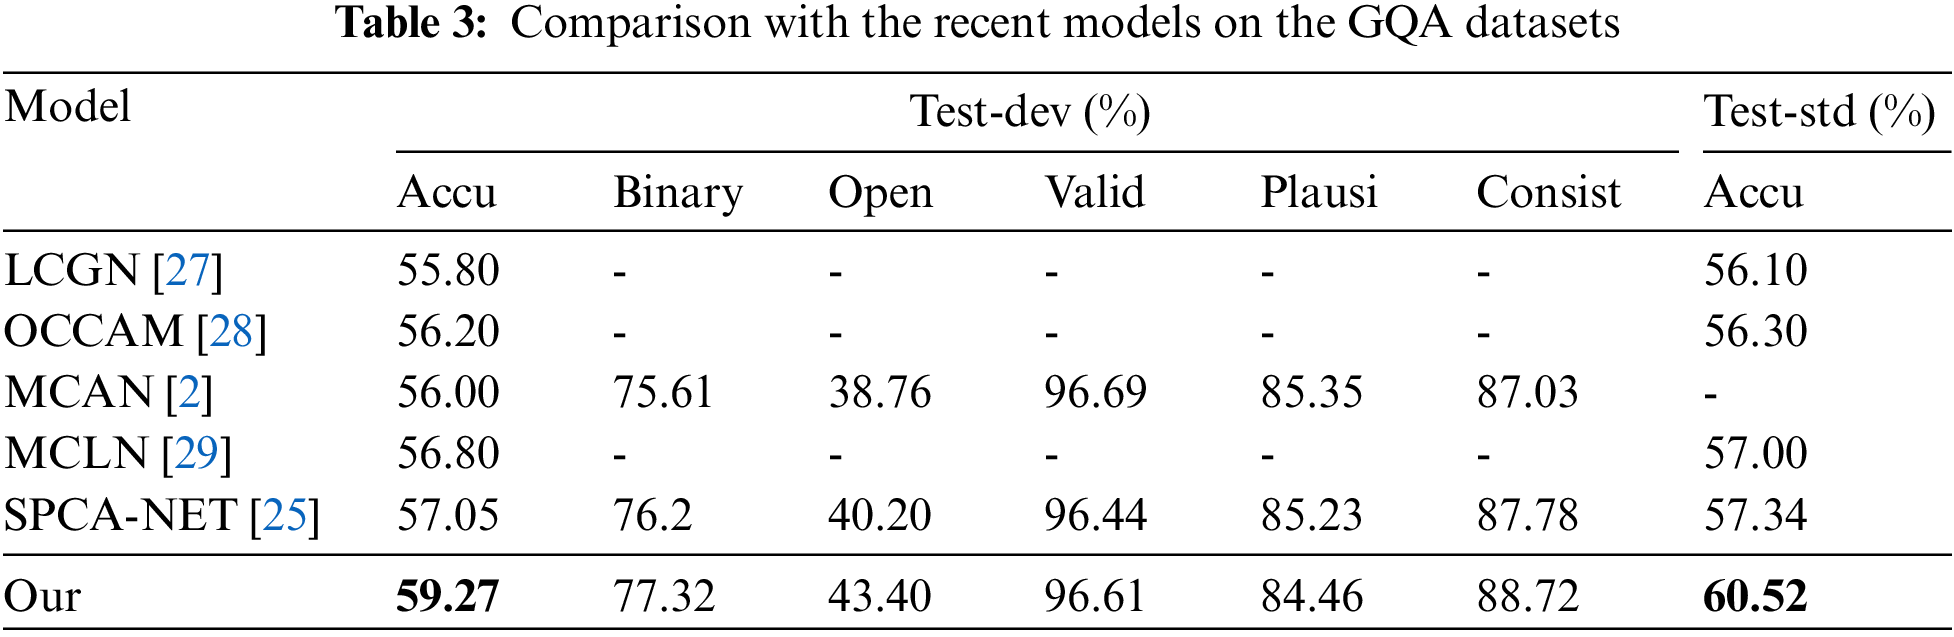
We compare our model to the recent models on the GQA dataset in Table 3. Our model does not use the Val set for data augmentation; it is only trained on the train set. Deep context learning models include Language-Conditioned Graph Networks (LCGN) [27] and object-centric compositional attention mode (OCCAM) [28]. Both, however, merely take the visual modality’s context into account. They are outperformed by our model by 3.47% and 3.07%, respectively. The corresponding context learning modules are designed by multiple context learning network (MCLN) [29], which also develops a multiple context learning layer. Our model gets a 2.22% higher value than SPCA-NET [25].
We also compare our model with multi-modal pre-training model. Table 4 shows the results. It can be seen that universal image-text representation learning (UNITER) [30], object-semantics aligned pre-training for vision-and-language tasks (OSCAR) [31], and vision and language large-scale adversarial training (VILLA) [32] were pre-trained with 4 million images, which is more than 30 times the number of images we used. We directly trained our model on the VQA 2.0 dataset, with a total of 120 thousand images. However, our model is 1.25%, 0.72%, and 0.49% higher than their respective values on the test-std of the VQA 2.0 dataset. The number of images used in the seeing out of the box (SOHO) [33] model pre-training is 219,000, which is nearly twice that of us, but the accuracy is 0.69% lower than our model. The cross- and intra-model prior knowledge (ROSITA) [34] was pretrained with 9.5 million images, but the final accuracy was 0.19% lower than our model. Compare with these multi-modal pre-training models, our model has achieved considerable results with fewer images, a shorter training time, and fewer training resources.

In this paper, we propose a visual question answering model based on multi-view enhanced vision features and image caption enhancements. We extract the two vision features of regions at the same location and splice these two features as the final vision region feature. We calculate the relative size and distance of the region under the same image based on the location of the region feature, so that the model has better spatial perception ability. Through ablation experiments and comparison with other models, our model has very competitive results in two datasets (VQA 2.0 and GQA). This paper shows that extracting effective vision features may be more effective in improving the accuracy of VQA than improving the models of VQA. We will continue to further explore the impact of the vision features obtained by a vision detector based on Transformer in VQA.
Acknowledgement: The authors affirm that they have no known financial or interpersonal conflicts that would have affected the research presented in this paper.
Funding Statement: This work was supported in part by the National Natural Science Foundation of China under Grant U1911401.
Conflicts of Interest: The authors declare that they have no conflicts of interest to report regarding the present study.
References
1. S. Antol, A. Agrawal, J. Lu, M. Mitchell, D. Batra et al., “Vqa: Visual question answering,” in Proc. ICCV, Santiago, Chile, pp. 2425–2433, 2015. [Google Scholar]
2. Z. Yu, J. Yu, Y. Cui, D. Tao and Q. Tian, “Deep modular co-attention networks for visual question answering,” in Proc. CVPR, California, USA, pp. 6281–6290, 2019. [Google Scholar]
3. P. Gao, Z. Jiang, H. You, P. Lu, S. C. Hoi et al., “Dynamic fusion with intra-and inter-modality attention flow for visual question answering,” in Proc. CVPR, California, USA, pp. 6639–6648, 2019. [Google Scholar]
4. P. Anderson, X. He, C. Buehler, D. Teney, M. Johnson et al., “Bottom-up and top-down attention for image captioning and visual question answering,” in Proc. CVPR, Pennsylvania, USA, pp. 6077–6086, 2018. [Google Scholar]
5. J. Li, D. Li, C. Xiong and S. Hoi, “Blip bootstrapping language-image pretraining for unified vision-language understanding and generation,” arXiv preprint arXiv:2201.12086, 2022. [Google Scholar]
6. P. Wang, A. Yang, R. Men, J. Lin, S. Bai et al., “Ofa: Unifying architectures, tasks, and modalities through a simple sequence-to-sequence learning framework,” in Proc. ICML, Maryland, USA, pp. 6077–6086, 2022. [Google Scholar]
7. K. He, X. Zhang, S. Ren and J. Sun, “Deep residual learning for image recognition,” in Proc. CVPR, California, USA, pp. 770–778, 2016. [Google Scholar]
8. S. Ren, K. He, R. Girshick and J. Sun, “Faster r-CNN: Towards real-time object detection with region proposal networks,” IEEE Transactions on Pattern Analysis and Machine Intelligence, vol. 39, no. 6, pp. 1137–1149, 2017. [Google Scholar] [PubMed]
9. H. Jiang, I. Misra, M. Rohrbach, E. Learned-Miller and X. Chen, “In defense of grid features for visual question answering,” in Proc. CVPR, Seattle, USA, pp. 10267–10276, 2020. [Google Scholar]
10. Y. Zhang, J. Chu, L. Leng and J. Miao, “Mask-refined R-CNN: A network for refining object details in instance segmentation,” Sensors, vol. 20, no. 4, pp. 1010, 2020. [Google Scholar] [PubMed]
11. J. Chu, Z. Guo and L. Leng, “Object detection based on multi-layer convolution feature fusion and online hard example mining,” IEEE Access, vol. 6, no. 1, pp. 19959–19967, 2018. [Google Scholar]
12. Y. Goyal, T. Khot, D. Summers-Stay, D. Batra and D. Parikh, “Making the v in vqa matter: Elevating the role of image understanding in visual question answering,” in Proc. CVPR, Hawaii, USA, pp. 6904–6913, 2017. [Google Scholar]
13. D. A. Hudson and C. D. Manning, “Gqa: A new dataset for real-world visual reasoning and compositional question answering,” in Proc. CVPR, California, USA, pp. 6700–6709, 2019. [Google Scholar]
14. M. I. H., Chowdhury, K. Nguyen, S. Sridharan and C. Fookes, “Hierarchical relational attention for video question answering,” in Proc. CVPR, Athens, Greece, pp. 599–603, 2018. [Google Scholar]
15. Q. Sun and Y. Fu, “Stacked self-attention networks for visual question answering,” in Proc. ICMR, Lugano, Switzerland, pp. 207–211, 2019. [Google Scholar]
16. J. Deng, W. Dong, R. Socher, L. -J. Li, K. Li et al., “Imagenet: A large-scale hierarchical image database,” in Proc. CVPR, Florida, USA, pp. 248–255, 2009. [Google Scholar]
17. R. Krishna, Y. Zhu, O. Groth, J. Johnson, K. Hata et al., “Visual genome: Connecting language and vision using crowdsourced dense image annotations,” International Journal of Computer Vision, vol. 123, no. 1, pp. 32–73, 2017. [Google Scholar]
18. L. H. Li, M. Yatskar, D. Yin, C. -J. Hsieh and K. -W. Chang, “Visualbert: A simple and performant baseline for vision and language,” arXiv preprint arXiv:2201.12086, 2019. [Google Scholar]
19. L. Zhou, H. Palangi, L. Zhang, H. Hu and J. Corso, “Unified vision language pre-training for image captioning and VQA,” in Proc. AAAI, New York, USA, pp. 13041–13049, 2020. [Google Scholar]
20. J. Pennington, R. Socher and C. Manning, “GloVe: Global vectors for word representation,” in Proc. EMNLP, Doha, Qatar, pp. 13041–13049, 2014. [Google Scholar]
21. S. Xie, R. Girshick, P. Doll´ar, Z. Tu and K. He, “Aggregated residual transformations for deep neural networks,” in Proc. CVPR, Hawaii, USA, pp. 1492–1500, 2017. [Google Scholar]
22. W. Zhang, J. Yu, Y. Wang and W. Wang, “Multimodal deep fusion for image question answering,” Knowledge-Based Systems, vol. 212, no. 1, pp. 106639, 2021. [Google Scholar]
23. Z. Guo and D. Han, “Sparse co-attention visual question answering networks based on thresholds,” Applied Intelligence, vol. 53, no. 1, pp. 586–600, 2022. [Google Scholar]
24. C. Chen, D. Han and C. C. Chang, “CAAN: Context-aware attention network for visual question answering,” Pattern Recognition, vol. 132, no. 1, pp. 108980, 2022. [Google Scholar]
25. F. Yan, W. Silamu, Y. Li and Y. Chai, “Spca-net: A based on spatial position relationship co-attention network for visual question answering,” The Visual Computer, vol. 38, no. 1, pp. 3097–3108, 2022. [Google Scholar]
26. D. K. Nguyen, V. Goswami and X. Chen, “Movie: Revisiting modulated convolutions for visual counting and beyond,” in Proc. ICLR, online, pp. 248–255, 2020. [Google Scholar]
27. R. Hu, A. Rohrbach, T. Darrell and K. Saenko, “Language-conditioned graph networks for relational reasoning,” in Proc. CVPR, California, USA, pp. 10294–10303, 2019. [Google Scholar]
28. Z. Wang, K. Wang, M. Yu, J. Xiong and W. Hwu, “Interpretable visual reasoning via induced symbolic space,” in Proc. ICCV, Montreal, Canada, pp. 1878–1887, 2021. [Google Scholar]
29. P. Zhang, H. Lan and M. A. Khan, “Multiple context learning networks for visual question answering,” Scientific Programming, vol. 2022, pp. 4378553, 2021. [Google Scholar]
30. Y. C. Chen, L. Li, L. Yu, E. Kholy and A. Ahmed, “Uniter: Universal image-text representation learning,” in Proc. ECCV, Online, pp. 104–120, 2020. [Google Scholar]
31. X. Li, X. Yin, C. Li, P. Zhang, X. Hu et al., “Oscar: Object-semantics aligned pre-training for vision-language tasks,” in Proc. ECCV, online, pp. 121–137, 2020. [Google Scholar]
32. Z. Gan, Y. C. Chen, L. Li, C. Zhu, Y. Cheng et al., “Large-scale adversarial training for vision-and-language representation learning,” Advances in Neural Information Processing Systems, vol. 33, no. 1, pp. 6616–6628, 2020. [Google Scholar]
33. Z. Huang, Z. Zeng, Y. Huang, B. Liu, D. Fu et al., “Seeing out of the box: End-to-end pre-training for vision-language representation learning,” in Proc. CVPR, online, pp. 12976–12985, 2021. [Google Scholar]
34. Y. Cui, Z. Yu, C. Wang, Z. Zhao and J. Zhang, “Rosita: Enhancing vision-and-language semantic alignments via cross and intra-modal knowledge integration,” in Proc. ACM MM, online, pp. 797–806, 2021. [Google Scholar]
Cite This Article
 Copyright © 2023 The Author(s). Published by Tech Science Press.
This work is licensed under a Creative Commons Attribution 4.0 International License , which permits unrestricted use, distribution, and reproduction in any medium, provided the original work is properly cited.
 Downloads
 Citation Tools