
 Submit a Paper
 Propose a Special lssue
 Open Access
ARTICLE

XA-GANomaly: An Explainable Adaptive Semi-Supervised Learning Method for Intrusion Detection Using GANomaly
1 Department of Security Convergence, Graduate School, Chung-Ang University, Seoul, 06974, Korea
2 Department of Industrial Security, Chung-Ang University, Seoul, 06974, Korea
* Corresponding Author: Hangbae Chang. Email:
(This article belongs to the Special Issue: Advances in Information Security Application)
Computers, Materials & Continua 2023, 76(1), 221-237. https://doi.org/10.32604/cmc.2023.039463
Received 31 January 2023; Accepted 11 April 2023; Issue published 08 June 2023
 View Full Text
 Download PDF
Abstract
Intrusion detection involves identifying unauthorized network activity and recognizing whether the data constitute an abnormal network transmission. Recent research has focused on using semi-supervised learning mechanisms to identify abnormal network traffic to deal with labeled and unlabeled data in the industry. However, real-time training and classifying network traffic pose challenges, as they can lead to the degradation of the overall dataset and difficulties preventing attacks. Additionally, existing semi-supervised learning research might need to analyze the experimental results comprehensively. This paper proposes XA-GANomaly, a novel technique for explainable adaptive semi-supervised learning using GANomaly, an image anomalous detection model that dynamically trains small subsets to these issues. First, this research introduces a deep neural network (DNN)-based GANomaly for semi-supervised learning. Second, this paper presents the proposed adaptive algorithm for the DNN-based GANomaly, which is validated with four subsets of the adaptive dataset. Finally, this study demonstrates a monitoring system that incorporates three explainable techniques—Shapley additive explanations, reconstruction error visualization, and t-distributed stochastic neighbor embedding—to respond effectively to attacks on traffic data at each feature engineering stage, semi-supervised learning, and adaptive learning. Compared to other single-class classification techniques, the proposed DNN-based GANomaly achieves higher scores for Network Security Laboratory-Knowledge Discovery in Databases and UNSW-NB15 datasets at 13% and 8% of F1 scores and 4.17% and 11.51% for accuracy, respectively. Furthermore, experiments of the proposed adaptive learning reveal mostly improved results over the initial values. An analysis and monitoring system based on the combination of the three explainable methodologies is also described. Thus, the proposed method has the potential advantages to be applied in practical industry, and future research will explore handling unbalanced real-time datasets in various scenarios.Keywords
As computer networks have developed, the number of users who store critical data in the cloud system has increased, emphasizing the importance of network communication security. However, cyber security threats, such as system infiltration, sneaking network communication, or tampering and stealing essential assets, occur in various ways and forms with the expansion of network communication, compromising the stability and economic feasibility of institutions and governments [1].
Intrusion detection is a widely used method to prevent and respond to malicious behavior in network traffic. It generally involves employing pre-trained network traffic characteristics and analyzing results to detect abnormal activity. An intrusion detection system (IDS) is categorized as either signature-based or anomaly-based intrusion detection, depending on how it identifies attacks [2]. As current attack types diversify, instead of the signature methods, anomaly-based intrusion detection approaches that leverage training to identify unknown traffic are deployed as effective technology [3]. One of the most recent abnormal data identification strategies is deep learning-based pattern recognition, such as artificial neural network-based traffic classification.
Many researchers have investigated intrusion detection methods using deep learning to prevent and process unlabeled attack data in advance [2]. Labeling performed by a security expert is expensive and time-consuming; thus, network traffic classification based on semi-supervised learning with only a few labeled data has become significant [4]. In terms of practicality, implementing conventional semi-supervised learning approaches for intrusion detection is problematic, such as making predictions using the distribution of reconstruction errors generated from the data information or class clustering in unlabeled data [5]. For example, real-time datasets have low prediction rates because many unlabeled sub-datasets are continuously generated and accumulated, making it challenging to learn changes in the distribution of the dataset statically. Furthermore, performance might fluctuate depending on the number of data or the proportion of labels for each subset [6]. Therefore, a dynamic semi-supervised learning mechanism is required to discover the real-time pattern flow of changing data.
Another issue is validating detection performance on unlabeled real-time data and substantiating the analytic results. Because the post-detection analysis process is crucial for monitoring and determining whether to identify intrusion traffic under a corporate policy, the outcome should be appropriately interpreted [7]. Therefore, tools and libraries for explainable artificial intelligence (XAI) based on ensemble algorithms, such as the local interpretable model agnostic explanation (LIME) and Shapley additive explanations (SHAP), have been widely used [8,9]. Existing XAI techniques need to explicitly describe the output of generative or generative adversarial network (GAN)-based models due to the black-box problems of deep learning models and the sluggish expansion of tools. Furthermore, by implementing an explainable AI technique through a combination technique, this paper aims to improve the reliability of the result by observing traffic from various perspectives rather than interpreting a single technique. Therefore, this paper focuses on monitoring abnormal traffic based on this combination-based method and presents strategies for analyzing it in detail.
Therefore, this paper introduces XA-GANomaly, a new intrusion detection model based on adaptive semi-supervised learning and explainable strategies. Specifically, this research builds a model for an adaptive learning mechanism using GANomaly, which was invented for image anomaly identification, by simulating real-time data with different subsets and progressively training based on the results of the subsets. Moreover, to ensure the reliability of the results, this study proposes an IDS monitoring method based on XAI methodologies.
The primary contributions of this paper are described as follows:
i. This paper proposes a novel adaptive training algorithm for a semi-supervised learning technique based on the reconstruction error distribution of GANomaly and tests it on four small subsets to simulate a real-time dataset.
ii. This research presents a monitoring technique based on a new explainable adaptive semi-supervised learning method that combines SHAP, reconstruction error distribution, and t-distributed stochastic neighbor embedding (t-SNE).
iii. This study evaluates and analyzes the proposed model through various experiments, including semi-supervised learning for one-class classification, adaptive learning for the proposed model, and adaptive learning for randomly generated imbalanced datasets, validating its performance via the proposed explainable method.
The remainder of this paper is organized as follows. Section 2 explores the existing studies on semi-supervised learning and explainable techniques used in intrusion detection tasks. Section 3 explains the proposed methodology for an explainable adaptive semi-supervised learning method using the deep neural network (DNN)-based GANomaly. Section 4 presents the diverse experimental results. Finally, Section 5 concludes with a discussion of this work for future research and summarizes the main contributions.
2.1 Artificial Intelligence-Based Intrusion Detection Technique
In previous studies, researchers have focused on improving the detection accuracy of intrusion detection mechanisms. Various machine learning and deep learning-based technologies have been explored to respond to the increasing variety of attacks and complicated attack patterns. The IDS can be broadly classified into three categories based on the training strategy: supervised, unsupervised, or semi-supervised learning [2].
2.1.1 Supervised and Unsupervised Learning
Supervised learning is a technique that trains and classifies data into normal and abnormal classes using labeled target data. This approach is commonly used for intrusion detection tasks and involves machine learning algorithms, such as the support vector machine (SVM), k-nearest-neighbors, decision trees, and ensemble tree models, like random forest (RF) [10–13]. Deep learning models based on artificial neural networks have also been used by stacking multiple layers. For example, Rosay et al. [14] presented multi-layer perceptron (MLP)-based deep learning algorithms and achieved the highest result compared to other machine learning techniques. Kim et al. [15] introduced binary and multi-class denial-of-service attacks based on convolutional neural networks (CNNs) and presented examples of red-green-blue two-dimensional images transformed data features. Yin et al. [16] employed recurrent neural networks, one of the time-series models, and found that it performed better than traditional machine learning techniques and MLP. However, research on supervised learning methods has limitations because it has focused on enhancing performance, although the methods already display a high accuracy of 99%.
In contrast, unsupervised learning is an unlabeled training method that involves clustering data based on similar properties or densities. Chapagain et al. [17] researched enhancing the K-means technique using feature extraction with principal component analysis (PCA). Generative models have also been suggested for classifying normal and abnormal data based on a threshold of reconstruction error values. Yao et al. [18] used an auto-encoder (AE) based on RF feature engineering, and Li et al. [19] experimented with the variational AE to develop the latent vector representation from AE based on a probabilistic concept. Recently, GANs have been suggested to build generators using adversarial training [6]. For instance, Boppana et al. [20] constructed a hybrid model of the AE and GAN to deal with internet of things (IoT) security concerns and demonstrated superior results compared to other one-class classification methods. However, unsupervised learning approaches might be challenging to apply in practice due to the time complexity of training numerous unlabeled data.
2.1.2 Semi-Supervised Learning
In semi-supervised learning, labeled and unlabeled data are used for training. Many researchers have explored various methods, including self-training, co-training, and multi-view learning in computer engineering [21]. Moreover, modifying supervised and unsupervised learning strategies has been researched for many years to address semi-supervised learning in intrusion detection tasks. For example, Shah et al. [22] incorporated the SVM and RF with a semi-supervised algorithm that trains and predicts using a small portion of datasets. However, this mechanism is only suitable for normal and attack-labeled data.
In contrast, generative models can handle normal labeled data, reducing the need for time-consuming manual labeling. Such a feature makes them well-suited for use in real-world industries. Hara et al. [23] developed an AE-based model with adversarial training for extracting classification patterns and characteristics from latent vectors. Their results revealed better performance compared to traditional machine learning techniques. Similarly, Goodfellow et al. [24] suggested a hybrid architecture that combined K-means, CNN, and GANomaly for unsupervised, supervised, and semi-supervised learning. This approach resulted in higher accuracy than the one-class classification methods. In particular, GANomaly is a powerful GAN model for detecting anomalies in images by capturing the underlying distributions of normal images using adversarial training between the generator and discriminator [25]. However, the main drawback of such hybrid models is that they require significant resources with different label types.
This paper is focused on GANomaly-based semi-supervised learning to address these challenges, which can handle real-time simulated data, even with a small normal labeled dataset. Furthermore, this research aims to allow a single model to adapt and improve over time.
2.2 Adaptive Learning for Intrusion Detection
Some adaptive learning algorithms have recently been developed to boost model performance in research areas, such as fog computing and IoT [26]. For example, Gao et al. [27] introduced an adaptive multitree model that integrates multiple tree models and leverages a weighted voting technique to optimize detection results and enhance the resulting quality. Hu et al. [28] presented a method for generating synthetic data to improve the effectiveness of CNNs in detecting attack traffic. Moreover, Lin et al. [29] used an online technique to adaptively update the software-defined network (SDN) framework to optimize the bagging algorithm and imbalanced network traffic. In contrast, the primary purpose of adaptive learning in the field of computer engineering has been defined as adapting models to new forms of data [28]. Thus, the goal is to enable the model to adapt to unseen and unlabeled data, typically encountered in real-world scenarios.
2.3 Explainable Method Applied to Intrusion Detection
Explainable intrusion detection studies aim to achieve a high detection rate and a low false-positive rate [22]. Explanation skills also allow security professionals to understand the model construction, guide the development of better models, and make appropriate decisions in identifying attack traffic [30]. For instance, LIME-based interpretable intrusion detection, which operates regardless of the model type, can observe the result value where the predicted value changes due to perturbation. Additionally, some research cases explain the built-in feature importance obtained by training a tree-based ensemble algorithm [9].
In contrast, SHAP, a recently introduced XAI that employs game theory and ranks by contributions, has gained attention. It works well for both tree-based ensemble algorithms and MLP, allowing the measurement and analysis of contributions related to positive or negative influence [8,30]. As SHAP provides an explicit interpretation in detail using DNNs, this paper aims to develop an explainable model by combining SHAP with two other explainable methods to examine the proposed adaptive semi-supervised learning algorithm.
A monitoring system for network traffic is generally referred to as a network traffic monitoring analysis system [31]. Early research has focused on the method for supervising the transmission status and network traffic speed, for example, focusing on cases where the bandwidth is out of the general range and performing pattern analysis, such as file transfer protocol (FTP) and flow monitoring [7]. Furthermore, network traffic monitoring analysis has been developed to effectively analyze complex traffic transmitted over expanding networks due to cellular and high-capacity videos or images [31]. Representative deep learning models for performing specific analysis through traffic classification include CNNs that learn traffic characteristics and recurrent neural network models that train temporal characteristics [31]. However, the potential limitation of existing monitoring systems in IDS is that it is difficult to ensure network security solely based on the stability and efficiency of the traffic. Hence, this paper focuses on constructing a monitoring method using explainable techniques from the proposed model to detect attack traffic.
This Section introduces the novel intrusion-detection framework based on adaptive semi-supervised learning that can dynamically train on new small datasets and a hybrid explainable intrusion detection technique to evolve it into an intrusion-detection monitoring system.
As illustrated in Fig. 1, the proposed framework is divided into five stages with a combination of three stages generally performed in previous studies [32,33] and the remaining stages developed in this paper. First, in the data preprocessing stage, the categorical data are encoded, the entire dataset is scaled, and essential features are selected. Second, datasets are divided into labeled, unlabeled, and adaptive datasets to handle different dataset types, including multiple subsets. Third, in the semi-supervised learning phase, DNN-based GANomaly is first used to train a given normal dataset and test a labeled abnormal dataset. The reconstruction error distribution is acquired using the gap between the trained normal data and the tested abnormal data. A double threshold is determined as the median and maximum of the reconstruction error from the normal dataset to distinguish the attack and nonattack labels. Fourth, in the adaptive learning phase, we utilize our proposed adaptive algorithm to progressively add normal and abnormal data while assuming that several small subsets are continually accumulated. In the fifth stage, adaptive semi-supervised learning is validated by the results using a combination of three explainable strategies: SHAP, reconstruction error visualization, and t-SNE. As a result, these analysis results are integrated into a monitoring dashboard system. The specific methodology is described in Section 3.2.

Figure 1: Overall framework of the proposed adaptive semi-supervised learning approach for intrusion detection, including the combination of the proposed method in this paper and the existing semi-supervised learning method [32,33]. (
3.2 Explainable Adaptive Semi-Supervised Learning Algorithm
The DNN-based GANomaly model is modified by training only critical features throughout the feature engineering process to improve the ability of the GANomaly model to detect abnormal classes in images. Specifically, fully-connected layers are stacked by halving their size using rectified linear units as the activation function for each layer. An L1-regularizer is employed only on the second layer to add weights to the layer output.
As illustrated in Fig. 2, the proposed explainable adaptive semi-supervised learning technique uses the DNN-based GANomaly and three explainable techniques. The loss function
where x denotes the input, E represents the encoder, G indicates the generator, D is the discriminator, and z represents the latent vector extracted from the encoder. The generator and discriminator are adversarially trained to obtain

Figure 2: Process of the proposed explainable adaptive semi-supervised learning method for intrusion detection based on the DNN-based GANomaly and three explainable techniques: t-SNE, reconstruction error, and SHAP
The reconstruction error is calculated using the sum of squares error (SSE), which is defined in Eq. (2), between the latent vectors and describes the distribution of normal and abnormal traffic data, focusing on the fact that the latent space represents a distribution similar to that of the input [25]. The SSE output updates the adaptive dataset with predetermined labeled data based on certain criteria. Algorithm 1, based on double thresholds for the distribution that distinguishes normal from abnormal, demonstrates the specific processes and threshold criteria. The algorithm assumes that data can be adaptively trained when training the difference between normal and abnormal reconstruction rates has significant variation. Each maximum and median value of the normal data reconstruction error rates is a criterion for accepting new abnormal and normal data, respectively. The median and maximum values mean the median and maximum values of the reconstruction error rate of the normal data among the initial datasets used before applying the adaptive data. Since the running time of the proposed algorithm is constant when there is only one subset, the best case would be Ω(1), and the worst-case time complexity is O(n) because it increases linearly with the number of subsets n.

After the adaptive semi-supervised learning process, data subsets are collected to create a single dataset log. This log includes provided instances of abnormal behavior and is used to monitor and improve the adaptive learning process. This research proposes an adaptive semi-supervised learning method capable of interpreting a combination of SHAP, reconstruction error distribution, and t-SNE to gain further insight into the data.
First, this paper uses SHAP to express the importance of features in rank order based on their contribution, which is useful in the feature engineering stage that follows adaptive learning. Unlike other feature importance techniques, such as ensemble-based feature importance, SHAP considers the relationship between features and can provide more accurate results even when multicollinearity between explanatory variables exists. In addition, it has the advantage of simply extracting feature importance for DNN models that are difficult to solve with Boruta [34], known for its great performance on RF-based models or other classical feature engineering techniques. It calculates the contribution of features based on game theory to determine feature importance by aggregating multiple qualities and computing the Shapley value, representing the average change in model predictions due to the presence or absence of specific features, as indicated in Eq. (3):
where each
Second, this study employs reconstruction error-based visualization to demonstrate the threshold with normal and abnormal labels by displaying the distribution of reconstruction errors acquired from the SSEs. This procedure helps alter the threshold set position in semi-supervised learning and helps intuitively confirm the threshold sufficiency within adaptive learning.
Third, t-SNE, a dimensionality reduction technique that outperforms PCA in reducing the data dimensions from high- to low, is used in this research. This technique is particularly well-suited for latent vectors extracted from image-based generative models, as it can express a high-dimensional latent space. This technique can achieve this because vector visualization is conducted by transferring the distance between data into a stochastic probability and then applying it to embedding while maintaining the distance between points in the original space.
The reconstruction error of the proposed adaptive algorithm means the difference between the latent vectors of the generative model; thus, t-SNE is employed in this paper. This visualization method can preserve the data distribution of the original dimension. In addition, better performance of the adaptive algorithm results in higher density between data classes in t-SNE. The density between normal and abnormal classes is verified using t-SNE to demonstrate the SSE outcomes of the proposed adaptive algorithm for each subset.
The ultimate goal is to monitor each stage by integrating these three approaches: feature selection, threshold verification, and monitoring the transforming data distribution. The details are described in Section 4 using a monitoring dashboard.
In this Section, the experiments compare similar techniques. These techniques are presented and analyzed using two network traffic datasets, Network Security Laboratory-Knowledge Discovery in Databases (NSL-KDD) and UNSW-NB15, to clarify the significance of the proposed method.
4.1 Experimental Environment Settings
All experiments were conducted on Ubuntu 18.04.5 LTS with an Intel (R) Xeon (R) CPU E5-2650 v4 at 2.20 GHz and three GeForce RTX 3090 s with 256 GB of memory. Tensorflow and Matplotlib, well-known libraries for deep learning and visualization, were employed for intrusion detection and monitoring visualization, respectively.
4.2 Datasets and Preprocessing
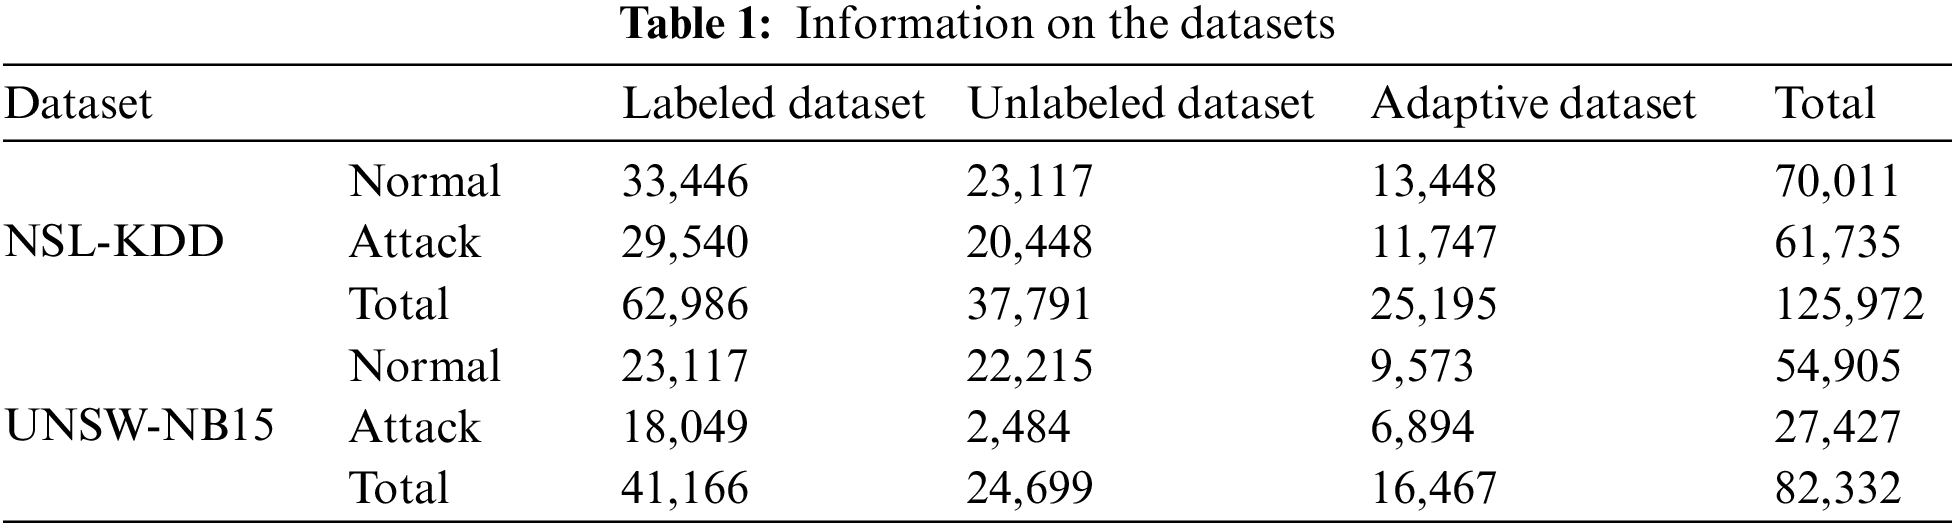
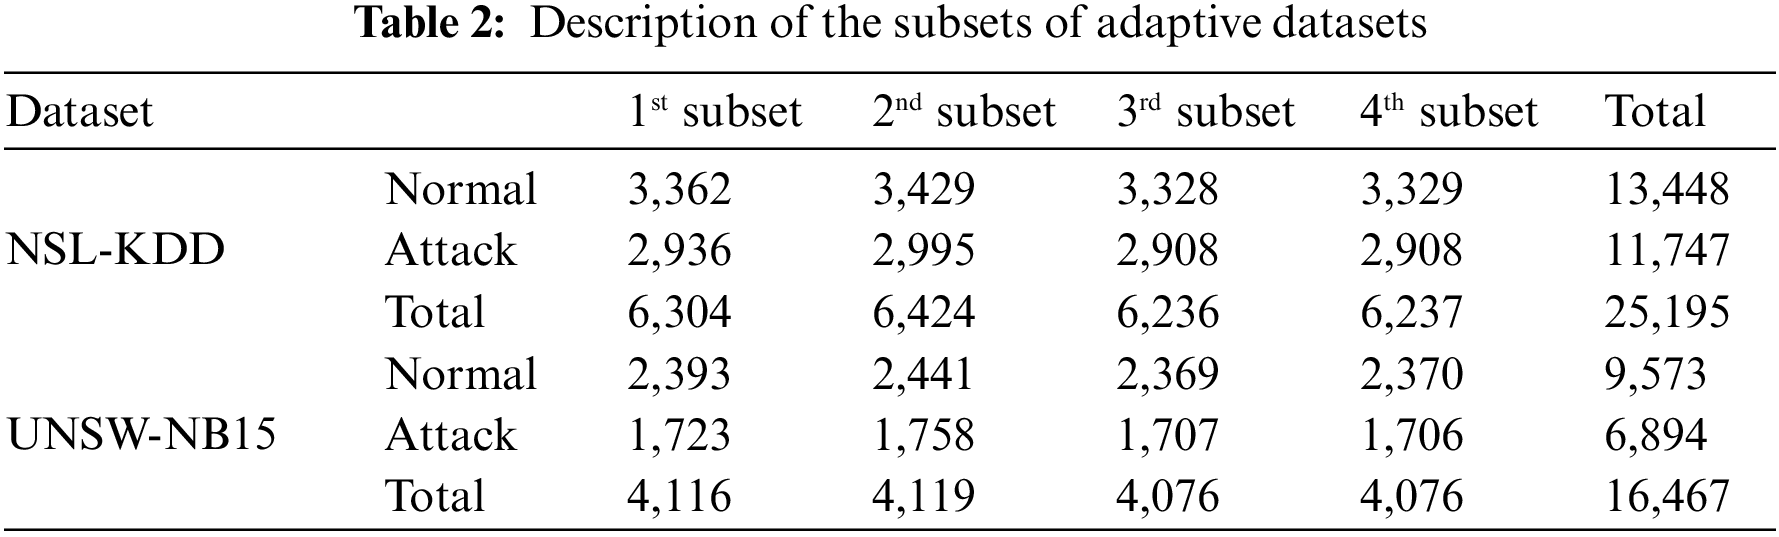
This Section briefly describes NSL-KDD and UNSW-NB15 datasets, which are public network intrusion detection datasets employed for performance evaluation in multiple existing studies. Various data environments similar to the actual cyber world were constructed to simulate a real-time environment. In addition, the same preprocessing approach was performed to suggest a universal framework for datasets with two different distributions. Specifically, labels in the dataset were modified to discern binary normal vs. abnormal traffic, and categorical features were numerically encoded for training. In addition, among the scalers provided by Scikit-learn, scaling was performed using MaxAbsScaler, which is sensitive to outliers, to set the two different distributions to be equivalent. These two datasets were reconstructed based on three types of datasets (described in Section 3 in Table 1). In detail, labeled, unlabeled, and adaptive datasets were divided into 50%, 30%, and 20% of the total dataset, respectively. In addition, each adaptive dataset was divided into four subsets, as represented in Table 2. Training and Test ratio were divided by 8 and 2 for each dataset, respectively.
The NSL-KDD [35] dataset is constructed by eliminating duplicate rows and minimizing the size of the KDD’99 dataset. The dataset is divided into three subsets: KDDTrain+20%, KDDTrain+, and KDDTest+. Moreover, KDDTrain+ (with the most records) was selected. This dataset contains 41 features: nine basic features derived from packet header information (first to ninth), 12 payload content features (tenth to 21st), nine-time features representing the number and speed of traffic connections (22nd to 30th), ten statistical features (31st to 40th) related host counts, and a label column [36]. Among them, string features, such as the protocol type, service, and flag, are converted into numeric values, and normal and abnormal labels are converted to 0 and 1.
The UNSW-NB15 [37] data comprises numerous network traffic data collected by Cyber Range Lab using the IXIA PerfectStorm tool to derive better simulation results than the KDD’99 or NSL-KDD. The dataset consists of 49 features, 47 of which are independent variables, excluding the attack type, label, and binary label. Specifically, the columns in the dataset are divided into five features related to traffic flow (first to fifth), 12 intrinsic header features (sixth to 18th), 17 features related to payload content (19th to 26th), 18 features related to the connection time between the source and target (27th to 35th), and 11 additional features related to various cases of time and connection (36th to 47th). The 48th feature, multiple attack types, was not used to identify abnormal data. In addition, the proto, service, and state features were encoded strings to numerical values as preprocessed the same way in the other dataset.
Feature selection was employed as an effective method to learn essential features or reduce the time complexity of training artificial intelligence-based models. In this paper, 21 high-ranked features were chosen by evaluating the feature importance of an extra-trees classifier, an ensemble algorithm-based tree model known to represent decision boundaries better and provide higher performance than an RF classifier for classification tasks. The features related to the intrusion detection techniques are detailed in Section 4.4.
Several metrics are available to evaluate the intrusion detection performance of categorizing normal and abnormal traffic. Accuracy and F1-score are among the most powerful evaluation metrics expressed in Eqs. (4) and (5). Accuracy represents overall performance, whereas the F1-score denotes the probability of a false-positive value or a false-negative value according to precision and recall mathematics representation in Eqs. (6) and (7). Mispredicted abnormal traffic might harm network security; thus, the higher the F1 score, the more robust the detector.
4.4 Performance Evaluation and Analysis
This Section provided experimental comparisons of the performance models to compare the novel presented adaptive intrusion detection approach and the visualizations and analysis of the results obtained from integrating three methodologies for explainable model development. First, the performance of various semi-supervised learning techniques for anomaly detection was examined to select a model for the adaptive IDS. Subsequently, the outcomes of the proposed adaptive IDS using the chosen model were demonstrated. Finally, a detailed analysis of the model was performed from three perspectives: SHAP, t-SNE, and reconstruction error visualization. For the hyperparameters of the DNN-based GANomaly model used in semi-supervised learning and adaptive learning, the rectified linear units activation function and L1 regularizer were used in the second layer for the encoder. The batch size was 32, and the number of iterations was 1,000.
4.4.1 Performance of Semi-Supervised Learning Techniques
The given normal datasets were trained using one-class classification models, such as the one-class SVM, AE, and CNN-based GANomaly, to establish a baseline model for our proposed adaptive semi-supervised learning technique. Then, unlabeled datasets, including both normal and abnormal traffic, were predicted, and their performance was evaluated using metrics such as accuracy and the F1-score. As illustrated in Fig. 3, the proposed DNN-based GANomaly model performs better than the other three techniques. Specifically, the results demonstrate an improvement of 13% and 8% in the F1-score and 4.17% and 11.51% accuracy for the NSL-KDD and UNSW-NB15 datasets, respectively. The proposed technique reduced the false-positive and false-negative rates with a well-trained model for normal and attack traffic.

Figure 3: Performance comparison of the semi-supervised learning models on the NSL-KDD (NK) and UNSW-NB15 (UN15) datasets
4.4.2 Performance of the Adaptive Semi-Supervised Learning Algorithm
The algorithm was applied to four subsets of data to evaluate the effectiveness of the proposed adaptive algorithm for the continuous accumulation of subsets, as presented in Table 2, updating the results sequentially. The performance of the proposed DNN-based GANomaly model was compared with that of the AE and CNN-based GANomaly, which are not reconstruction error-based classification techniques.
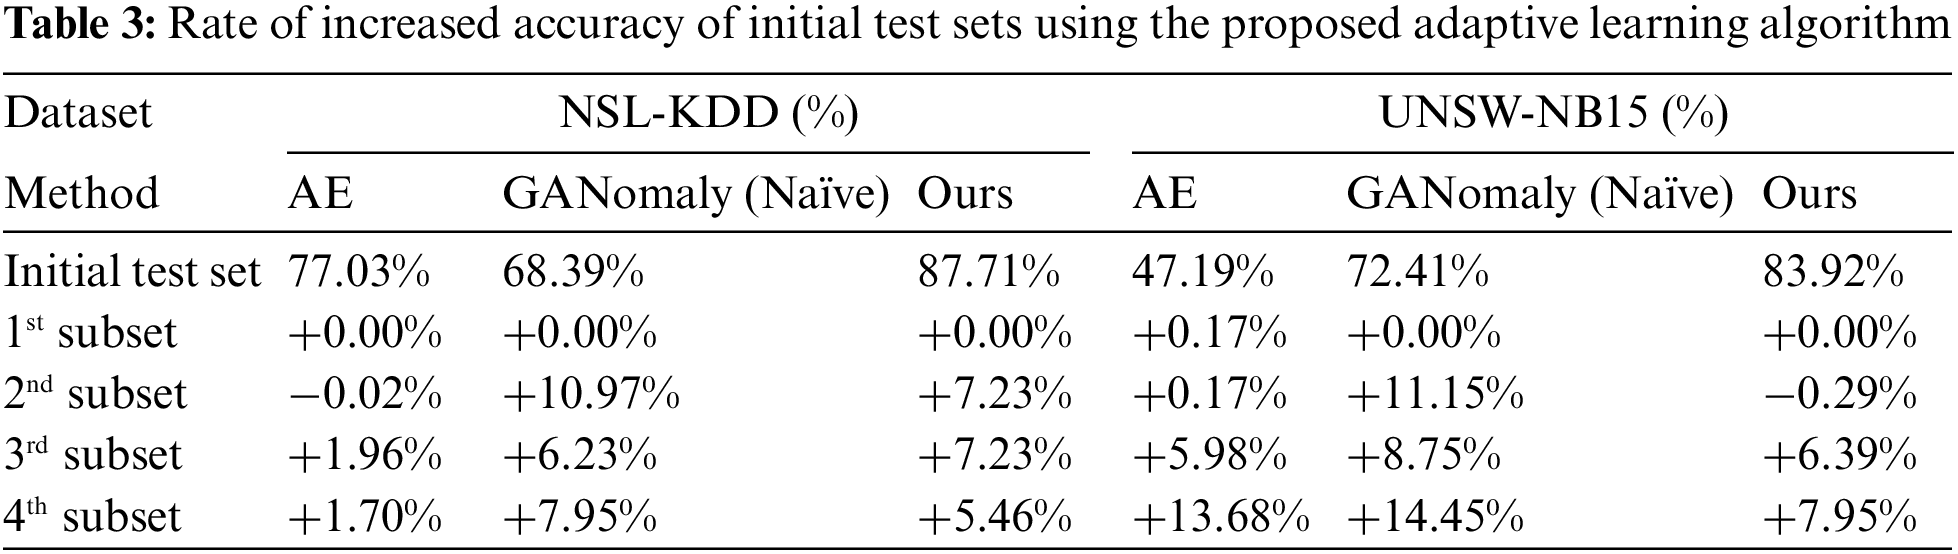
Initially, tests on semi-supervised learning were performed. NSL-KDD and UNSW-NB15 datasets were set to 0.9 because there were outliers in the normal test dataset. As a result of implementing the proposed algorithm, the initial median and maximum thresholds for the NSL-KDD dataset were set to 0.69 and 0.9 for the NSL-KDD dataset and 0.38 and 0.9 for the UNSW-NB15 dataset. Then, the proposed adaptive algorithm was proposed to the four sequentially incoming traffic subsets. Table 3 presents the results for the first subset, based on the threshold of the one-class classification model, which did not display a significant change. Nonetheless, the outcomes for the second subset exhibited a substantial enhancement compared to the initial test results, and this improvement was even more pronounced for the fourth subset.
Furthermore, the performance of imbalanced dataset classification was also assessed to evaluate the proposed adaptation algorithm in different scenarios. Each of the four subsets was randomly partitioned, and normal and attack labels were allocated disproportionately. As shown in Fig. 4, the results of the proposed algorithm outperformed those of the initial subset. However, in some of the second subset results, the scores were higher than the results because certain subsets had more abnormal data. Therefore, while the proposed algorithm has high overall performance, it is sensitive to the number of data in unbalanced datasets.

Figure 4: Intrusion detection performance for 100%, 75%, and 50% of random adaptive datasets
4.4.3 Model Analysis for Hybrid Explainable Intrusion Detection Techniques
The outcomes of using SHAP, reconstruction error distribution, and t-SNE distribution were analyzed in Fig. 2 to perform explainable adaptive semi-supervised intrusion detection. Because SHAP effectively extracts feature importance on artificial neural network-based models for adaptive training, we used a pre-trained generative model and the DeepExplainer function of the SHAP Python library for NSL-KDD and UNSW-NB15 in Fig. 5. The figure illustrates that traffic-related information is more important than a basic packet header. Specifically, the NSL-KDD dataset is highly influenced by connection speed, as observed in the top features named “count,” “dst_host_srv_serror_rate,” “level,” “dst_host_same_srv_rate,” “logged_in,” and “srv_serror_rate.” The UNSW-NB15 dataset is affected by both the time to live (TTL) value and connection speed, with the top four features named “Sttl,” “ct_dst_sport_ltm,” “Swin,” and “st_dst_src_ltm.”

Figure 5: Feature importance of SHAP for the NSL-KDD and UNSW-NB15 datasets
The reconstruction error distribution and adaptive t-SNE visualization are displayed in Fig. 6. The top right of Fig. 6 results from a two-dimensional scatterplot of the distribution of reconstruction errors for normal and abnormal data. The implementation is straightforward using Matplotlib, but the meaning of the plot can be meaningful in practice. For example, a security expert can identify blue attack data classified as abnormal data in the upper distribution of normal and abnormal based on a threshold. In addition, attack data close to the normal category display a yellow warning as shown on an enlarged screen so that a specific range can be investigated in detail, and the corresponding logs can be tracked to prepare for future variant attacks.

Figure 6: Example of an intrusion detection monitoring dashboard for the NSL-KDD dataset
The bottom of the figure illustrates how the latent space changes dynamically after training with the adaptive method. Specifically, this paper used the Python library TSNE to reduce the dataset to two dimensions and presented the predicted normal and attack label distribution results in different colors. In Fig. 6, in the second subset, normal (blue) and abnormal (yellow) scattered plots are distributed in several places. However, the distinction between the two categories is relatively clear in the fourth subset because the results were gradually updated by the proposed adaptive algorithm. These results mean that satisfactory results can be shown as prediction results as more real-time subsets are updated. Therefore, security experts have the advantage of quantitatively examining the performance of the adaptive learning algorithm and being able to identify the changing traffic patterns easily and respond immediately.
The constantly evolving nature of malware and intrusion traffic poses a significant challenge for traditional training models. It is also challenging to understand the detection results on unlabeled real-time data. This study proposes the XA-GANomaly model, an adaptive semi-supervised learning approach that can learn from small subsets of real-time data and constantly update its detection capabilities to address these problems. Furthermore, three interpretive strategies for analyzing unlabeled network traffic data were developed: SHAP, reconstruction error distribution, and t-SNE. These can be used to analyze features, semi-supervised learning results, and adaptive learning results in sequence. As a result, the XA-GANomaly model surpassed other one-class classifications, highlighting the potential for continuously improving detection results through adaptive training.
Additionally, a dashboard display was created to provide security professionals with visual insight. However, this paper has limitations in applying the adaptive algorithm to imbalanced datasets because the results tend to depend on the number of subsets. Therefore, we focused on developing an adaptive algorithm that is robust to imbalanced datasets. Nonetheless, this study presents a novel adaptive algorithm with the potential to respond quickly to real-time attack traffic and has industrial applicability through its intuitive interpretation and visualization capabilities.
Acknowledgement: This paper is an extended version of the poster [38] “SEEM: A Method for Training Sequentially Enhanced Ensemble Models for Intrusion Detection” submitted to WISA 2022.
Funding Statement: This paper was supported by Korea Institute for Advancement of Technology (KIAT) grant funded by the Korea Government (MOTIE) (P0008703, The Competency Development Program for Industry Specialist).
Conflicts of Interest: The authors declare that they have no conflicts of interest to report regarding the present study.
References
1. R. A. I. Nafea and M. A. Almaiah, “Cyber security threats in cloud: Literature review,” in Proc. ICIT, Shanghai, China, pp. 779–786, 2021. [Google Scholar]
2. A. Khraisat, I. Gondal, P. Vamplew and J. Kamruzzaman, “Survey of intrusion detection systems: Techniques, datasets and challenges,” Cybersecurity, vol. 2, no. 1, pp. 1–22, 2019. [Google Scholar]
3. V. V. R. P. V. Jyothsna, R. Prasad and K. M. Prasad, “A review of anomaly based intrusion detection systems,” International Journal of Computer Applications, vol. 28, no. 7, pp. 26–35, 2011. [Google Scholar]
4. J. E. Van Engelen and H. H. Hoos, “A survey on semi-supervised learning,” Machine Learning, vol. 109, no. 2, pp. 373–440, 2020. [Google Scholar]
5. I. Zliobaite, A. Bifet, M. Gaber, B. Gabrys, J. Gama et al., “Next challenges for adaptive learning system,” ACM SIGKDD Explorations Newsletter, vol. 14, no. 1, pp. 48–55, 2012. [Google Scholar]
6. Z. Lin and D. Hongle, “Research on SDN intrusion detection based on online ensemble learning algorithm,” in Proc. NaNA, Haikou City, Hainan, China, pp. 114–118, 2020. [Google Scholar]
7. C. So-In, “A survey of network traffic monitoring and analysis tools,” in Cse 576 m Computer System Analysis Project, St. Louis, Missouri, USA: Washington University in St. Louis, 2009. [Google Scholar]
8. S. Mane and D. Rao, “Explaining network intrusion detection system using explainable AI framework,” arXiv preprint arXiv:2103.07110, 2021. [Google Scholar]
9. S. Patil, V. Varadarajan, S. M. Mazhar, A. Sahibzada, N. Ahmed et al., “Explainable artificial intelligence for intrusion detection system,” Electronics, vol. 11, no. 19, pp. 3079, 2022. [Google Scholar]
10. J. Jha and L. Ragha, “Intrusion detection system using support vector machine,” International Journal of Applied Information Systems (IJAIS), vol. 3, pp. 25–30, 2013. [Google Scholar]
11. M. A. M. Hasan, M. Nasser, B. Pal and S. Ahmad, “Support vector machine and random forest modeling for intrusion detection system (IDS),” Journal of Intelligent Learning Systems and Applications, vol. 6, no. 1, pp. 1–8, 2014. [Google Scholar]
12. T. T. H. Le, H. KIm, H. Kang and H. Kim, “Classification and explanation for intrusion detection system based on ensemble trees and SHAP method,” Sensors, vol. 22, no. 3, pp. 1154, 2022. [Google Scholar] [PubMed]
13. I. Abrar, Z. Ayub, F. Masoodi and A. M. Bamhdi, “A machine learning approach for intrusion detection system on NSL-KDD dataset,” in Proc. ICOSEC, Trichy, Tamil Nadu, India, pp. 919–924, 2020. [Google Scholar]
14. A. Rosay, F. Carlier and P. Leroux, “MLP4NIDS: An efficient MLP-based network intrusion detection for CICIDS2017 dataset,” in Proc. MLN 2019, Paris, France, pp. 240–254, 2020. [Google Scholar]
15. J. Kim, J. Kim, H. Kim, M. Shim and E. Choi, “NN-based network intrusion detection against denial-of-service attacks,” Electronics, vol. 9, no. 6, pp. 916, 2020. [Google Scholar]
16. C. Yin, Y. Zhu, J. Fei and X. He, “A deep learning approach for intrusion detection using recurrent neural networks,” IEEE Access, vol. 5, pp. 21954–21961, 2017. [Google Scholar]
17. P. Chapagain, A. Timalsina, M. Bhandari and R. Chitrakar, “Intrusion detection based on PCA with improved K-means,” in Proc. ICEEE, Singapore, pp. 13–27, 2022. [Google Scholar]
18. R. Yao, C. Liu, L. Zhang and P. Pend, “Unsupervised anomaly detection using variational auto-encoder based feature extraction,” in Proc. ICPHM, San Francisco, CA, USA, pp. 1–7, 2019. [Google Scholar]
19. X. Li, W. Chen, Q. Zhang and L. Wu, “Building auto-encoder intrusion detection system based on random forest feature selection,” Computers & Security, vol. 95, pp. 101851, 2020. [Google Scholar]
20. T. K. Boppana and P. Bagade, “GAN-AE: An unsupervised intrusion detection system for MQTT networks,” Engineering Applications of Artificial Intelligence, vol. 119, pp. 105805, 2023. [Google Scholar]
21. Y. C. A. P. Reddy, P. Viswanath and B. E. Reddy, “Semi-supervised learning: A brief review,” International Journal of Engineering & Technology, vol. 7, no. 1.8, pp. 81–85, 2018. [Google Scholar]
22. S. Shah, P. S. Muhuri, X. Yuan, K. Roy and P. Chatterjee, “Implementing a network intrusion detection system using semi-supervised support vector machine and random forest,” in Proc. ACM-SE, New York, NY, United States, pp. 180–184, 2021. [Google Scholar]
23. K. Hara and K. Shiomoto, “Intrusion detection system using semi-supervised learning with adversarial auto-encoder,” in NOMS 2020–2020 IEEE/IFIP Network Operations and Management Symp., Budapest, Hungary, pp. 1–8, 2020. [Google Scholar]
24. I. J. Goodfellow, J. Pouget-Abadie, M. Mirza, B. Xu, D. Warde-Farley et al., “Generative adversarial networks,” Communications of the ACM, vol. 63, no. 11, pp. 139–144, 2020. [Google Scholar]
25. S. Akcay, A. Atapour-Abarghouei and T. P. Breckon, “Ganomaly: Semi-supervised anomaly detection via adversarial training,” in Proc. ACCV, Perth, Australia, vol. 11364, pp. 622–637, 2018. [Google Scholar]
26. S. Li, Y. Lu and J. Li, “Cad-ids: A cooperative adaptive distributed intrusion detection system with fog computing,” in Proc. CSCWD, Hangzhou, China, pp. 635–640, 2022. [Google Scholar]
27. X. Gao, C. Shan, C. Hu, Z. Niu and Z. Liu, “An adaptive ensemble machine learning model for intrusion detection,” IEEE Access, vol. 7, pp. 82512–82521, 2019. [Google Scholar]
28. Z. Hu, L. Wang, L. Qi, Y. Li and W. Yang, “A novel wireless network intrusion detection method based on adaptive synthetic sampling and an improved convolutional neural network,” IEEE Access, vol. 8, pp. 195741–195751, 2020. [Google Scholar]
29. Z. Lin and D. Hongle, “Research on SDN intrusion detection based on online ensemble learning algorithm,” in Proc. NaNA, Hainan, China, pp. 114–118, 2020. [Google Scholar]
30. M. Wang, K. Zheng, Y. Yang and X. Wang, “An explainable machine learning framework for intrusion detection systems,” IEEE Access, vol. 8, pp. 73127–73141, 2020. [Google Scholar]
31. M. Abbasi, A. Shahraki and A. Taherkordi, “Deep learning for network traffic monitoring and analysis (NTMAA survey,” Computer Communications, vol. 170, pp. 19–41, 2021. [Google Scholar]
32. R. Kale, Z. Lu, W. K. Fok and V. L. Thing, “A hybrid deep learning anomaly detection framework for intrusion detection,” in 2022 IEEE 8th Int. Conf. on Big Data Security on Cloud, Jinan, China, pp. 137–142, 2022. [Google Scholar]
33. S. R. Khonde and V. Ulagamuthalvi, “Ensemble-based semi-supervised learning approach for a distributed intrusion detection system,” Journal of Cyber Security Technology, vol. 3, no. 3, pp. 163–188, 2019. [Google Scholar]
34. M. B. Kura and W. R. Rudnicki, “Feature selection with the boruta package,” Journal of Statistical Software, vol. 36, no. 11, pp. 1–13, 2010. [Google Scholar]
35. M. Tavallaee, E. Bagheri and W. Lu, “A detailed analysis of the KDD CUP 99 data set,” in Proc. CISDA, Verona, Ny, USA, pp. 1–6, 2009. [Google Scholar]
36. S. Choudhary and N. Kesswani, “Analysis of KDD-cup’99, NSL-KDD and UNSW-NB15 datasets using deep learning in IoT,” Procedia Computer Science, vol. 167, pp. 1561–1573, 2020. [Google Scholar]
37. N. Moustafa and J. Slay, “UNSW-NB15: A comprehensive data set for network intrusion detection systems (UNSW-NB15 network data set),” in Proc. ICMCIS, National Convention Centre, Canberra, Australia, pp. 1–6, 2015. [Google Scholar]
38. Y. Han and H. Chang, “SEEM: A method for training sequentially enhanced ensemble models for intrusion detection,” in Proc. WISA, Maison Glad, Jeju Island, Korea, 2022. [Google Scholar]
Cite This Article
 Copyright © 2023 The Author(s). Published by Tech Science Press.
This work is licensed under a Creative Commons Attribution 4.0 International License , which permits unrestricted use, distribution, and reproduction in any medium, provided the original work is properly cited.
 Downloads
 Citation Tools