
 Submit a Paper
 Propose a Special lssue
 Open Access
ARTICLE

Enhanced Nature Inspired-Support Vector Machine for Glaucoma Detection
1 Engineering Research Center of Intelligent Perception and Autonomous Control, Faculty of Information Technology, Beijing University of Technology, 100124, Beijing, China
2 College of Information Science Technology, Hainan Normal University, Hainan Province, Haikou, 571158, China
3 Department of Computer Science, University of Salford, Manchester, UK
4 Faculty of Information Technology Beijing University of Technology Chaoyang District, Beijing, China
* Corresponding Author: Shanshan Tu. Email:
(This article belongs to the Special Issue: Recent Advances in Ophthalmic Diseases Diagnosis using AI)
Computers, Materials & Continua 2023, 76(1), 1151-1172. https://doi.org/10.32604/cmc.2023.040152
Received 07 March 2023; Accepted 29 April 2023; Issue published 08 June 2023
 View Full Text
 Download PDF
Abstract
Glaucoma is a progressive eye disease that can lead to blindness if left untreated. Early detection is crucial to prevent vision loss, but current manual scanning methods are expensive, time-consuming, and require specialized expertise. This study presents a novel approach to Glaucoma detection using the Enhanced Grey Wolf Optimized Support Vector Machine (EGWO-SVM) method. The proposed method involves preprocessing steps such as removing image noise using the adaptive median filter (AMF) and feature extraction using the previously processed speeded-up robust feature (SURF), histogram of oriented gradients (HOG), and Global features. The enhanced Grey Wolf Optimization (GWO) technique is then employed with SVM for classification. To evaluate the proposed method, we used the online retinal images for glaucoma analysis (ORIGA) database, and it achieved high accuracy, sensitivity, and specificity rates of 94%, 92%, and 92%, respectively. The results demonstrate that the proposed method outperforms other current algorithms in detecting the presence or absence of Glaucoma. This study provides a novel and effective approach to Glaucoma detection that can potentially improve the detection process and outcomes.Keywords
Glaucoma is a significant cause of irreversible blindness on a global scale. The identification of glaucomatous eyes involves categorizing them based on specific characteristics s. Blind spots develop in the glaucoma eye due to damage to optic nerve fibers, but they cannot be detected until the nerve is damaged [1]. Early identification and treatment are necessary to prevent vision loss caused by intraocular pressure and malformation or malfunction of the eyes. Glaucoma is classified into primary angle-closure glaucoma (PACG)and primary open-angle glaucoma (POAG), with PACG being asymptomatic and chronic and POAG often having no symptoms until the disease has caused significant damage shown in Fig. 1. The impact of Glaucoma on vision is progressive, and early detection is challenging, making consistent eye examinations essential. Manual identification of Glaucoma is time-consuming, costly, and subjective, highlighting the need for efficient and automated detection models. Glaucoma has various classes, such as normal tension, congenital, open-angle, and closed-angle, and there is currently no proper medical tool for early detection and treatment. Computer-aided diagnostic systems are needed to assist in diagnosing and treating glaucoma patients and for better decision-making. Various approaches, such as cup-to-disc ratio (CDR) measurement, laser ophthalmoscopy, and optical coherence tomography (OCT), have been used for glaucoma detection, but they do not consistently provide satisfactory results. Early detection, as well as treatment, are crucial to prevent irreversible vision loss. However, Glaucoma often goes undetected until the disease is advanced, and the damage to the optic nerve is irreversible [2].
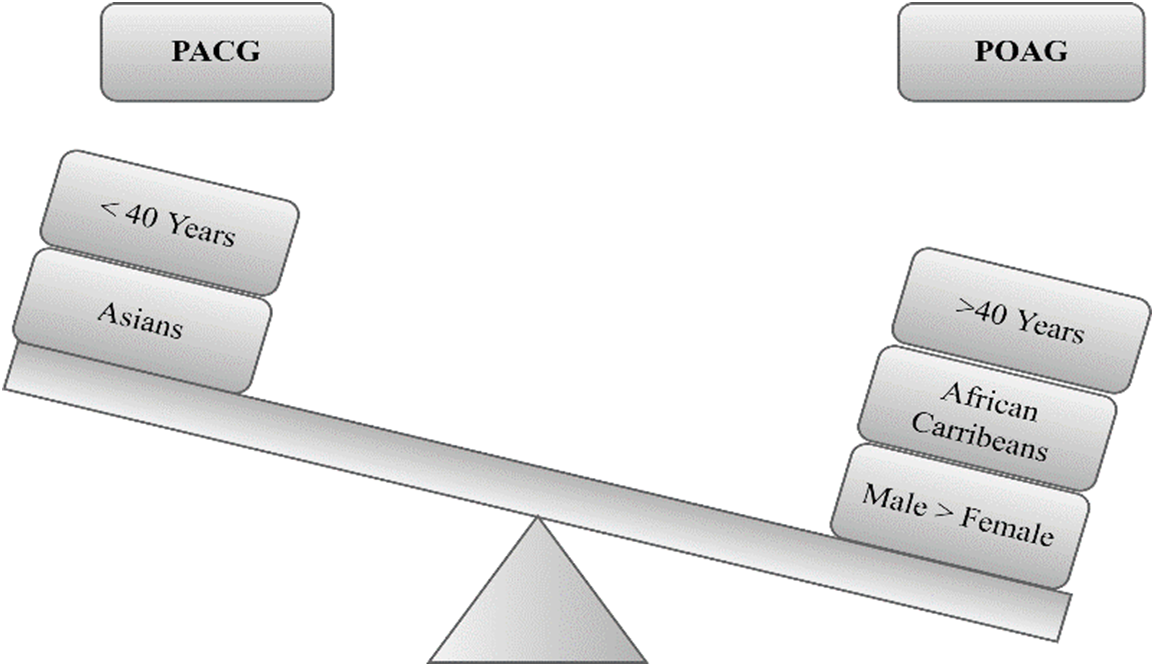
Figure 1: Characteristics of glaucoma
Machine learning (ML) has become a powerful tool in various domains, including medical, agricultural, cybersecurity, and natural language processing. ML can automate tasks, reduce errors, and provide insights that may be difficult for humans to detect. It has been used for disease diagnosis [3–5], crop yield prediction [6,7] Cancer diagnosis [8], and many others. Therefore, ML has proven to be a versatile tool that can benefit various domains and improve efficiency and accuracy in decision-making processes. Furthermore, Machine learning has emerged as a promising approach in ophthalmology for assessing various eye diseases, including Glaucoma, diabetic retinopathy, and age-related macular degeneration [9].
Moreover, Metaheuristic algorithms are important in glaucoma detection because they can efficiently search for optimal solutions in complex data sets. They can handle large amounts of data and optimize various aspects of glaucoma detection, such as feature selection and machine learning algorithm parameters. Metaheuristic algorithms have shown promising results in improving the accuracy and efficiency of glaucoma detection, making them valuable tools for ophthalmologists [10]. These approaches utilize machine learning algorithms to analyze multimedia images, visual fields, and optical coherence tomography, among other diagnostic techniques. Automatic glaucoma detection models are gaining considerable interest in making reliable and faster decisions. However, existing automated methods have been developed to detect Glaucoma using fundus images. These methods extract relevant features from the images using various image analysis techniques, like the cup-to-disc ratio, vessel features, and texture features. The accuracy of these automated methods in detecting Glaucoma is comparable to that of human experts [11]. The motivation behind automated early detection of Glaucoma using fundus images is to improve the accuracy and efficiency of diagnosis. Early detection can prevent irreversible vision loss and improve the quality of life for patients. Additionally, automated methods can be more efficient and cost-effective than manual analysis, as they do not require highly trained personnel to perform the tests. Therefore, these methods can make Glaucoma screening more accessible to a larger population [12]. This research addresses these limitations by adopting efficient preprocessing and feature extraction techniques for better glaucoma detection results. The main continuations are as follows:
• This study proposed a novel approach that combines Improved Grey Wolf Optimization and Support Vector Machine to classify glaucoma. The proposed method is easy to implement, yields significant results, offers high accuracy, and works well for optimization problems with small and large features.
• EGWO has been utilized to select the optimal subset of features from the initial dataset, removing redundant and irrelevant features while prioritizing feature relevance.
• To the author’s knowledge, the EGWO-SVM method has not yet been developed or evaluated for the detection and classification of glaucoma. Hence, a novel combination approach based on EGWO-SVM is expected to improve diagnostic accuracy significantly.
• The pre-processing and feature extraction procedure involves removing image noise and converting images to grayscale for feature extraction using the speeded-up robust feature (SURF), histogram of oriented gradients (HOG), and Global features.
• The proposed enhanced classifier is more accurate than current algorithms in detecting the presence or absence of glaucoma to assist ophthalmologists in treating patients and preventing permanent vision loss.
This paper proposes a hybrid machine learning model to develop a glaucoma detection system using the Enhanced Grey Wolf Optimized Support Vector Machine (EGWO-SVM) methodology. The goal of this research is to determine whether a patient has Glaucoma or not. Section 2 provides the literature review, Section 3 presents an overview of the proposed approach, Section 2 reviews the relevant literature, Section 3 defines the problem, Section 4 outlines the proposed approach respectively, Section 5 presents the experimental findings, and Section 6 concludes the article.
Li et al. developed a glaucoma detection model using an attention-based convolutional neural network (CNN). The study utilized data from the Large-Scale Attention-Based Glaucoma (LAG) database of 11,760 fundus images for negative and positive glaucoma classes. The attention-based CNN was utilized for glaucoma classification and attention maps of eye-tracking experiments. Through weakly supervised training, the model predicted attention maps for identifying the salient regions for glaucoma detection. The study visualized the localized pathological regions to improve glaucoma detection performance. The proposed system demonstrated superior performance over other conventional methods [13].
Song, Lai, and Su proposed a novel approach for automatic glaucoma detection using Retinex theory, Design of Experiment (DOE), generalized loss function, and CNN. This method enhances the results of fundus images by removing the light effects and restoring the original colors, leading to improved performance in simplicity and effectiveness. The proposed method has achieved significant efficiency and robustness compared to conventional approaches evaluated using standard error metrics. The authors also presented mathematical notations and intuitive graphs for the designed model, demonstrating its efficacy in terms of results. Overall, this approach is more suitable for the real-time detection of glaucoma [14].
Parashar and Agrawal proposed a new algorithm called 2-D Compact Variation Mode Decomposition (2-D-C-VMD) to classify glaucoma stages, including early-stage, advanced-stage, and healthy. The algorithm involves pre-processing and decomposing images using 2-D-C-VMD to obtain Variational Modes (VMs), extracting features using Fractal Dimension, Energy, and various entropy measures from the initial VM, performing dimensionality reduction using Linear Discriminant Analysis (LDA), and executing classification using a trained Multiclass Least-Squares-Support Vector Machine (MC-LS-SVM) classifier. The algorithm’s performance is evaluated using tenfold cross-validation and compared with other approaches [15]. The authors later incorporated Two-Dimensional Tensor Empirical Wavelet Transform (2D-T-EWT) for pre-processing images to perform image decomposition and obtain Subband Images (SBIs). The features were extracted using techniques such as moment-invariant, chip histogram, and Grey Level Co-Occurrence Matrix (GLCM), and reliable features were selected by ranking them with the student’s t-test algorithm. Finally, the MC-LS-SVM classifier was utilized to attain the final classification outcomes. The proposed algorithm’s performance was evaluated using tenfold cross-validation and compared with other methods, where the results demonstrated superior outcomes in glaucoma classification [16].
Pruthi et al. proposed an automated detection method for the optic cup using the Glowworm Swarm Optimization algorithm. The algorithm utilizes glowworms as agents to construct solutions based on the intensity gradient within the cup region. The adaptive neighborhood behavior of the glowworms enables the algorithm to explore effectively, resulting in accurate detection of the optic cup region, even in images with low contrast or weak cup boundaries. The algorithm’s performance was evaluated on multiple datasets, including RIM-ONE, DRIVE, STARE, DRIONS-DB, and DIARETDB1. The proposed method achieved a minimum overlapping error of 22.1% for DRIONS-DB, surpassing other techniques such as thresholding-based, ellipse fitting, and ant colony optimization algorithms [17].
Septiarini et al. proposed a method for localizing the disc and segmenting the cup in retinal fundus images using a masking technique to prevent misclassification and edge detection to form the cup’s structure. The performance of the approach is evaluated on two datasets, D-I and D-II, which demonstrate promising outcomes. The disc localization exhibits an average F-score of 0.96 and an average boundary distance of 7.7 for D-I and 0.96 and 9.1, respectively, for D-II. The cup segmentation shows an average F-score of 0.88 and an average boundary distance of 13.8 for D-I and 0.85 and 18.0, respectively, for D-II. The estimation errors of the method for the vertical cup-to-disc diameter ratio against expert results are similar for D-I and D-II. These findings suggest that the proposed method is robust and can be utilized for glaucoma evaluation [18].
Juneja et al. has developed an Artificial Intelligence-based expert system for glaucoma detection by performing optic disc and cup segmentation using a Deep Learning architecture with CNN. The system has achieved an accuracy of 95.8% for disc segmentation and 93% for cup segmentation. DC-Gnet is another deep learning-based network introduced to diagnose glaucoma by discriminating disc cups, using structural features such as cup-to-disc ratio, disc damage likelihood scale, and regions in the inferior, superior, nasal, and temporal regions. The performance of the DC-Gnet segmentation approach has been evaluated on the RIM-One and Drishti-GS datasets and has demonstrated superior segmentation accuracy when compared to other deep learning-based architectures like U-net, Gnet, and Deep-lab [19,20]. Abdel-Hamid et al. has also proposed a wavelet-based algorithm that can detect glaucoma in real-time. The algorithm has achieved an accuracy of 96.7% and an area under the receiver operating curve (AUC) of 94.7% for a high-resolution dataset. The proposed algorithm uses wavelet-based statistical and textural features, which are relevant for glaucoma detection and can be utilized for real-time applications as it processes high-resolution retinal images in less than 3 s [21].
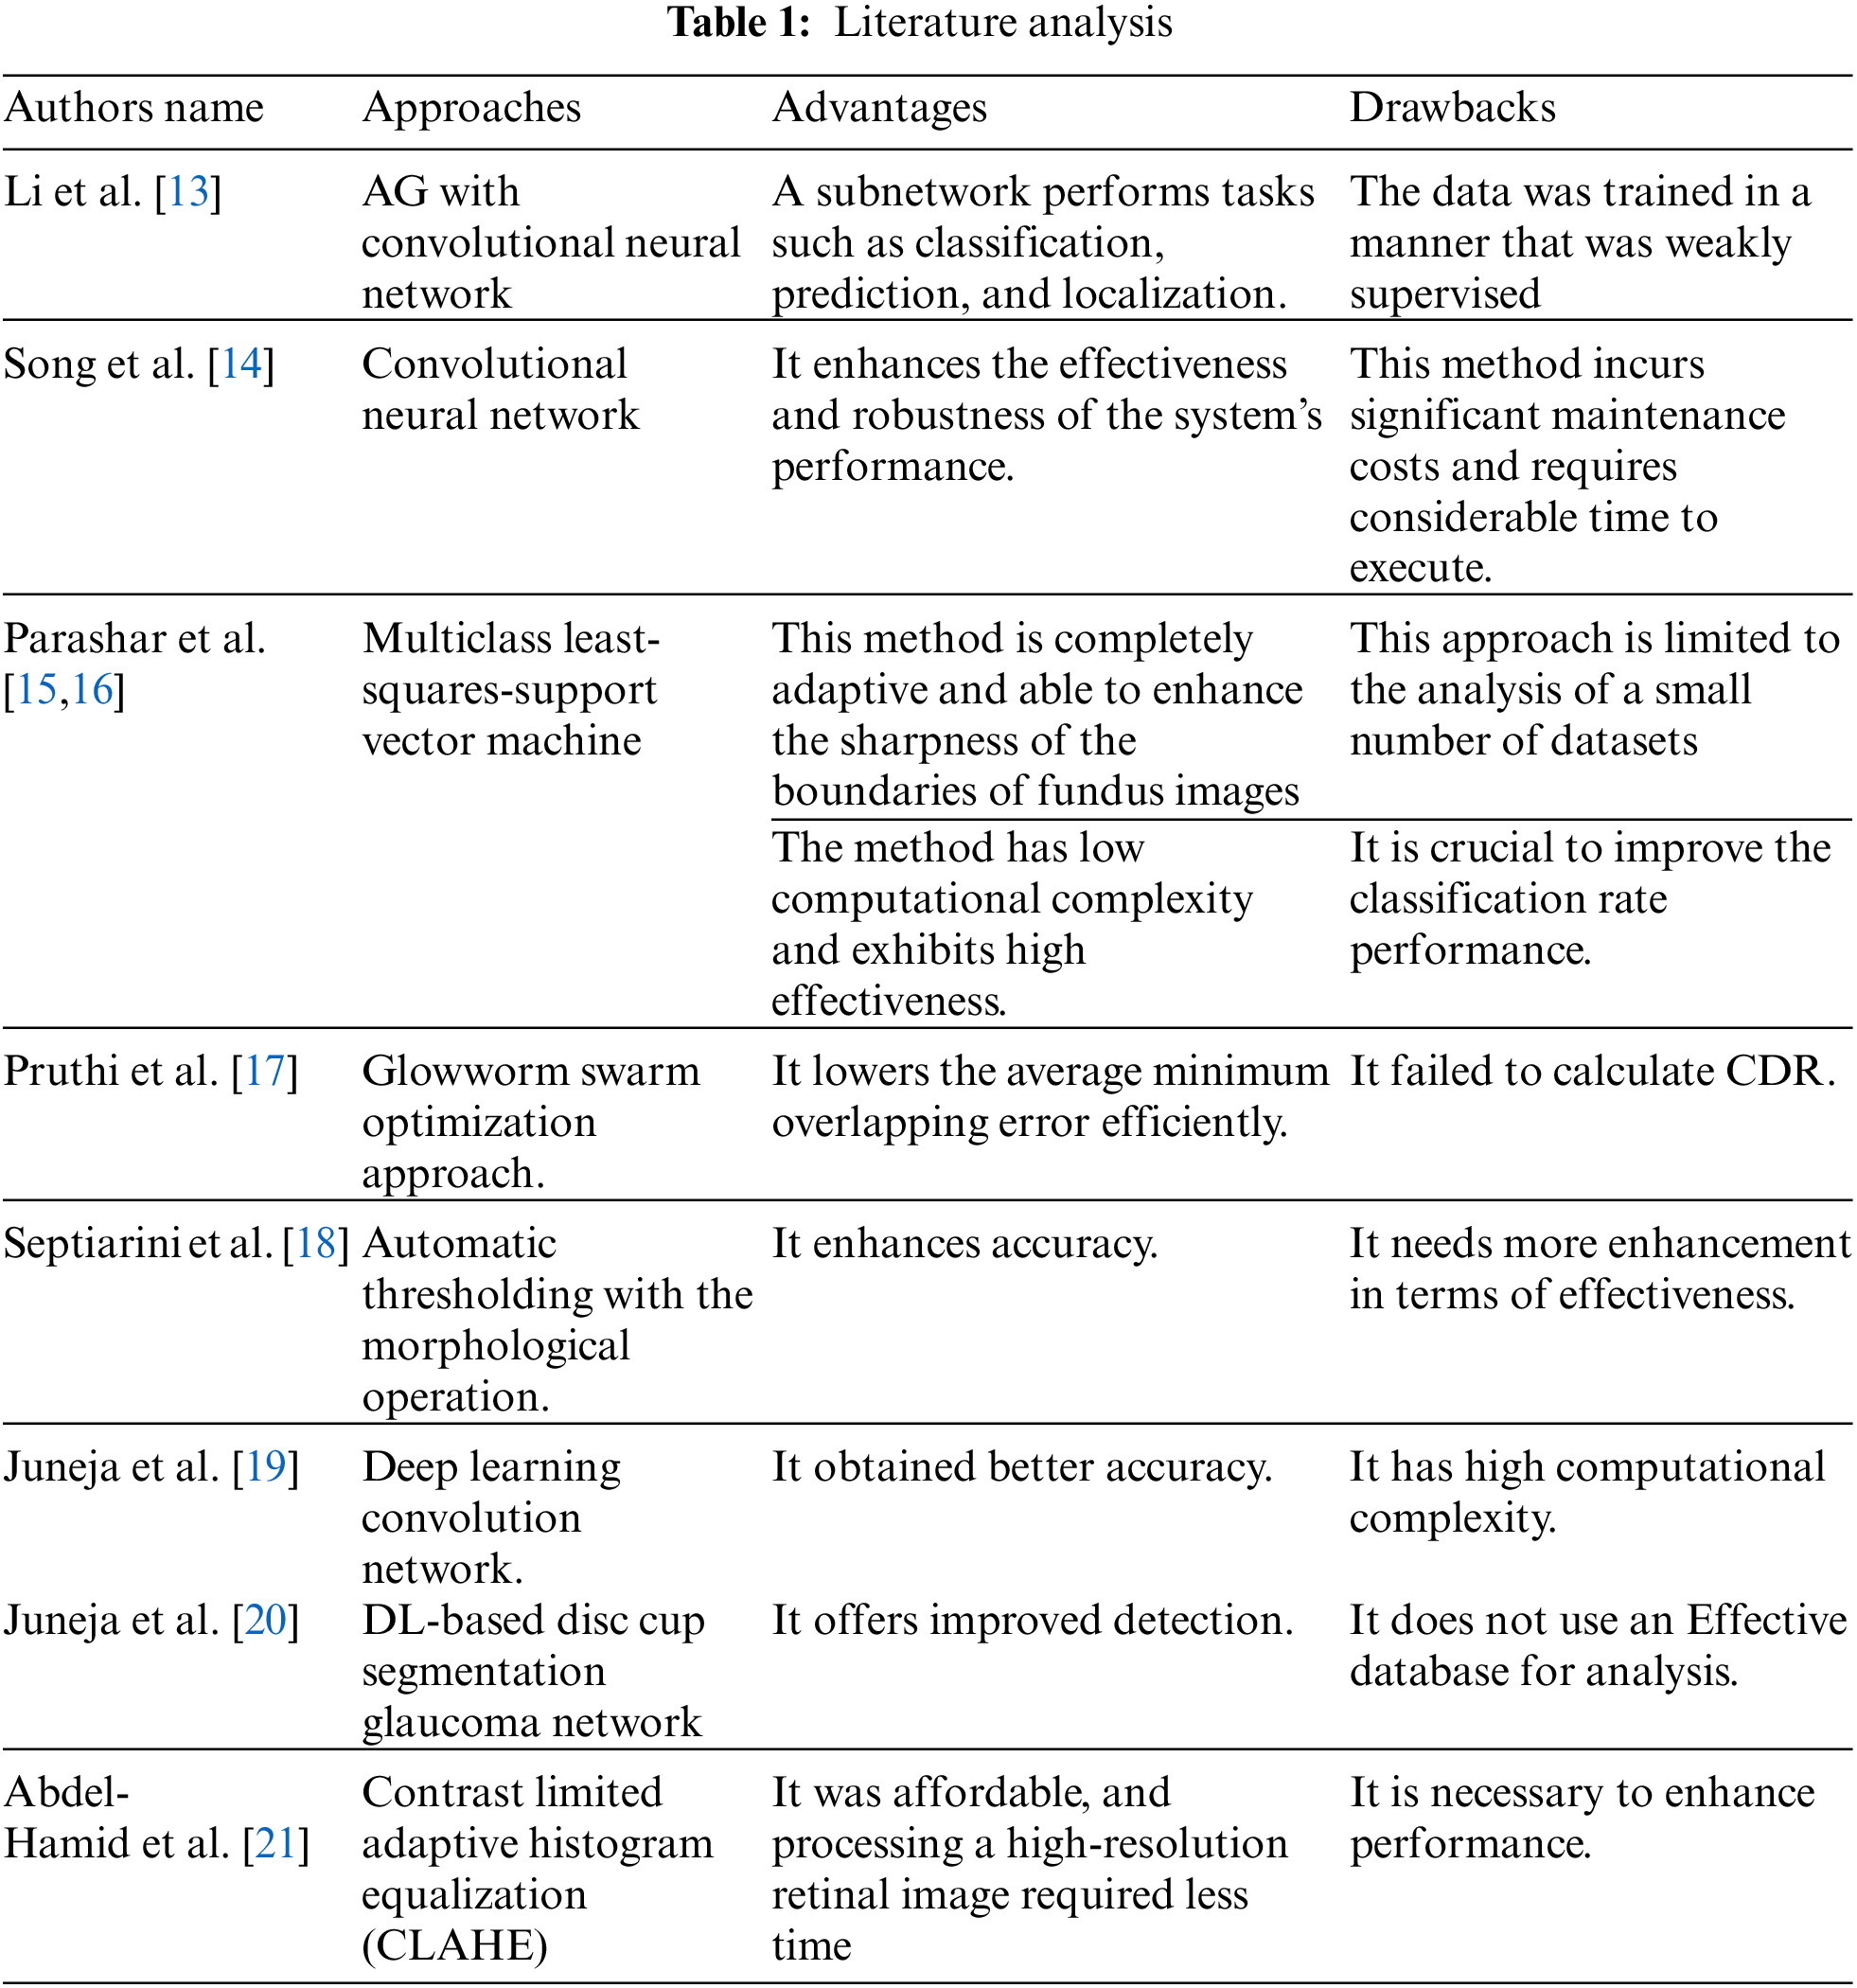
Glaucoma is a prevalent eye disease worldwide, but its cure is currently unavailable. Early detection and treatment of glaucoma can help prevent blindness, but the analysis becomes challenging due to the shortage of highly qualified ophthalmologists. Therefore, various techniques have been implemented for the classification and detection of glaucoma, which is summarized in Table 1
The abovementioned limitations have motivated researchers to develop a new glaucoma detection and classification model using deep learning techniques.
Glaucoma, commonly termed the “Sneak Thief of Sight,” is a chronic eye disease that progressively deteriorates eyesight in unknowing patients. There are no specific symptoms during the early stages of Glaucoma, and regular eye tests can only detect the disease. The goal is to prevent blindness and vision loss by detecting Glaucoma early and treating it promptly. In the medical field, the issue of Computer-Aided Diagnostic (CAD) System is a hot area of study because it is a vital tool that assists health professionals in detecting various severe disorders, allowing them to make a more accurate decision. Various CAD systems have been advocated for detecting Glaucoma. The suggested method is a CAD system that accurately detects Glaucoma [22–24].
The EGWO-SVM approach detects the presence or absence of Glaucoma. Pre-processing steps include converting the input image to greyscale, removing noise with Adaptive Median Filter (AMF), and performing image normalization.
Feature extraction is now performed, speeded-up robust feature (SURF), histogram of oriented gradients (HOG) features combined with Global features extracted from the pre-processed image. Standard Deviation, Variance, and Mean are the three global characteristics. Furthermore, classification is carried out using the support vector machine (SVM) of the enhanced grey wolf optimization (EGWO) approach. Fig. 2 shows the suggested technique’s configuration [25].
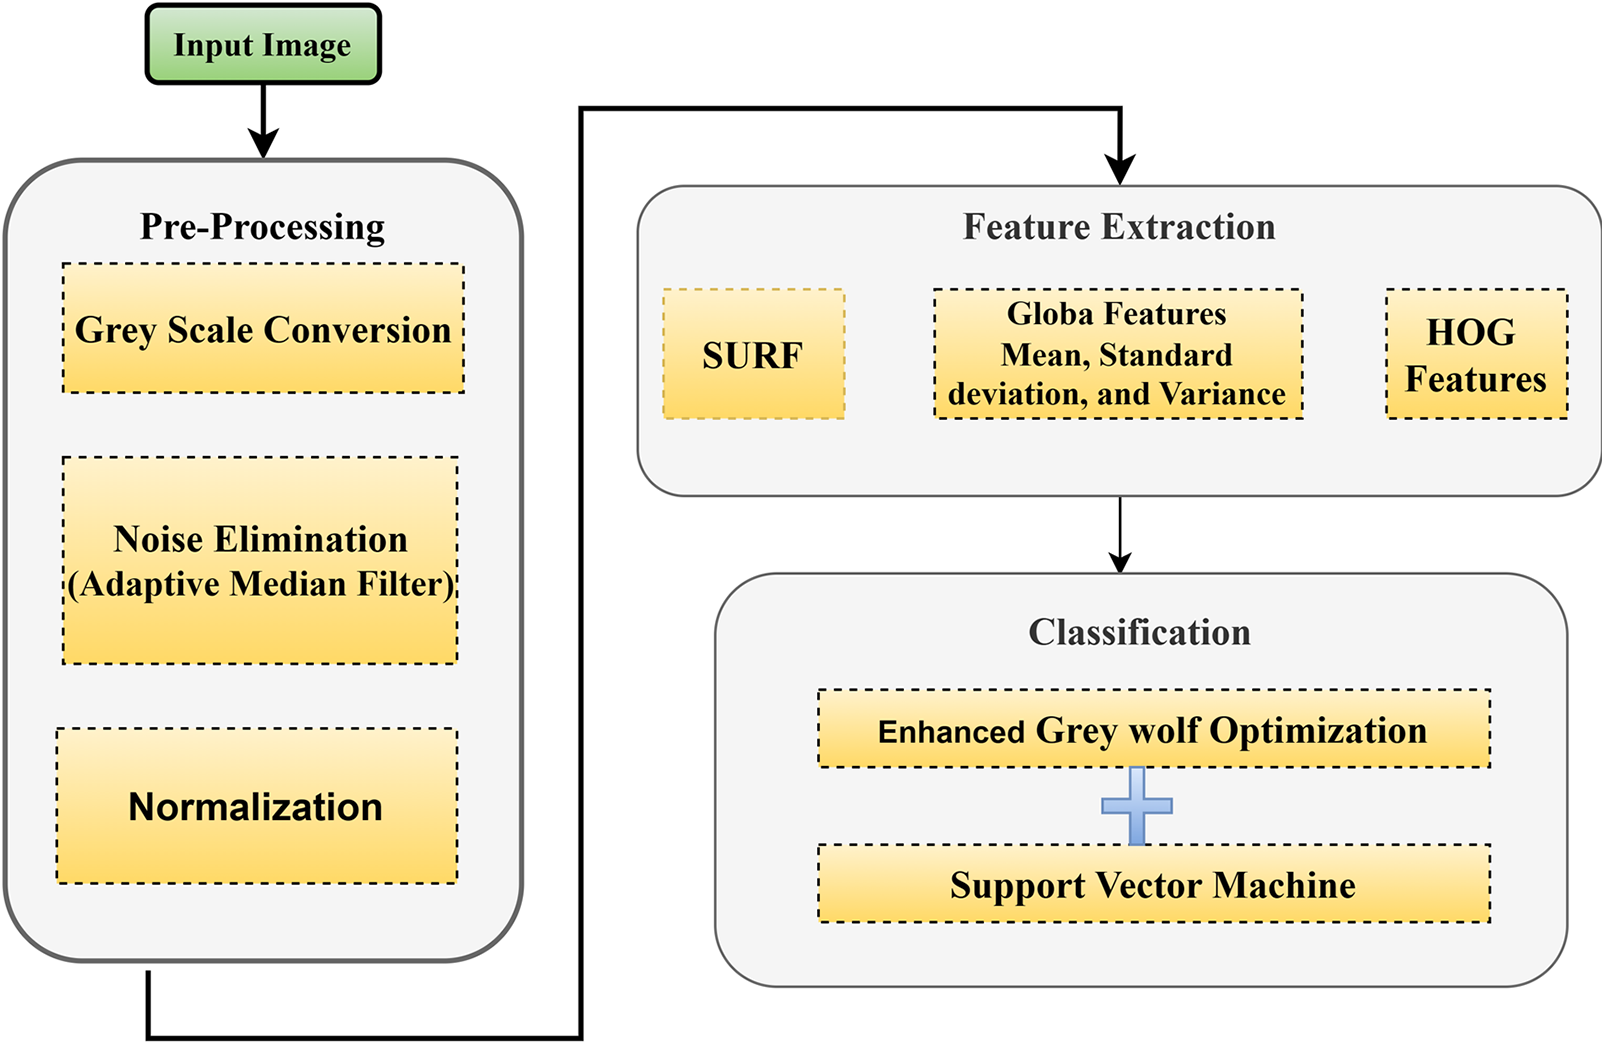
Figure 2: Proposed scheme
Pre-processing an image can improve the feature extraction performance and image analysis results. The first step in this stage is to convert the input image to a grayscale. After that, the noise is eliminated using AMF, and the image is normalized, as depicted in Fig. 3.
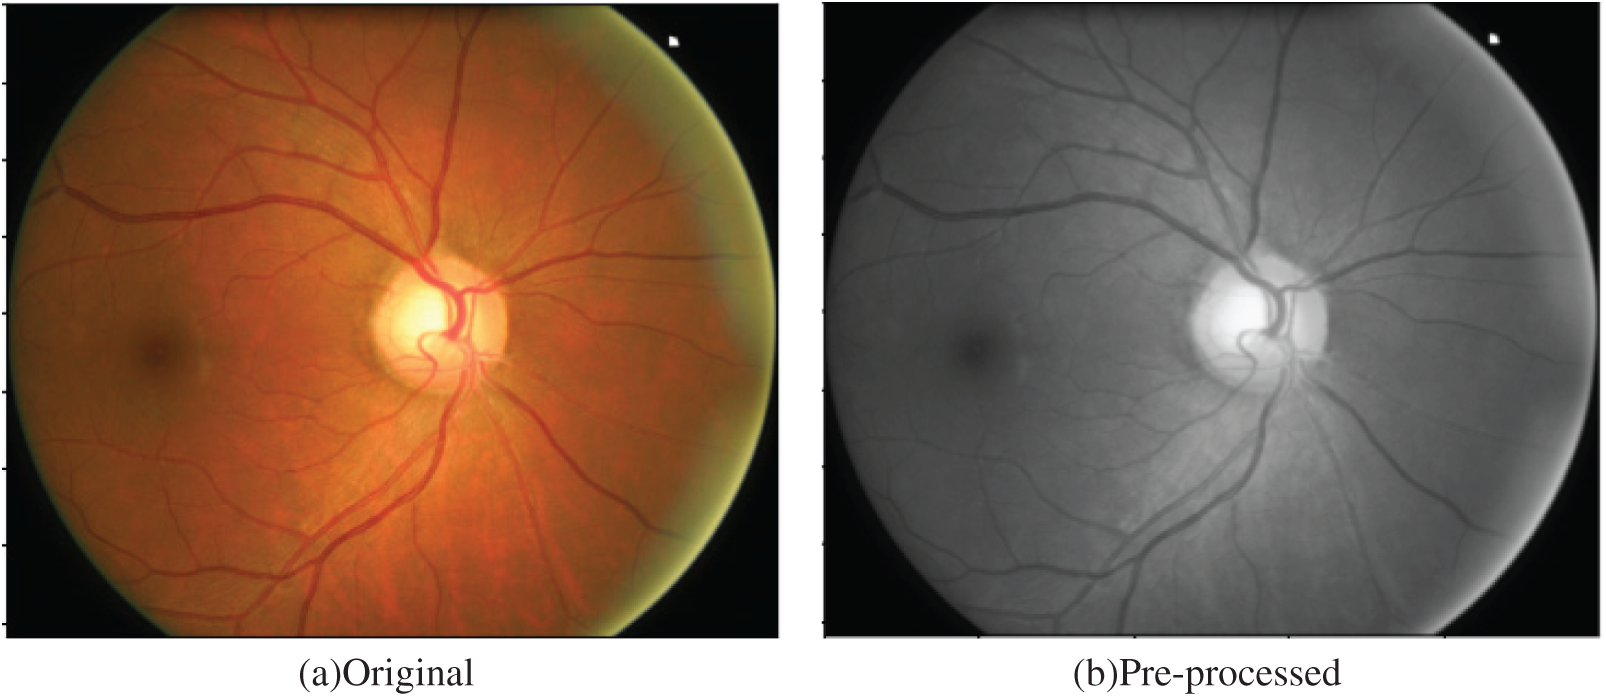
Figure 3: (a) Original and (b) pre-processed image
4.1.1 Grayscale Transformation
To achieve a consistent intensity in an image, retinal nerve fiber (RNF) images are converted into grayscale images. The resulting grayscale image consists of pixel values, each of which represents a single sample indicating the amount of light and carrying only intensity data. By converting the RNF images to grayscale, a consistent intensity is achieved across the entire image.
When the noise probability exceeds 20%, the conventional median filter (MF) becomes less effective. In addition, the traditional MF fails to detect noise points within the window. Moreover, when the percentage of invalid noise points exceeds 50%, the significance of the filter loss increases as the median point is replaced by a noise point. To address these challenges, Adaptive Median Filter (AMF) has been introduced, which offers a criterion for judging whether a noise point is suitable for substituting the median point or not. AMF can be utilized for removing noise from an image. In AMF, each pixel of an image is compared with its neighboring pixels individually to determine if it constitutes noise. The size of the neighboring pixel is adjusted based on the threshold size. Impulse noise is identified as a pixel that is different from its closest neighbors and is not sufficiently associated with comparable neighbor pixels. The estimated median-valued pixel of the neighboring pixels is then substituted with these noise-based pixel values that pass the noise label testing.
A local window is created to check the neighboring characteristics for each extreme pixel, which moves from left to right and top to bottom. The center pixel of the window is the one being reconstructed from the other pixels within the window. Only non-extreme pixels are used in the local window to rebuild the noise-corrupted center pixel. The local window is expressed by Eq. (1).
where
The weighting factor is calculated using the total non-extreme pixels. A non-extreme label determines whether a pixel is non-extreme, such as:
If the pixel
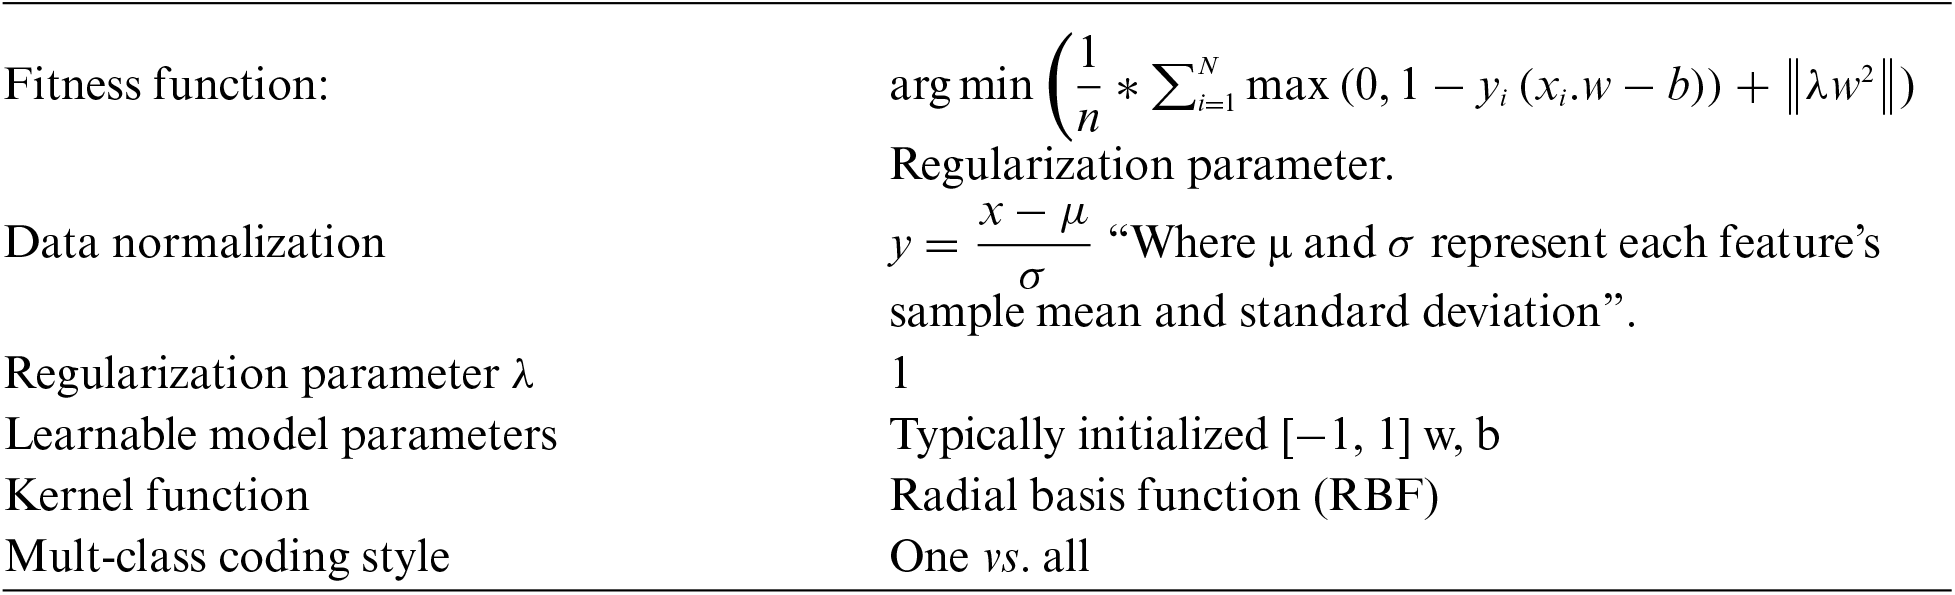
The range of pixel intensity values in an image is changed by normalization throughout the whole dataset range [0 to 255]. It is a procedure for balancing the values of all single attributes and reducing the data set’s feature-related bias with higher values by sorting them in a balanced order. Normalizing the available data assures equal weight distribution to each variable. The maximum value of every attribute in the database is normalized to the same [0–1] range as the highest value. Consequently, normalization reduces the particular training error, allowing the efficiency of the classification issue to be established.
At this stage, the images are normalized to [0, 1] using the conventional approach of Eq. (3).
where
Feature extraction is an approach that aims to extract relevant information from raw data. These extracted features are crucial in differentiating between classes. However, irrelevant variations in the input data can render these classes insensitive, and the amount of data required for training may become too large. To address these issues, this method reduces the data dimensionality by assessing features or positive characteristics that distinguish one input sample from another. The parameter settings that adequately and uniquely represent a character’s form are discovered during this process, and a feature vector is generated for each character’s identity. In the case of Glaucoma identification, features such as SURF and global features like mean, variance, standard deviation, and HOG are utilized.
4.2.1 Speeded-up Robust Feature (Surf)
This approach involves utilizing a BLOB detector centered on a Hessian matrix to set the points. It uses wavelet responses in vertical and horizontal dimensions and appropriate Gaussian weights for feature orientation mapping and description. A neighbor surrounding the critical point is chosen and divided into sub-regions. The wavelet responses are evaluated and indicated for each sub-region to provide the SURF descriptor. Eq. (4) illustrates the descriptor vector
Global features are employed to represent the entire image, and they offer a concise image representation in which each image corresponds to a point in a higher-dimensional space. The mean of the feature set is calculated using Eq. (5) and represents the arithmetic average of the specified set.
where,
Standard deviation: is the metric for calculating the total variation or dispersion in a group of data values. It is calculated using Eq. (6).
where,
Variance: The spread between values in the feature set is measured in variance, a dimension of the spread. The variance indicates how much each piece of data deviates from the mean. It is calculated using Eq. (7).
4.2.3 Histogram of Oriented Gradients (HOG) Feature
It is a characteristic used to drive image processing and computer vision recognition. This method adds up the occurrences of gradient orientation in an image’s localized rations. It calculates and collects data from a gradient histogram in a localized area of the predominant image to draw the features. Fig. 4 shows the HOG-centered feature extraction.
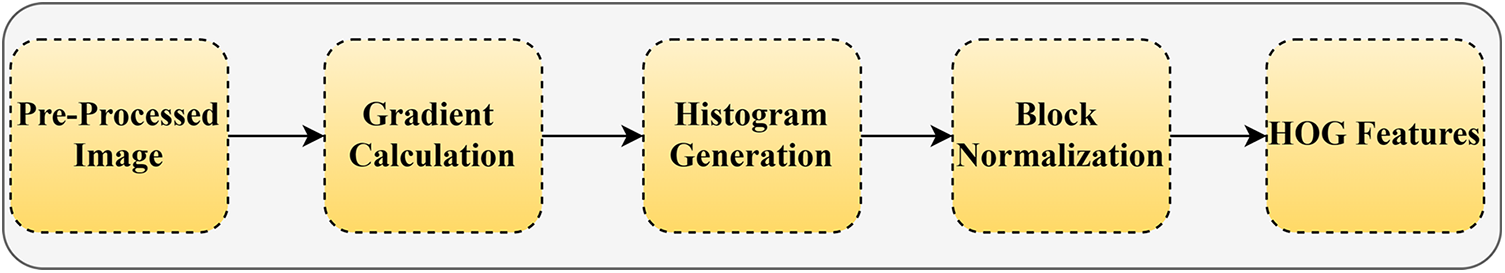
Figure 4: HOG-centered feature extraction
The HOG features of the image can be extracted and integrated with other features and the classifier in this process, allowing it to be applied to specific scenarios and achieve its related purpose, as shown in the figure above.
Gradient calculation: Firstly, to extract the HOG feature, calculate the different values for
where
Histogram generation: Each Cell’s histogram is based on the previously estimated gradient magnitude and direction. In a Cell, the orientated gradients are split as a bin, and the necessary bins are obtained. Cells evenly divided from a block are precisely collected to produce feature vectors.
Block normalization: The range of the gradient value is relatively vast due to block normalization, which is based on the variety of the change in the image backdrop and illumination condition. As a result, proper normalization is vitally crucial for detection once feature extraction is completed. The feature vector
where
4.3 Enhanced Grey Wolf Optimization SVM-Based Scheme
The proposed technique integrated the enhanced GWO with the SVM classifier to detect Glaucoma.
4.3.1 Binary Grey Wolf Optimization
Grey wolf optimization (GWO) was first presented as a met heuristic technique by Mirjalili et al. [26] in 2014. It is based on grey wolves’ hunting behavior and social leadership in their natural environment. Every GWO iteration assumes that alpha, beta, and delta are the three best-fitting candidate solutions. They direct the population to the most probable areas of the search space. Omega is the name given to the remaining grey wolves intended to aid alpha, beta, and delta in the surrounding, hunting and attacking prey, resulting in optimal solutions. Fig. 5 shows the grey wolf hierarchical social structure.
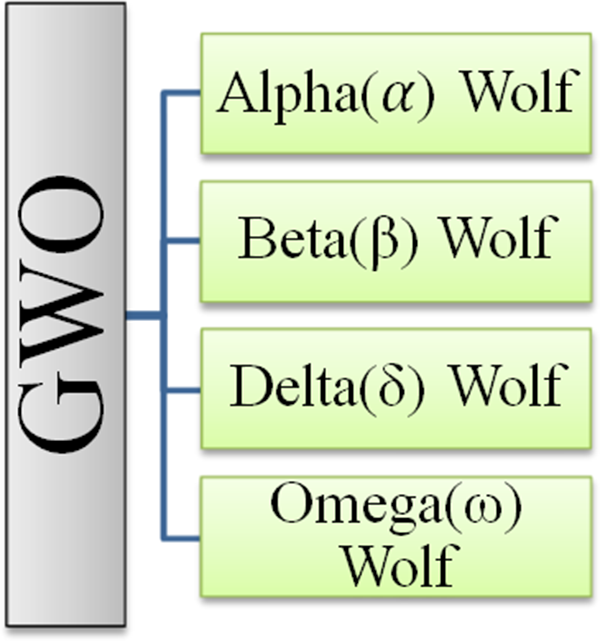
Figure 5: Hierarchy of the Grey Wolves (GW) [26]
The following equations are developed to mimic the encircling behavior of grey wolvesmathematically
where
The following equations are suggested to mathematically model grey wolf hunting behavior, as shown in Fig. 6.
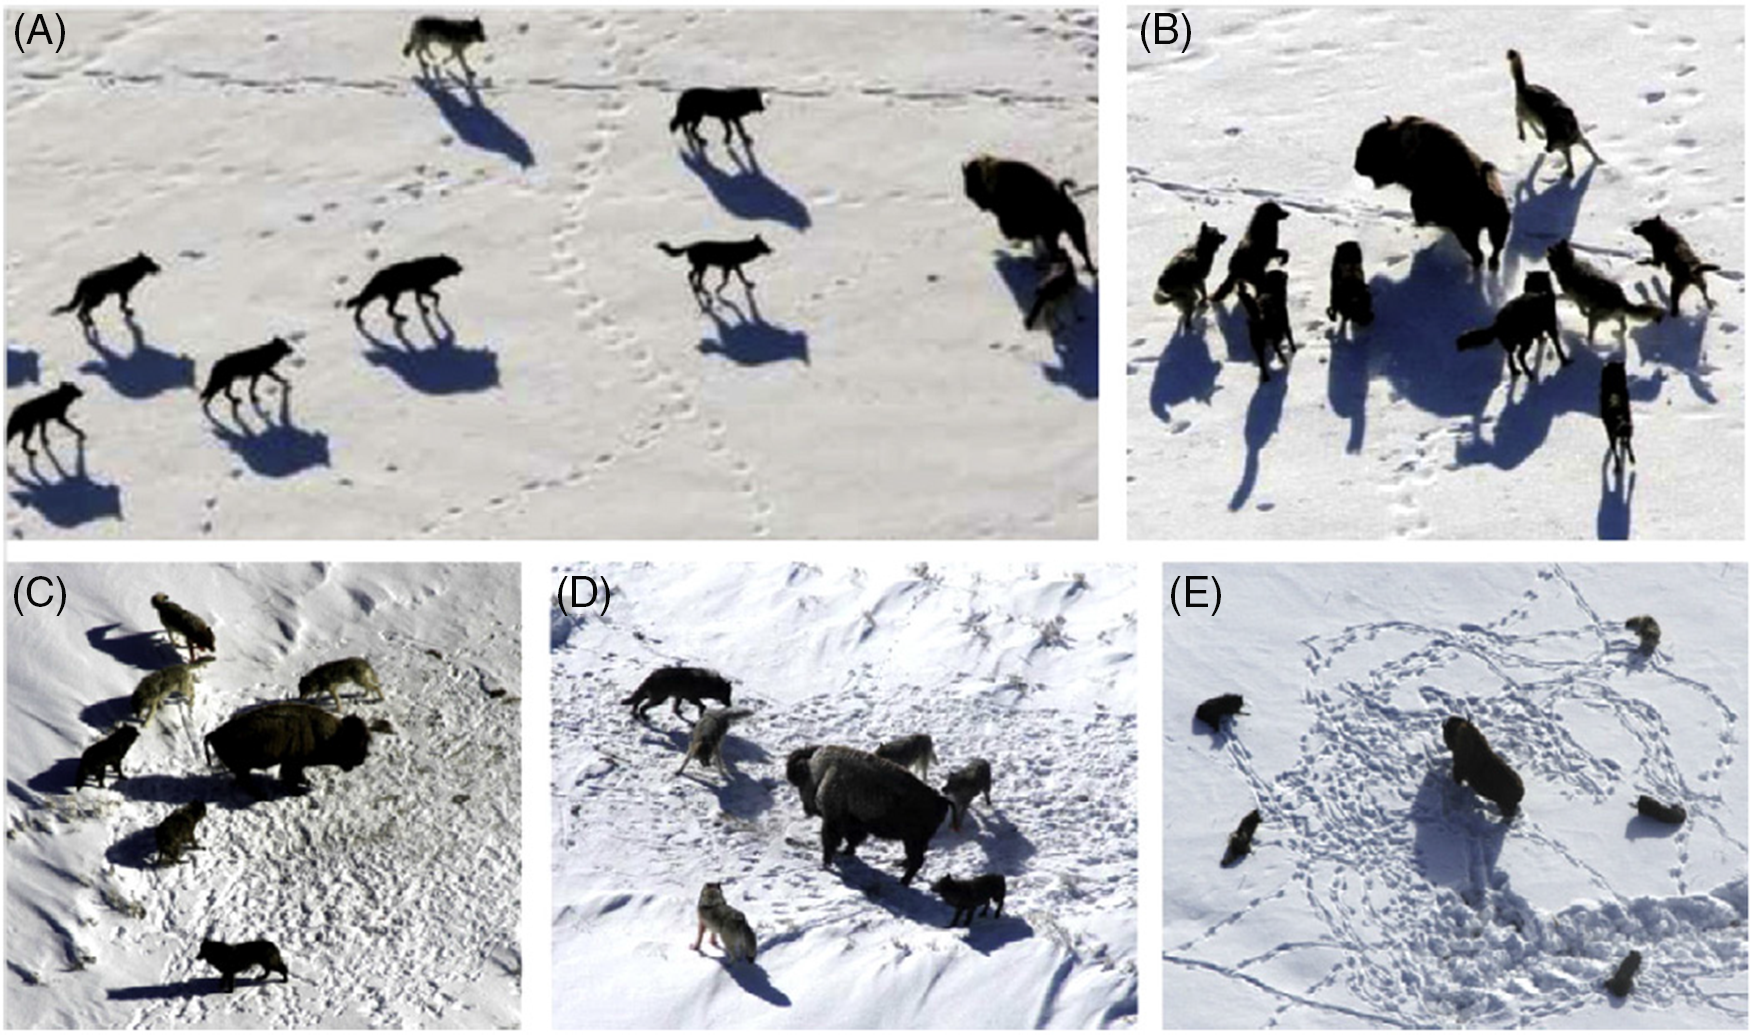
Figure 6: The hunting behavior of grey wolves involves multiple stages. (A) The first stage includes chasing, approaching, and tracking prey. (B–D) Once the prey has been identified, the wolves begin pursuing and harassing it, as shown in B–D. They may also encircle the prey to prevent escape. (E) Finally, when the wolves are stationary, they may attack the prey [27]
This paper suggests a novel binary GWO (EGWO) for the feature selection challenge. Fig. 7 depicts a flowchart of the suggested EGWO. Each grey wolf in the EGWO has a flag vector the same length as the total number of data points. The following equation characterizes the position when a grey wolf’s position is upgraded by (3)–(16).
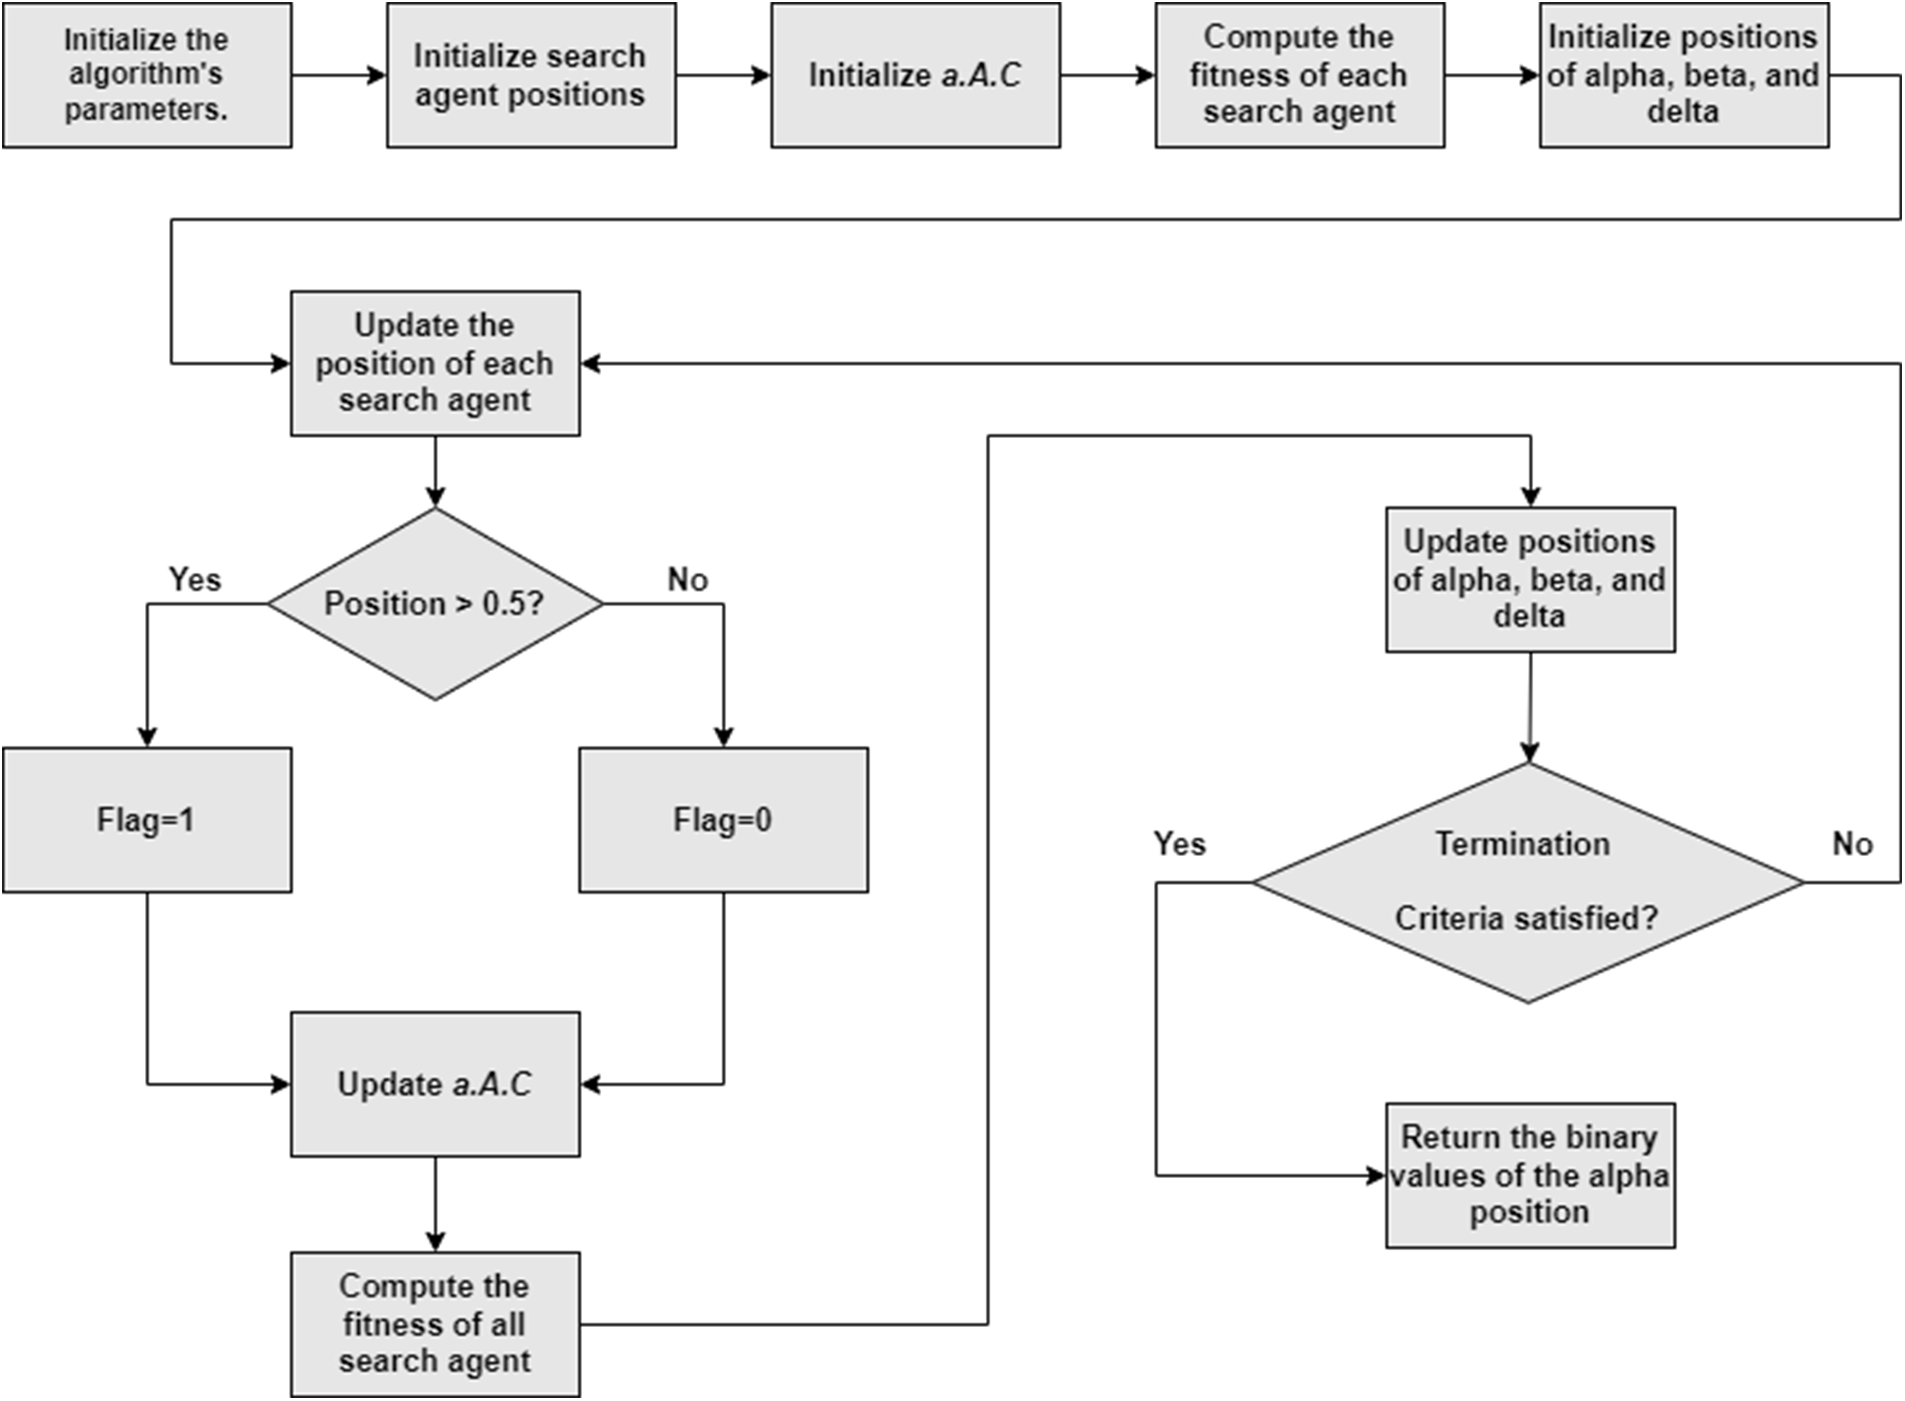
Figure 7: Flowchart of EGWO
where
4.3.2 Support Vector Machine (SVM)
Support Vector Machine (SVM) is a classification approach that leads to improving the generalization capabilities of machine learning by lowering structural risk. The most crucial idea is the maximum margin technique, which can solve a convex quadratic programming issue. SVM has been used in many disciplines because of its superior properties [28–31].
In a binary classification issue, a hyperplane
Following that,
A broad concept of kernel trick is presented in nonlinear circumstances. The decision function, on the other hand, can be stated as follows:
Kernel functions can be any positive semi-definite functions that meet Mercer’s criterion [32], namely the Gaussian kernel
In this section, we will discuss the proposed approach, which is the enhanced gray wolf optimization-support vector machine (EGWO-SVM) method consisting of two main steps. The first step involves the EGWO algorithm, which iteratively searches the feature space to find the best feature combination. In the second step, the SVM uses the best feature subset to predict classification accuracy. The flowchart of the EGWO-SVM approach is shown in Fig. 8. The EGWO algorithm searches for the optimal feature combination by maximizing the classification accuracy while using the minimum number of features. During the 10-fold cross-validation procedure, the fitness function used to evaluate the selected features is the average classification accuracy.
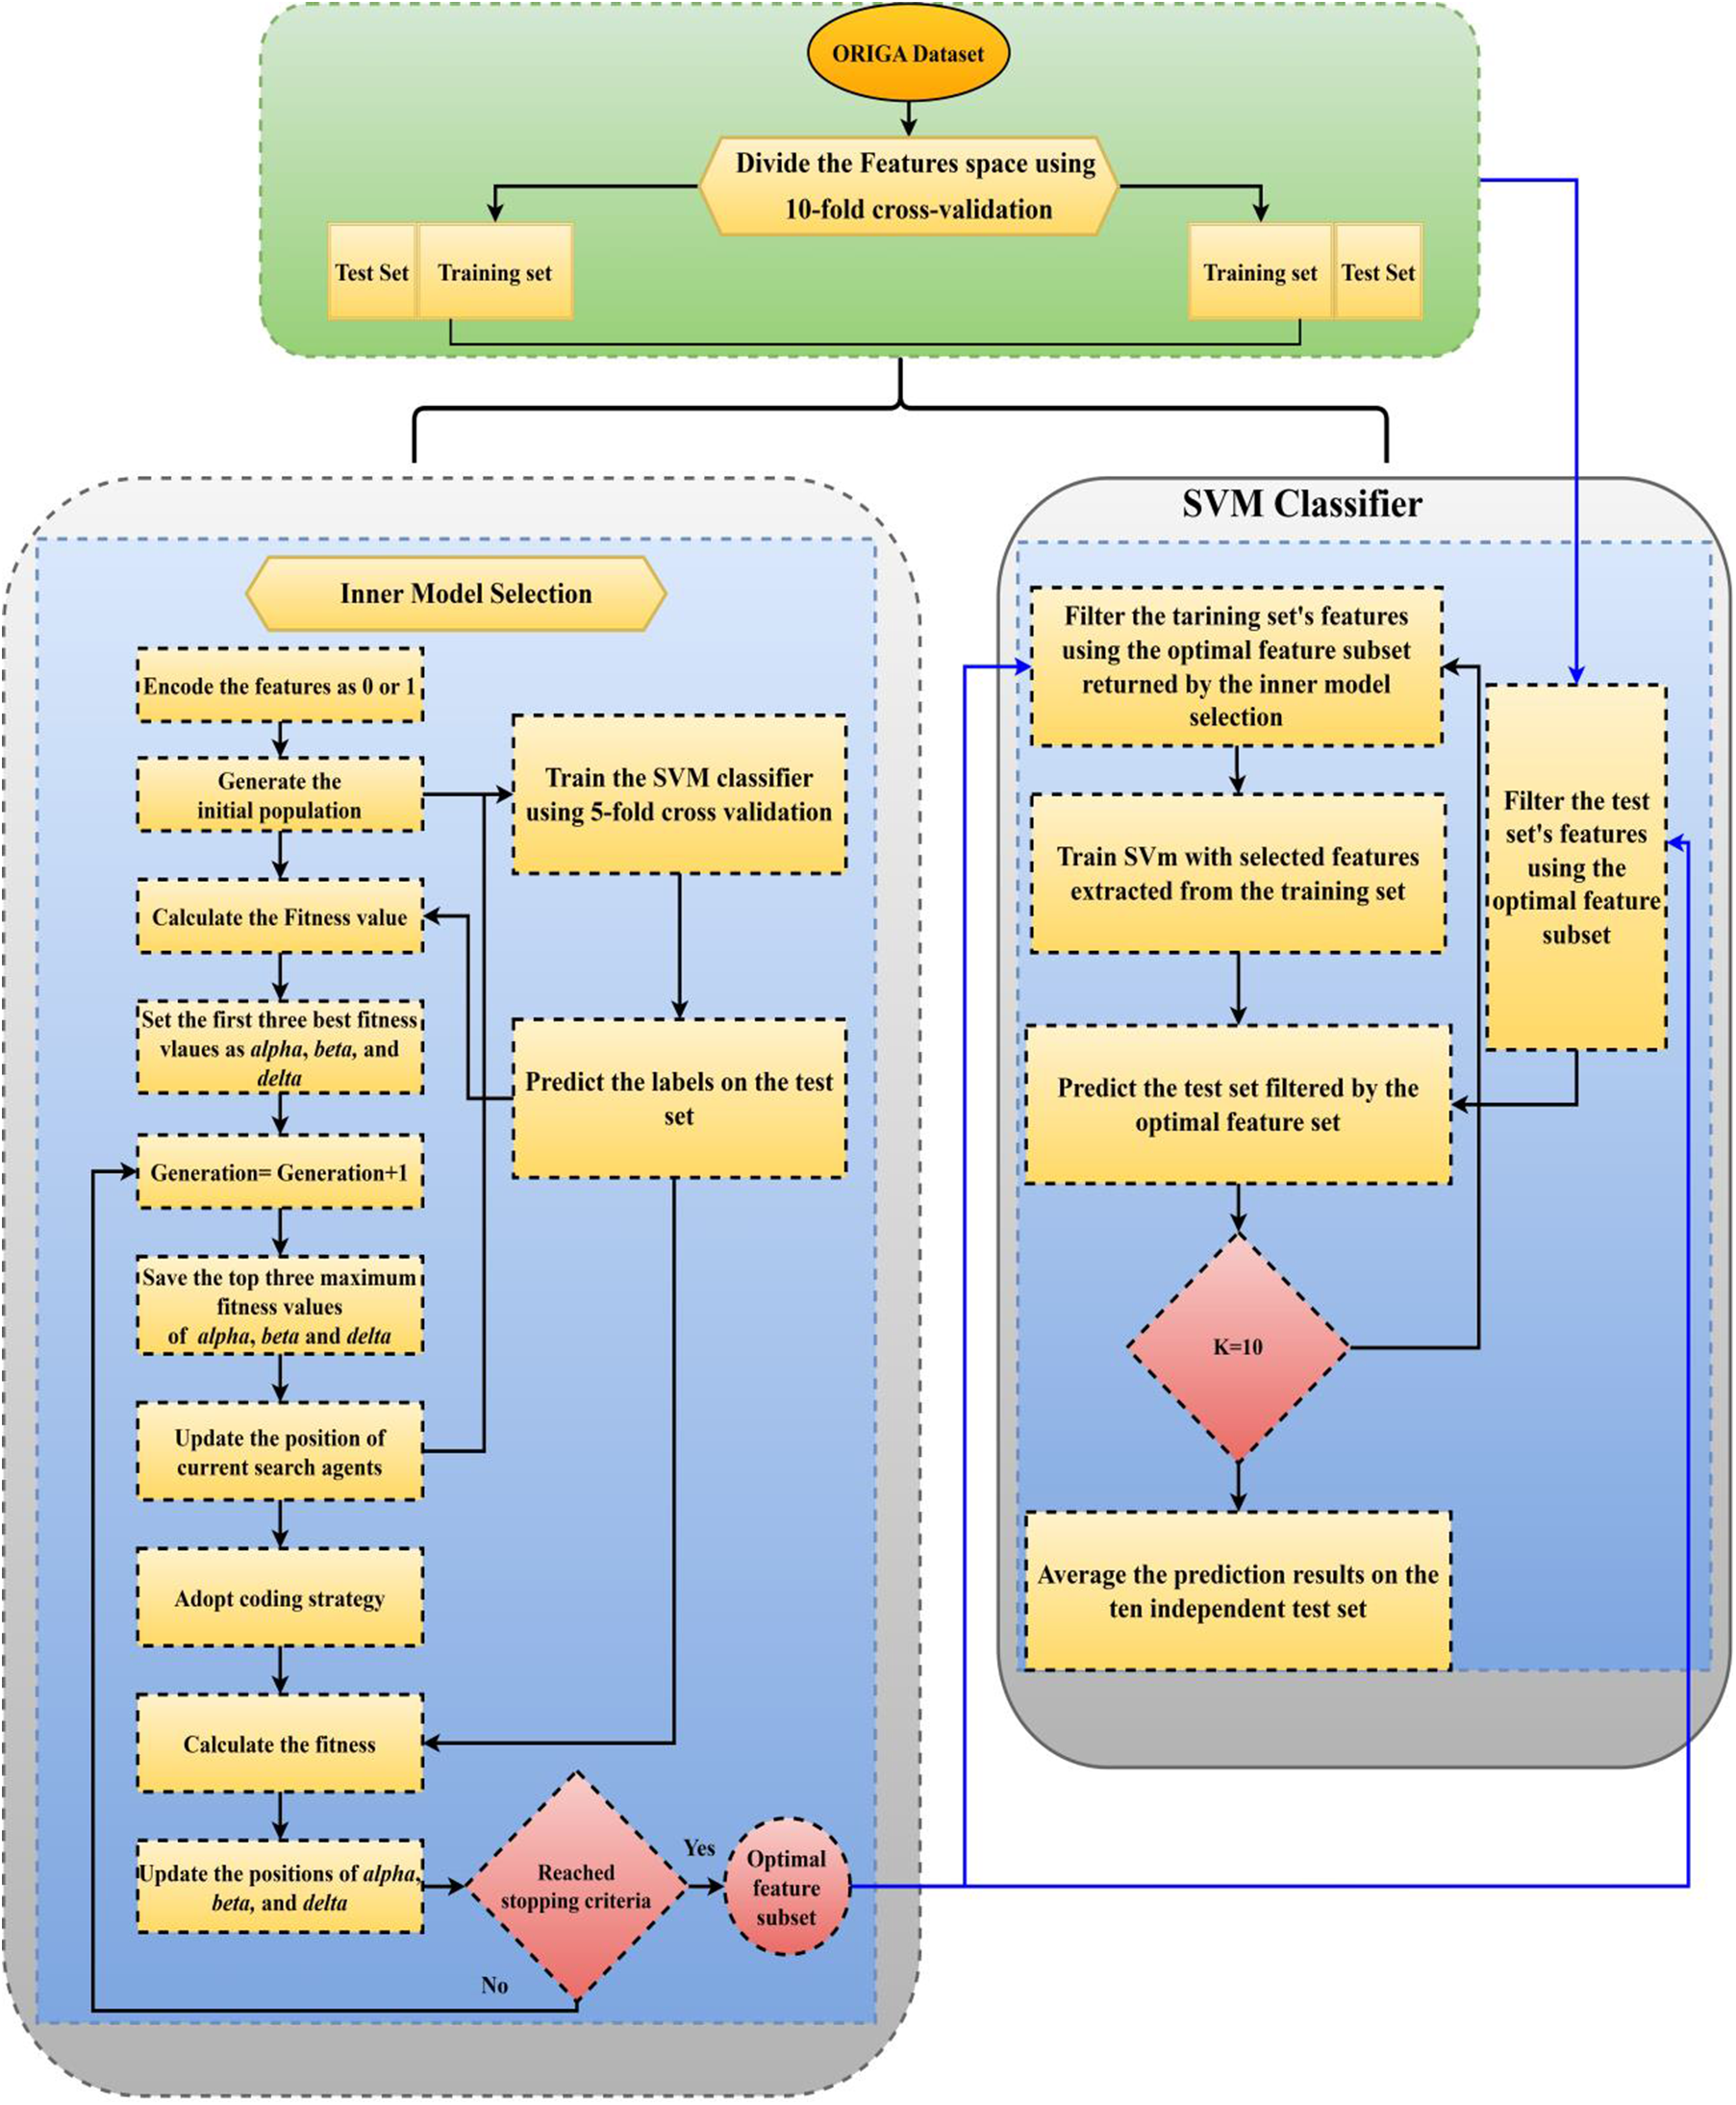
Figure 8: Flowchart of EGWO-SVM
5 Experimental Setup and Designs
ORIGA (Online Retinal Images for Glaucoma Analysis) [33] dataset is commonly used to develop and evaluate algorithms for detecting glaucoma, which can cause vision loss and blindness if left untreated. The dataset includes high-resolution retinal images of both healthy eyes and eyes with glaucoma, along with annotations for the optic disc and cup regions. This dataset comprises 650 retinal fundus images, with 386 images from normal eyes and 264 from glaucomatous eyes. Each image is in JPEG format and has a resolution of 768 × 584 pixels. The images were captured with a Topcon TRC-50DX retinal camera with a 50-degree field view, and ground-truth annotations for the optic disc and cup regions accompany each image. Sample images from the ORIGA dataset are shown in Fig. 9. Moreover, the dataset contains a manually segmented cup and disc for each image, a cup-to-disc ratio (CDR), and labels for glaucomatous and normal images. The ORIGA dataset is a popular choice for glaucoma detection research due to its large size, relatively balanced distribution of positive and negative cases, and the use of independent grading by experienced ophthalmologists, providing trustworthy ground truth for algorithm evaluation. The size and balanced distribution of the dataset contribute to improved robustness and generalizability of the proposed method, while independent grading helps avoid bias in evaluation.
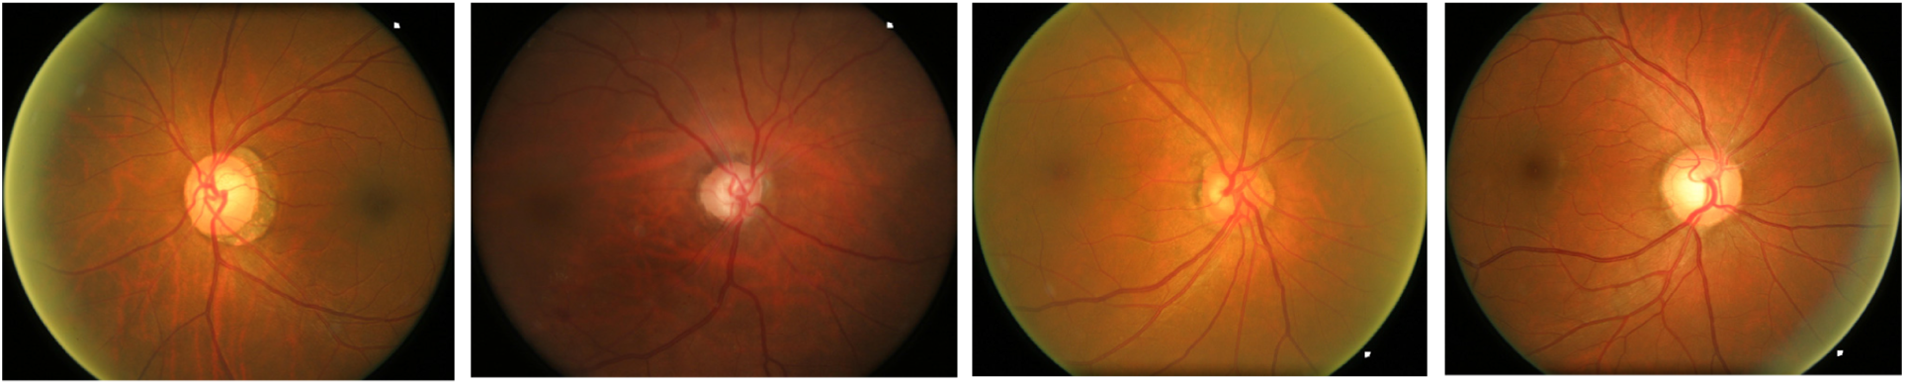
Figure 9: Sample images from the ORIGA dataset
Several approaches were used for robust assessment to validate the suggested strategy, including SVM, NN, NAÏVE BAYES, and EGWO-SVM. SVM was implemented using Chang and Lin’s LIBSVM implementation [34]. Before classification, the data was scaled into the domain [1, 1]. The test was run on a Windows 10 system with 8 GB RAM and an AMD Athlon 64 X2 Dual Core Processor 5000+ (2.6 GHz).
Due to several factors, the proposed approach performed much better than existing methods in detecting the presence or absence of Glaucoma. First, the pre-processing procedure, which involved removing image noise using the Adaptive Median Filter (AMF) and converting the input image to grayscale, helped to improve the quality of the image, making it easier for the feature extraction process. Second, using multiple features, including previously processed SURF, HOG, and Global features, allowed the algorithm to capture a wide range of image characteristics relevant to Glaucoma detection. Finally, using the Enhanced Grey Wolf Optimization (GWO) technique with SVM for classification allowed for optimizing the algorithm parameters, leading to higher accuracy in detecting Glaucoma. Overall, the combination of these factors contributed to the superior performance of the proposed approach compared to existing methods.
The performance analysis of EGWO-SVM is estimated in this section. There are various performance [35] indices to evaluate a model. Performance measures including accuracy, specificity precision, recall, and F-measure, FPR (False Positive Rate), NPV (Negative Predictive Value), FNR (False Negative Rate), MCC (Mathew’s Correlation Coefficient), and FRR (False Rejection Rate) are used to examine and contrast the proposed scheme.
The suggested EGWO-SVM approach differs from existing SVM, Nave Bayes, and NN methods. Fig. 10 depicts the performance measures precision, recall, and F-measure. Table 2 indicates that the existing classifier Nave Bayes performs much worse than all other classifiers. The current SVM classifier prefers the existing Nave Bayes classifier. However, the suggested EGWO-optimized SVM outperforms it. The SVM classifier has good accuracy, recall, and F-Measure values. GWO is used to optimize SVM (i.e., the suggested EGWO-SVM). It outperforms all other classifiers in terms of effectiveness.
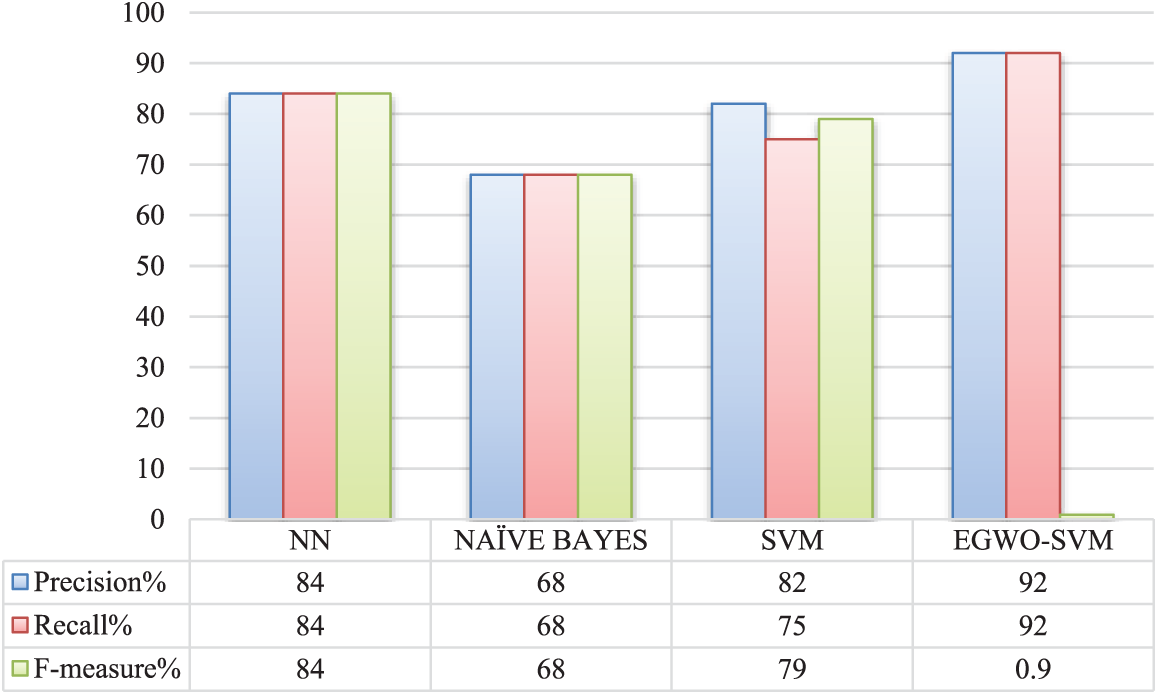
Figure 10: Comparative analysis of various approaches
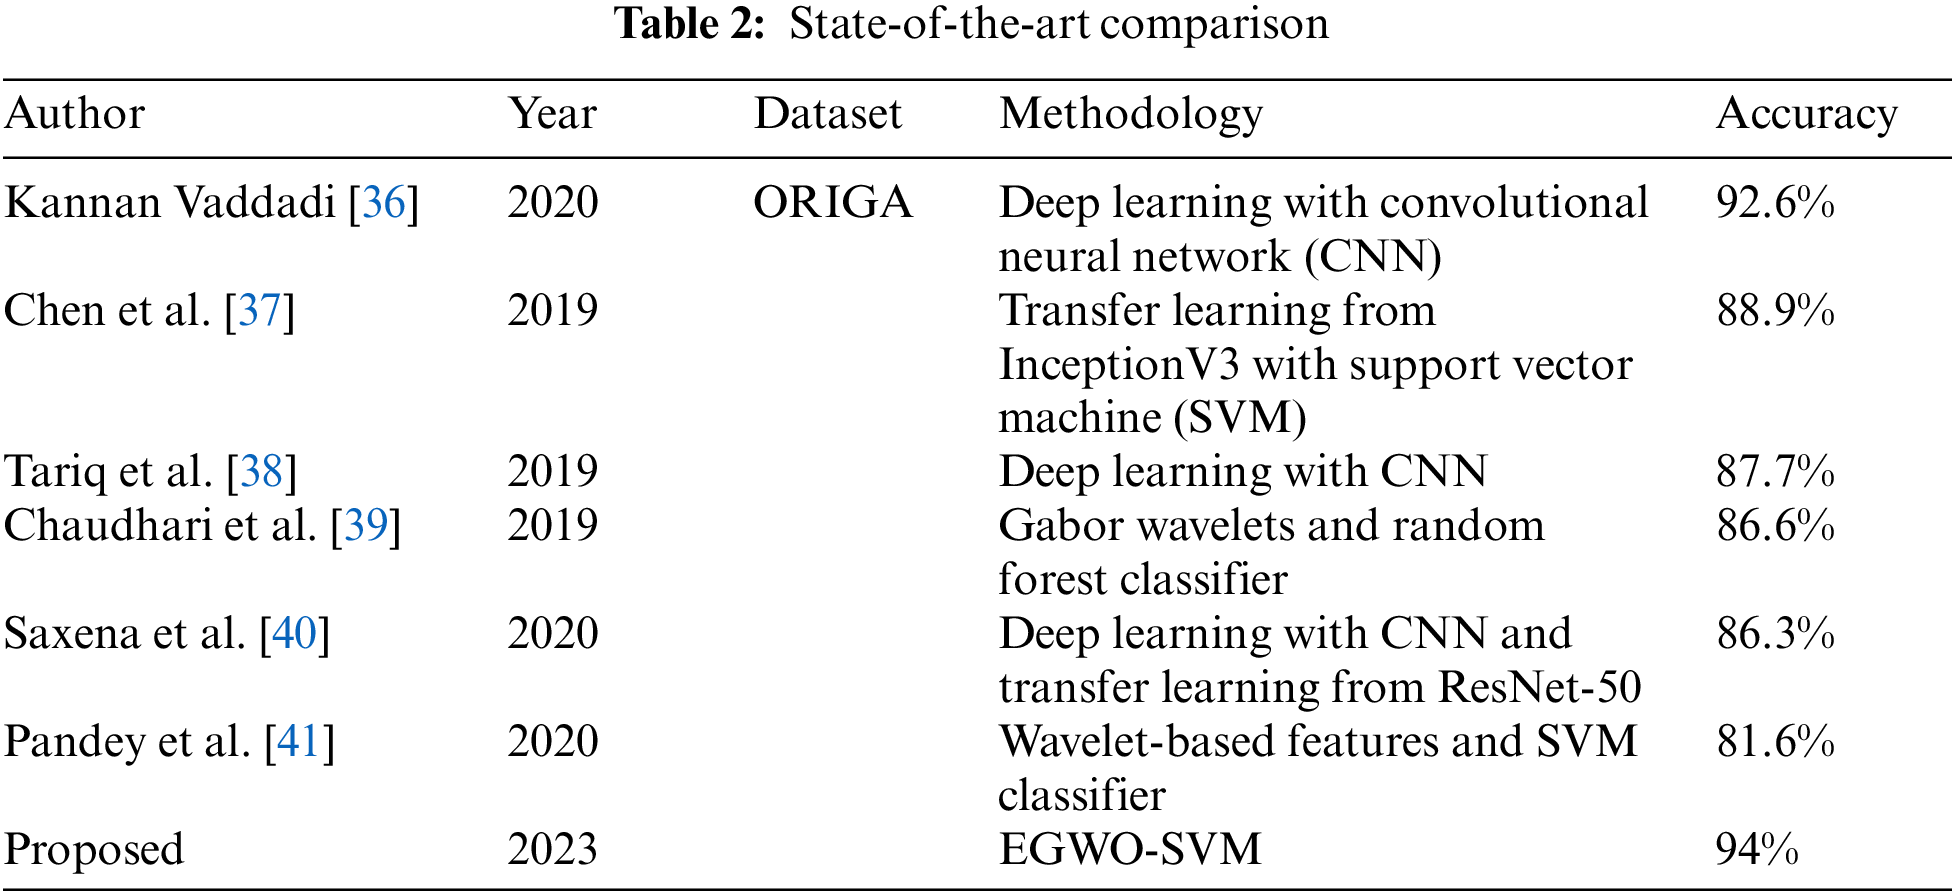
Fig. 11 displays the existing and suggested techniques’ accuracy, sensitivity, and specificity. SVM and NN have almost equal metrics in this scenario. Furthermore, SVM has a smaller sensitivity value than the conventional NN. The suggested EGWO-NN, on the other hand, outperforms the NN in terms of accuracy, specificity, and sensitivity. The conventional Nave Bayes outperforms all other measures evaluated, whereas the suggested EGWO-NN outperforms them all.
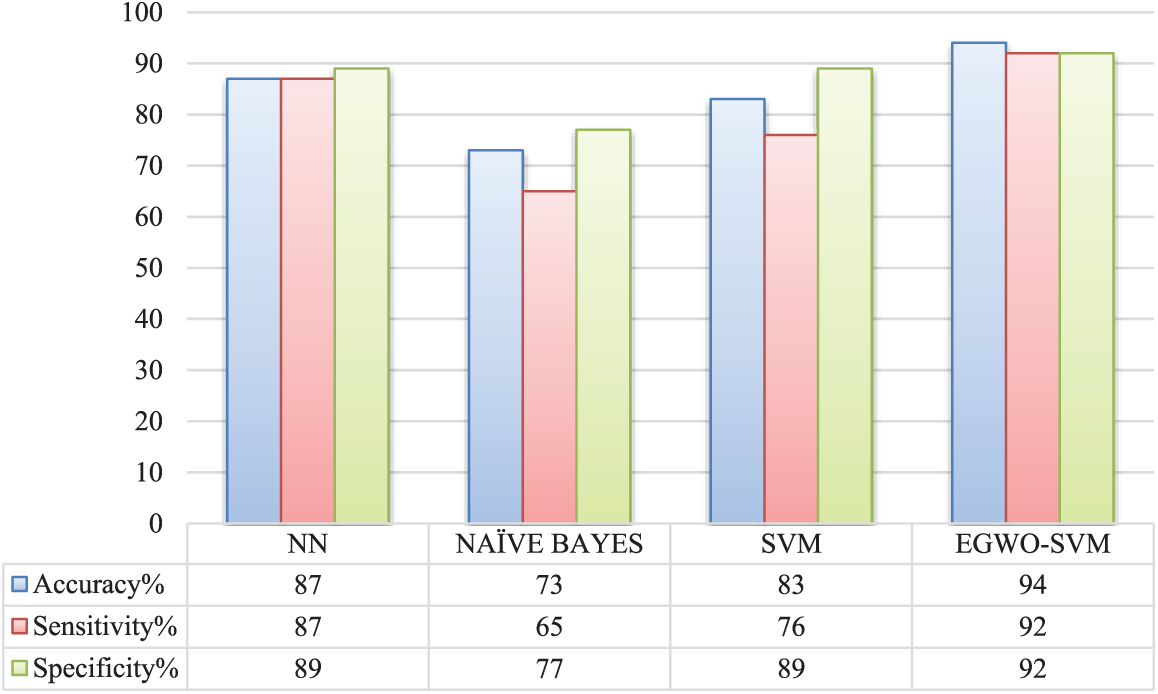
Figure 11: Comparative analysis of various approaches
In terms of NPV and FPR, the performance of SVM is approximately the same. When SVM is optimized using EGWO, NPV, FNR, FPR, FRR, and MCC significantly improves. Nonetheless, the suggested classifier outperforms all previously specified classifiers. Fig. 12 shows the existing and suggested NPV, FNR, FPR, FRR, and MCC techniques. In this scenario, the classifier Nave Bayes performs the worst.
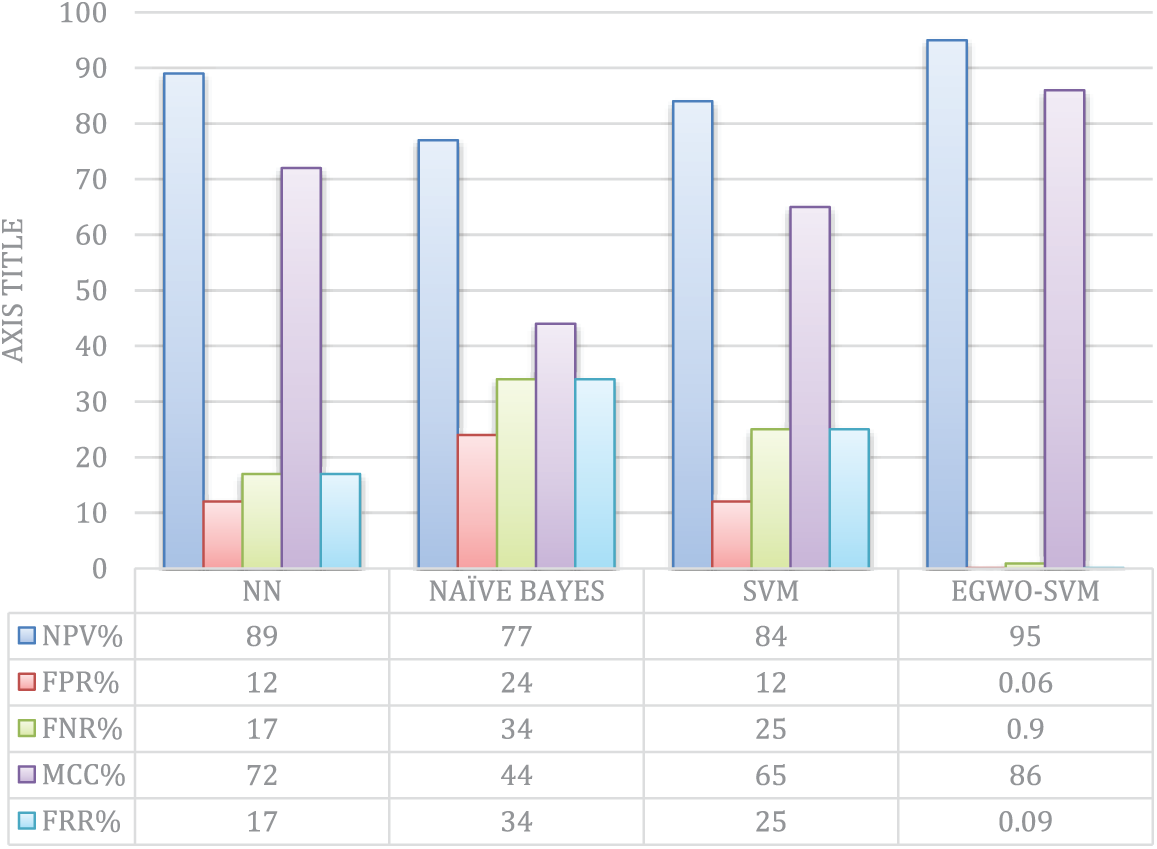
Figure 12: Comparative analysis of NPV, FR, FNR, MCC, and FRR
Table 2 and Fig. 13 show the proposed EGWO-SVM approach accuracy comparison with the state-of-the-art methodologies using the ORIGA dataset.
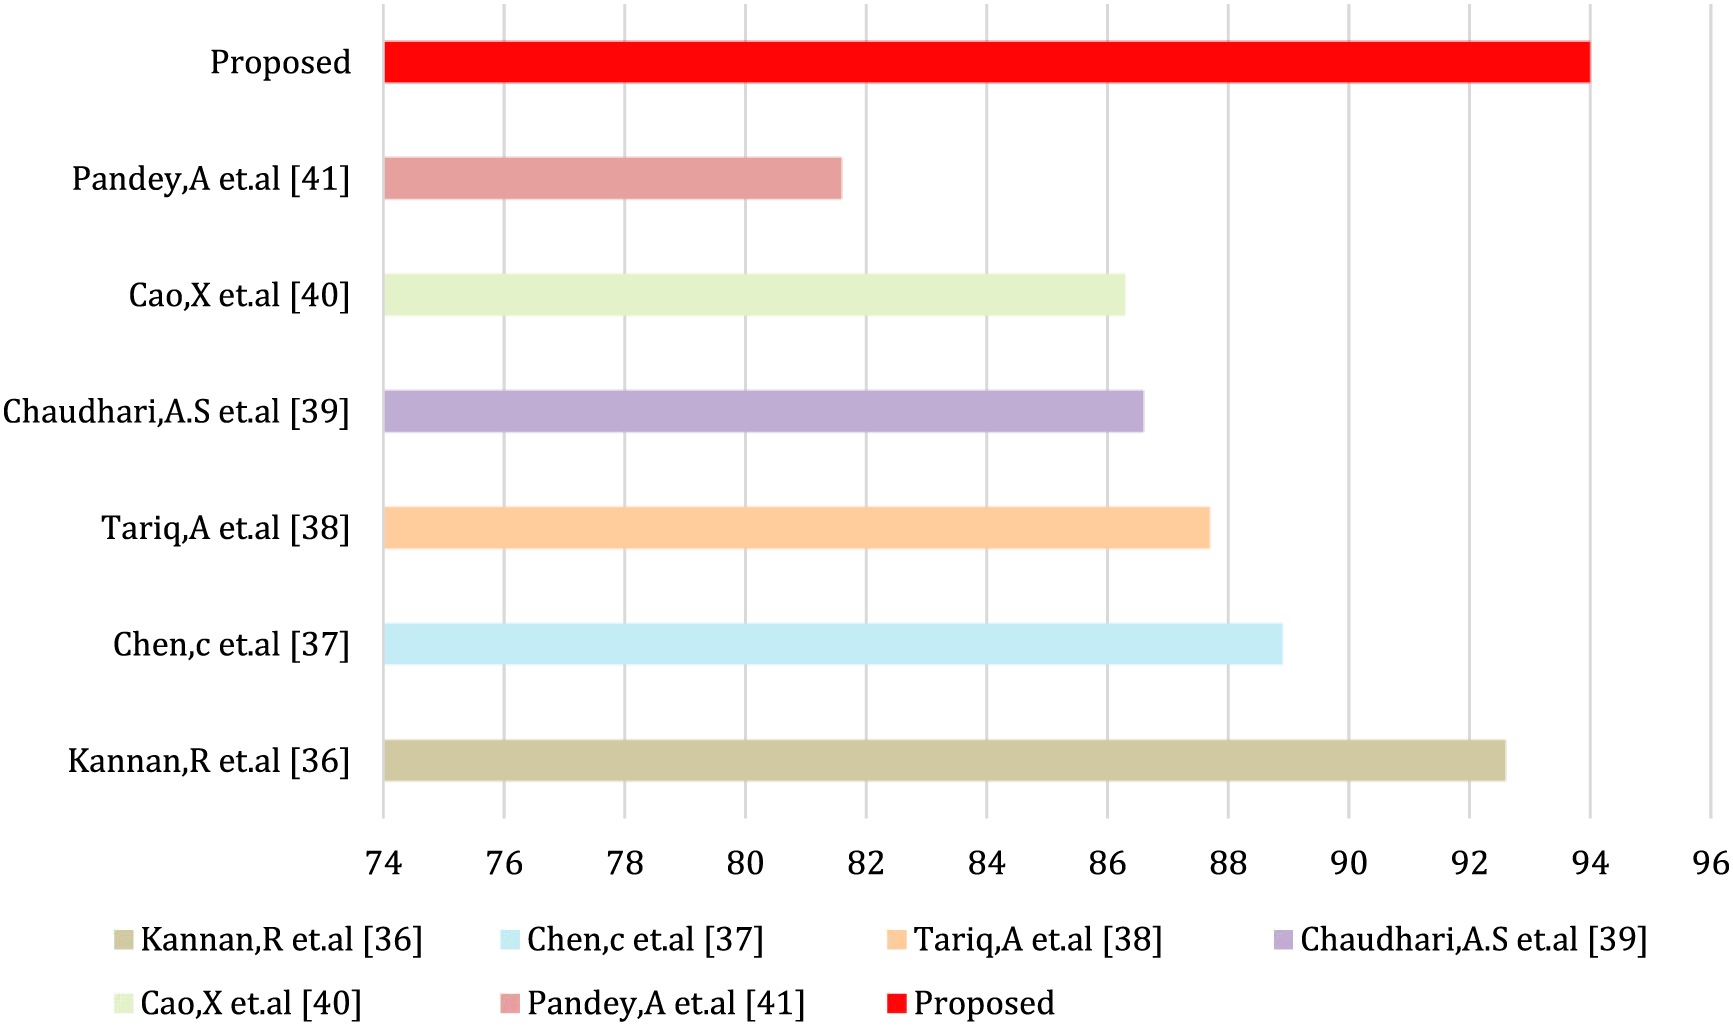
Figure 13: Accuracy comparison
The performance of the suggested EGWO-SVM approach and conventional classifiers such as NN, Nave Bayes, and SVM are equated and examined, and the graph illustrates the findings. Fig. 10 compares and contrasts the suggested and conventional classifiers regarding recall, precision, and F-measure. The suggested EGWO-SVM’s F-measure outperforms the SVM, NN, and Naive Bayes. The conventional SVM and Nave Bayes perform worse than the suggested EGWO-SVM and the existing NN regarding the recall. As a result, the suggested EGWO-SVM acts better. In terms of accuracy, the suggested EGWO-SVM outperforms the competition. As a result, it can be concluded that the suggested approach performs better on the contrasted measures.
Fig. 11 compared and contrasts the current and suggested classifiers’ effectiveness on sensitivity, specificity, and accuracy criteria. Regarding sensitivity, the suggested EGWO-SVM varies from NN, Nave Bayes, and SVM. The suggested EGWO-SVM varies from neural network (NN), Nave Bayes, and SVM in terms of specificity. The suggested EGWO-SVM accuracy varies from NN, Nave Bayes, and SVM. It may be determined from these contrasting values that the suggested IGW-SVM performs better.
Regarding NPV and MCC measures, Fig. 12 illustrates the suggested performance and current classifiers. The current Nave Bayes classifier performs poorly in terms of MCC compared to other classifiers. The traditional SVM and NN are superior at considering the current Nave Bayes model. However, compared to all of the existing approaches, the suggested EGWO-SVM outperforms them all. The NPVs of NN and the proposed EGWO-SVM are almost identical. However, the suggested EGWO-SVM has the optimum showing of all the classification approaches.
Regarding FPR, FNR, and FRR, Fig. 10 shows the suggested performance and current classifiers. According to Figs. 10–12, the Nave Bayes has the largest FPR, FNR, and FRR of all the classifiers, indicating the lowest efficacy. A minor performance is concluded among all the compared classifiers in the current Nave Bayes. The suggested EGWO-SVM has the least values of FPR, FNR, and FRR and shows improved efficiency than the other classifiers.
Early detection and timely treatment are crucial in preventing vision loss and blindness caused by Glaucoma. This study presented an Enhanced Grey Wolf Optimization SVM (EGWO-SVM) approach for detecting Glaucoma in patients. The performance of the proposed method was compared to that of other popular techniques, including Naive Bayes, NN, and SVM, using various measures such as accuracy, precision, recall, F-measure, specificity, sensitivity, NPV, FNR, FPR, FRR, and MCC. The results of the experiments showed that the suggested EGWO-SVM approach was more accurate than other comparable current approaches, such as NN, Naive Bayes, and SVM. Furthermore, the suggested EGWO-F-measure SVM approach outperformed NN, SVM, and Naive Bayes. Additionally, the suggested approach outperformed all of the measures. The limitations of this study include the use of a single dataset and the limited size of the dataset used for testing the proposed algorithm. Future work could involve testing the EGWO-SVM method on larger datasets from different sources to evaluate its generalizability and robustness. Furthermore, further optimization of the algorithm parameters could be explored to improve the accuracy and efficiency of the algorithm. Finally, the feasibility of implementing the proposed method in clinical settings could be studied, considering the potential challenges in integrating such algorithms with current diagnostic tools and workflows in ophthalmology clinics. The proposed approach has the potential to be applied in clinical settings to improve the early detection of Glaucoma and help prevent vision loss and blindness.
Funding Statement: This work is supported in part by the Beijing Natural Science Foundation (No. 4212015), China Ministry of Education-China Mobile Scientific Research Foundation (No. MCM20200102).
Conflicts of Interest: The authors declare no conflicts of interest to report regarding the present study.
References
1. M. C. Staff, “Glaucoma,” 2021. [Online]. Available: https://www.mayoclinic.org/diseases-conditions/glaucoma/symptoms-causes/syc-20372839 [Google Scholar]
2. Y. C. Tham, X. Li, T. Y. Wong, H. A. Quigley, T. Aung et al., “Global prevalence of glaucoma and projections of glaucoma burden through 2040: A systematic review and meta-analysis,” Ophthalmology, vol. 121, no. 11, pp. 2081–2090, 2014. [Google Scholar] [PubMed]
3. A. Bilal, G. Sun, S. Mazhar and Z. Junjie, “Neuro-optimized numerical treatment of HIV infection model,” International Journal of Biomathematics, vol. 14, no. 5, pp. 2150033–2150057, 2021. [Google Scholar]
4. M. A. Haq, I. Khan, A. Ahmed, S. M. Eldin, A. Alshehri et al., “DCNNBT: A novel deep convolution neural network-based brain tumor classification model,” Fractals, 2023. https://doi.org/10.1142/S0218348X23401023 [Google Scholar] [CrossRef]
5. K. K. Kumar, P. M. Dinesh, P. Rayavel, L. Vijayaraja, R. Dhanasekar et al., “Brain tumor identification using data augmentation and transfer learning approach,” Computer Systems Science and Engineering, vol. 46, no. 2, pp. 1845–1861, 2023. [Google Scholar]
6. M. A. Haq, “Planetscope nanosatellites image classification using machine learning,” Computer Systems Science and Engineering, vol. 42, no. 3, pp. 1031–1046, 2022. [Google Scholar]
7. M. A. Haq, “VNN based automated weed detection system using UAV imagery,” Computer Systems Science and Engineering, vol. 42, no. 2, pp. 837–849, 2021. [Google Scholar]
8. P. S. Grewal, F. Oloumi, U. Rubin and M. T. S. Tennant, “Deep learning in ophthalmology: A review,” Canadian Journal of Ophthalmology, vol. 53, no. 4, pp. 309–313, 2018. [Google Scholar] [PubMed]
9. A. Bilal, G. Sun, Y. Li, S. Mazhar and A. Q. Khan, “Diabetic retinopathy detection and classification using mixed models for a disease grading database,” IEEE Access, vol. 9, pp. 23544–23553, 2021. [Google Scholar]
10. F. Heydarpoor, S. M. Karbassi, N. Bidabadi and M. J. Ebadi, “Solving multi-objective functions for cancer treatment by using metaheuristic algorithms,” Algorithms, vol. 11, no. 3, pp. 22–32, 2020. [Google Scholar]
11. D. M. S. Barros, J. C. C. Moura, C. R. Freire, A. C. Taleb, R. A. M. Valentim et al., “Machine learning applied to retinal image processing for glaucoma detection: Review and perspective,” BioMedical Engineering Online, vol. 19, no. 1, pp. 1–21, 2020. [Google Scholar]
12. J. Latif, S. Tu, C. Xiao, S. U. Rehman and A. Imran, “ODGNet: A deep learning model for automated optic disc localization and glaucoma classification using fundus images,” SN Applied Sciences, vol. 4, no. 98, pp. 98–109, 2022. [Google Scholar]
13. L. Li, M. Xu, H. Liu, Y. Li, X. Wang et al., “A large-scale database and a CNN model for attention-based glaucoma detection,” IEEE Transactions on Medical Imaging, vol. 39, no. 2, pp. 413–424, 2020. [Google Scholar] [PubMed]
14. W. T. Song, I. C. Lai and Y. Z. Su, “A statistical robust glaucoma detection framework combining retinex, CNN, and DOE using fundus images,” IEEE Access, vol. 9, pp. 103772–103783, 2021. [Google Scholar]
15. D. Parashar and D. Agrawal, “2-D compact variational mode decomposition-based automatic classification of glaucoma stages from fundus images,” IEEE Transactions on Instrumentation and Measurement, vol. 70, pp. 1–10, 2021. [Google Scholar]
16. D. Parashar and D. K. Agrawal, “Automatic classification of glaucoma stages using two-dimensional tensor empirical wavelet transform,” IEEE Signal Processing Letters, vol. 28, pp. 66–70, 2021. [Google Scholar]
17. J. Pruthi, K. Khanna and S. Arora, “Optic cup segmentation from retinal fundus images using glowworm swarm optimization for glaucoma detection,” Biomedical Signal Processing and Control, vol. 60, no. 2, pp. 102004, 2020. [Google Scholar]
18. A. Septiarini, A. Harjoko, R. Pulungan and R. Ekantini, “Optic disc and cup segmentation by automatic thresholding with morphological operation for glaucoma evaluation,” Signal, Image and Video Processing, vol. 11, no. 5, pp. 945–952, 2017. [Google Scholar]
19. M. Juneja, S. Singh, N. Agarwal, S. Bali, S. Gupta et al., “Automated detection of glaucoma using deep learning convolution network (G-net),” Multimedia Tools and Applications, vol. 79, no. 21–22, pp. 15531–15553, 2020. [Google Scholar]
20. M. Juneja, S. Thakur, A. Wani, A. Uniyal, N. Thakur et al., “DC-Gnet for detection of glaucoma in retinal fundus imaging,” Machine Vision and Applications, vol. 31, no. 5, pp. 1–4, 2020. [Google Scholar]
21. L. Abdel-Hamid, “Glaucoma detection from retinal images using statistical and textural wavelet features,” Journal of Digital Imaging, vol. 33, no. 1, pp. 151–158, 2020. [Google Scholar] [PubMed]
22. A. Bilal, G. Sun, S. Mazhar and A. Imran, “Improved grey wolf optimization-based feature selection and classification using CNN for diabetic retinopathy detection,” Lecture Notes on Data Engineering and Communications Technologies, vol. 116, pp. 1–14, 2022. [Google Scholar]
23. A. Bilal, M. Shafiq, F. Fang, M. Waqar, I. Ullah et al., “IGWO-IVNET3: Dl-based automatic diagnosis of lung nodules using an improved gray wolf optimization and inception net-V3,” Sensors, vol. 22, no. 24, pp. 9603–9629, 2022. [Google Scholar] [PubMed]
24. S. Tu, S. U. Rehman, M. Waqas, O. U. Rehman, Z. Shah et al., “ModPSO-CNN: An evolutionary convolution neural network with application to visual recognition,” Soft Computing, vol. 25, no. 3, pp. 1–12, 2021. [Google Scholar]
25. M. B. Anand, N. Karthikeyan and S. Karthik, “Designing a framework for communal software: Based on the assessment using relation modeling,” International Journal of Parallel Programming, vol. 48, no. 2, pp. 329–343, 2020. [Google Scholar]
26. S. Mirjalili, S. M. Mirjalili and A. Lewis, “Grey wolf optimizer,” Advances in Engineering Software, vol. 69, pp. 46–61, 2014. [Google Scholar]
27. C. Muro, R. Escobedo, L. Spector and R. P. Coppinger, “Wolf-pack (Canis lupus) hunting strategies emerge from simple rules in computational simulations,” Behavioural Processes, vol. 88, no. 3, pp. 192–197, 2011. [Google Scholar] [PubMed]
28. H. L. Chen, B. Yang, J. Liu and D. Y. Liu, “A support vector machine classifier with rough set-based feature selection for breast cancer diagnosis,” Expert Systems with Applications, vol. 38, no. 7, pp. 10737–10750, 2011. [Google Scholar]
29. H. L. Chen, D. Y. Liu, B. Yang, J. Liu and G. Wang, “A new hybrid method based on local fisher discriminant analysis and support vector machines for hepatitis disease diagnosis,” Expert Systems with Applications, vol. 38, no. 9, pp. 11796–117803, 2011. [Google Scholar]
30. L. Shen, H. Chen, Z. Yu, W. Kang, B. Zhang et al., “Evolving support vector machines using fruit fly optimization for medical data classification,” Knowledge-Based Systems, vol. 96, no. 3, pp. 61–75, 2016. [Google Scholar]
31. J. Mourão-Miranda, A. L. W. Bokde, C. Born, H. Hampel and M. Stetter, “Classifying brain states and determining the discriminating activation patterns: Support vector machine on functional MRI data,” Neuroimage, vol. 28, no. 4, pp. 980–998, 2005. [Google Scholar]
32. B. Schölkopf, C. J. C. Burges and A. J. Smola, “Kernal principal component analysis,” in Advances in Kernel Methods: Support Vector Learning, London, England: The MIT Press, chapter no. 20, 327–337, 1998. [Google Scholar]
33. Z. Zhang, F. S. Yin, J. Liu, W. K. Wong, NM. Tan et al., “ORIGA-light: An online retinal fundus image database for glaucoma analysis and research,” in Proc. Int. Conf. of the IEEE Engineering in Medicine and Biology (EMBC), Buenos Aires, Argentina, pp. 3065–3068, 2010. [Google Scholar]
34. C. C. Chang and C. J. Lin, “LIBSVM: A library for support vector machines,” ACM Transactions on Intelligent Systems and Technology, vol. 2, no. 3, pp. 1–27, 2011. [Google Scholar]
35. E. Hossain, M. A. U. Shariff, M. S. Hossain and K. Andersson, “A novel deep learning approach to predict air quality index,” in Proc. Int. Conf. on Trends in Computational and Cognitive Engineering (TCCE), Dhaka, Bangladesh, pp. 15–25, 2021. [Google Scholar]
36. K. R. Kannan Vaddadi, “Glaucoma detection using deep learning neural network on optic cup segmentation and cup-to-disc ratios,” International Journal of Ophthalmol, vol. 13, no. 11, pp. 1717–1723, 2020. [Google Scholar]
37. X. Chen, X. Zhang, M. Zhang and C. Wang, “Glaucoma detection using transfer learning from inceptionV3 for feature extraction,” Journal of Medical Imaging and Health Informatics, vol. 9, no. 8, pp. 1667–1671, 2019. [Google Scholar]
38. M. Tariq, A. Abdin, S. Azharuddin and M. Sharma, “Automated glaucoma detection using deep neural networks,” International Journal of Advance Computing Science Applications, vol. 10, no. 8, pp. 188–195, 2019. [Google Scholar]
39. K. M. Chaudhari and A. S. Desai, “An automated diagnosis of glaucoma using machine learning and image processing techniques,” International Journal of Computer Applications, vol. 186, no. 5, pp. 7–14, 2019. [Google Scholar]
40. A. Saxena, A. Vyas, L. Parashar and U. Singh, “A glaucoma detection using convolutional neural network,” in Proc. Int. Conf. on Electronics and Sustainable Communication Systems (ICESC), Coimbatore, India, pp. 815–820, 2020. [Google Scholar]
41. S. Pandey and A. K. Ghosh, “Automated glaucoma detection based on retinal fundus images using texture and color features,” Journal of Medical Systems, vol. 9, no. 11, pp. 132–145, 2020. [Google Scholar]
Cite This Article
 Copyright © 2023 The Author(s). Published by Tech Science Press.
This work is licensed under a Creative Commons Attribution 4.0 International License , which permits unrestricted use, distribution, and reproduction in any medium, provided the original work is properly cited.
 Downloads
 Citation Tools