
 Submit a Paper
 Propose a Special lssue
 Open Access
ARTICLE
An Incentive Mechanism Model for Crowdsensing with Distributed Storage in Smart Cities
State Key Laboratory of Networking and Switching Technology, Beijing University of Posts and Telecommunications, Beijing, China
* Corresponding Author: Yang Yang. Email:
Computers, Materials & Continua 2023, 76(2), 2355-2384. https://doi.org/10.32604/cmc.2023.034993
Received 03 August 2022; Accepted 10 May 2023; Issue published 30 August 2023
 View Full Text
 Download PDF
Abstract
Crowdsensing, as a data collection method that uses the mobile sensing ability of many users to help the public collect and extract useful information, has received extensive attention in data collection. Since crowdsensing relies on user equipment to consume resources to obtain information, and the quality and distribution of user equipment are uneven, crowdsensing has problems such as low participation enthusiasm of participants and low quality of collected data, which affects the widespread use of crowdsensing. This paper proposes to apply the blockchain to crowdsensing and solve the above challenges by utilizing the characteristics of the blockchain, such as immutability and openness. An architecture for constructing a crowd-sensing incentive mechanism under distributed incentives is proposed. A multi-attribute auction algorithm and a k-nearest neighbor-based sensing data quality determination algorithm are proposed to support the architecture. Participating users upload data, determine data quality according to the algorithm, update user reputation, and realize the selection of perceived data. The process of screening data and updating reputation value is realized by smart contracts, which ensures that the information cannot be tampered with, thereby encouraging more users to participate. Results of the simulation show that using two algorithms can well reflect data quality and screen out malicious data. With the help of blockchain performance, the architecture and algorithm can achieve decentralized storage and tamper-proof information, which helps to motivate more users to participate in perception tasks and improve data quality.Keywords
In recent years, crowdsensing has been widely used in the industrial internet, smart cities, and smart healthcare. Among them, the smart city integrates the core information of city operation utilizing information technology, realizes intelligent response to various demands within the city, and realizes intelligent management and operation of the city. In the wake of developments in smart cities, the future smart city should realize the management of diverse resources by people in the city [1], so crowdsensing technology has started to be widely mentioned in the development of smart cities. In contrast to traditional sensor networks, crowdsensing aims to use many ordinary users and their mobile devices to achieve large-scale social sensing tasks, which leads to an earlier concept—crowdsourcing. Crowdsourcing refers to the formation of interactive, participatory sensing networks through people’s existing mobile devices, where sensing tasks are posted to individuals or groups in the network for completion, thus helping professionals or the public to collect data, analyze information, and share knowledge [2]. Crowdsourcing is a specific model of resource acquisition. An individual or organization can use many networked users to get access to the services and ideas they need. It is also a distributed model for problem-solving [3]. For example, as shown in Fig. 1, in a temperature measurement scenario, people use the idea of crowdsourcing to assign the task of measuring temperatures in various locations to different people to complete, using the power of a broad public to achieve data collection and thus quickly obtain the large amount of temperature data needed.
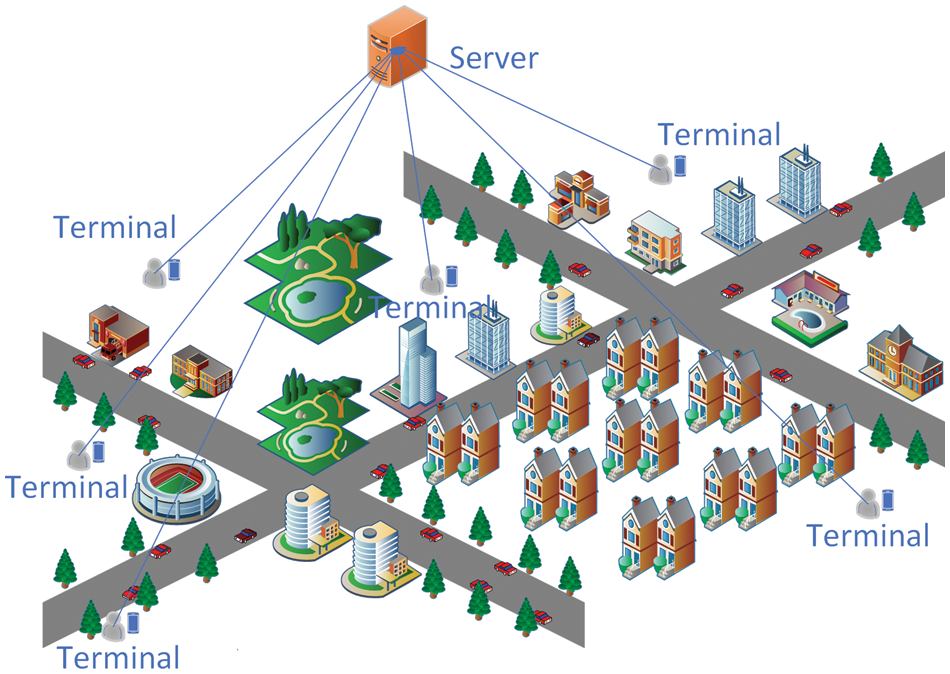
Figure 1: Temperature measurement in crowdsensing
Abroad, the first relevant concept to emerge was participatory sensing by Burke et al. [4], an interactive, participatory sensor network that allows everyday mobile devices to form, enabling the public and professional users to collect, analyze and share local knowledge. Ganti first proposed the concept of mobile crowdsensing [5], which provides sensing data to the internet at a social level with the help of devices. He proposed that mobile crowdsensing devices could be used to detect urban congestion and environmental pollution. The concept of crowdsensing was then systematically described for the first time in China by Professor Liu Yunhao, who proposed that data quality management is the key to the success or failure of crowdsensing applications [6]. Wu et al. [7] introduced a typical architecture for crowdsensing, as shown in Fig. 2. Data users assign their published sensing tasks to task participants via a server in the cloud. Task participants choose by themselves or are assigned by the server to obtain sensing tasks. According to the task requirements, task participants collect sensing data and upload the collected sensing data. Then the server screens data through different algorithms and methods and feeds valuable data back to data users.
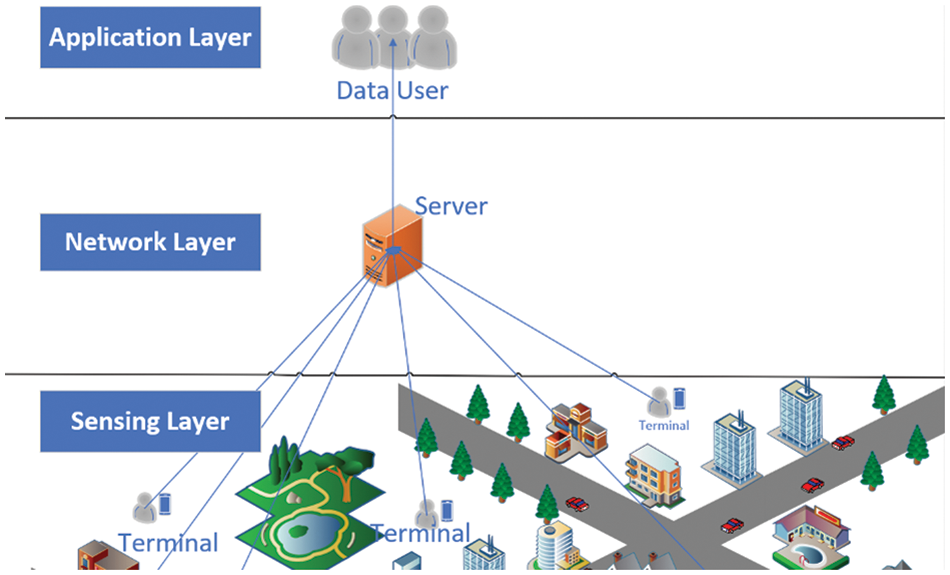
Figure 2: Crowdsensing model
Currently, crowdsensing is in a rapid stage of development and is receiving much attention in the field of applications and research, which can help data users quickly collect a sufficient amount of high-quality, authentic, and reliable data. In water quality monitoring, there is the mobile application Creek Watch [8], developed by International Business Machines Corporation (IBM) in the USA, where users use their mobile phones to help collect information about waterways to help projects about water management. There have also been many studies in environmental detection, such as Common Sense [9] which uses handheld air quality sensors to collect air pollution data and analyze and visualize it for publication, and Hu et al. [10] who proposed BlueAer, a fine-grained urban PM2.5 3D monitoring system using crowdsensing. In addition to this, W-Air [11], an accurate personal multi-pollutant monitoring platform for wearable devices, obtains high-quality environmental pollutant data with reduced human interference. For noise data collection, Maisonneuve et al. proposed NoiseTube [12], a mobile phone noise monitoring program that uses mobile phones as noise sensors, enabling citizens to share their geographic location with their noise exposure in their daily environment, resulting in a collective noise map. Also, in China, Wu et al. [13] used participants’ smartphones as collection terminals and calculated the decibel values of the collected sounds in a system that used a data sampling and compression method based on compressed sensing to guarantee the accuracy of the generated noise maps. In addition to environmental detection, crowdsensing is widely used in other areas. An example is detecting traffic congestion conditions with the help of vehicles [14]. Designing BikeNet [15] calculates the most suitable route for cycling movements with the help of a mobile sensing system based on the personal, bicycle, and environmental sensing of a bicycle area network. UbiGreen [16] is applied to track users’ green trips and capture their travel habits and willingness to participate in and maintain green trips.
However, in the actual temperature data collection process, users are less motivated to participate in sensing tasks because of the cost they have to pay to complete them, which can result in insufficient data due to insufficient participants. In addition to this, another challenge faced by crowdsensing is the quality of the data. The analysis of temperatures in different areas relies on real measured temperature data. Due to the differences in the equipment the users use to collect and upload the data, there is no way to determine whether the temperature data uploaded is authentic and reliable.
In order to solve the problems of insufficient participating users and low data quality in crowdsensing, we need to design and use appropriate optimization methods to ensure decentralization of reward distribution, reliability, and data invariance, thus improving the reliability of the crowdsensing system. Then we can attract more users to the task and facilitate the acquisition of high-quality data [17]. That is why we have introduced the concept of blockchain based on the traditional crowdsensing network. A blockchain is a relatively particular distributed database whose primary function is to store information. Anyone can set up a server and join the blockchain network as a node. The blockchain is a distributed one, so there is no central node, and information is stored between all the nodes that join the blockchain network, each node being equal and keeping the entire database [18]. The characteristics of blockchain are decentralized, openness, autonomy, and the immutability of information.
Currently, many experts and scholars focus on the application of blockchain in crowdsensing. Arafeh et al. [19] proposed a Blockchain-based hybrid architecture for detecting and preventing fake sensing activities in MSC fake sensing activities in MCS. This architecture implements the process of crowdsensing on the blockchain and introduces new actors to achieve the collection of data information and guarantee data quality. However, this method collects a large amount of data on the chain, affecting the blockchain’s scalability. At the same time, it may result in low participation of crowdsensing users because it only focuses on the quality of information collected. The adaptability of this method could be improved. Besides, Huang et al. [20] proposed a blockchain-based crowdsensing system (BCS), which introduces a decentralized blockchain system and focuses on the anonymity and privacy protection of the crowdsensing system. However, the study stayed on the architectural research and needed to propose a suitable implementable algorithm to support the architecture. In addition, Wei et al. [21] addressed improving the incentive mechanism. They proposed a decentralized crowdsensing architecture based on blockchain technology which will help improve attack resistance by encouraging participants to contribute their sensing data through a hybrid incentive mechanism while discouraging malicious behavior. The study proposes a combination of blockchain and the incentive mechanism, but the judgment of data quality needs to be addressed. This paper addresses the shortcomings of the above study for improvement.
Therefore, we apply the blockchain network to the crowdsensing incentive mechanism. The multi-node and decentralized characteristics of the blockchain network can effectively reduce the impact of the high centralization of the traditional crowdsensing model [22] on the credibility of data quality. In addition, this paper presents the algorithm to implement the mechanism. The algorithm designs help select the winning bidder, and simulation experiments verify the algorithm’s feasibility. Therefore, the main contributions of this paper are:
• Propose a blockchain-based crowdsensing of distributed incentive architecture, which includes three parts: user, platform, and blockchain. The platform is responsible for issuing tasks and receiving data. The user participates in the task and uploads the sensing data uploaded by the platform to the blockchain to complete the screening and storage of the sensing data, update the reputation value, and issue the rewards. The architecture uses the characteristics of the blockchain to realize the authenticity and reliability of the reputation value and reward distribution.
• Propose a multi-attribute auction model, which completes the data screening process on the blockchain, uses multiple attributes to calculate the utility value and performs preliminary screening the data based on the data utility value. The model can effectively improve the quality of data and can help achieve high-quality sensing data at a low cost.
• Propose a KNN-based data selection and reputation update algorithm. The algorithm uses the idea of KNN to compare the similarity of adjacent data, avoid malicious forgery by users, and ensure the authenticity and reliability of data. Moreover, updating the user reputation value according to the quality of the provided data can help quickly filter out malicious data and improve data quality.
The remainder of the article describes below. This paper introduces the related work research in Section 2, introduces the main work contributions and overall system architecture in Section 3, focuses on the related algorithms for sensing data quality determination in Section 4, and performs simulation experiments on the related algorithms in Section 5, and summarizes and concludes all the work in the last section.
In this section, we discuss research work related to crowdsensing. In crowdsensing, task, data, and user are the key points to focus on. Then for these three parts, other research has been conducted by different people, precisely the research directions of data collection, user recruitment, task allocation, and data quality, which are closely related to data. Details of the relevant research work are given below.
Depending on how the data are collected, it is divided into opportunistic sensing and participatory sensing. In opportunistic crowdsensing, data are not collected by selecting a specific user for the data collection task but by a process where the person finishes the task unconsciously. This approach senses the user’s behavior directly or indirectly through the platform and is less intrusive to the user.
To address the problem of budget constraints and conflicting goals in opportunistic mobile crowdsensing, Yucel et al. [23] proposed a polynomial-time approximation algorithm to implement a budget-constrained, opportunistic mobile crowdsensing system that satisfies both the service requester coverage preference and the participant profit preference. Participatory crowdsensing, in which users actively participate in sensing tasks, is characterized by comprehensive coverage, rich data, and relatively high accuracy and can address the difficulties and high costs of large-scale deployment of traditional wireless sensing network devices. However, this approach is susceptible to subjective user consciousness. It is prone to uploading false data by malicious users, a problem that is analyzed and investigated in detail in the following sections. How to effectively address this problem is proposed in the following sections.
Participatory sensing has also been studied in various ways by many experts. Christin [24] discussed protection mechanisms for mobile participatory sensing, analyses the sources of privacy threats, their targets, and how to deal with them, and provides an overview of trends and the future of the field.
The accomplishment of crowdsensing requires the involvement of large-population users, so how to recruit enough suitable users to participate in a sensing task has become one of the hot issues in research. In order to recruit the most suitable users to participate in sensing tasks and achieve high-quality execution, Wang et al. [25] proposed a task-oriented user recruitment mechanism in crowdsensing systems, which uses task and participant user match prediction to achieve a high matching rate of users recruited to new tasks. There is a limited budget for user recruitment. Liu et al. [26] studied the user recruitment problem in terms of users and sub-regions and proposed a three-step strategy to select the best set of users under a limited budget. When the users of the sensing task become moving vehicles, it is also necessary to consider how to collect the maximum amount of data with a limited budget. To address this problem, Zhu et al. [27] proposed an algorithm based on deep learning with greedy ideas. The algorithm combines an offline algorithm that enables the prediction of vehicle movement in the np problem, i.e., it can predict the number of participating vehicles maximizing a limited budget.
To solve the current problem of the insufficient quantity of participants in sensing tasks, combining incentive mechanisms with crowdsensing is becoming a hot research direction. Xu et al. [28] designed an incentive mechanism to solve the user selection problem using a combination of binary search and greedy algorithms to achieve a more robust user selection with optimized expected profit and coverage. Zhang et al. [29] proposed two optimization models. The models maximize the number of users and the perceived utility functions of users in different regions. In addition to that, incentive mechanisms are designed to motivate users to participate. To address how to maximize the utility of a crowdsensing platform under inaccurate distributed sensing, Dong et al. [30] proposed OSIER, an optimal mobile crowdsensing incentive under sensing inaccuracy. With the help of a quantitative analytical framework to solve optimization of sensing inaccuracy, the problem of inaccurate sensing is solved with a quantitative analytical framework, and the task allocation strategy of the crowdsensing platform is improved with the help of an incentive mechanism that differentiates the types of tasks performed by users.
In addition to the lack of user participation, another critical problem with current crowdsensing is that we need to guarantee that the data obtained are meaningful and of high quality, given the amount of data collected. Wu et al. [31] proposed an efficient malicious user detection method based on the Hidden Markov Model, and incorporated the method into task assignment, proposing an anti-malicious task assignment mechanism to accurately identify malicious user data and further prevent malicious users from accepting tasks, achieving the objective of improving data quality.
In addition to malicious users deliberately providing false data affecting data quality, reasons such as users’ private information and perception of accuracy may also result in poor data quality. To address this situation, Gong et al. [32] designed a quality and effort elicitation (QEE) authentic crowdsourcing mechanism to improve data quality by overcoming the data’s reliance on users’ private information and perceptions of accuracy. At the same time, users can be motivated to reveal their private information, which affects data quality truthfully.
When users participate in sensing tasks, they are concerned about their privacy disclosure, so they will use privacy-preserving techniques to conceal private information, but how to discover hidden malicious data under privacy protection is also an essential direction of research. Zhao et al. [33] combined game theory, algorithmic mechanism design, and truth discovery to ensure and improve data quality without compromising the crowdsensing privacy of the system participants.
This paper focuses on the two main issues of how to increase users’ motivation to participate and improve the quality of data. Both of these work areas focus on one problem, but since user engagement is closely related to data quality, the strength of our work lies in the innovative introduction of blockchain technology to improve the trustworthiness of the crowdsensing system. The specific work and results will be described in detail below.
3.1 Blockchain-Based Crowdsensing of Distributed Incentive Architecture
For the current crowdsensing, over-reliance on centralized platforms is the main problem leading to low user trust, which is the main reason for low user engagement and low quality of sensing data. So we solve the problems that may arise from centralized platforms using distributed technology. Currently, some blockchain applications and ideas provide some ideas for our idea design, so we consider how users can participate in the sensing tasks and the storage of sensing data in the distributed case. So we design to solve the current problems of crowdsensing with the help of a blockchain network.
A smart contract is a piece of code deployed to the blockchain and can have a variety of functions. Because the code (strictly speaking, binary code) on the blockchain can be inspected, it is open and transparent. When a smart contract is deployed on the chain, it generates a permanent contract address in a block on the chain. However, all transactions and operations must be initiated by the “personal account” to call the function in the contract to execute.
As shown in Fig. 3, we introduce the blockchain into the traditional crowdsensing network. The blockchain replaces the position of the original centralized platform to realize decentralized interaction with terminal devices. Unlike traditional crowdsensing, the screening of sensing data is implemented on the blockchain. The terminal user information and bid-winning data are stored off-chain, but the hash value of its storage location is correspondingly stored on the blockchain. Such a design helps the blockchain improve the operational efficiency. We use smart contracts to write data information into blocks in the blockchain, and each node saves the block. This blockchain feature guarantees the immutability of the information.
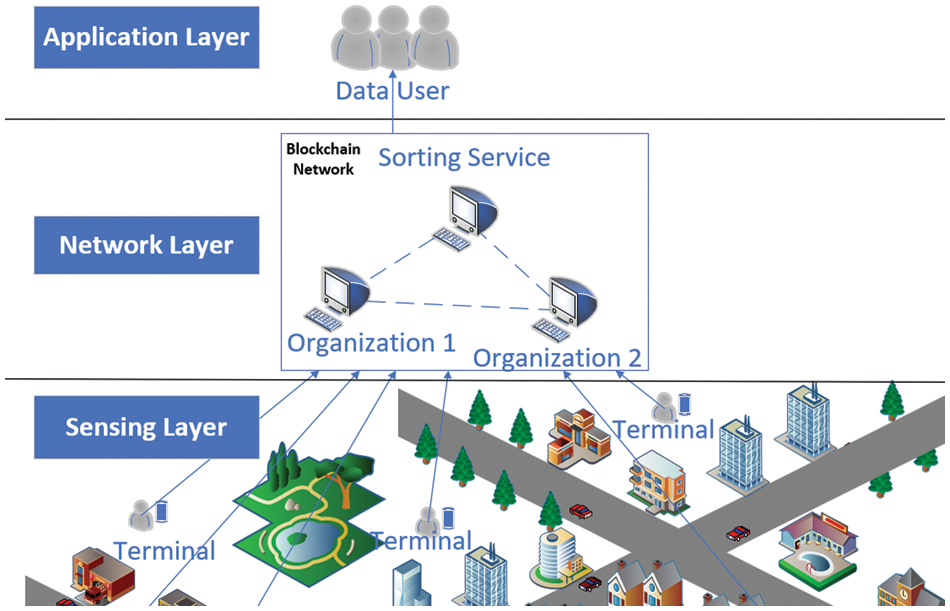
Figure 3: Distributed incentive architecture
The consensus process of the public chain requires the cooperation of the whole network nodes, and the network energy consumption of the whole process is enormous, so from the perspective of cost reduction, we choose Hyperledger Fabric for blockchain use. Hyperledger Fabric is a federated blockchain, with complete authority control, and members can only join the network through authentication. Moreover, it considers data sharing and privacy protection and is more secure. Its consensus algorithm is executed by a certain number of pre-selected authenticated nodes, which can effectively help reduce resource consumption. With modular design, the consensus mechanism and cryptographic algorithm are pluggable. Using container technology, each node and the code on the chain run in docker containers, and the environment between containers is isolated and can be communicated [34].
Fig. 4 shows the blockchain network we designed for crowdsensing. In the design of the blockchain network, we adopt the Hyperledger Fabric. In order to display the blockchain structure more clearly, we design the simplest one, consisting of three organizations and two channels. Nodes in the organization perform tasks such as authentication of transactions, packaging, and distribution of blocks.
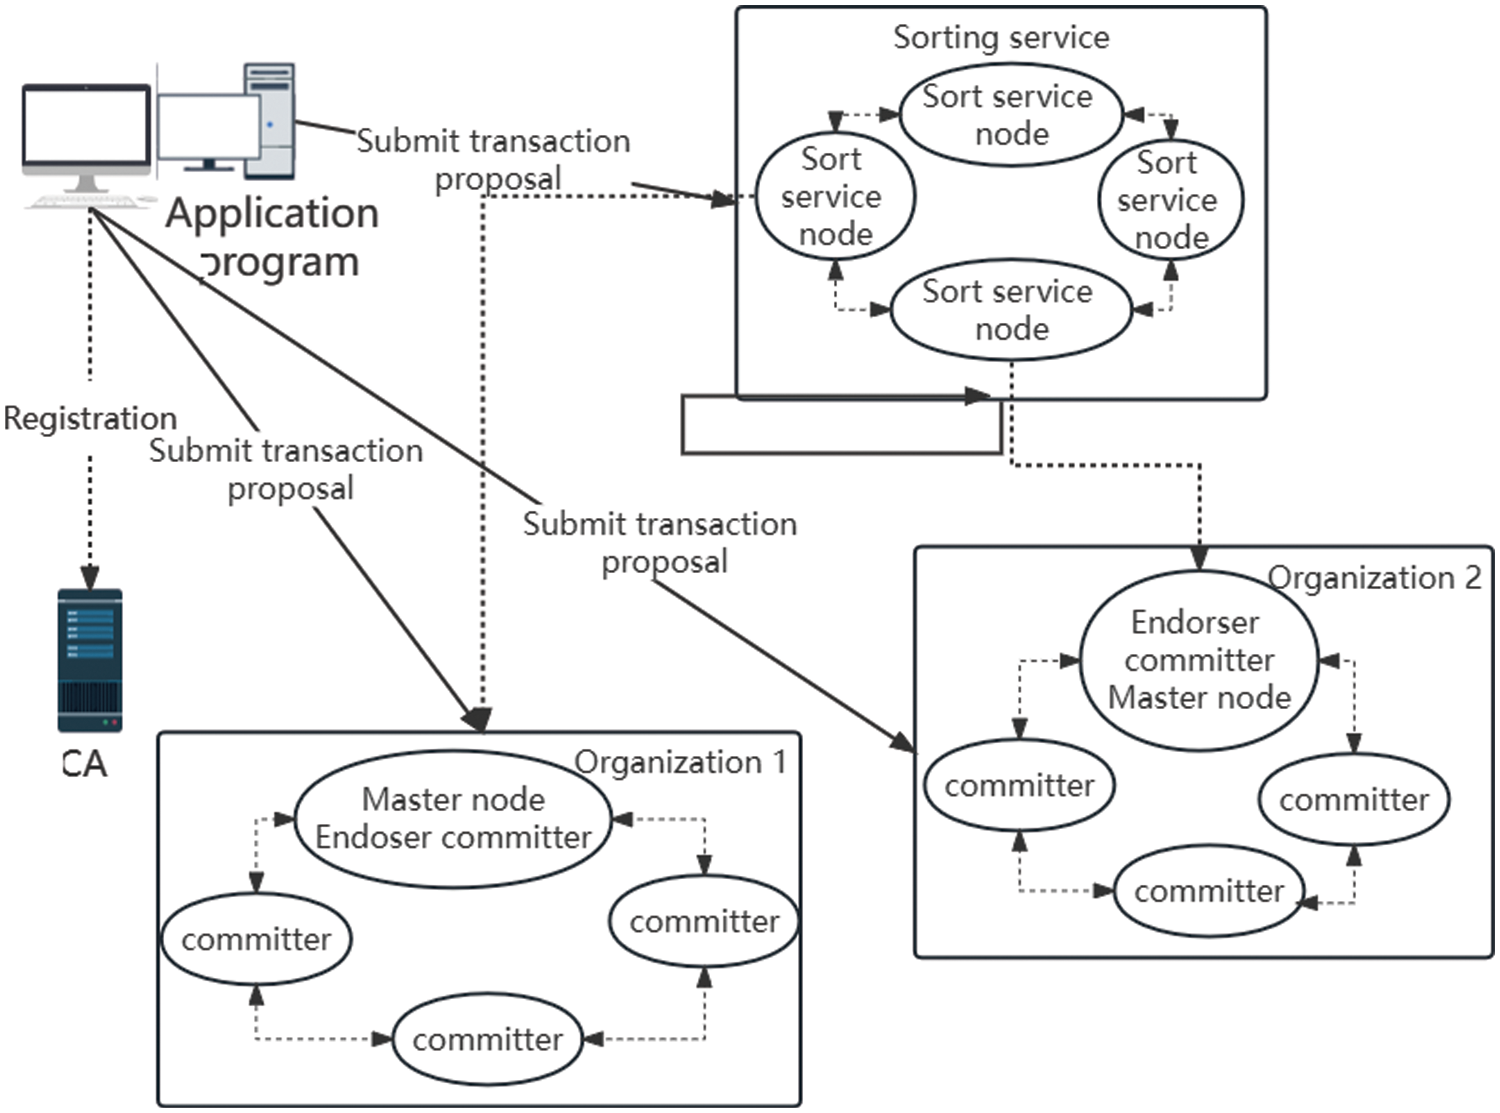
Figure 4: Hyperledger fabric framework
3.2 Specific Implementation Process of the Framework
The architecture of the whole blockchain-based crowdsensing system is as Fig. 5.
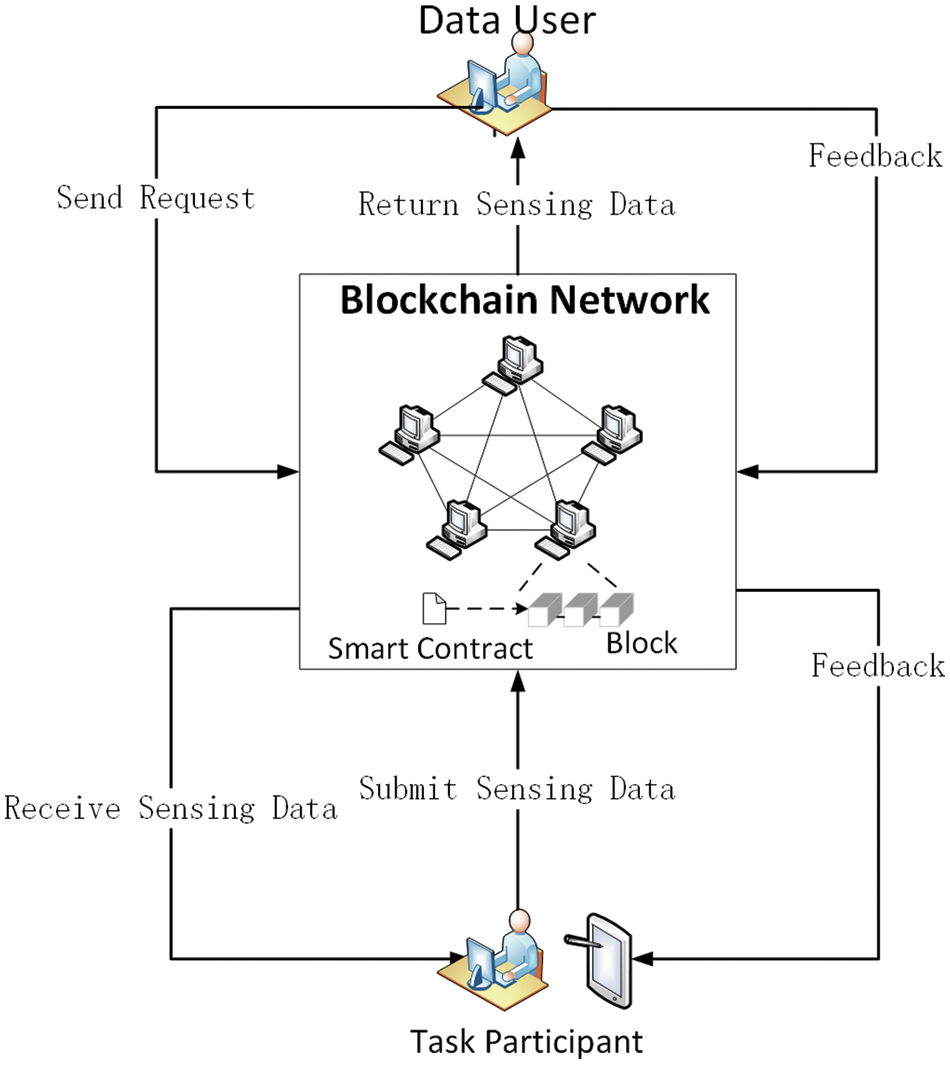
Figure 5: Architecture of the whole blockchain-based crowdsensing system
We use three smart contracts for writing information in this architecture’s design.
Contract 1: User information and reputation value update contract (write the user information added to the crowdsensing into the blockchain system; complete the dynamic allocation of the initial reputation value; realize the reputation update after data screening).
Contract 2: Multi-attribute auction contract with dynamic weight selection (obtain sensing data attribute information; update dynamic weight information of different attributes; sort incoming sensing data according to data attribute set information; preliminary feedback bid winning data according to the set preliminary screening number).
Contract 3: Sensing data screening and selection contract (obtain preliminary bid winning data; realize data screening based on the data similarity; eliminate data according to user reputation; issue rewards).
First, when the user registers, we invoke Contract 1 to save the user information in the blockchain and the database.
When completing the sensing task, the user uploads the sensing data attribute set to the blockchain according to the task requirement and writes it to the blockchain with the help of Contract 2. When the user uploads the data attribute set to the set number of requirements or reaches the task time, Contract 2 is invoked on the blockchain to execute the multi-attribute auction algorithm based on dynamic weight. Furthermore, return the result to the users involved in the task. The participating users are sorted according to the utility value obtained by the multi-attribute auction algorithm based on dynamic weight and set a threshold value. The users within the threshold value are selected to continue participating in the subsequent data set uploads.
After that, the platform notifies the winning bidder to upload their sensing data and invokes Contract 3 to write it into the blockchain. When all winning users finish uploading their sensing data or reach the time specified in the task, invoke Contract 3, and the algorithm for data quality judgment is performed based on the data similarity. Furthermore, according to the result, update the reputation value, and invoke Contract 1to write the updated reputation value into the blockchain. The selection of the winning data is based on the user’s reputation and data quality again. However, to prevent the influence of malicious users, we exclude the data of users with low credibility in the final data selection and do not assign reward values to them. They will be selected again once they upload qualified sensing data multiple times, improving their credibility.
After screening the winning user, we need to distribute the reward value with the help of the Contract 1. After that, we call Contract 1 to update the result of the reward value to the blockchain and save the current user reputation value and the reward value information.
3.3 Overall Process Design and Blockchain Performance
Therefore, we designed a distributed incentive architecture based on Hyperledger Fabric to address the existing problems and designed and improved the corresponding system architecture and functional framework to improve. Fig. 6 shows the overall process design.

Figure 6: The overall design
The critical algorithm in this is the winning bid algorithm. It consists of a multi-attribute auction algorithm, an initial credibility assignment algorithm, and a data quality determination and credibility update algorithm. Furthermore, the algorithm is simulated to verify its feasibility of the algorithm.
When considering blockchain characteristics and performance, we propose some strategies to improve the efficiency of the incentive mechanism for crowdsensing. First, it is with the idea of caching.
The main idea is to put data from the chain into the off-chain cache while generating the relevant data’s hash value. When accessing the data, we can know whether it has been tampered with by comparing the data hash value to determine whether it supports off-chain access to improve the data access speed.
In addition, we can also consider changing the block-out time configuration of the fabric. The default block-out time in the fabric configuration file is 2 s. This configuration parameter should be adjusted to modify the fabric’s block-out mechanism.
3.4 Node and Sensing Data Storage
The task participants provide the sensing data. So we can designate each task participant as a wireless sensing node. When a user first registers to enter the crowdsensing system, he fills in its basic information and is authenticated by the system administrator. After successful authentication, then joins the crowdsensing system and generates his key and authentication certificate.
When sensor devices want to upload sensing data, they upload to the blockchain node, which we can also call a data aggregator. The transmission process is done with the help of asymmetric encryption to secure the data security issues during the transmission.
The whole process is encrypted using Advanced Encryption Standard (AES) [35].
This transmission process completes with the help of asymmetric encryption, and the data is encrypted with the keys of the nodes, i.e., unless the attacker steals the keys of all the sensing nodes, the entire sensing data cannot be accessed. This process guarantees the security and reliability of the data.
After uploading the sensing data to each node, it requires block consensus. The Fabric consensus algorithm introduced in this article is the Kafka sorting algorithm. The specific process is as follows.
In fabric, consensus consists of three parts: endorsement, ordering, and verification.
A. After the task is issued, the node sends an endorsement request to the endorser, which pre-simulates the execution of the task to determine the legality of the task.
B. The task is sent down to the order node, responsible for reaching an agreed list of sorted transactions among all the sorting nodes.
C. The transactions in the chain process in batches at regular intervals, and when the maximum number of transactions or the timeout is reached, slice the transactions and form a new block.
In the previous chapter, we presented the overall architecture of the crowdsensing of incentive mechanism with the help of blockchain. This chapter will mainly focus on the main algorithms and optimization suggestions supporting the architecture.
We present three main algorithms.
Multi-attribute auction algorithm based on dynamic weight: Used to filter the set of attributes initially.
Initial reputation value assignment algorithm: For new users joining the platform based on the personal information filled out for the initial reputation value assignment.
Data selection algorithm based on k-nearest neighbors: Reputation value is updated according to the credibility of the user’s uploaded data and the user’s winning bid.
In addition, we conclude with ideas for improving the current algorithm and architecture concerning data access speed problems.
4.1 Multi-Attribute Auction Algorithm Based on Dynamic Weight
When task participants upload sensing data, in order to avoid the storage of low-quality sensing data and reduce the possibility of malicious data, we can make task participants fill in their corresponding attribute information while uploading sensing data, upload the attribute information to the blockchain first, and calculate the total utility value of the attribute set with the help of Contract 2, to initially filter the data and obtain high-quality data.
For this purpose, we design the multi-attribute auction algorithm based on dynamic weight to support Contract 2. Among the attributes we set related to utility value calculation include: data collection frequency (CF), user bid price (BP), sensing location (DL), and the number of unsuccessful winning bids (UB).
Due to the different units, scopes, and meanings of the attribute information submitted by the task participants, it is easy to cause a particular attribute to have too much influence when making a comprehensive attribute judgment or have an opposite effect on the total utility value. Therefore, before calculating the attribute weighted utility value, it is necessary to use Min-Max Scaling to change the original function linearly and map the result to the range of [0,1] to realize the proportional scaling of the original data.
Attribute value normalization processing:
Where
Data Collection Frequency (CF):
A higher frequency of data collection indicates a lower degree of influence of other influencing factors between data, so task publishers want as high a frequency of data collection as possible.
where
Bid Price (BP) Attributes:
Since the lower the bid price, the higher the total utility value, this characteristic must be satisfied when carrying out the normalization process.
where
Sensing Location (SL):
The sensing location is an interval-type property, i.e., the utility value is optimal when the position data lies within a set interval. Outside the set range, the utility value decreases further from the edge value.
where
Unsuccessful Winning Bids (UB):
The number of unsuccessful winning bids is a cost type of data. When designing the utility value, the number of unsuccessful winning bids of the task participant is taken into account, which gives a side view of the quality of the data uploaded by this person and thus effectively filters out some of the data. So the lower the number of unsuccessful winning bids for that participant, the higher the utility value of the data uploaded by that participant will be.
where
Then, we obtain a comprehensive evaluation of data attributes according to the following overall utility value calculation formula.
We assign different weights to different normalized attributes according to the requirements of the task publisher, and the sum of the weights is 1. Attribute α is set to ensure that the marginal utility of the attribute will not increase, and generally takes a value between [0,1]. In this paper, we take 0.5 uniformly.
Since utility values reflect some extent, the data needs of the task publisher and are subject to particular preferences, the task publisher should set the choice of weight values based on personal preferences for data attributes and historical empirical data.
Cheng et al. proposed a method for normalizing data for accurate number-type decisions with expert empirical judgment. Based on this, we propose a method for determining attribute weights determined by the task publisher and expert experience according to the actual needs of our crowdsensing.
Assume that the expert community
First, the variance was used to determine the degree of differentiation in experts’ ratings of different attributes.
Corresponding elements in the matrix of significant differences in standard attributes calculated from the variance:
The matrix is mapped and transformed with the help of the logs function according to the decision maker’s judgment of the matrix of essential differences in the standard attributes.
a is an important parameter that reflects the decision maker’s adjustment to the matrix of essential differences in the standard attributes. A larger a indicates that the decision maker approves less of the expert judgment, while a smaller one indicates more approval.
By quantifying the importance of each attribute in the expert’s
Then the expert experience weight value obtained by combining all experts is
The overall attribute value is determined by both the task publisher and the expert experience, so the formula calculates the weight value:
With the help of this algorithm, we implement the multi-attribute auction algorithm based on dynamic weight in Contract 2. We upload the data attribute set to the blockchain and then, based on this algorithm, execute Contract 2 to calculate the overall benefit value based on the attribute sets of different attributes to select the preliminary winning data. Algorithm 1 shows the specific steps of the multi-attribute auction algorithm based on dynamic weight.

4.2 Initial Reputation Value Assignment Algorithm
First, we should assign an initial reputation value to the user participating in the task for the first time. In order to be able first to distinguish users in a general way, this reputation value assigns using the idea of dynamic assignment, i.e., each first-time participant is not assigned the same initial reputation value, which is calculated based on their personal information. The degree of completeness and truthfulness of the information filled in by the user reflects the seriousness of their participation in the sensing task. In addition, we propose to use the idea of machine learning to identify malicious users first.
Since the behavioral characteristics of malicious users are similar, we can use machine learning to select several essential feature directions to extract the data information of existing real users and malicious users in the system. Obtain the relevant characteristics of new users, and use machine learning to judge which category they may belong to. If it is determined as a real user, continue distributing the initial reputation value. If it is defined as a malicious user, set the initial reputation value to 0. We select the registered user name, registered IP address, registration time, and registered device type to judge.
Registered user name: Count the characters, numbers, and letters in it. A vector represents the result.
Registered IP address: Count the number of malicious and real users under this IP. A vector represents the result.
Registration time: Record the time spent on registration, and classify it according to the length of time (0, 1, 2, 3, 4, 5). The longer the registration time, the higher the level. Results are expressed numerically.
Registered device type: Count the number of malicious and real users under this device type. A vector represents the result.
Combine the above indicators and input them into the machine learning framework to realize the preliminary judgment of newly registered users.
Yu et al. [36] proposed to take competence, kindness, honesty, and predictability as the four dimensions of. We design the distribution of the initial reputation value based on the user’s personal information. First, we need to verify the user’s personal identity information, which is used to ensure the authenticity of users who join the crowdsensing and effectively avoid malicious users. We call it user authenticity information, which belongs to the dimension of honesty. In addition, adding personal conditions such as user email, education, and occupation to measure the user’s ability to provide accurate data is called user integrity information, collectively referred to as other dimensions. Below we introduce the indicators selected by the two dimensions.
User authentication information: ID number (ID), real name (TN), mobile number (TL).
User integrity information: email (EA), community(CO), level of background (ED), profession (PO).
The above represents a general design example in different application scenarios and can design more user attribute information according to the actual application scenarios. Other dimensional considerations can add to the assignment of initial reputation values according to the direction of the platform and most task publisher requirements.
The overall idea of the assignment is: when the user has filled in the relevant information and uploaded the relevant proof to confirm the authenticity, assign the corresponding value to the dimension, and if it does not fill in, or the verification does not pass, the value is not assigned to the dimension.
Combining the assignment of all dimension values, the two types of relevant feature values are: If all three parts of the user authentication part are filled in, a value of 1 will be given; if at least one item is not filled in, a value of 0 will be given. We synthesize the four indicators of user integrity information, assign an evaluation value of [0,1] to each indicator, and calculate its weighted average.
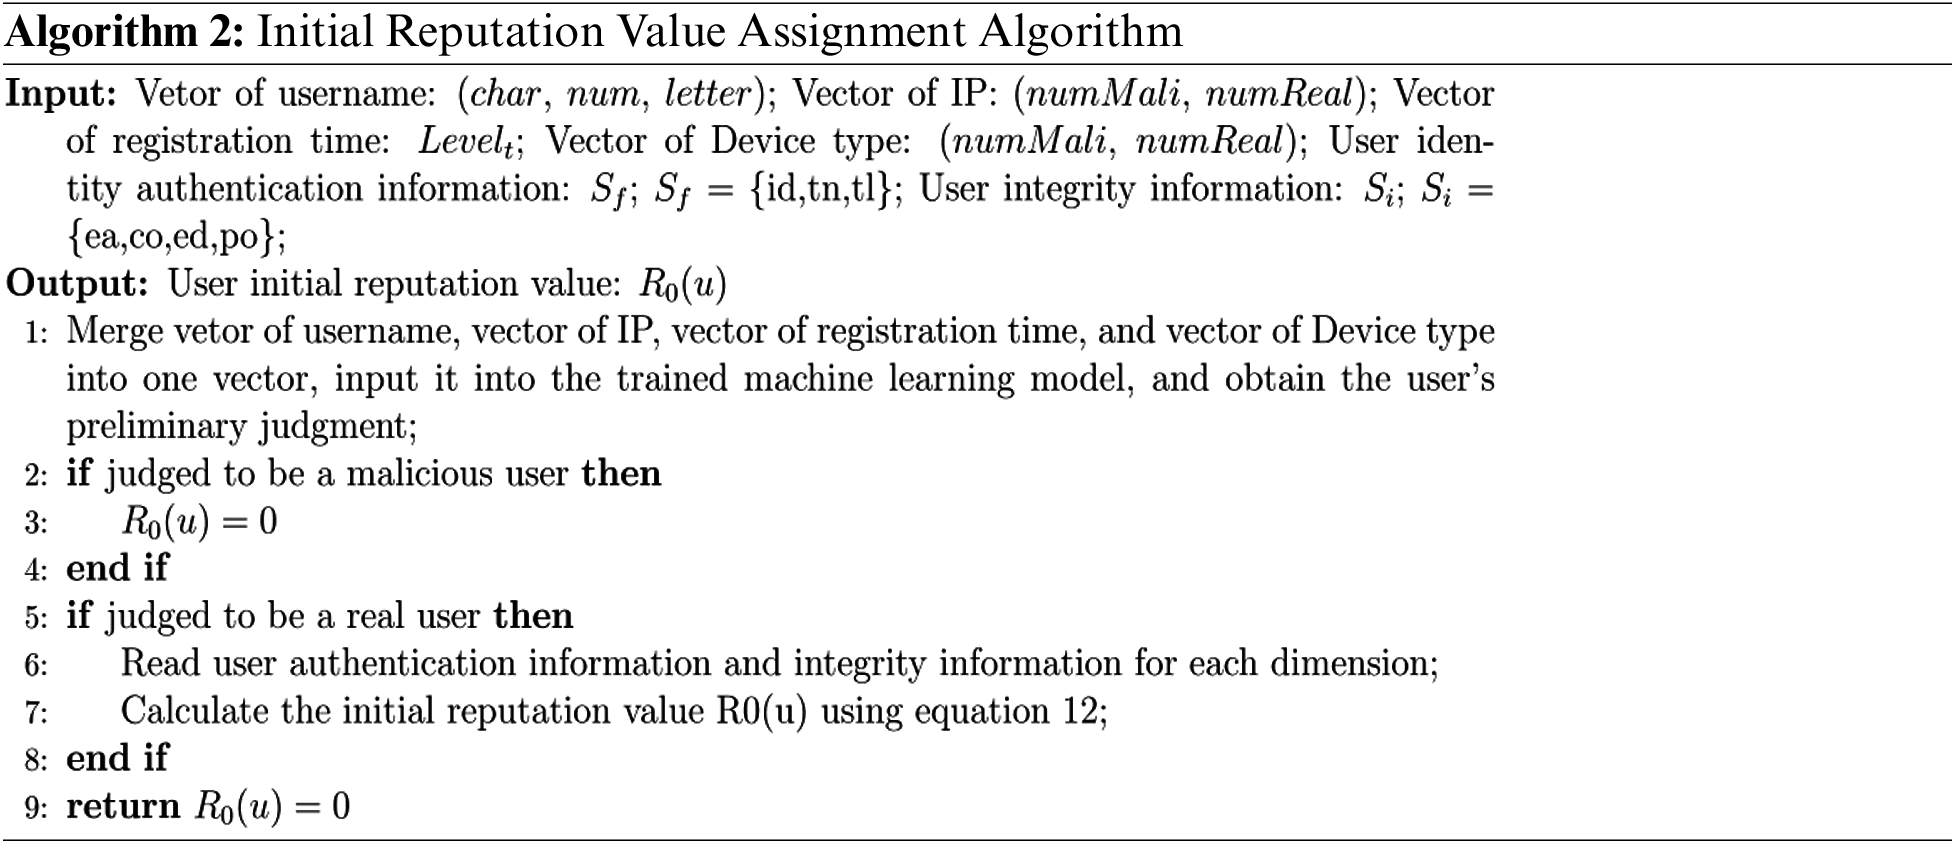
We use the user’s authentication information and integrity information to obtain the initial reputation value, denoted by R0 (U):
where
The algorithm for assigning the initial reputation value can then be summarised as Algorithm 2.
4.3 Data Selection Algorithm Based on K-Nearest Neighbors
After preliminary screening based on the attributes of the data, we should measure the reliability of the data based on the data itself. Since the temperature data of similar geographic locations and times should be similar, we can judge the data quality based on this characteristic. A KNN-based data quality assessment algorithm is proposed. The main idea of the algorithm is first to construct the similarity between the data and other data, and then use the idea of KNN to filter the top K data of geographical location and similar time similarity and obtain the average similarity of these data, which is less than the set threshold. The data is judged as abnormal data.
First, we need to obtain the similarity between two pairs of data. When expressing data similarity, the similarity of data distance is mainly used. According to the following formula, we can get the similarity between data. The main idea is to compare the numerical similarity.
Among them, X, Y represent the vector set of sensing data, in this formula, the same vector of two sets of vectors. mi represents the mean value of the sensing data.
After obtaining the difference between the values, we must select the top K data according to the geographical location and time similarity to calculate the average similarity. Among them, it is necessary to normalize the calculated geographical location and time difference to facilitate comprehensive calculation.
where
Then the similarity matrix is generated based on the data similarity calculated by Eq. (13), which shows the two-by-two similarity degree of the data:
We calculate the position similarity between different data and obtain the matrix D. For each sensing data, the geographic location and time similarity as the average of the data similarity of the previous K data, in combination with the similarity matrix W. this matrix is the one that reflects the similarity of a specific data with the surrounding data.
The similarity between the data and the surrounding data can reflect the reliability of that data. Therefore, we set an appropriate threshold and stipulate that the data less than the set threshold in the obtained data is an outlier, which is unreliable data. At the same time, we update the user reputation value based on the results of data filtering. The above can be summarized as Algorithm 3.

Bao et al. proposed to apply the SVD++ model to the adjustment of user scoring. Ma et al. differentiated the calculation of reputation values according to thresholds and proposed the idea of appropriate dynamic weight assignment [37]. So we update the user reputation value based on the initial reputation value and the update of each data upload. The data filtered again should screen out the data of users with low reputation value and make a penalty mechanism to withdraw the reward value for users with persistently low reputation value.
The reputation value update algorithm is as follows:
Among them,
4.4 Data Access Speed Optimization
After the multi-attribute auction algorithm, we obtain an initial winning attribute set. However, this is not the final result. The data is again filtered based on the updated results of the reputation values obtained from the attribute sets uploaded by the selected users and the data quality. In this, if all the data is uploaded, it will result in an excessive amount of stored data and does not have an advantage in access speed.
So we use a joint on-chain and off-chain storage approach. Put the dataset into the off-chain cache, while the on-chain motivates the relevant data hash value and stores the value in the off-chain. The hash value of offline data generates at the time of access, and the data is judged whether to tamper with or not by comparing the hash value stored on the chain. If the hash is consistent, then it means that the data does not tamper, and offline access is supported. Otherwise, only the on-chain data can be accessed. This method can achieve higher access speed to ensure the data does not tamper. The process shows in Fig. 7.
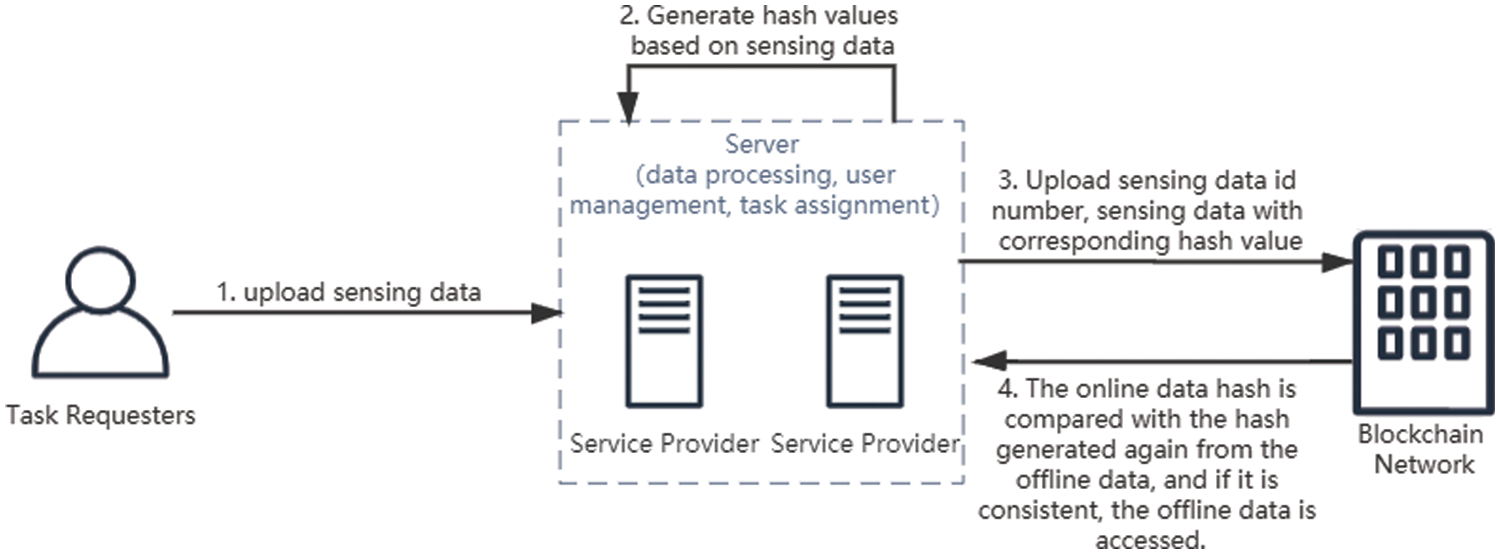
Figure 7: Dataset storage and access
In this section, we will describe the setup of the simulation experiment and the set of properties used. Moreover, the simulation experiment results of two of the main algorithms are shown in detail, as well as a detailed explanation and analysis.
We designed a series of experiments to test the following aspects of the algorithm.
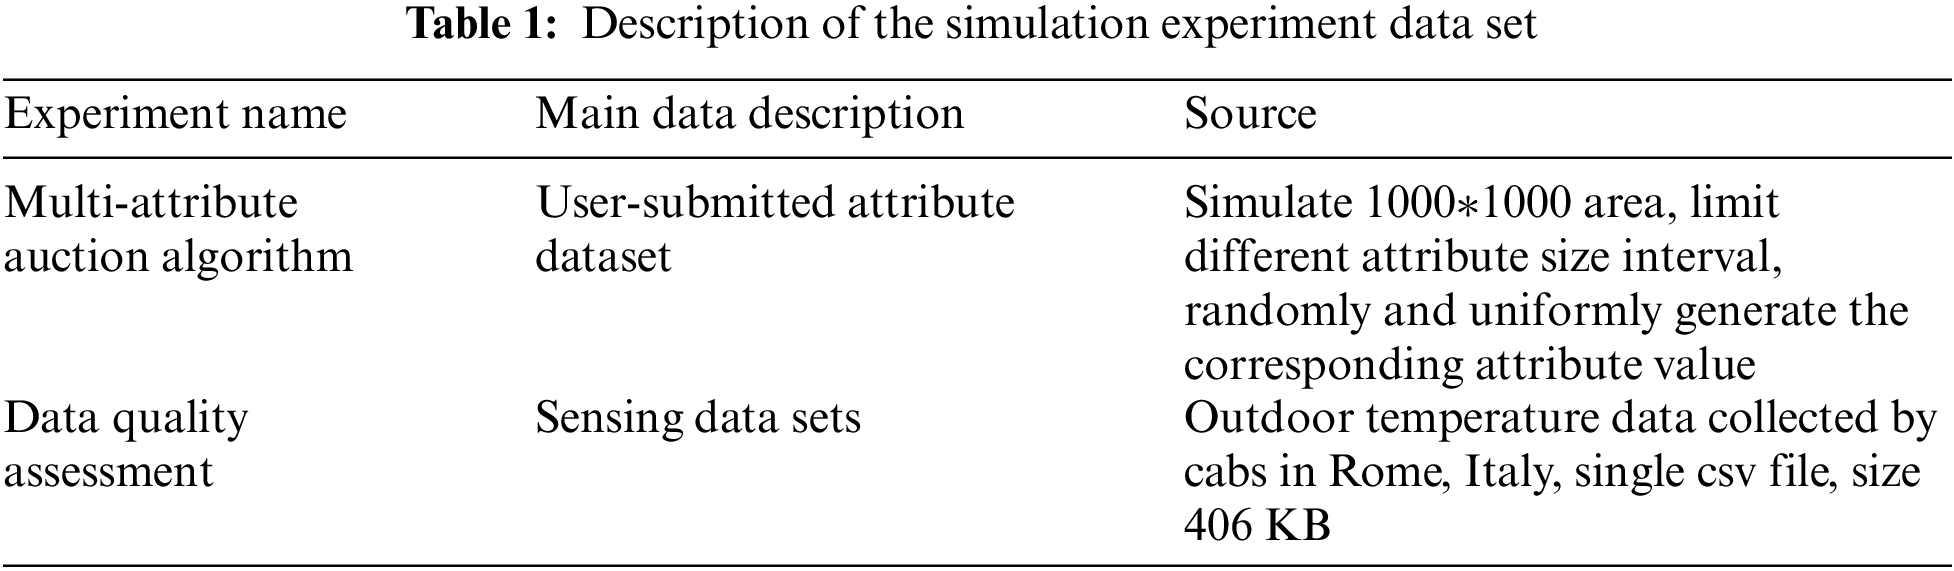
The first is a comparative test between the multi-attribute and single-attribute auction algorithms. In this paper, we analyze the changes of the multi-attribute auction algorithm based on dynamic weights and the single attribute auction under the influence of factors such as price, data collection frequency, sensing position, number of unsuccessful bids and so on, and analyze the differences between the two auctions under different number of attribute and different winning bidders. Then comes the simulation of the data quality-based reputation update algorithm, which focuses on the k-nearest neighbor outlier detection part. The simulation experiments focus on the distribution of each point in the scatter plot showing normal vs. outlier points, the effect of the choice of k-value and the size of the data on the average accuracy, and the comparison with algorithms that do not introduce k-nearest neighbors. The simulation experiment test data describes in Table 1.
5.2 Multi-Attribute Auction Algorithm Results
First, the results of the multi-attribute auction algorithm based on dynamic weights are shown in Section 4.1. In this section, for the multi-attribute auction algorithm, we compare the differences in the number of attributes and the utility values of different numbers of winning bidders for multi-attribute auctions compared to traditional ones single-price attribute auctions to verify the advantages of multi-attribute auctions. In addition, compare the impact of the variation in the number of bidders and the number of winning bidders on the average utility value.
In crowdsensing, the data users and task participant submit their various attributes about the sensing data to set the weight size of different attributes. In our simulation experiment, we set a specific range of values for each attribute type. We randomly generated multiple sets of attribute values within that range, using our randomly generated dataset for comparative study. We use Eqs. (1)–(4) to normalize the obtained attribute values and then use Eq. (5) to calculate the utility values.
5.2.1 Comparison of Single and Multi Attribute
Compared with the single-attribute auction algorithm, the multi-attribute auction algorithm can avoid the influence of a single attribute, which does not reflect the needs of different data publishers. Moreover, at the same time can reflect the preference of the task publisher for the attribute and more easily filter the data that meet the needs of the task publisher (The set of attributes is normalized to facilitate the calculation of overall utility values).
So we designed experiments to compare the change in utility values of single-attribute auctions with multi-attribute auctions with a different number of attributes. In this case, we take out each of the four attributes of the multi-attribute as a single attribute. The result are shows in Fig. 8.

Figure 8: Comparison of single-attribute and multi-attribute
The results show that with the increase of the number of attributes, the multi-attribute auction algorithm based on dynamic weight presents a year-on-year growth trend. In contrast, single attributes express as a straight line that the utility value does not change. This is because, according to the utility function, the more factors that affect the utility value, the more the utility value will show fluctuations. However, the effect of a single attribute on the utility value is minimal.
5.2.2 Effect of the Number of Successful Bidders on the Average Utility Value
After comparing the effects of changes in the number of attributes, we further designed experiments to compare the changes in utility values for the two types of the auctions algorithm with changes in the number of bidders.
Therefore, we compare the utility values of the single-attribute auction algorithm with the multi-attribute auction algorithm based on dynamic weights for the same number of winning bidders and focus on the performance of both auction algorithms when the number of winning bidders changes.
It can be seen from Fig. 9 that the average utility value is inversely proportional to the number of bid-winners. When we want higher utility values, we inevitably need to increase the value of individual attributes. For multi-attribute auctions, higher cost prices, measurement accuracy, lower number of unsuccessful bids. The figure shows that we need to keep the number of bid-winners to a certain number to ensure a low cost with a sufficient number of winning bidders.
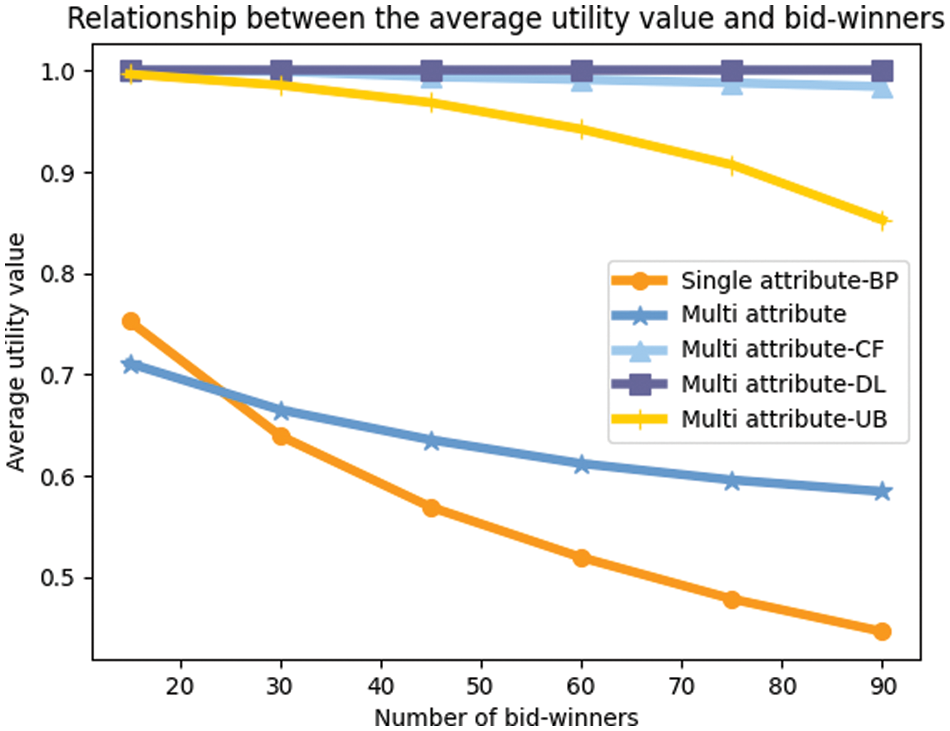
Figure 9: The influence of the bid-winners
5.2.3 Effect of the Number of Bidders on the Utility Value
The number of participants may also affect on the average utility value.
So we compare the effect of changes in the total number of participants on the average utility value for the same number of winning bidders and compare the effect of changes in the number of bid-winners on the average utility value for the same number of participants.
Considering the effect of the number of participants and the number of winning bids on the average utility value, we set this simulation experiment to select five different data volumes and several different winning numbers for testing and analysis of the results.
The result reflects in Fig. 10.
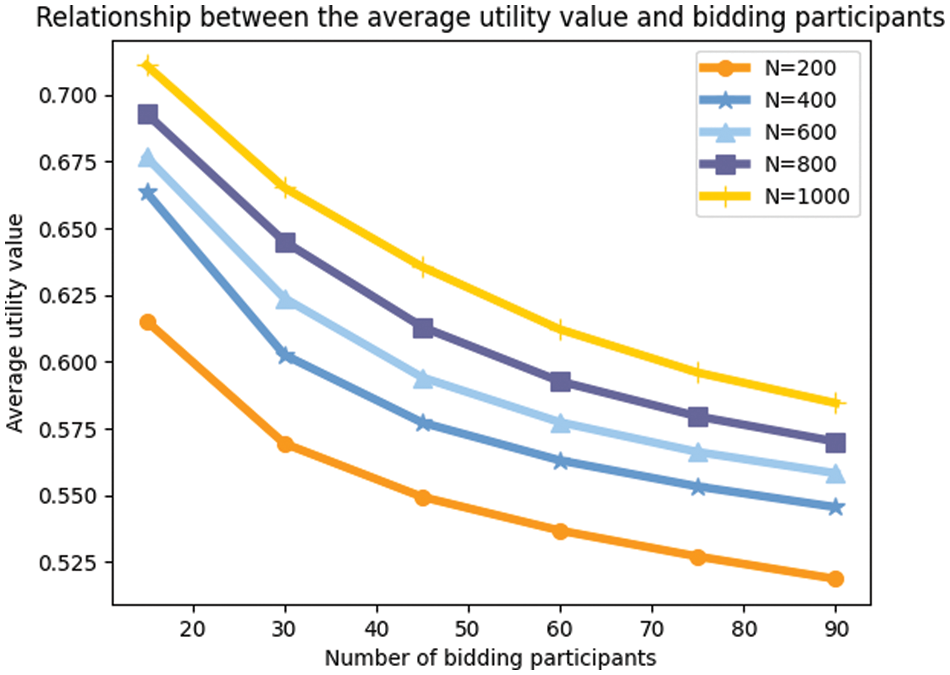
Figure 10: Amount of data, number of winning bids vs. average utility value
The graph shows that for the same number of bid-winners, the average utility value increases as the amount of data increases. As the amount of data increases, the group of available winning bidders changes. More users with higher utility values are involved, allowing the selection of users with higher utility values. For a given amount of data, the higher the number of bid-winners, the lower the average utility value. That is due to the fact that as we select more successful bidders, users with relatively low utility values behind them are also filtered in.
The above diagram shows that we should set up multi-attribute auctions to control the number of winning bidders, attract as many participants as possible, and attract users to submit high-quality attribute sets.
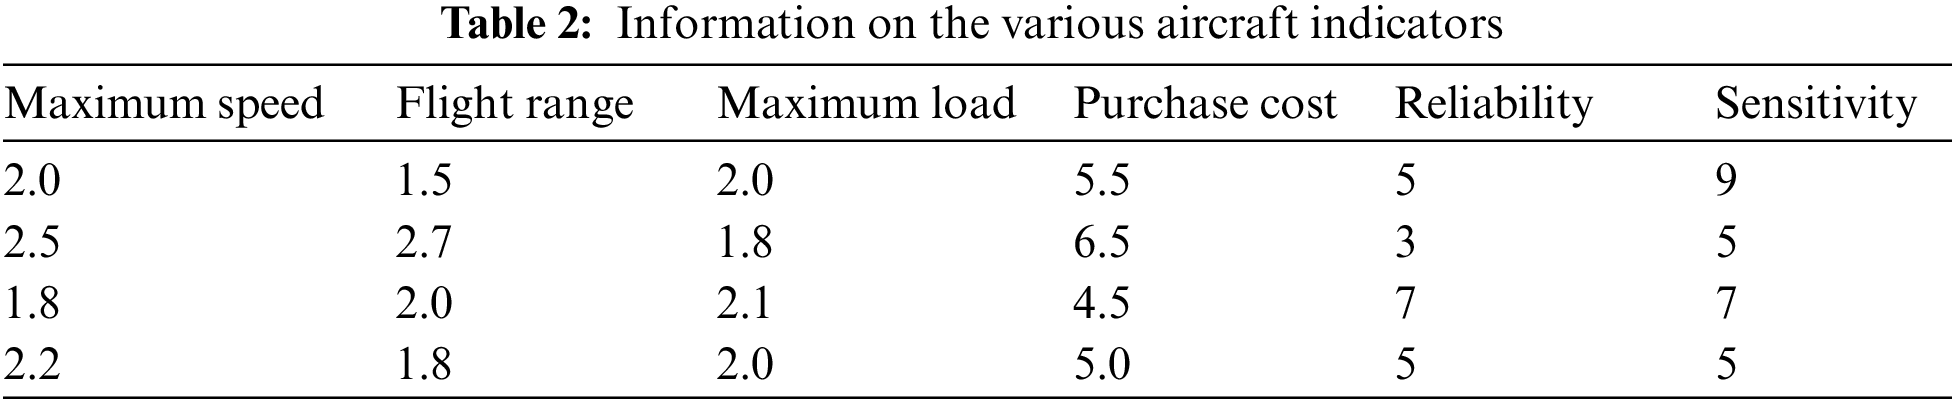
Consider the problem of purchasing a fighter aircraft. There are four aircraft types to choose from, and the decision maker considers six evaluation indicators based on the performance and cost of the fighter aircraft. The information given for each indicator for each aircraft shows in Table 2. The weights of each attribute try to be completely unknown. Try to rank the options.
The expert weighting scoring results show in Table 3.
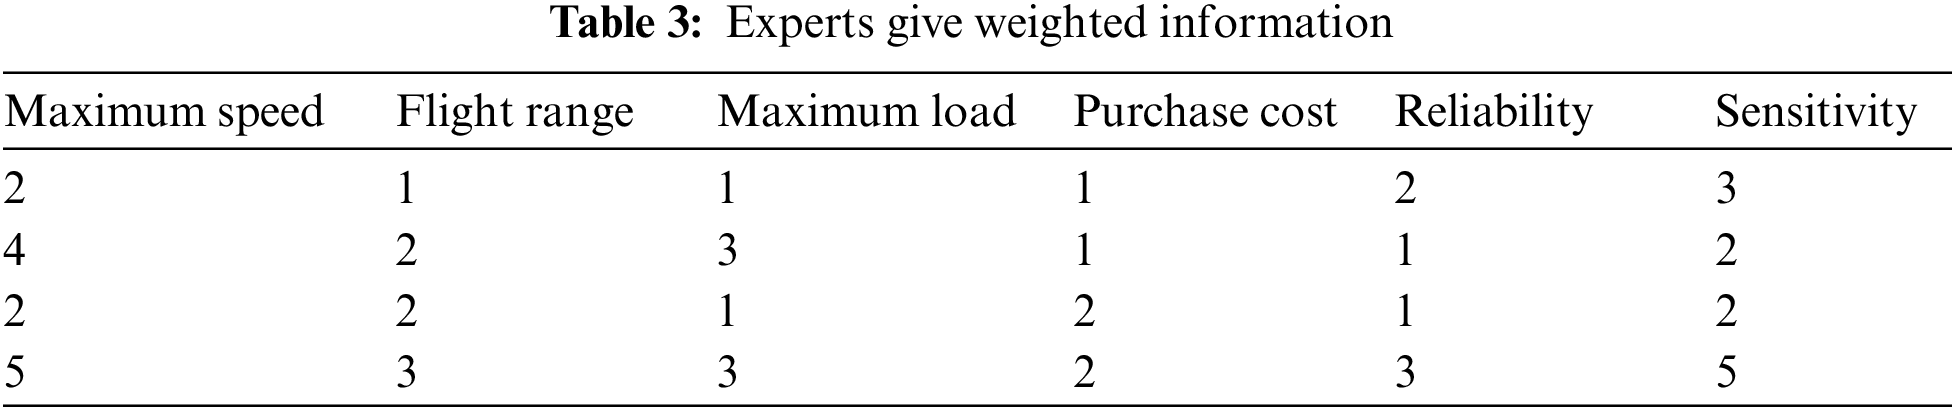
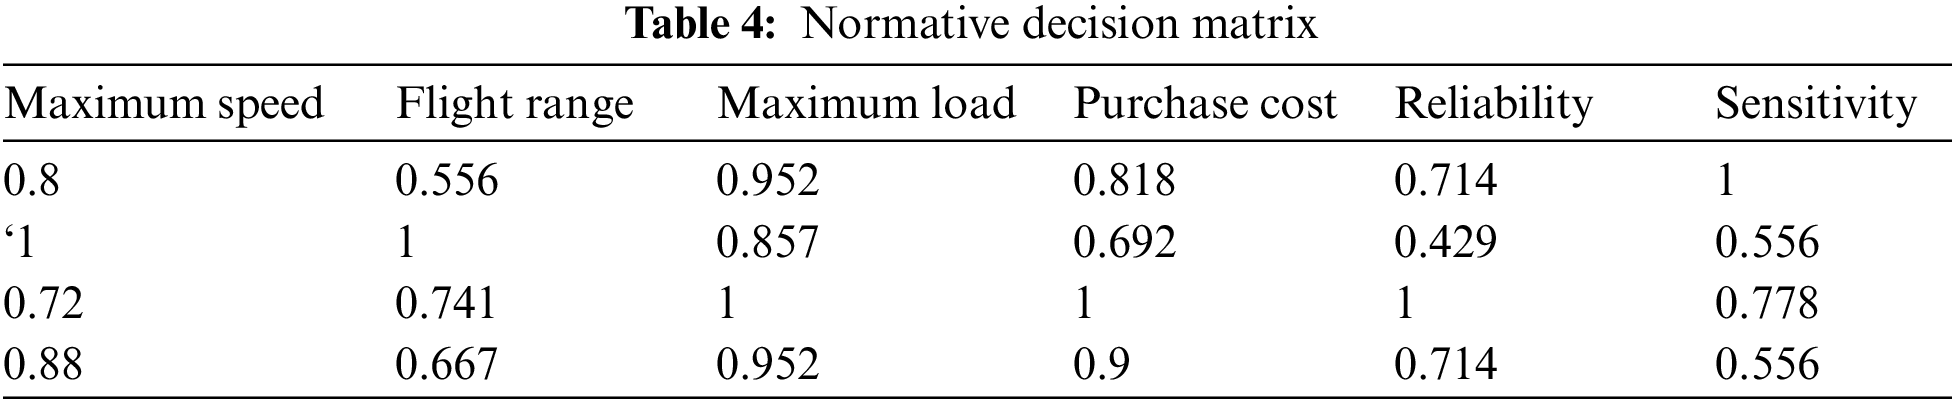
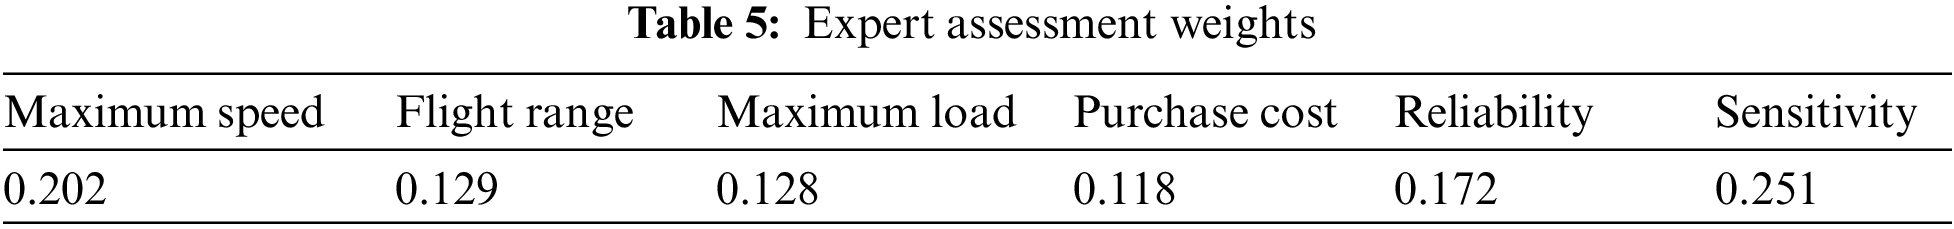
We solve according to the method proposed in Section 4.1 of this paper. All are benefit types except for the purchase cost, which is the cost type. So we normalize the table data with the help of Eqs. (1) and (2). Tables 4 and 5 respectively show the normalized data results and the weight given by the experts of the corresponding indicators.
We then calculate the utility values of the four options based on the weights. The results show in Table 6.
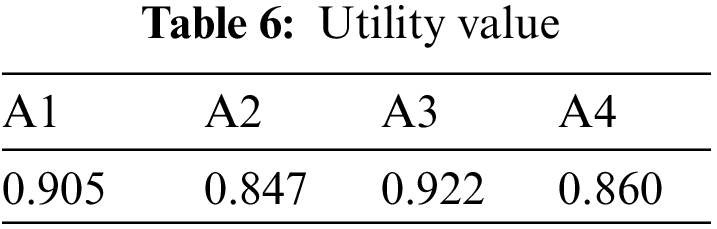
The utility value results can be known: A3 > A1 > A4 > A2, consistent with the results obtained for this sample in multi-objective decision-making.
5.3 Data Quality Assessment Results
In this simulation experiment, we test the data quality assessment algorithm in Section 4.3. with the help of a selected dataset. This data evaluation, with the help of data similarity reflecting data quality method, i.e., we simulate the K-nearest neighbor outlier detection algorithm and analyze the results. We use Eq. (12) to calculate the similarity of the data, generating a matrix of the form of Eq. (13), which is then reduced to a degree matrix of the form of Eq. (14).
We used the selected dataset to test and evaluated the K-nearest neighbor outlier detection algorithm based on geographic location and similarity.
In this case, to test the algorithm’s ability to detect outliers, some standard data were artificially tampered with as outliers to test the algorithm’s performance. This scatter plot obtained from the data similarity calculated by Eq. (13), plotting the location of the points according to the geographic position below a set threshold, is marked in red as abnormal data. In order to be able to represent the distribution of all our data more intuitively, especially the distribution of outliers, we represent the results in a scatter plot, and the experimental result shows in Fig. 11.
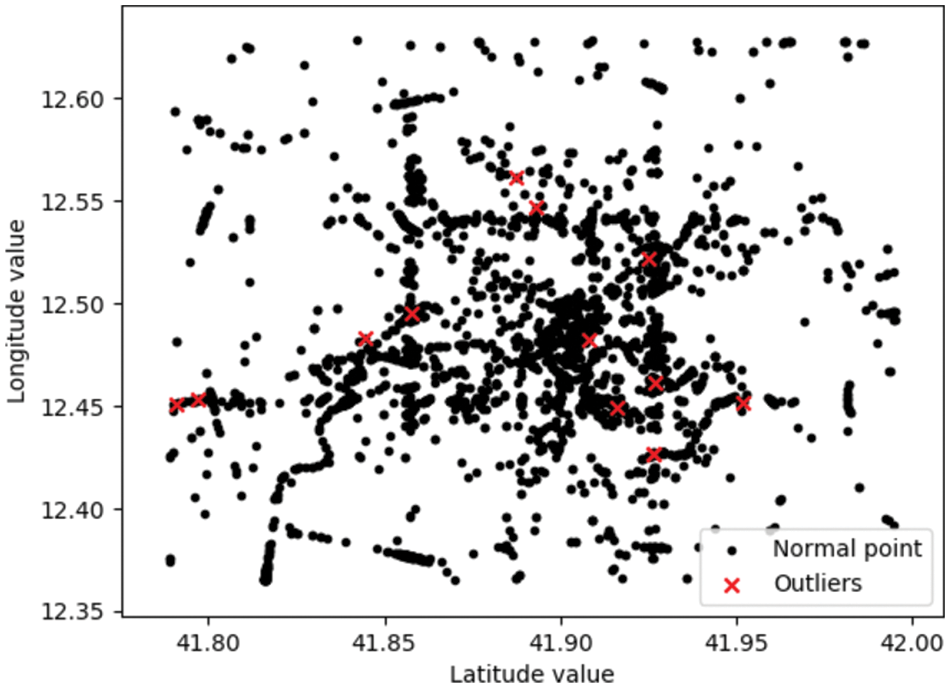
Figure 11: Comparison of normal points and outlier points
In this test, we have changed some data. According to the scatter plot of geographic locations, standard data are the expected values that meet the set thresholds, shown as black dots. In contrast, we used red dots to mark the abnormal values, and also, in the plot, we can see the approximate locations of the abnormal values.
We can observe some tampered values and their geographic location status from the graph. So it shows that our algorithm is very effective in marking the outliers.
Therefore, in the subsequent experiments, we further consider the relationship between the choice of K values and the accuracy rate, thus considering the choice of thresholds in different cases.
5.3.2 K Value and Average Similarity
In this part, we use the original dataset with untampered data to examine the effect of the choice of K value on the average similarity when the amount of data is inevitable and the effect of the change in the amount of data on the average similarity when the K value is specific.
The experiment designs to investigate the variation in results caused by different choices of K values when converting Eq. (13)–(14) so that we can see more accurately the effect of the choice of K value and data volume on the average similarity of the data, respectively.
The result shows in Fig. 12.
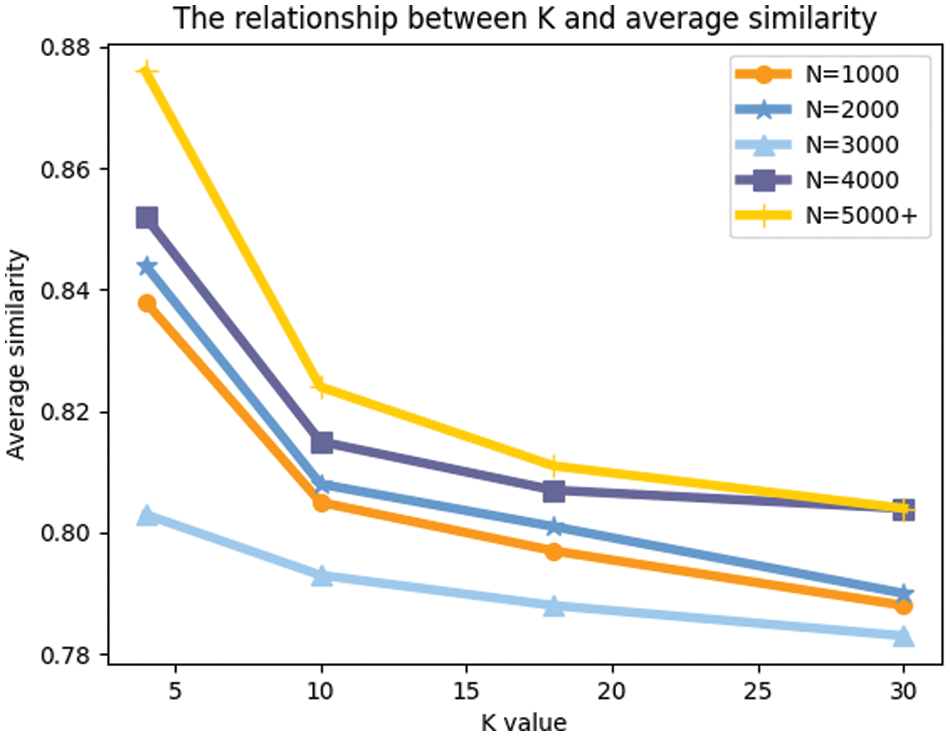
Figure 12: The relationship between the choice of K value and average similarity of the data
The figure shows that the average similarity of the data decreases as the value of k increases for a certain amount of data. That is because there are no outliers in the untampered data, so the smaller the k we choose, the higher the average similarity is. Then we can analyze that if we use the data set that has tampered with several of the data, the similarity value of our part of the data should become more extensive and then more minor. This is because when the amount of data is not large, it is easily influenced by the tampered data, thus affecting the similarity of the standard data. However, as k increases, the value of the selected surrounding data increases, and the influence of the outliers decreases. However, when K reaches a specific value, its average similarity decreases again. Therefore, when calculating the data similarity, the choice of K value should also be analyzed to select the most appropriate K value that best reflects the similarity.
Besides, we can also learn that for a certain k, the more considerable the amount of data, the higher its average similarity because the more considerable the amount of data, the more data with high similarity are available. So we should need as much data volume as possible. We need more users to participate in the sensing task and encourage them to provide high-quality sensing data.
We also set up an algorithm comparison test to show the superiority of the data quality judgment algorithm. So we show and analyze the graphs of the results of this algorithm with the algorithm that removes the selection of K-nearest neighbors and performs the similarity judgment directly.
In this simulation experiment, we mainly perform two minor aspects of testing. One is to observe the detection results and distribution of its anomalies with the help of a scatter plot, and the other is to analyze the results of the average similarity and discuss its connectedness.
First, the results of our scatter plot, which helps in viewing the results of detecting and distributing detected anomalies, shows in Fig. 13.

Figure 13: Comparison of normal points and outlier points
When we set the same similarity threshold, the algorithm without introducing K-nearest neighbors has significantly more outliers than the number we labeled. Some standard points are incorrectly labeled, showing that the algorithm does not accurately reflect the presence of outliers. In contrast, although our algorithm does not label all the outliers, the difference is insignificant. With a reasonable threshold set, it does not mislabel the standard points, so the performance is relatively better.
Because when we do not introduce K-nearest neighbors, the range of locations where we have resorted to calculating the average similarity of the data quality is extensive, and thus the differences between the data become large and do not correctly reflect the actual values of the actual point compared to the test values, and thus the performance is not good.
So, for the preliminary test results above, we further compared the results of average similarity and obtained the differences and the connections by analysis.
The experimental result shows in Fig. 14.

Figure 14: The relationship between the choice of K values and the average similarity
The figure reacts that, in terms of the average similarity, our algorithm is significantly higher than the similarity calculation without introducing K nearest neighbors, which is consistent with the results of the previous scatterplot and caters to our analysis. Since the proximity data are similar, the average similarity of the data obtained using the K-nearest neighbor algorithm will be more accurate than the method without K-nearest neighbors. However, it can be seen from the trend that the decreasing curve gradually approximates a straight line as K keeps increasing, and it is easy to see that the two lines will reach an intersection when our choice of K is the same as the amount of data.
In order to solve the problems of low data quality and low motivation of participating users in the traditional crowdsensing model, this project improves the current model for the existence of the traditional crowdsensing model. It introduces blockchain to make up for the defects of the traditional model. For crowdsensing, which needs to increase user participation and obtain a large amount of data, a combination of crowdsensing and incentive mechanisms is proposed to promote user participation motivation with rewards. A data selection and reward allocation algorithm are designed for the crowdsensing incentive mechanism and designed a corresponding architecture for the distributed ledger-based collaborative task reward system. In this paper, we discuss the problems easily caused by centralized platforms in traditional crowd sensing and propose using distributed ledgers to solve data quality problems in a targeted manner. To this end, we designed a distributed platform architecture based on the hyperledger structure, which realizes the interaction between users and the blockchain through smart contracts, and reduces the credibility problems caused by the concentration of reward distribution.
Regarding algorithm design, design two main algorithms to filter the quality of the perceived data, which helps to filter the data that better meet the requirements. We propose the multi-attribute auction algorithm based on dynamic weights to realize the initial screening of data, which preempts the untrustworthy data based on the data’s attribute and avoids the scalability of the blockchain affected by the large amount of data stored on the chain. In the final perceptual data selection, propose the data quality assessment and reputation value update algorithm to realize the final screening of sensing data with the help of the K-nearest neighbor idea and the idea that data of similar dimensions should have high similarity. The user reputation value directly affects the probability of selecting the sensing data later, which helps to filter out the data of malicious users and thus obtain higher quality data. Finally, a multi-dimensional simulation of the above algorithm using Python shows that the proposed architecture has high superiority.
In future work, blockchain’ scalability and storage access rate in crowdsensing is the critical issue of research concern to achieve efficient crowdsensing applications. In addition, data transmission to the chain needs to be more secure. The research in this paper focuses on the chain’s security, but how to guarantee the immutability of data uploading to the chain is another complex problem in the application of blockchain technology for crowdsensing and the critical problem of the whole blockchain application.
Acknowledgement: The authors would like to thank the anonymous reviewers for their careful review of the content of the article and their valuable revision suggestions to help improve the content and structure of the article.
Funding Statement: This work was supported by National Key R&D Program of China(2020YFB1807800).
Conflicts of Interest: The authors declare that they have no conflicts of interest to report regarding the present study.
References
1. R. Kimura and T. Nakajima, “Collectively sharing human eyes and ears as smart city digital platforms,” in 2022 IEEE Int. Smart Cities Conf. (ISC2), Pafos, Cyprus, pp. 1–4, 2022. [Google Scholar]
2. W. Jiang, X. Liu, D. Shi, J. Chen, Y. Sun et al., “Research on crowdsourcing price game model in crowd sensing,” Computers, Materials & Continua, vol. 68, no. 2, pp. 1769–1784, 2021. [Google Scholar]
3. H. Garcia-Molina, M. Joglekar, A. Marcus, A. Parameswaran and V. Verroios, “Challenges in data crowdsourcing,” IEEE Transactions on Knowledge & Data Engineering, vol. 28, no. 4, pp. 901–911, 2016. [Google Scholar]
4. J. A. Burke, D. Estrin, M. Hansen, A. Parker, N. Ramanathan et al., “Participatory sensing,” in Workshop on World-Sensor-Web (WSWMobile Device. UCLA, USA, 2006. [Google Scholar]
5. R. Ganti, F. Ye and H. Lei, “Mobile crowdsensing: Current state and future challenges,” IEEE Communications Magazine: Articles, News, and Events of Interest to Communications Engineers, vol. 49, no. 11, pp. 32–39, 2011. [Google Scholar]
6. Y. Liu, “Crowd sensing computing,” in Communications of the CCF. Beijing, China: Tsinghua University Press, pp. 38–41, 2012. [Google Scholar]
7. Y. Wu, J. Zeng, H. Peng, H. Chen and C. Li, “Survey on incentive mechanisms for crowd sensing,” Journal of Software, vol. 27, no. 8, pp. 2025–2047, 2016. [Google Scholar]
8. S. Kim, C. Robson, T. Zimmerman, J. Pierce and E. Haber, “Creek watch: Pairing usefulness and usability for successful citizen science,” in Proc. of the SIGCHI Conf. on Human Factors in Computing Systems (CHI '11Association for Computing Machinery, New York, NY, USA, pp. 2125–2134, 2011. [Google Scholar]
9. P. Dutta, P. M. Aoki, N. Kumar, A. M. Mainwaring and A. Woodruff, “Common sense: Participatory urban sensing using a network of handheld air quality monitors,” in Int. Conf. on Embedded Networked Sensor Systems, New York, NY, USA, pp. 349–350, 2009. [Google Scholar]
10. Y. Hu, G. Dai and J. Fan, “BlueAer: A fine-grained urban PM2.5 3D monitoring system using mobile sensing,” in IEEE Annual IEEE Int. Conf. on Computer Communications, San Francisco, CA, USA, pp. 1–9, 2016. [Google Scholar]
11. B. Maag, Z. Zhou and L. Thiele, “W-air: Enabling personal air pollution monitoring on wearables,” in Proc. of the ACM on Interactive, Mobile, Wearable and Ubiquitous Technologies, vol. 2, no. 1, pp. 1–25, 2018. [Google Scholar]
12. M. Maisonneuve, M. Stevens, M. Niessen and L. Steels, “Noisetube: Measuring and mapping noise pollution with mobiel phones,” Information Technologies in Environmental Engineering, vol. 2, no. 6, pp. 215–228, 2009. [Google Scholar]
13. W. Wu, B. Guo and Z. Yu, “Crowd sensing based urban noise map and temporal-spatial feature analysis,” Journal of Computer-Aided Design & Computer Graphics, vol. 26, no. 4, pp. 6, 2014. [Google Scholar]
14. I. Leontiadis, G. Marfia, D. Mack, G. Pau, C. Mascolo et al., “On the effectiveness of an opportunistic traffic management system for vehicular networks,” IEEE Transactions on Intelligent Transportation Systems, vol. 12, no. 4, pp. 1537–1548, 2011. [Google Scholar]
15. S. Eisenman, E. Miluzzo, N. Lane, R. Peterson, G. Ahn et al., “The bikenet mobile sensing system for cyclist experience mapping,” in Proc. of the 5th Int. Conf. on Embedded Networked Sensor Systems, New York, NY, USA, pp. 87–101, 2007. [Google Scholar]
16. J. Froehlich, T. Dillahunt, P. V. Klasnja, J. Mankoff and J. A. Landay, “UbiGreen: Investigating a mobile tool for tracking and supporting green transportation habits,” in Proc. of the 27th Int. Conf. on Human Factors in Computing Systems, New York, NY, USA, pp. 4–9, 2009. [Google Scholar]
17. Y. Du, Y. E. Sun, H. Huang, L. Huang, H. Xu et al., “Bayesian co-clustering truth discovery for mobile crowd sensing systems,” IEEE Transactions on Industrial Informatics, vol. 16, no. 2, pp. 1045–1057, 2020. [Google Scholar]
18. J. Cheng, Y. Zhang, Y. Yuan, H. Li, X. Tang et al., “Poec: A cross-blockchain consensus mechanism for governing blockchain by blockchain,” Computers, Materials & Continua, vol. 73, no. 1, pp. 1385–1402, 2022. [Google Scholar]
19. M. Arafeh, M. E. Barachi, A. Mourad and F. Belqasmi, “A blockchain based architecture for the detection of fake sensing in mobile crowdsensing,” in 2019 4th Int. Conf. on Smart and Sustainable Technologies (SpliTech), Split, Croatia, pp. 1–6, 2019. [Google Scholar]
20. J. Huang, L. Kong, L. Kong, Z. Liu, Z. Liu et al., “Blockchain-based crowd-sensing system,” in 2018 1st IEEE Int. Conf. on Hot Information-Centric Networking (HotICN), Shenzhen, China, pp. 234–235, 2018. [Google Scholar]
21. L. Wei, J. Wu and C. Long, “A blockchain-based hybrid incentive model for crowdsensing,” Electronics, vol. 9, no. 2, pp. 215, 2020. [Google Scholar]
22. W. Viriyasitavat and D. Hoonsopon, “Blockchain characteristics and consensus in modern business processes,” Journal of Industrial Information Integration, vol. 13, no. 8, pp. 32–39, 2019. [Google Scholar]
23. F. Yucel, M. Yuksel and E. Bulut, “Coverage-aware stable task assignment in opportunistic mobile crowdsensing,” Modern Information Technology, vol. 70, no. 4, pp. 3831–3845, 2021. [Google Scholar]
24. D. Christin, “Privacy in mobile participatory sensing: Current trends and future challenges,” Journal of Systems and Software, vol. 116, no. C, pp. 57–68, 2016. [Google Scholar]
25. Z. Wang, J. Zhao, J. Hu, T. Zhu and C. Li, “Towards personalized task-oriented worker recruitment in mobile crowdsensing,” IEEE Transactions on Mobile Computing, vol. 99, pp. 1, 2020. [Google Scholar]
26. W. Liu, Y. Yang, E. Wang and J. Wu, “User recruitment for enhancing data inference accuracy in sparse mobile crowdsensing,” IEEE Internet of Things Journal, vol. 99, pp. 1, 2019. [Google Scholar]
27. X. Zhu, Y. Luo, A. Liu, W. Tang and M. Bhuiyan, “A deep learning based mobile crowdsensing scheme by predicting vehicle mobility,” IEEE Transactions on Intelligent Transportation Systems, vol. 99, no. 4, pp. 1–12, 2020. [Google Scholar]
28. J. Xu, Y. Zhou, Y. Ding and L. Xu, “Bi-objective robust incentive mechanism design for mobile crowdsensing,” IEEE Internet of Things Journal, vol. 8, no. 19, pp. 14971–14984, 2021. [Google Scholar]
29. X. Zhang, L. Jiang and X. Wang, “Incentive mechanisms for mobile crowdsensing with heterogeneous sensing costs,” IEEE Transactions on Vehicular Technology, vol. 68, no. 4, pp. 3992–4002, 2021. [Google Scholar]
30. X. Dong, Z. You, T. Luan, Q. Yao and J. Ma, “Optimal mobile crowdsensing incentive under sensing inaccuracy,” IEEE Internet of Things Journal, vol. 99, pp. 1, 2020. [Google Scholar]
31. X. Wu, Y. Sun, Y. Du, G. Gao, H. Huang et al., “An antimalicious task allocation mechanism in crowdsensing systems,” Future Generation Computer Systems, vol. 127, no. 4, pp. 347–361, 2022. [Google Scholar]
32. X. Gong and N. Shroff, “Truthful mobile crowdsensing for strategic users with private data quality,” IEEE/ACM Transactions on Networkin, vol. 27, no. 5, pp. 1959–1972, 2019. [Google Scholar]
33. C. Zhao, S. Yang and J. Mccann, “On the data quality in privacy preserving mobile crowdsensing systems with untruthful reporting,” IEEE Transactions on Mobile Computing, vol. 20, no. 2, pp. 647–661, 2021. [Google Scholar]
34. Y. Zhang, H. G. Zhang, H. Y. Yu, Z. Li, B. C. Zhu et al., “Attribute-based keyword search over the encrypted blockchain,” Computer Modeling in Engineering & Sciences, vol. 127, no. 7, pp. 269–282, 2021. [Google Scholar]
35. N. Floissac and Y. L’Hyver, “From AES-128 to AES-192 and AES-256, how to adapt differential fault analysis attacks on key expansion,” in 2011 Workshop on Fault Diagnosis and Tolerance in Cryptography. Nara, Japan, pp. 43–53, 2011. [Google Scholar]
36. J. Yu and Y. Lu, “The research of models of online trust,” Industrial Engineering and Management, vol. 11, no. 4, pp. 74–78, 2006. [Google Scholar]
37. C. Ma, L. Tang, K. Yu and Z. Piao, “Study on robust cooperative spectrum sensing algorithm based on enhanced reputation,” Application Research of Computers, vol. 31, no. 6, pp. 1804–1807,1815, 2014. [Google Scholar]
Cite This Article
 Copyright © 2023 The Author(s). Published by Tech Science Press.
This work is licensed under a Creative Commons Attribution 4.0 International License , which permits unrestricted use, distribution, and reproduction in any medium, provided the original work is properly cited.
 Downloads
 Citation Tools