
 Submit a Paper
 Propose a Special lssue
 Open Access
ARTICLE
Analysis of CLARANS Algorithm for Weather Data Based on Spark
College of Artificial Intelligence, Nanjing University of Information Science and Technology, Nanjing, 210044, China
* Corresponding Author: Honglin Wang. Email:
Computers, Materials & Continua 2023, 76(2), 2427-2441. https://doi.org/10.32604/cmc.2023.038462
Received 13 December 2022; Accepted 27 April 2023; Issue published 30 August 2023
 View Full Text
 Download PDF
Abstract
With the rapid development of technology, processing the explosive growth of meteorological data on traditional standalone computing has become increasingly time-consuming, which cannot meet the demands of scientific research and business. Therefore, this paper proposes the implementation of the parallel Clustering Large Application based upon RANdomized Search (CLARANS) clustering algorithm on the Spark cloud computing platform to cluster China’s climate regions using meteorological data from 1988 to 2018. The aim is to address the challenge of applying clustering algorithms to large datasets. In this paper, the morphological similarity distance is adopted as the similarity measurement standard instead of Euclidean distance, which improves clustering accuracy. Furthermore, the issue of local optima caused by an improper selection of initial clustering centers is addressed by utilizing the max-distance criterion. Compared to the k-means clustering algorithm already implemented in the Spark platform, the proposed algorithm has strong robustness, can reduce the interference of outliers in the dataset on clustering results, and has higher parallel performance than the frequently used serial algorithms, thus improving the efficiency of big data analysis. This experiment compares the clustered centroid data with the annual average meteorological data of representative cities in the five typical meteorological regions that exist in China, and the results show that the clustering results are in good agreement with the meteorological data obtained from the National Meteorological Science Data Center. This algorithm has a positive effect on the clustering analysis of massive meteorological data and deserves attention in scientific research activities.Keywords
In recent years, the volume of meteorological data generated and collected in operations and research has grown exponentially. Analyzing and processing this data to extract valuable information has become a key issue. Given the time required for large-scale data processing in the traditional computing model, the development of big data technology has been rapid.
Big data is defined as a collection of data that cannot be collected, managed, and analyzed by conventional tools within a certain time frame. To handle such data, distributed clusters are used instead of traditional stand-alone processing. Hadoop, a distributed system architecture developed by the Apache Foundation, is mainly used to store massive data and analyze and compute data. MapReduce, a programming model, is the core of Hadoop’s distributed computing model [1–3]. However, MapReduce is not designed to handle cyclic iterative data flow problems, which leads to computational efficiency problems in data parallel reusable scenarios such as machine learning and graph mining algorithms. Spark, as shown in Fig. 1, is mainly composed of Spark Core, Spark Structured Query Language (SQL), Spark Streaming, Spark Machine Learning library (MLlib), and Spark GraphX as core modules. Spark is a Resilient Distributed Dataset (RDD) computing model based on the traditional MapReduce computing framework, which is more suitable for handling distributed parallel computing and data reuse. Therefore, it significantly improves the operational efficiency of data reading, writing, analysis, and mining [4,5].

Figure 1: Spark core module
In meteorology data mining, common analysis methods include regression analysis, cluster analysis, classification analysis, and time series analysis [6]. Using the corresponding data mining techniques can help us transform data into organized knowledge and facilitate us to mine knowledge from the data. Data mining has contributed and will continue to contribute in our great stride from the data age into the information age.
The work in this paper is to implement the parallelized CLARANS clustering algorithm in Spark and select the dataset of daily values of Chinese terrestrial climate data from 1998–2018 for national climate region classification. The obtained results have good consistency compared with previous classifications.
2.1 Current Research Status of Big Data Processing Technology
Big data processing technology is a new technology that has received a lot of attention in recent years. Among them, big data processing technologies and system platforms represented by Apache Hadoop and Apache Spark are favored by many enterprises.
In 2004, the American company Google published a paper entitled “MapReduce: Simplified Data Processing on Large Cluster” at the OSDI conference [7], introducing a novel parallel computing model and technology for massive data processing. The design of MapReduce aimed to address the parallelization of indexing and ranking of large-scale web data in search engines. In 2007, the technical team at Apache Corporation released the first open-source version of Apache Hadoop, a MapReduce parallel computing framework based on the Java programming language. Additionally, Apache Hadoop developed an open-source Hadoop Distributed File System (HDFS) based on Google’s File System (GFS) [8], enabling the distributed storage of massive data across various nodes in a cluster. Hadoop MapReduce’s programming model is simple and user-friendly, allowing users to conveniently write parallelized applications for processing large data tasks using MapReduce.
Because, Since MapReduce [9] was originally designed for offline batch processing tasks, it is not highly efficient when it comes to processing real-time tasks and large-scale problems that require multiple iterations. As a result, academia and industry have continuously conducted research and introduced other big data computing models. In 2013, the UC Berkeley AMP lab developed a general-purpose parallel distributed computing framework called Spark [10]. Based on an in-memory computing framework, Spark is 100 times faster than MapReduce in applications such as iterative algorithms and interactive data analysis [11].
2.2 Status of Research on Parallelization of Clustering Algorithms
Currently, Spark’s MLlib library has implemented several clustering algorithms, including K-means [12], Latent Dirichlet Allocation [13] (LDA), Power Iteration Clustering [14] (PIC), and Gaussian Mixture Model [15] (GMM), in parallel on the Spark platform. In addition, some scholars have conducted research on the parallelization of clustering algorithms on the Spark platform.
Mohamed Iqbal [16] proposed a Spark-based Naive Bayes training technique; unlike prior research, this algorithm does not require any disk access. Millions of tweets have been classified using this trained model. Experiments with clusters of various sizes reveal that the suggested strategy is extremely scalable and cost-effective for larger data sets. It is nearly 12 times quicker than the Map Reduce-based model and nearly 21 times faster than the Naive Bayes Classifier in Apache Mahout. It is challenging for complex urban transportation networks to recommend taxi waiting spots for mobile passengers because the traditional centralized mining platform cannot address the storage and calculation problems of GPS trajectory big data. Xia et al. [17] proposed a parallel Density-Based Spatial Clustering of Applications with Noise (DBSCAN) optimization algorithm with the silhouette coefficient and the pickup rate on Spark. The algorithm is named SP-DBSCAN, and it allows users to input only one parameter to complete the distributed recommendation of the best waiting spot. Alazzam et al. [18] proposed a parallel A* algorithm that uses Apache Spark to find the optimal path. The proposed algorithm is evaluated in terms of runtime, speedup, efficiency, and cost on generated datasets with different sizes. The generated datasets consider real terrain challenges, such as slopes and obstacles. Hadoop Insight cluster provided by Azure has been used to run the application. The proposed algorithm reached a speedup up to 4.85 running on six worker nodes.
There is currently limited research on the parallelization of clustering algorithms on the Spark platform. This article focuses on the parallelization of the CLARANS clustering algorithm based on partitioning on the Spark platform.
Clustering analysis is a process of grouping a collection of data into multiple subsets consisting of different similar objects [19–21]. Cluster analysis is used to measure the similarity between different data and has been widely developed in mathematics, biology, meteorology, etc.
3.1 Nearest Neighbor Measure for Cluster Analysis
The core problem in clustering methods is to measure the degree of similarity and dissimilarity between data. We select distance measures that are widely used to calculate the dissimilarity of objects inscribed by numerical attributes, including Euclidean distance, Manhattan distance, Minkowski distance, and morphological similarity distance.
i = (xi1,xi2,…,xip), j = (xj1,xj2,…,xjp) is denoted as two objects described by p numerical attributes. Then the distance between object i and object j can be expressed mathematically as Eqs. (1)–(5).
(1) Euclidean distance
(2) Manhattan distance
(3) Minkowski distance
The Minkowski distance is a generalization of the Euclidean distance and the Manhattan distance, where h is a real number, and h ≥ 1. It denotes the Manhattan distance when p = 1 and the Euclidean distance when p = 2.
(4) Morphological similarity distance
As Eq. (4), SAD represents the Manhattan distance, and ED represents the Euclidean distance. Eq. (5) represents the absolute value of the sum of the differences between the two vectors’ attributes. It can be seen that when SAD/ASD = 1, that is, when the ASD distance is equal to the Manhattan distance, the MSD distance is the Euclidean distance.
The max-distance criterion is an improvement of the maximum-minimum distance algorithm, which selects initial clustering centers based on the principle of maximum distance.
The algorithm process is shown in Fig. 2.

Figure 2: Max-distance criterion
Step 1: Select a point near the boundary from the dataset as the initial clustering center C1, and add it to the clustering center set C.
Step 2: Select the data point farthest from the initial clustering center C1 as the second clustering center C2.
Step 3: Calculate the distances between all other data points and the clustering centers C1 and C2 as shown in Eqs. (6) and (7), and obtain the minimum value among these distances.
Step 4: Select the sample with the maximum distance from Step 3, and substitute it into Eq. (8), where θ is the determining parameter [22]. If the condition is satisfied, the corresponding sample nl is selected as the third clustering center C3.
Step 5: If there are k clustering centers, calculate the distances between each sample point and the clustering centers dxy, and check whether the condition in Eq. (9) is satisfied.
3.3 CLARANS Clustering Algorithm
Clustering algorithms are generally classified into two types: k-means and k-centroids. The accuracy of the k-means clustering is often impacted by outliers, which can significantly alter the mean values within clusters and, in turn, affect the classification of other objects in the cluster [23,24].
To address the sensitivity of the k-means algorithm to outlier points, the k-centroid algorithm proposes that real data objects in the dataset can be used as the representative points of clusters, and each cluster contains one representative object. The rest of the data objects in the dataset are divided into clusters in which the representative objects are most similar to them according to the division principle. The absolute error criterion is generally used as the partitioning principle, which is defined as Eq. (10).
where E is the sum of the absolute errors of all objects p in the dataset and the representative object Oi of Cj. The k-centroid clustering algorithm divides all objects in the dataset into k clusters by minimizing the absolute errors.
The CLARANS algorithm is expressed as the process of finding k-centroids from a dataset of n data objects [25]. Let {Om1,…,Omi} be the set of k-centroids, as a potential solution of the CLARANS algorithm, form a graph Gn,k of all potential solutions. Any two nodes in the graph, if only one centroid is different, can be regarded as neighbors, and each node has k(n-k) neighbors. CLARANS is constantly searching for a better neighbor node to replace the current node [26,27].
Assuming that the non-center point Or will replace the current center point Oj (1 ≤ j ≤ k), p is the other non-center point and Oi denotes the nearest center point to p except Oj, the replacement will result in the following four cost cases as shown in Fig. 3.

Figure 3: Four cases of clustering cost
(1) P belongs to the cluster represented by the centroid Oj, when
(2) P belongs to the cluster represented by the centroid Oj, when
(3) P belongs to the cluster represented by the centroid Oi, when
(4) P belongs to the cluster represented by the centroid Oi, when
In summary, the total cost incurred by replacing the current center point Oj with the non-center point Or would be defined as Eq. (15).
The exact flow of the algorithm is shown in Fig. 4.

Figure 4: Flow chart of CLARANS algorithm
The maximum number of search neighbors (maxNeighbor) and the number of local optimal solutions searched (numLocal) are the two input parameters of the CLARANS algorithm. The larger the maxNeighbor, the longer the search time of the algorithm and the highest quality of the local optimal solution. From the literature [28], it is known that the maxNeighbor is generally set between 1.25–1.5% and the numLocal is set to 2, which can achieve better clustering quality and shorter clustering time. Therefore, the maxNeighbor is set to 1.5% of k(n-k) in this paper.
4 Experiments and Analysis of Results
4.1 Experimental Environment Construction
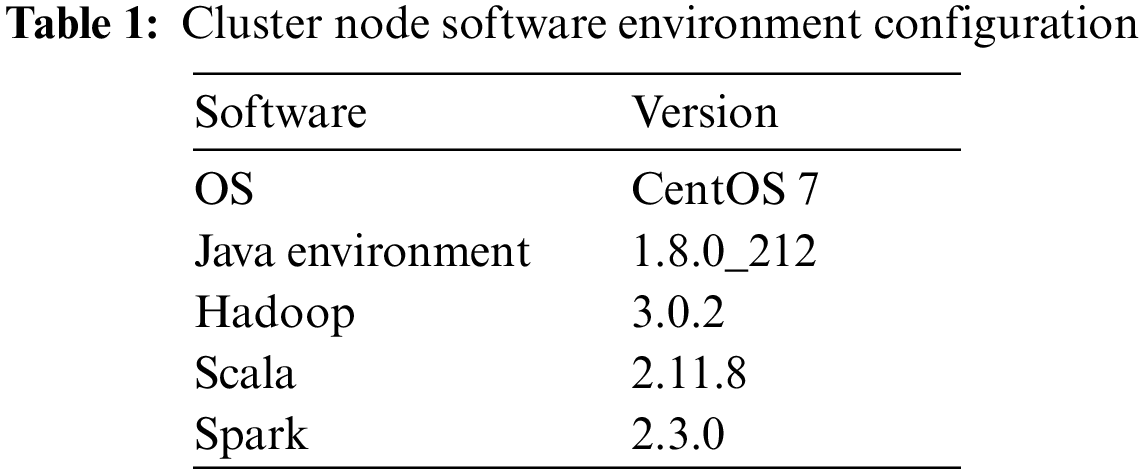
A private cloud cluster was built on a physical host using VMware Workstation Pro virtual machine software, consisting of three Linux virtual machines, including one Master node and two Worker nodes. The Master node is configured with 4 GB of RAM, 8 cores, and 50 GB of hard disk space, and each Worker node is configured identically with 2 GB of RAM, 8 cores, and 50 GB of hard disk space. Each node is assigned a dynamic IP address for configuration and identification. In addition, the nodes are linked ssh-free, so that Hadoop can execute applications for each node and start or shut down various processes. For better stability of the cluster, the major software version numbers of each node are shown in Table 1.
4.2 Implementing Algorithm Parallelization in Spark Platform
Due to the high time complexity of the traditional CLARANS algorithm, it takes a lot of time to process large-scale datasets. If the parallelized CLARANS algorithm can be implemented, it can significantly reduce the algorithm running time. In this paper, we choose to develop an IDEA environment with a Scala plug-in installed to parallelize the CLARANS algorithm. The dependencies required by the algorithm are automatically imported through the project management tool Maven.
Compared with the stand-alone algorithm, the distributed algorithm needs to compute on multiple machines and store the data to be processed in the distributed file system HDFS. Then the data is preprocessed using the map and glom operators in the Spark platform. The initial cluster centroids are randomly generated in the dataset using the sample operator, and then the initial set of centroids is collected by the collect operator and packed into broadcast variables so that each node in the cluster has a copy of the data backup [29,30]. The cost incurred after replacing the cluster centroids is calculated using the mapPartitions operator partitioning, and an accumulator is used to determine whether to perform the replacement operation.
To address the problem of local optima in clustering results caused by the selection of initial centers and to reduce redundant computations and improve parallel efficiency, this paper proposes the following optimizations. The paper uses morphological similarity distance as the measurement distance and assumes an original data set dataset = {x1,x2,…,xn}, where n represents the number of original data sets, and xi represents a d-dimensional vector. First, K initial clustering centers are selected according to the Max-distance criterion, and then the CLARANS clustering algorithm is used to calculate the positional relationship between data points and K clustering centers, assigning each data point to its nearest center. Next, the K centers and network spatial information are updated, and this process is repeated until the clustering centers no longer change or the specified number of iterations is reached.
According to the IPCC, 30 years is generally used as the base year for the analysis of the current situation in climate change research. The analysis of 30 years of meteorological data can reflect the current climate situation well, understand the causes of climate change in the past 30 years, and provide a scientific and reliable basis for future climate change research.
The data selected for this paper were downloaded from the China Meteorological Science Data Sharing Network for the daily value dataset of Chinese surface climate information for 752 stations nationwide from January 1, 1988, to December 31, 2018, where the data format was: zone station number, year, month, day, precipitation at 20–20 h, average wind speed, maximum wind speed, minimum wind speed, great wind speed, the wind direction of great wind speed, average home station barometric pressure The average surface temperature, average temperature, maximum daily temperature, minimum daily temperature, sunshine hours, average relative humidity, minimum relative humidity.
Import all weather data into HDFS.
4.3.2 Analysis of Clustering Effects
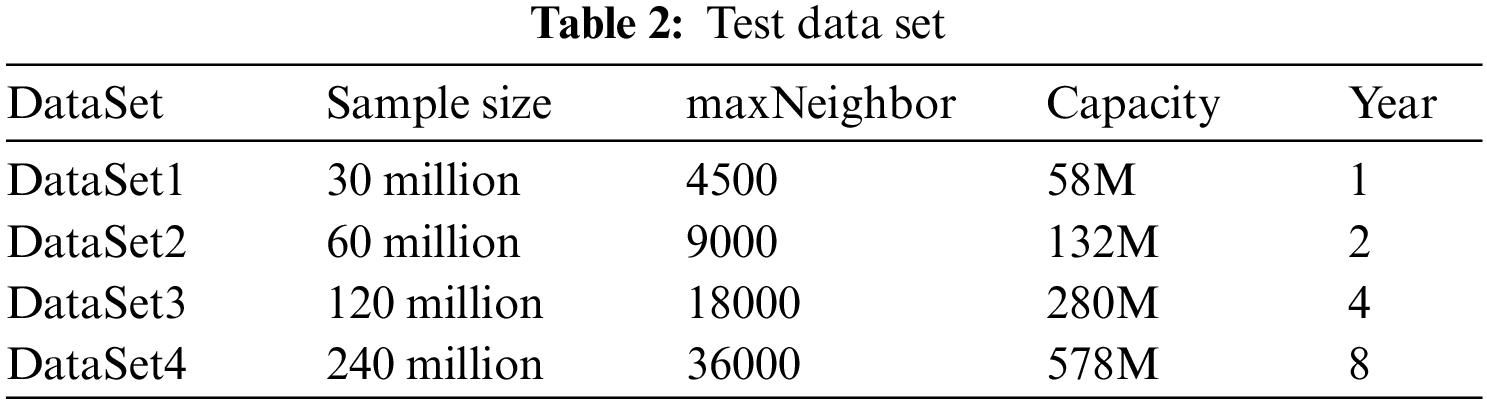
To investigate the performance of the parallel CLARANS clustering algorithm, the datasets from 2011–2018 were used as test data and they were divided into four datasets of proportional size, as shown in Table 2, and the data in the datasets were planned to be divided into five clusters.
The CLARANS, k-means, k-means++, and Partitioning Around Medoid (PAM) algorithms are run 10 times on DataSet1-DataSet4, and the obtained clustering results are shown in Fig. 5 and are analyzed for comparison. The k-means++ algorithm improves the selection of initial centroids, and the main optimization method is to ensure that the initial cluster centroids are as far apart as possible. The PAM algorithm is a kind of k-medoid algorithm, which has the advantages of clustering under different distance metrics and dealing with noise and outliers. The disadvantage is that the algorithm complexity is high, and it requires a lot of computation and storage space.

Figure 5: Distribution of clustering cost for different data sets
From the clustering cost distribution graph shown above, we can see that the clustering effect of the CLARANS algorithm implemented in this paper is close to the k-means algorithm implemented on Spark MLlib itself, and thus we can conclude that the CLARANS algorithm implemented in this paper is effective. From the analysis of the experimental results, it can be concluded that the CLARANS algorithm has the best clustering effect among the four algorithms mentioned above, in addition, it has a better clustering effect on large datasets [31], is more robust, and is not affected by outlier points or other extreme values in the data set. However, due to the random nature of the initial centroid selection, the clustering cost results of the CLARANS algorithm fluctuate up and down each time. Therefore, the algorithm needs to be run several times for clustering to take the average value.
4.3.3 Parallel Performance Analysis
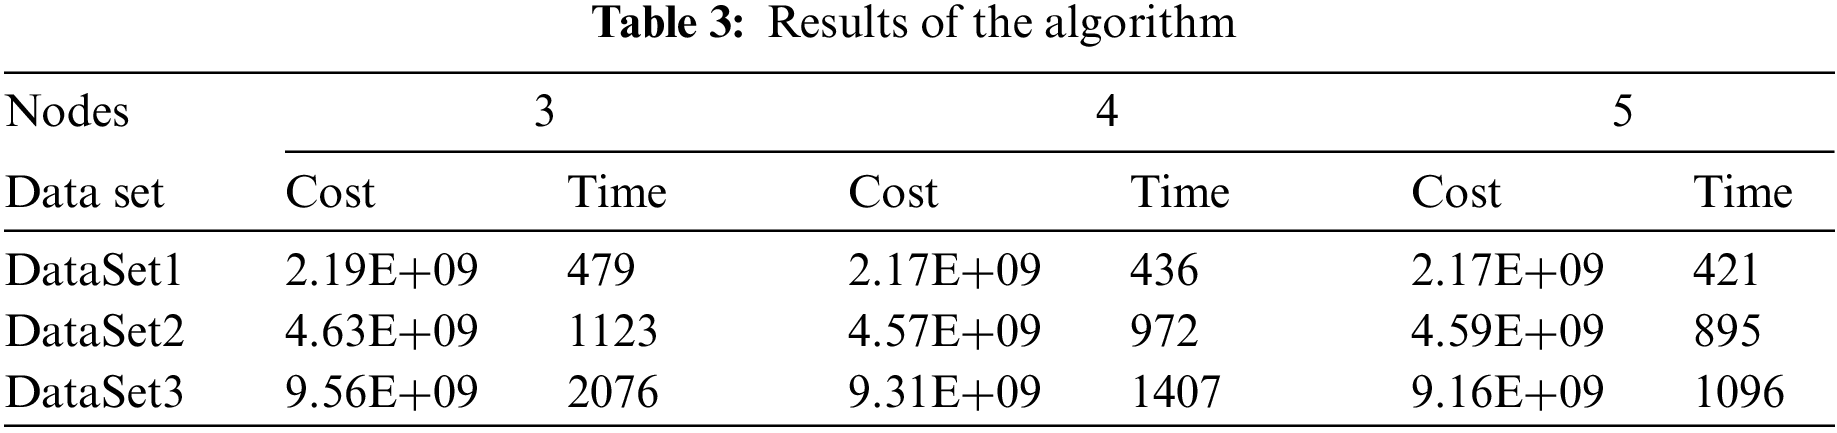
To verify the parallelization performance of the CLARANS algorithm, this section uses DataSet1-DataSet3 to run in Spark clusters with a different number of active nodes and records the clustering time and clustering cost of each algorithm. The results are shown in Table 3. The clustering time units in the table in this paper are all in seconds.
There are three general evaluation methods for distributed parallel algorithms, namely Speedup analysis, Scaleup analysis, and Sizeup analysis, which are used to compare the runtime strengths and weaknesses of parallel algorithms [32].
Speedup is the ratio of the time consumed by the same task running in a single node and a multi-node cluster environment, respectively. Keeping the dataset constant, the results after running the algorithm are tested by varying the number of nodes in the cluster, as shown in Eq. (16), where T(1) is the time consumed by the task running on a single node, and T(m) is the time consumed by the task running on m nodes. If Speedup can maintain a linear growth with m, it means that multiple nodes can increase the performance well.
As shown in Fig. 6, the acceleration ratio of the CLARANS algorithm can be calculated from the clustering time recorded in Table 3. As can be seen from the line graph, the speedup ratios vary across different data sets, and it is difficult to maintain a linear growth in speedup ratios for larger data sets. As the number of active nodes in the cluster increases, the effect of parallel acceleration of the algorithm tends to decrease. In addition, if the dataset being processed is smaller than the slice size of 128 MB in HDFS, the computation will only occur on one node in the cluster. At this point, increasing the number of nodes does not improve the efficiency of algorithmic parallelism, but rather causes a decrease in efficiency due to the communication and initialization among the nodes in the cluster. Therefore, the Spark cluster is not suitable for processing small data sets.

Figure 6: Speedup ratio line graph
China’s vast territory spans a wide range of latitudes and features diverse landscapes, including high mountains in the west and low plains in the east. These geographical factors contribute to China’s rich and varied climate, which can be divided into different types based on regional characteristics. For instance, the eastern part of China is characterized by a monsoon climate, while the northwestern part mostly experiences a temperate continental climate, and the Qinghai-Tibet Plateau is marked by a highland mountain climate. By understanding the local climate through climate zoning, people can make better use of the available climate resources and promote local development in a sustainable manner, which has significant social, economic, and scientific implications.
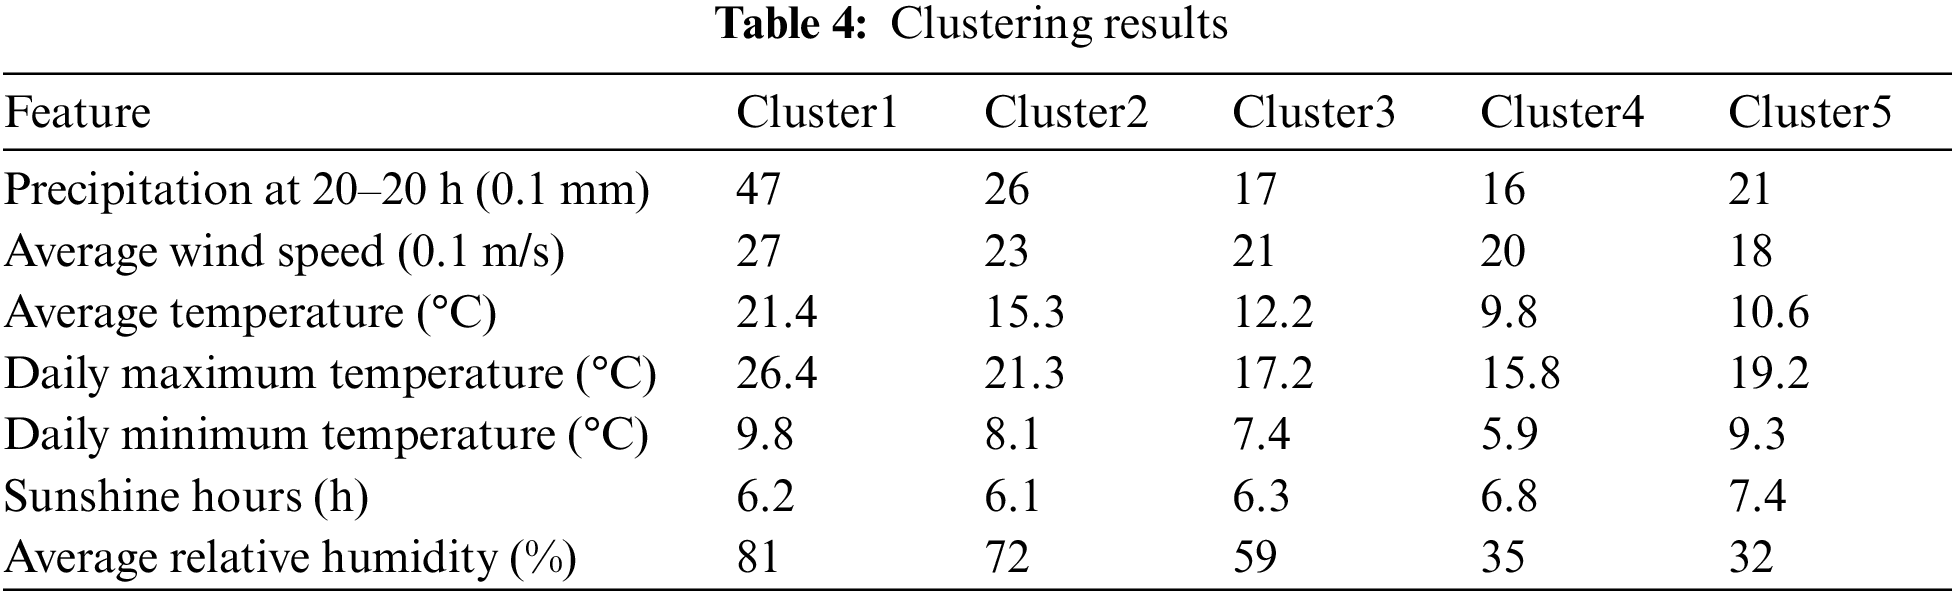
In this paper, a total of 30 years of data from 752 meteorological stations across the country from 1988–2018 are taken as the clustering data, and the number of clustering centers is set k = 5, run the CLARANS algorithm 10 times to take the average value, the average of 23 iterations each time, the obtained clustering center results are shown in Table 4.
As shown in Table 5, the representative cities in each of the five climate regions were selected and the local annual average meteorological data were found from the National Meteorological Science Data Center. Through comparative analysis, the weather data of the center point clustered by the CLARANS algorithm and the annual average weather data of the representative cities in the five climate regions match, which proves that the CLARANS algorithm implemented in this paper has good applicability to the weather data and has certain practical guidance significance for the research of climate region classification.

With the increasing amount of meteorological data being generated, traditional stand-alone computing systems are no longer sufficient to handle the large-scale data processing and analysis required in meteorological research and applications. The adoption of big data distributed parallel computing technology can significantly improve the efficiency and accuracy of meteorological data processing and mining, enabling more accurate weather forecasting, climate modeling, and disaster prevention and mitigation.
This study introduces the Hadoop cloud computing platform and Spark computing framework under Apache. The CLARANS clustering algorithm is parallelized in Spark platform using Scala programming language. In this paper, the morphological similarity distance is adopted as the similarity measurement standard instead of Euclidean distance, which improves clustering accuracy. Furthermore, the issue of local optima caused by an improper selection of initial clustering centers is addressed by utilizing the max-distance criterion, and the k-means, k-means++, and PAM algorithms are introduced for comparison. It is found that the CLARANS algorithm has the best operational efficiency and clustering accuracy of the four algorithms. The CLARANS algorithm is more robust in handling large data sets and can reduce the interference of outlier points in the data set on the clustering results. Spark clusters are also built and the parallelization performance of the CLARANS algorithm is verified by computational speed-up ratio in the clusters. The CLARANS algorithm is applied to China’s climate region classification, and the analysis of the clustering results proves the feasibility and practicality of the algorithm. This algorithm has a positive effect on the clustering analysis of massive meteorological data and deserves attention in scientific research activities.
Since the initial centroid selection of the CLARANS algorithm is random, it is easy to get the local optimal solution, and in future research, the initial centroid selection can be optimized by genetic algorithms to improve the clustering performance. Meanwhile, the time complexity of the CLARANS algorithm is high, and the idea of grid clustering can be introduced in the next step to optimize the time complexity of the algorithm.
Funding Statement: This work was supported by the National Natural Science Foundation of China (Grant No. 62101275 and 62101274).
Conflicts of Interest: The authors declare that they have no conflicts if interest to report regarding the present study.
References
1. R. Aggarwal, J. Verma and M. Siwach, “Small files’ problem in Hadoop: A systematic literature review,” Journal of King Saud University—Computer and Information Sciences, vol. 34, no. 10, pp. 8658–8674, 2022. [Google Scholar]
2. J. Zhang and M. Lin, “A comprehensive bibliometric analysis of Apache Hadoop from 2008 to 2020,” International Journal of Intelligent Computing and Cybernetics, vol. 16, no. 1, pp. 99–120, 2022. [Google Scholar]
3. S. Selvarajan, H. Manoharan, T. Hasanin, R. Alsini, M. Uddin et al., “Biomedical signals for healthcare using Hadoop infrastructure with artificial intelligence and fuzzy logic interpretation,” Applied Sciences, vol. 12, no. 10, pp. 5097–5112, 2022. [Google Scholar]
4. G. B. Cong and V. P. Cong, “A framework for similarity search in streaming time series based on Spark streaming,” Mobile Networks and Applications, vol. 27, no. 5, pp. 2084–2097, 2022. [Google Scholar]
5. M. Aksa, J. Rashid, M. Wasif Nisar, T. Mahmood, H. Kwon et al., “Bitmapaligner: Bit-parallelism string matching with mapreduce and hadoop,” Computers, Materials & Continua, vol. 68, no. 3, pp. 3931–3946, 2021. [Google Scholar]
6. B. Natsagdorj, S. Dalantai, E. Sumiya, Y. Bao, S. Bayarsaikhan et al., “Assessment of some meteorology data of average monthly air temperature over Mongolia using digital elevation model (dem) and Gis techniques,” The International Archives of the Photogrammetry, Remote Sensing and Spatial Information Sciences, vol. 43, no. 4, pp. 117–121, 2021. [Google Scholar]
7. J. Dean and S. Ghemawat, “MapReduce: Simplified data processing on large clusters,” in Proc. of the 6th Symp. on Operating Systems Design and Implementation, San Francisco, USA, pp. 137–150, 2004. [Google Scholar]
8. S. Ghemawat, H. Gobioff and S. Leung, “The google file system,” in Proc. of the Nineteenth ACM Symp. on Operating Systems Principles, New York, NY, USA, pp. 29–43, 2003. [Google Scholar]
9. J. Dean and S. Ghemawat, “MapReduce: A flexible data processing tool,” Communications of the ACM, vol. 53, no. 1, pp. 72–77, 2010. [Google Scholar]
10. X. Meng, J. Bradley, B. Yavuz, E. Sparks, S. Venkataraman et al., “MLlib: Machine learning in Apache Spark,” The Journal of Machine Learning Research, vol. 17, no. 1, pp. 1235–1241, 2016. [Google Scholar]
11. M. Zaharua, R. S. Xin, P. Wendell, T. Das, M. Armbrust et al., “Apache Spark: A unified engine for big data processing,” Communications of the ACM, vol. 59, no. 11, pp. 56–65, 2016. [Google Scholar]
12. J. A. Hartigan and M. A. Wong, “A K-means clustering algorithm,” Journal of the Royal Statistical Society, vol. 28, no. 1, pp. 100–108, 1979. [Google Scholar]
13. D. M. Blei, A. Y. Ng and M. I. Jordan, “Latent dirichlet allocation,” Journal of Machine Learning Research, vol. 3, no. 1, pp. 993–1022, 2003. [Google Scholar]
14. W. Yan, U. Brahmakshatriya, Y. Xue, M. Gilder and B. Wise, “p-PIC: Parallel power iteration clustering for big data,” Journal of Parallel and Distributed Computing, vol. 73, no. 3, pp. 352–359, 2013. [Google Scholar]
15. D. Reynolds, “Gaussian mixture models,” Encyclopedia of Biometrics, vol. 741, no. 1, pp. 659–663, 2009. [Google Scholar]
16. M. Mohamed Iqbal and K. Latha, “A parallel approach for sentiment analysis on social networks using spark,” Intelligent Automation & Soft Computing, vol. 35, no. 2, pp. 1831–1842, 2023. [Google Scholar]
17. D. Xia, Y. Bai, Y. Zheng, Y. Hu, Y. Li et al., “A parallel SP-DBSCAN algorithm on spark for waiting spot recommendation,” Multimedia Tools and Applications, vol. 81, pp. 4015–4038, 2022. [Google Scholar]
18. H. Alazzam, O. A. Alghanam and A. Sharieh, “Best path in mountain environment based on parallel A* algorithm and Apache Spark,” The Journal of Supercomputing, vol. 78, pp. 5075–7094, 2022. [Google Scholar]
19. H. Cui, S. Niu, K. Li, C. Shi, S. Shao et al., “A k-means++ based user classification method for social e-commerce,” Intelligent Automation & Soft Computing, vol. 28, no. 1, pp. 277–291, 2021. [Google Scholar]
20. L. He, D. Ouyang, M. Wang, H. Bai, Q. Yang et al., “A method of identifying thunderstorm clouds in satellite cloud image based on clustering,” Computers, Materials & Continua, vol. 57, no. 3, pp. 549–570, 2018. [Google Scholar]
21. J. Yuan, “An anomaly data mining method for mass sensor networks using improved PSO algorithm based on Spark parallel framework,” Journal of Grid Computing, vol. 18, pp. 251–261, 2020. [Google Scholar]
22. S. Zhang, M. Shen and Y. Yu, “Research on student big data portrait method based on improved k-means algorithm,” in 2021 3rd Int. Academic Exchange Conf. on Science and Technology Innovation (IAECST), Guangzhou, China, pp. 146–150, 2021. [Google Scholar]
23. A. S. Ali, A. Adil, R. A. Ur, A. W. Arshad, A. Saeed et al., “k-means and k-medoids: Cluster analysis on birth data collected in city Muzaffarabad, Kashmir,” IEEE ACCESS, vol. 8, no. 1, pp. 151847–151855, 2020. [Google Scholar]
24. C. Li, Q. Cai and Y. Luo, “Dynamic data replacement and adaptive scheduling policies in spark,” Cluster Computing, vol. 25, no. 2, pp. 1421–1439, 2022. [Google Scholar]
25. E. Schubert and J. Peter, “Faster K-Medoids clustering: Improving the PAM, CLARA, and CLARANS algorithms,” Similarity Search and Applications, vol. 1, no. 1, pp. 171–187, 2019. [Google Scholar]
26. Y. Fu and W. Zhou, “A heterogeneous parallel implementation of the Markov clustering algorithm for large-scale biological networks on distributed CPU-GPU clusters,” The Journal of Supercomputing, vol. 78, no. 7, pp. 9017–9037, 2022. [Google Scholar]
27. K. Li, L. Yuan, Y. Zhang and G. Chen, “An accurate and efficient large-scale regression method through best friend clustering,” IEEE Transactions on Parallel and Distributed Systems, vol. 33, no. 11, pp. 3129–3140, 2022. [Google Scholar]
28. Q. He, Q. Wang, F. Zhuang, Q. Tan and Z. Shi, “Parallel CLARANS clustering based on MapReduce,” Energy Procedia, vol. 13, no. 1, pp. 3269–3279, 2011. [Google Scholar]
29. P. Ajay, B. Nagaraj, R. A. Kumar, R. Huang and P. Ananthi, “Unsupervised hyperspectral microscopic image segmentation using deep embedded clustering algorithm,” Scanning, vol. 2022, no. 1, pp. 25–39, 2022. [Google Scholar]
30. A. Youseef, “A new meta-heuristics data clustering algorithm based on tabu search and adaptive search memory,” Symmetry, vol. 14, no. 3, pp. 623–635, 2022. [Google Scholar]
31. R. T. Ng and H. Jiawei, “CLARANS: A method for clustering objects for spatial data mining,” IEEE Transactions on Knowledge and Data Engineering, vol. 14, no. 5, pp. 1003–1016, 2002. [Google Scholar]
32. A. Gupta, H. K. Thakur, R. Shrivastava, P. Kumar and S. Nag, “A big data analysis framework using Apache Spark and deep Learning,” in 2017 IEEE Int. Conf. on Data Mining Workshops (ICDMW), New York, NY, USA, pp. 9–16, 2017. [Google Scholar]
Cite This Article
 Copyright © 2023 The Author(s). Published by Tech Science Press.
This work is licensed under a Creative Commons Attribution 4.0 International License , which permits unrestricted use, distribution, and reproduction in any medium, provided the original work is properly cited.
 Downloads
 Citation Tools