
 Submit a Paper
 Propose a Special lssue
 Open Access
ARTICLE
Improved Transportation Model with Internet of Things Using Artificial Intelligence Algorithm
1 Cybersecurity Research Group, Faculty of Computing and Informatics, University Malaysia Sabah, Jalan UMS, Kota Kinabalu, Sabah, 88400, Malaysia
2 National Advanced IPv6 Centre (NAv6), Universiti Sains Malaysia, Gelugor, Penang, 11800, Malaysia
3 Department of Electronics and Communication Engineering, Panimalar Engineering College, Poonamallee, Chennai, 600123, Tamilnadu, India
4 Department of Computer Science & Engineering, Kebri Dehar University, Kebri Dehar, 250, Ethiopia
5 College of Computing and Information Technology, University of Doha for Science and Technology, Doha, 24449, Qatar
* Corresponding Author: Ayman Khallel Al-Ani. Email:
Computers, Materials & Continua 2023, 76(2), 2261-2279. https://doi.org/10.32604/cmc.2023.038534
Received 16 February 2022; Accepted 07 March 2023; Issue published 30 August 2023
 View Full Text
 Download PDF
Abstract
In this paper, the application of transportation systems in real-time traffic conditions is evaluated with data handling representations. The proposed method is designed in such a way as to detect the number of loads that are present in a vehicle where functionality tasks are computed in the system. Compared to the existing approach, the design model in the proposed method is made by dividing the computing areas into several cluster regions, thereby reducing the complex monitoring system where control errors are minimized. Furthermore, a route management technique is combined with Artificial Intelligence (AI) algorithm to transmit the data to appropriate central servers. Therefore, the combined objective case studies are examined as minimization and maximization criteria, thus increasing the efficiency of the proposed method. Finally, four scenarios are chosen to investigate the projected design’s effectiveness. In all simulated metrics, the proposed approach provides better operational outcomes for an average percentage of 97, thereby reducing the amount of traffic in real-time conditions.Keywords
Most people rely on transportation as an essential part of their daily lives. According to a recent poll, most transportation systems have various issues because of heavy traffic brought on by unreliable information systems. It is possible to construct efficient transportation in the real world and allow everyone to move unrestrictedly, provided everyone knows the precise traffic status along their specific route. Different transportation systems can be integrated using the present technological platform, and management design can be offered using cloud-based apps. The Internet of Things (IoT) plays a significant role in connection establishment and route management processes whenever cloud apps are used. As a result, this section discusses the fundamental hypotheses that lead to developing transportation applications with specific background conditions. Some limits are designed and articulated in various ways and factors to give an overview of the infrastructure systems that the IoT now represents. Therefore, it is possible to develop recognizable devices that increase support for the transportation application platform by looking at different structures. Reference [1] uses a big data format to construct a cloud-based architecture where all sorts of transportation systems that enter detection ranges are immediately saved in different cloud platforms. However, the majority of users will lose connectivity in the event of a sudden communication network failure, necessitating the provision of offline cloud analysis, which is considerably more challenging to accomplish. Even some cloud-based installation methods favor a precise authentication mechanism where information exchange is forbidden. As a result, an innovative IoT framework is developed, employing clever strategies to allow everyone to access information, even in subways [2].
Some of the flows in the transportation system can be known to the public due to such intelligent device design. In this situation, information is provided to numerous users. It is common knowledge that most decisions in transportation applications are only made dynamically, preventing the use of any transport information that depends on scheduling. Such dynamic processes allow for the parallel processing of all information, which may be used for management and control strategies [3]. Additional computer tests must be conducted in realtime whenever control strategies are discussed to determine the effectiveness of transport information processing applications. However, it has been discovered that because computational experiments have minimal control points, managing strategies are significantly more challenging to implement. To address the flaw in the control setup process, a novel management approach that considers both network security and privacy has been developed [4]. A complex non-linear system is integrated during the design phase, and random behavior analysis is done at simple pattern segments. Due to the unpredictable nature of transportation systems, most information is shared correctly, preventing information breakdown during moments of high traffic. Implementing a machine learning technique and IoT practices is required to protect the transportation system from such link failures [5]. A traffic management system is preferred because machine learning optimization offers improved looping techniques that reduce congestion and delay in the intended networks. However, the aforementioned energy-intensive reduction strategy necessitates adding more resources to the system in case of a breakdown. Therefore, some critical characteristics are implemented to decrease additional resources and transform the transportation system for smart city application areas [6]. For IoT and machine learning to function well for transportation systems, only four significant resources must be allocated; nevertheless, in addition to these four primary considerations, several secondary constraints must be examined before implementation scenarios.
Most optimization strategies are based on the energy allotted for a particular activity, hence forecasting the arrival time [7]. Therefore, it is possible to create an efficient data center that delivers the finest performance outcomes across the entire process when periods are forecasted in transportation systems. As a result, most individuals can anticipate all essential actions that will lessen traffic in neighboring areas when service level agreements are satisfied. Additionally, some route optimization processes are carried out via IoT management processes. Only a limited number of vehicles are allowed over a short period [8], and additional transportation is only permitted regularly. The main benefit of the regular interval path optimization technique is that low-sensitivity paths are used since most distribution patterns are attained at the right demand times. However, changing low-sensitivity channels to improve operational research patterns is never practicable in the case of large-scale transportation applications [9].
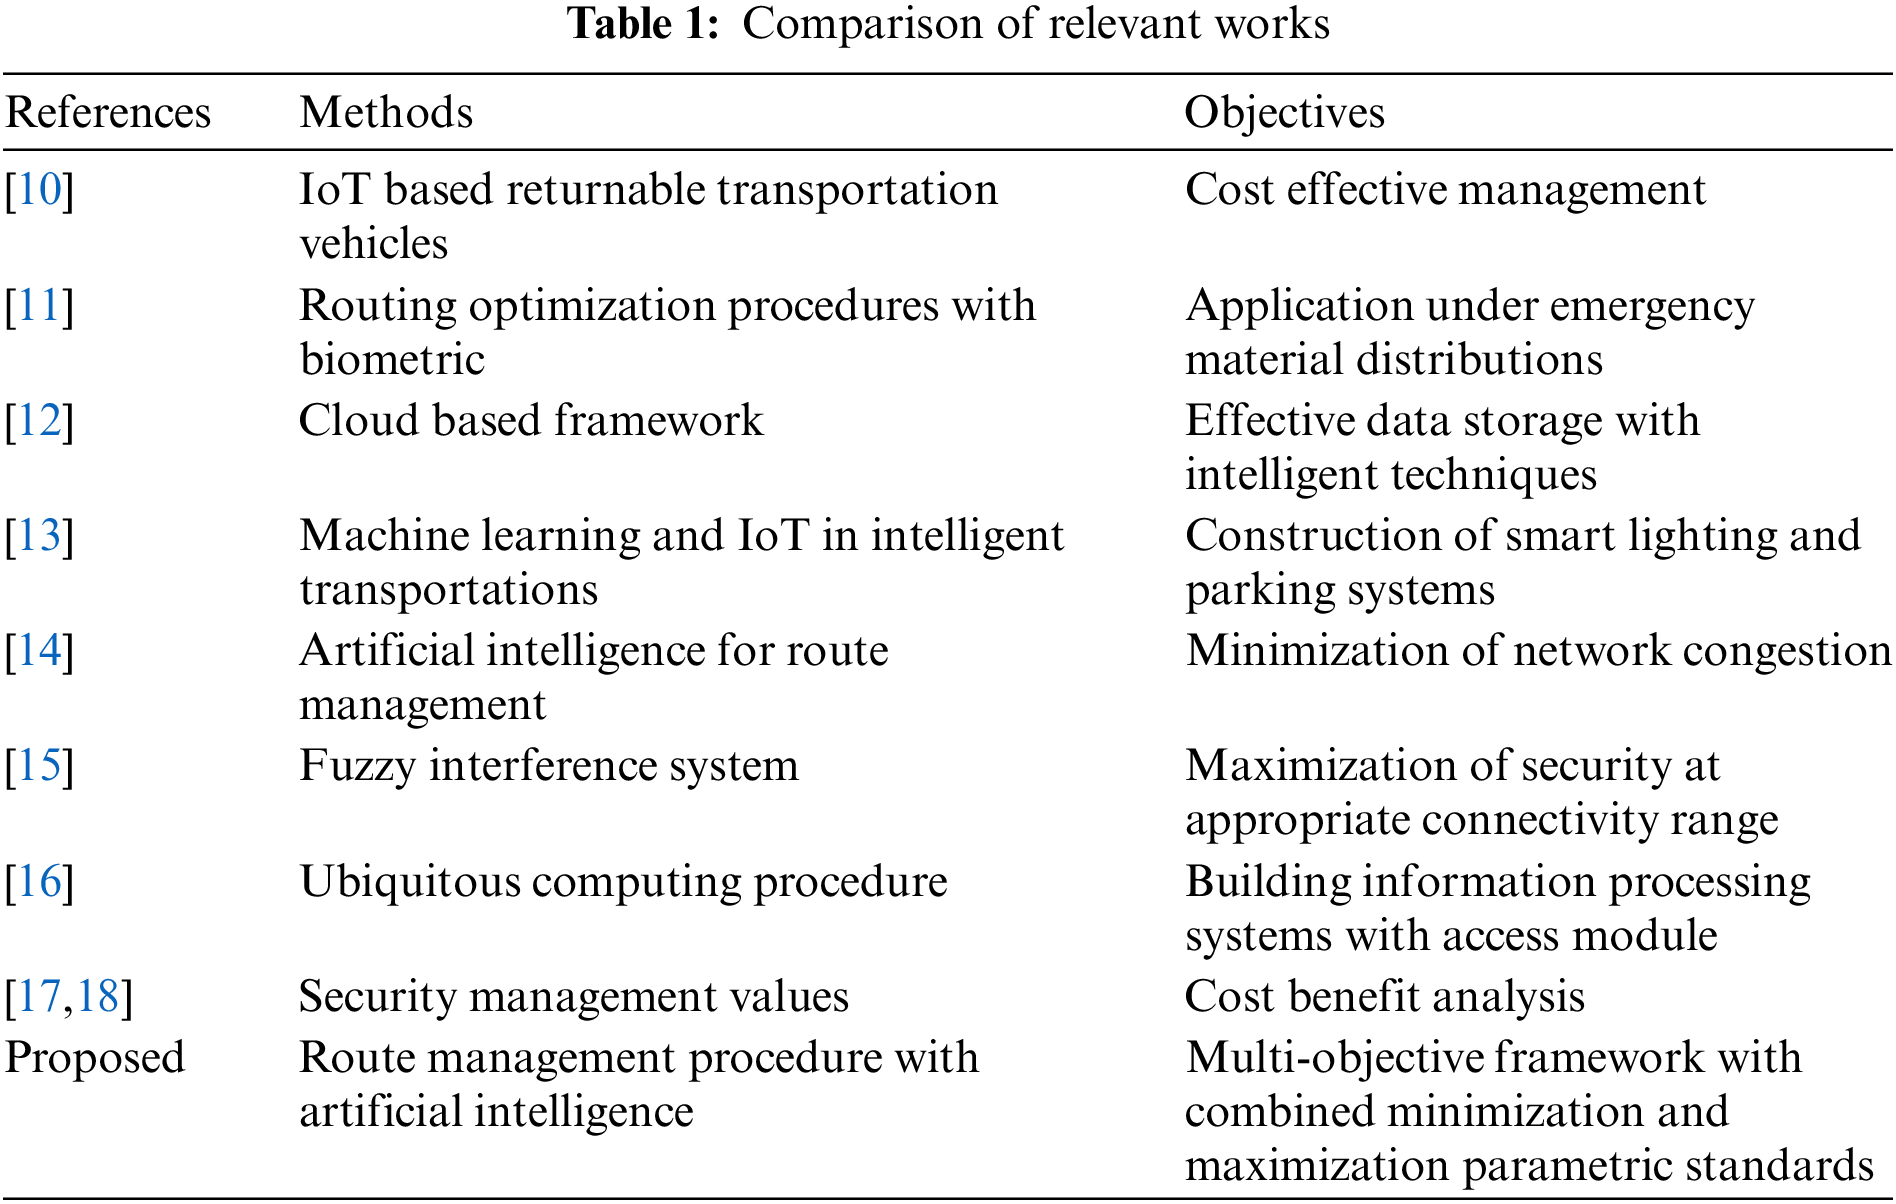
Furthermore, by adopting specific system specification designs, it is feasible to achieve various research patterns in the field of transportation science. Table 1 compares pertinent works using different objective patterns in a transportation application. The current models were created with a single-aim framework, establishing effective routes for lowering system traffic. However, the proposed work uses an analytical model with a multi-objective parametric framework coupled with an AI algorithm to reduce the overall load on known routes.
1.2 Research Gap and Motivation
Even though many existing approaches are present for determining the conditions of transportation applications with distinct objective functions, most of the designed system still needs to be formulated based on determining loading conditions. Moreover, from the observed models, a unique network framework concerning geographical locations is not separated; thus, efficiency in the detection process is highly complex. In addition, the measurements from the existing approach are not made with time representations, as continuous monitoring periods are provided. Thereby data is transmitted in unnecessary circumstances. Also, significant gaps in the automated mode of choosing the nearest routes are not examined in any designed method; thus, the transportation system faces high traffic conditions where queuing conditions still need to be changed.
The proposed method is designed with a unique mathematical model for testing and evaluations combined with an artificial intelligence algorithm to overcome the abovementioned gap. In this type of testing for transportation applications, the entire geographical area is separated into cluster zones, marking different positions for measurements. Due to such geographical divisions, data between two other clusters are transmitted to a central station, where control errors are minimized. Another advantage of the proposed method is that task functionality is simplified to increase the efficiency of the designed system. Hence effective routes are chosen for high-load vehicles, and as an outcome, traffic measures are followed with complete traffic reductions in selected route clusters.
The significant contributions of the proposed work are based on real-time monitoring of different transport systems to reduce the amount of traffic present at different routes by satisfying the following parametric objectives where mathematical models are formulated.
• To minimize the loading conditions of dynamic vehicles by providing high energy transfer using IoT and to divide the transportation regions into several cluster areas to reduce the task functionalities.
• To integrate the artificial intelligence algorithm with a designed mathematical model to maximize the data rate of IoT systems, thereby reducing the queuing periods of vehicles.
• To reduce the errors in control functions, thus increasing the efficiency of IoT edge computing and artificial intelligence algorithm.
The remainder of the paper is structured as follows: Section 2 provides the design of proposed transportation applications concerning load, efficiency, periods, and control functions. Section 3 integrates the designed model with an artificial intelligence algorithm with step-by-step implementation. Section 4 provides a deep insight into real-time examination and analysis of designed parametric functions where the objective function is represented. Finally, Section 5 concludes the paper with recommendations for future work.
A device that uses certain communication technologies can be designed with the help of the system model developed for the Internet of Things. Every time an IoT system is developed and run for a specific application, the device’s design must be original. Since emergencies are identified with acceptable functional parameters for transportation applications, the proposed system model is created using a particular method. The main issue with studying parametric system models in transportation applications is that the output units of IoT-integrated systems, including wireless sensors, need to be verified often to prevent dangerous operating circumstances. Therefore, using Eq. (1), the total load that is present for a specific transport section can be expressed as follows,
where,
Eq. (1) is formulated to determine the maximum load function with two parametric variables, such as dynamic energy and work functions defined for a particular vehicle. Hence if high loads are detected then the energy of the vehicle needs to be reduced in all transport sections. Eq. (1) identifies the first objective function that must be minimized for transportation devices to carry a single load. The aforementioned workload, however, can only be carried out within a single cluster; nevertheless, if two distinct clusters in two different locations are constructed, the functionality of the task can be calculated using Eq. (2) as shown below,
where,
Eq. (2) provides the mathematical expression related to allocated task measurements present at different cluster zones. In the proposed system the maximum level of loading tasks are performed with varying patterns of structure; therefore transport safety system is enabled for distinct task functions. According to Eq. (2), the support system for all modes of transportation must be divided into distinct structures. It is feasible to strengthen the safety of transportation operating systems thanks to such help in various clusters. Therefore, Eq. (3) can be used to express the data that exists between these two clusters as follows,
where,
Eq. (3) determines the data handling mechanism at different cluster areas where the entire data is converted into single representation cases. Since the data points are separated into cluster areas density of a particular region is chosen; therefore, data is transferred to the control center on a specific vehicle within a short period. Various data points are provided since Eq. (3) is presented as maximizing the likelihood of detection between two distinct clusters. Controls must be established between cluster points if the transport is passed between two different clusters. Therefore, using Eq. (4), the following control error functions are measured,
where,
Eq. (4) describes a detailed representation of control errors in previous report units, which must be minimized by providing low initial error values. To reduce the control errors, absolute measurements are taken at all control points, leading to reduced corresponding set values. The difference between the initial and final control faults will allow each cluster’s transport to run at high connectivity without experiencing any bearing issues. However, Equation’s definition of the two-point function can be used to determine the position accuracy of IoT-enabled transportation devices (5).
where,
Eq. (5) is implemented to mark distinct point functions for making the vehicle locate at calculated positions. This type of process provides the exact location of vehicles and if any changes are needed, then the next shortest path will be chosen in transport vehicles. The two positions specified in Eq. (5) may be distributed across a cluster or set of clusters in various geographical locations. Eq. (6) can be used to monitor the period of the vehicles if their position changes,
where,
Eq. (6) is incorporated with time series functions where the inward and exit period of vehicles are measured. The functionality of such time representations is made with position changes from one cluster to another, marking exact position changes. A better period for delivery circumstances without any traffic issues can be obtained if the time gap is minimized. Eq. (7) can be used to observe the effectiveness of a communication system using edge computing technologies under these delivery conditions, as shown below,
where,
Eq. (7) examines the maximum efficiency of vehicles after crossing from one cluster area to other areas with maximum idle periods. During these effective measurements, more packages are delivered in chosen shortest path and maximum efficiency needs to be achieved within short periods. A compact gadget that can be installed in both a control room and a vehicle is made using all the design models described in the equations above. As a result, Eq. (8) can be used to frame the parametric goal function as a multimodal analysis, as shown below,
The device model implements the two unique objective functions separately, which allows loops to be built independently and quickly to monitor the condition of transportation networks. However, using two-way optimization techniques, as explained in Section 3, is the only way to precisely quantify the efficiency of transportation routes.
Delivered communications must be placed correctly within the transportation system according to route planning rules. Transport trucks will only follow the route if there are any issues with route management, which will result in an incorrect application of the quality framework. As a result, the route management technique is integrated with the goal function, which is regarded as the initial phase of observation [19–22]. A small number of carriage-equipped transportation systems are initiated during this observation procedure with automatic driving capabilities, meaning that if a problem arises, the vehicle will be stopped immediately at any of the intersection sites using the red card signal. However, because the necessary gestures are already present, this route management system does not harm other surrounding vehicles. Therefore, a formal representation for the developed device is required to convey the data gestures to other vehicles, and this formulation is made using Eq. (10),
where,
Eq. (10) is formulated with gesture activities using single-point functionality where multiple route functions are avoided in the system. In the proposed system, gesture activities are made using symbolic representations, thereby making carter understand the mode of changing functionalities. Eq. (10) states that the source gesture points must be the same in emergency scenarios at all clusters. To prevent returning the same vehicle to the origin, it is essential to count the number of times a location has been visited using Eq. (11),
where,
Eq. (11) is represented to avoid the same path that is followed by different vehicles. In this type of determination, transports that are returning through the same paths will be reported with alarm messages, thereby avoiding the same transports to create traffic conditions. Eq. (12) must be used to calculate the number of queue points if the likelihood of failure is greater for the same route.
where,
Eq. (12) represents the procedure of queue minimization with reverse transport cases as the load vehicles are returned by using alternate path selection mechanisms. If a particular cluster area has more traffic, then in the immediate case, it will be redirected to other routes for reaching the destination. Hence, data and real-time queues are reduced, making a comfortable zone of operations. The initial step of the designed analytical model with route management procedure is as follows.
3.1 Step-by-Step Implementation of Route Management Procedure
t = input(‘enter the transportation cluster areas’);
x = sd(‘supply; demand’);
[m n] = size(t);
x1 = zeros(m, n);
sumc = 0;
sumr = 0;
for i = 1:m−1
sumc = sumc + x(i, n);
end
for j = 1:n−1
sumr = sumr + x(m, j);
end
if(sumc == sumr)
for i = 1:m
for j = 1:n
x11 = min(x(i, n), x(m, j));
x1(i, j) = x11;
x(i, n) = x(i, n)-x11;
x(m, j) = x(m, j)-x11;
end
end
else
disp(‘High load transportation’);
end
xre = 0;
for i = 1:m−1
for j = 1:n−1
xre = xre + (x(i, j).*x1(i, j));
end
end
disp([‘The alternate route]);
3.2 Artificial Intelligence for Transportation: Optimization Case
Since each cluster’s transportation detection process is autonomous, it is essential to incorporate an artificial intelligence pattern to ensure that all cars are tracked, and routes are forwarded correctly. The technique of choosing nearest neighbors by utilizing unknowable k values is carried out in the optimization procedure because it is still very tough to believe the apps on various gadgets today. The main benefit of using this calculating method in an artificial intelligence program is that transportation categorization difficulties may be handled straightforwardly. Additionally, all different types of detection can be performed without the need for underlying transportation data; as a result, the best path is chosen after monitoring all of the nearest neighbors. The system can also be created using non-linear regression situations, so the distances are given in order of increasing distance. If any differences with the current operation condition are discovered, the test point calculation for transportation can be done by using the sorted list. The planned system can respond to abrupt changes due to such operations, and even if different routes are chosen, users will receive information quickly. However, one of the main issues with the transportation application of an artificial intelligence algorithm is that it can be used for large infrastructures, making it inappropriate for scenarios involving small infrastructures [23–26]. Even at times, IoT plays a vital role in these applications. By contributing to security wearable devices or preventing malicious entries, IoT integration contributes in many ways [27–31]. Additionally, the system must match the current operation state and make the nearest neighbor decision before the allotted periods to accommodate minor infrastructure systems. In such situations, previous data will be gathered to match the state vector, and vehicles with considerably lower loads can be selected for these kinds of transportation networks. Additionally, only predicted results can be obtained for minor transportation systems; hence, Eq. (13) can be used to express the rational flow of traffic, which is measured in terms of volume, as follows,
where,
The maximum amount of data a transportation system can handle under all conditions is shown in Eq. (13). However, the speed of vehicle operation affects the volume of transportation applications, as shown in Eq. (14).
where,
Eq. (14) only applies to tiny transports where the action’s speed is constrained. Due to these restrictions, the data volume can be precisely tracked using Eq. (15), as shown below,
where,
Eq. (15) states that the difference in data volume is determined for a day when state vector samples can be matched without interference from outside transportation [18]. Therefore, using Eq. (16), the current period of representation is constrained to match the volume of data, as follows,
where,
Therefore, although the probability of degree matching may be easily achieved, the total time period of transportation systems must be decreased by previous trip periods. Fig. 1 further illustrates the integration process with the system model.
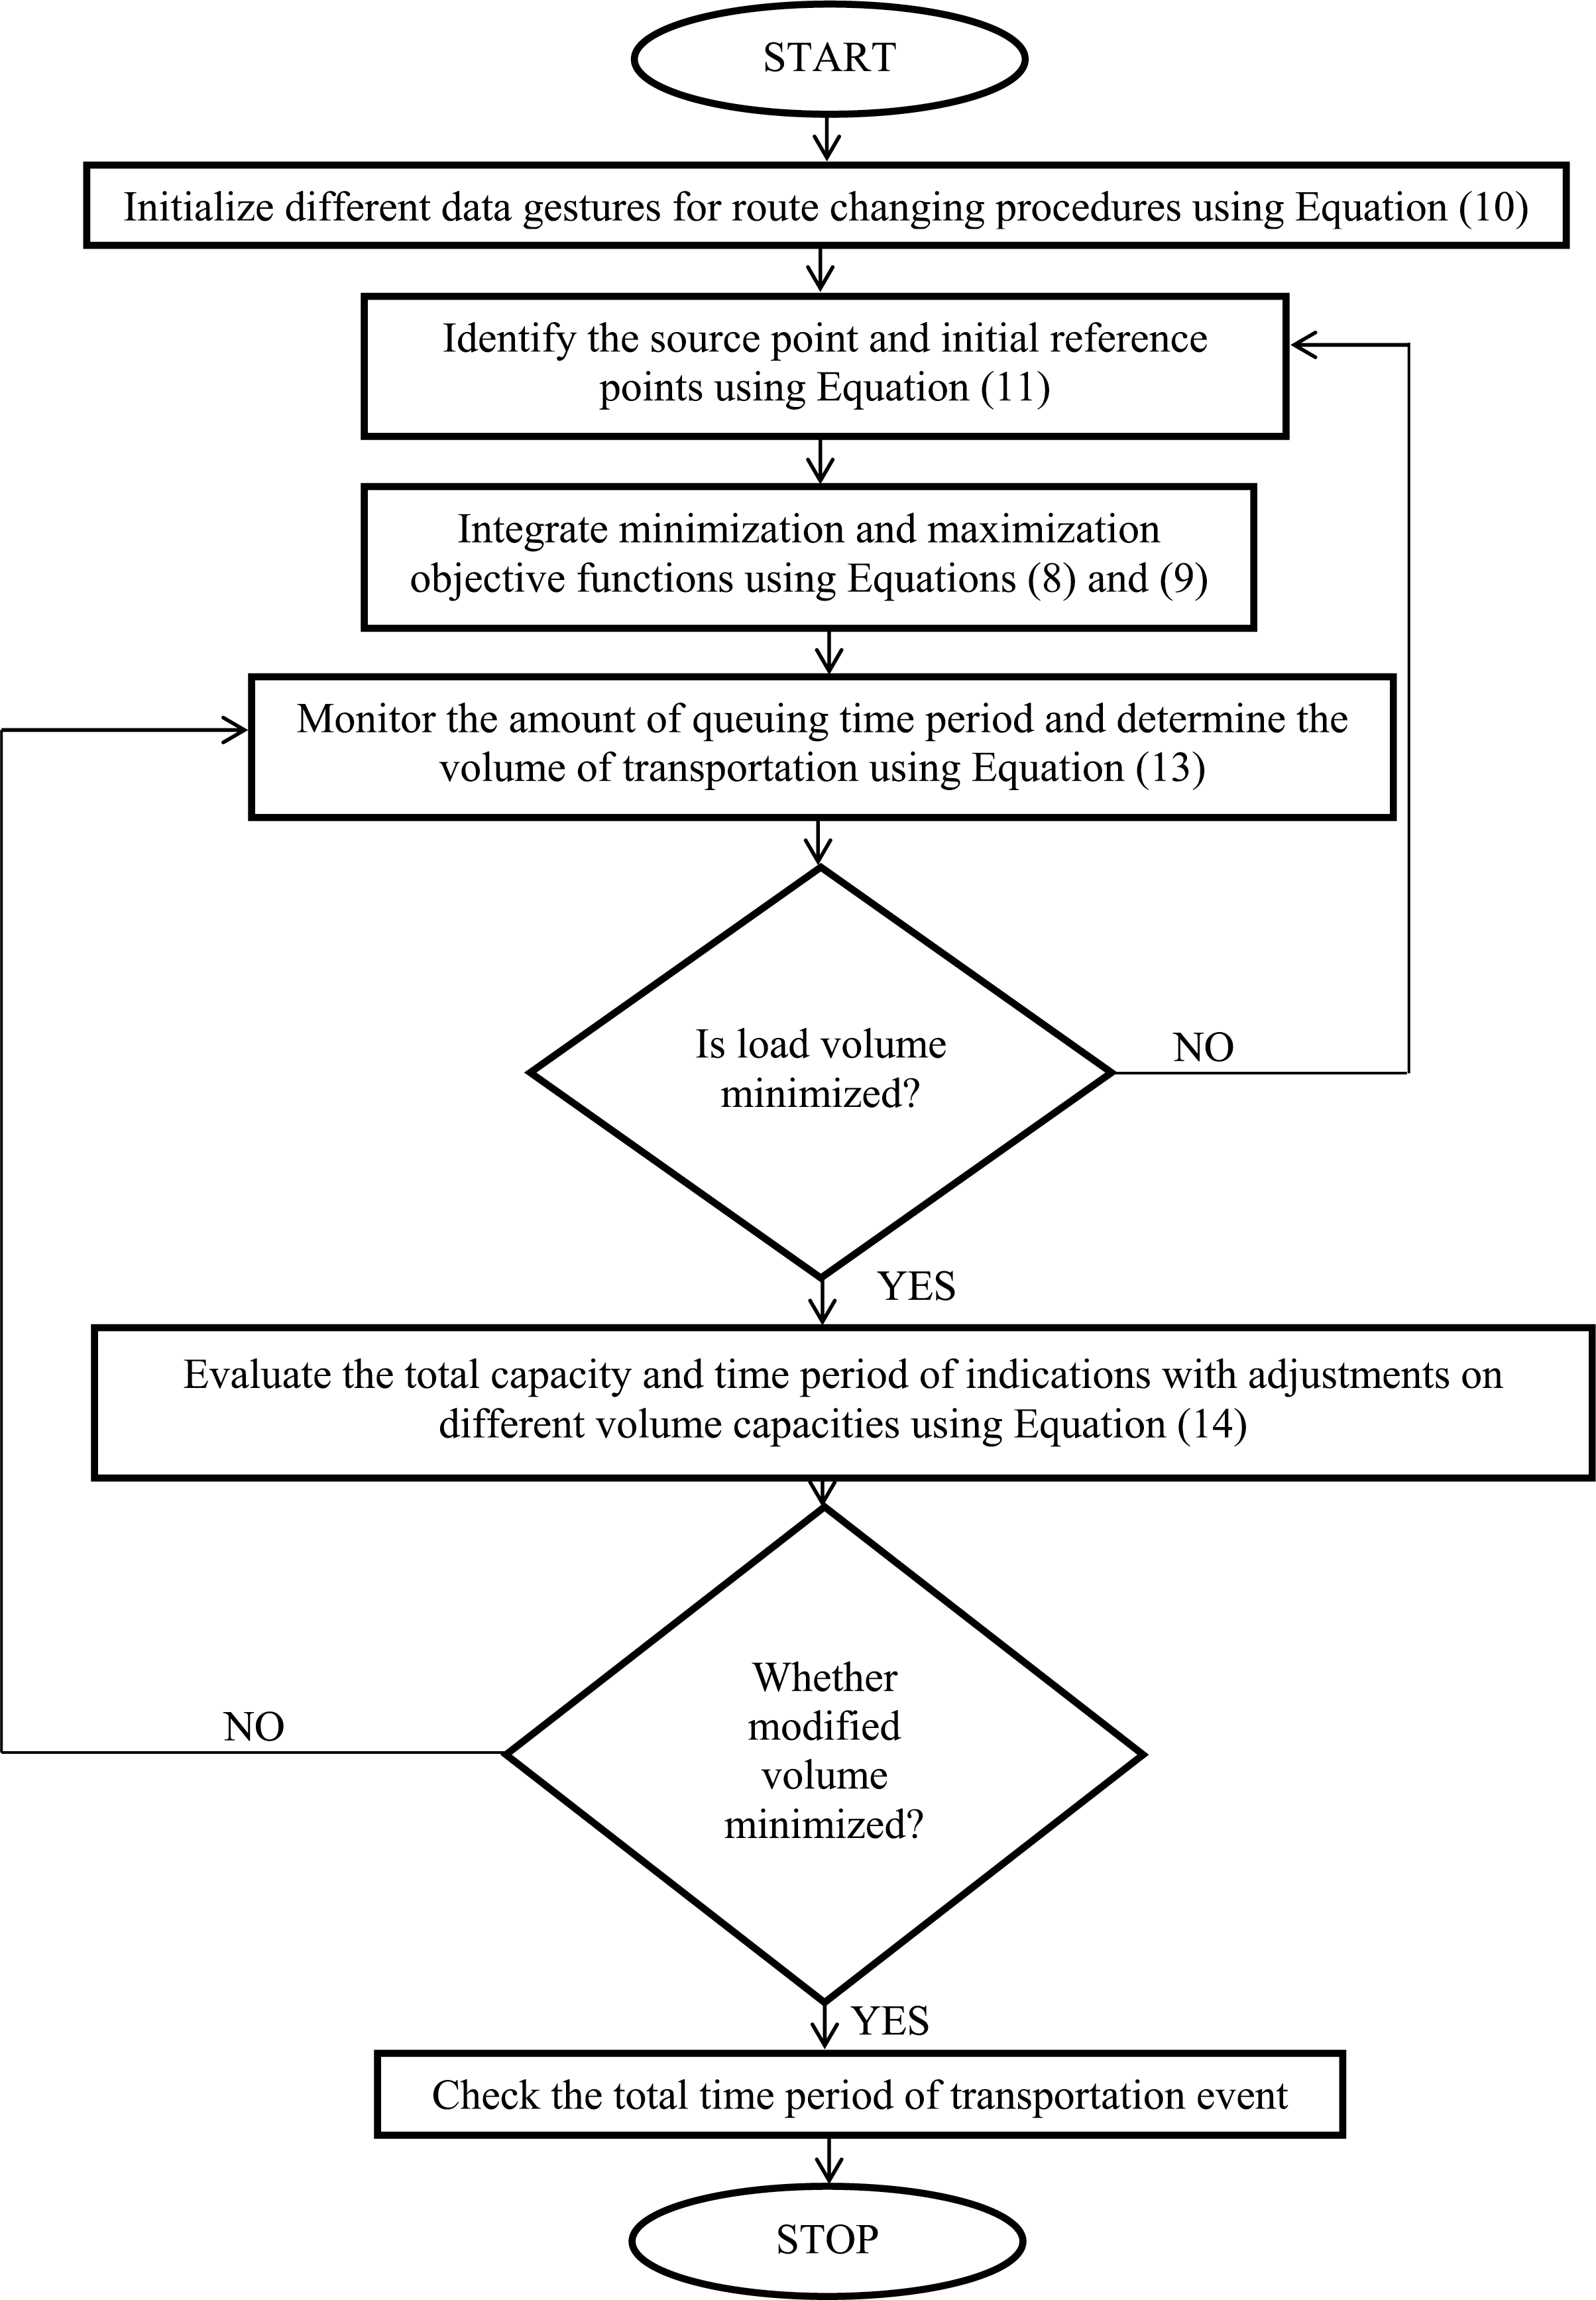
Figure 1: Flow chart of integration for transportation operations
3.3 Importance and Application
All the mathematical formulation related to transportation applications is essential in real-time applications where outcomes are examined using integrated simulation loops. The designed model can be used for discovering different routes numbered in sequence order, and this type of formulation differs from usual location monitoring cases. At the initial state, the mathematical functions are used for separating different cluster areas, thereby making the data handling unit to be much more simplified from standard representation cases. In the next stage, the total load at each cluster is marked, and high loading conditions are prevented, thereby reducing more traffic at each cluster region. Control error functions are determined at different positions when loading error monitoring occurs in the system. The main application area for such defined formulation in transportation is to achieve the best efficiency even at peak hour periods, as the proposed technique can choose multiple paths simultaneously.
To demonstrate the effectiveness of the suggested system model, certain experimental design functions are provided for real-time analysis in this section. An analytically-built programming loop is used to carry out the real-time experimental task. Therefore, several representations are used for every parametric analysis connected to transportation applications. Additionally, the functionality of wireless sensors is offered as an internal operation case study; as a result, device design techniques are combined with function representation. Furthermore, the newly developed device in the proposed method only uses wireless connectivity (IoT) for clustering range communication. Because of this, the experimental results are limited to a small number of clusters at several sites, integrating the actual operational values.
Additionally, system comparisons are performed using already-available data in which the complete device is linked to information systems for automatic vehicle transfer. These linkages make tracking every transport vehicle traveling from one cluster zone to another possible. However, when the transportation systems are shifted in this fashion, users will only receive real-time location information; the storage method used by transportation applications is not supported.
Thus, a second option employing unconnected devices is offered, enabling users to connect in the event of a connection loss using already-existing network data directly transferred via message connection channels. Furthermore, high-volume data traffic records are monitored and displayed in user dashboards to track the number of queues in the transportation system, transforming the developed device into a highly effective intelligent system. The following scenarios are carried out using analytical programming loops, route monitoring procedures, and artificial intelligence algorithms to test the effectiveness of transportation operations.
Scenario 1: Load detection in formed clusters
Scenario 2: Control function and accuracy
Scenario 3: Period, Time representations
Scenario 4: Transportation data efficiency
The scenarios mentioned above prove the efficiency of the designed mathematical model with the corresponding application for transportation systems. Moreover, each designed method is unique as the representations are determined to support different cluster configurations. Hence scenario one is considered for determining the load at other cluster areas. In contrast, a controlling technique is needed after detecting the load in transportation systems if the load is higher than expected. Therefore, the percentage of control achieved in the proposed method is determined in Scenario 2, and even errors are controlled. Finally, in Scenario 3, a simulation case study elaborates on the measurements concerning different periods for both inward and exit vehicles.
Moreover, the period representations are considered an essential factor in transportation systems due to variation in both directional flows and measured for all defined clusters. In scenario four, the total efficiency of transportation systems, which determines the traffic conditions by controlling error functions, is estimated. Furthermore, efficiency contains significant terms for transmitting clustered data points using IoT procedures. All scenarios listed above are executed utilizing a device monitoring system integrated with a remote management device created using a MATLAB tool. As a result, using graph theoretic approaches, all parametric variables are continuously observed for 1000 cars over a distance of 5000 kilometers. The following is a full description of each scenario,
Scenario 1
Using transportation load balancing techniques, the primary concern of load minimization in preferred cluster zones is assessed in this case. The suggested method measures the overall work that a vehicle processes while simulating the maximum dynamic energy created in the clusters to monitor load situations. If a particular vehicle performs more work-related functions, alert communications will be provided immediately and without delay, decreasing the dynamic energy of assigned systems. Therefore, employing various hoardings in the assigned design, the cluster regions are constructed this way. The suggested method produces just two cluster regions to lessen the misunderstanding in vehicles. Therefore, the two clusters indicated above only form substantial regions of interest, making the communication spectrum available where needed. The simulation analysis for the system’s assigned loads is shown in Fig. 2.
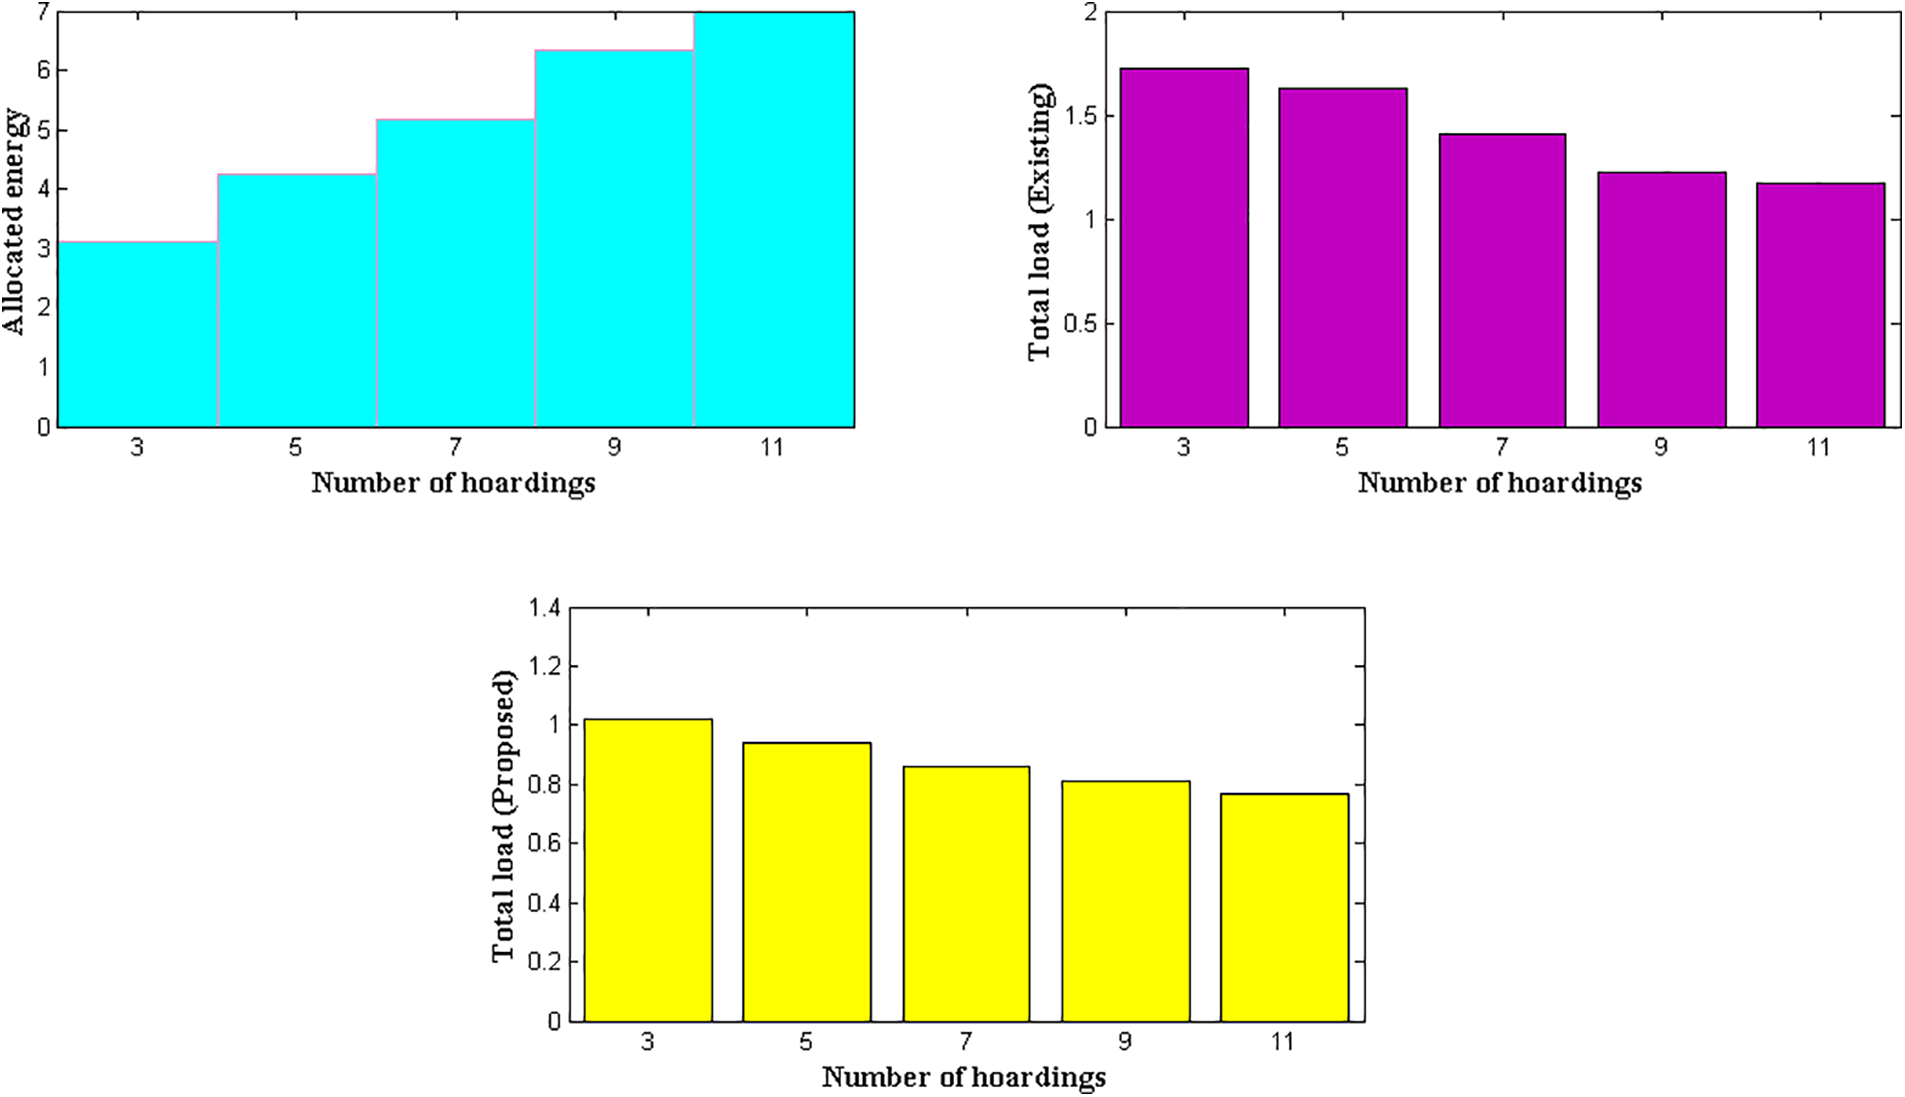
Figure 2: Total transportation loads
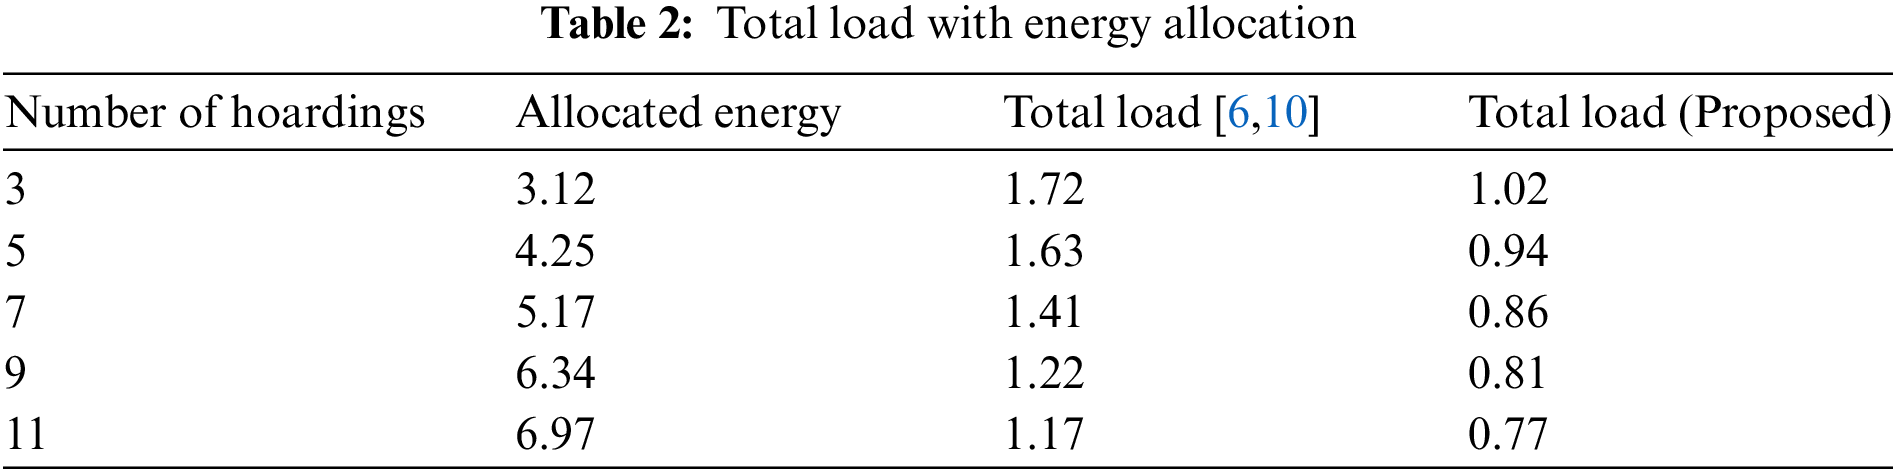
Fig. 2 and Table 2 show that the proposed technique’s allotted vehicle loads are lower than the current method [10]. The total number of hoardings in the planned transportation system is estimated to be 3, 5, 7, 9, and 11 in steps of two-point variation for the experimentation case study. With more carriages available, the energy allotted for transportation for different changes in hoardings is 3.12, 4.25, 5.17, 6.34, and 6.97. Therefore, it is plausible that the overall load of the suggested technique will be decreased to 0.77 in both generated clusters with the aforementioned initial values, with some minor deviations. But it is noted that the current system operates in an overload condition for roughly 1.17 h due to the lack of a load generation mechanism. In the presence of various hoarding locations, the overload above condition holds for all assigned energy. The projected model effectively reduces the number of assigned loads in the system.
Scenario 2
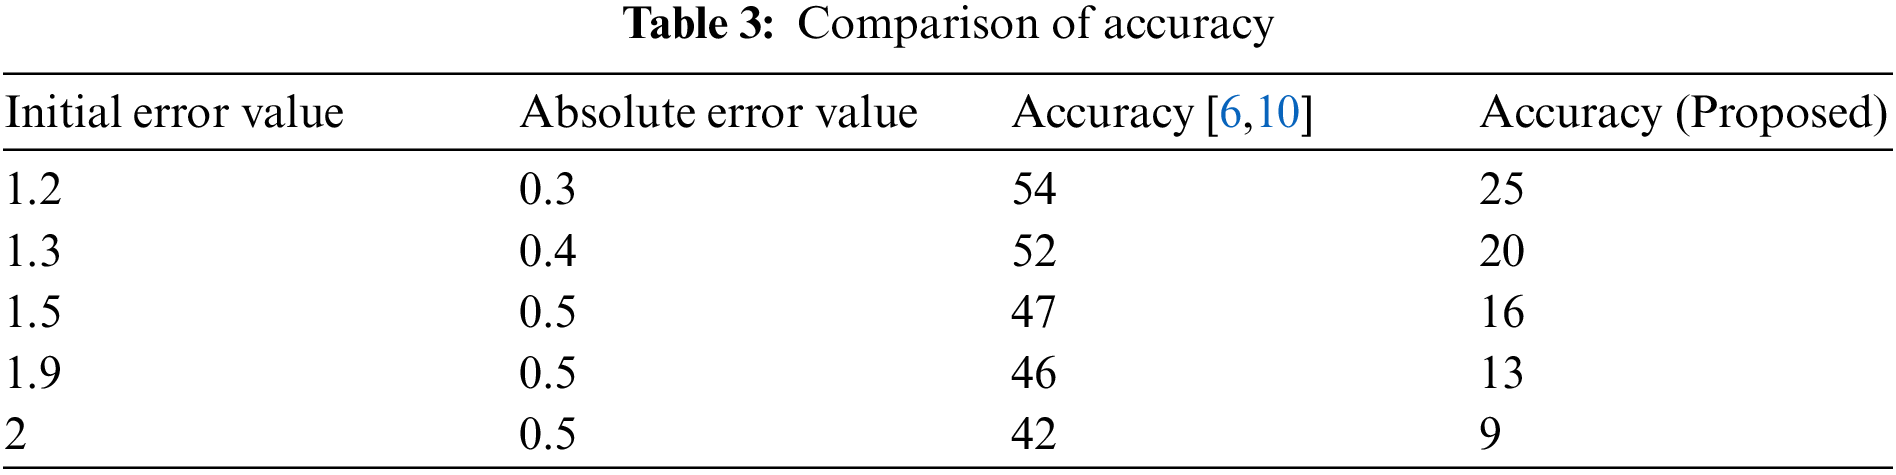
The transportation applications created are essential for regulating the side of the road where accidents would happen in real-time. Two sorts of errors, such as absolute and initial errors, will arise whenever IoT procedures are specified for transportation systems. The difference between the errors and their minimization values gives optimum control values. Because there are initially low state error levels in the suggested strategy, there is a significantly greater chance of control. As a result, in the control stage, highly accurate values are determined by utilizing a two-point function at various location platforms. During such control stages, the first position of transport is subtracted from the corresponding radius inside a single cluster. However, a different receiver point function is picked in the second stage, and the comparable radius parametric values are decreased. As a result, the total control of a system can only be attained if both point functions are added together and minimized about one another. Fig. 3 shows control values for both the proposed and existing approaches.
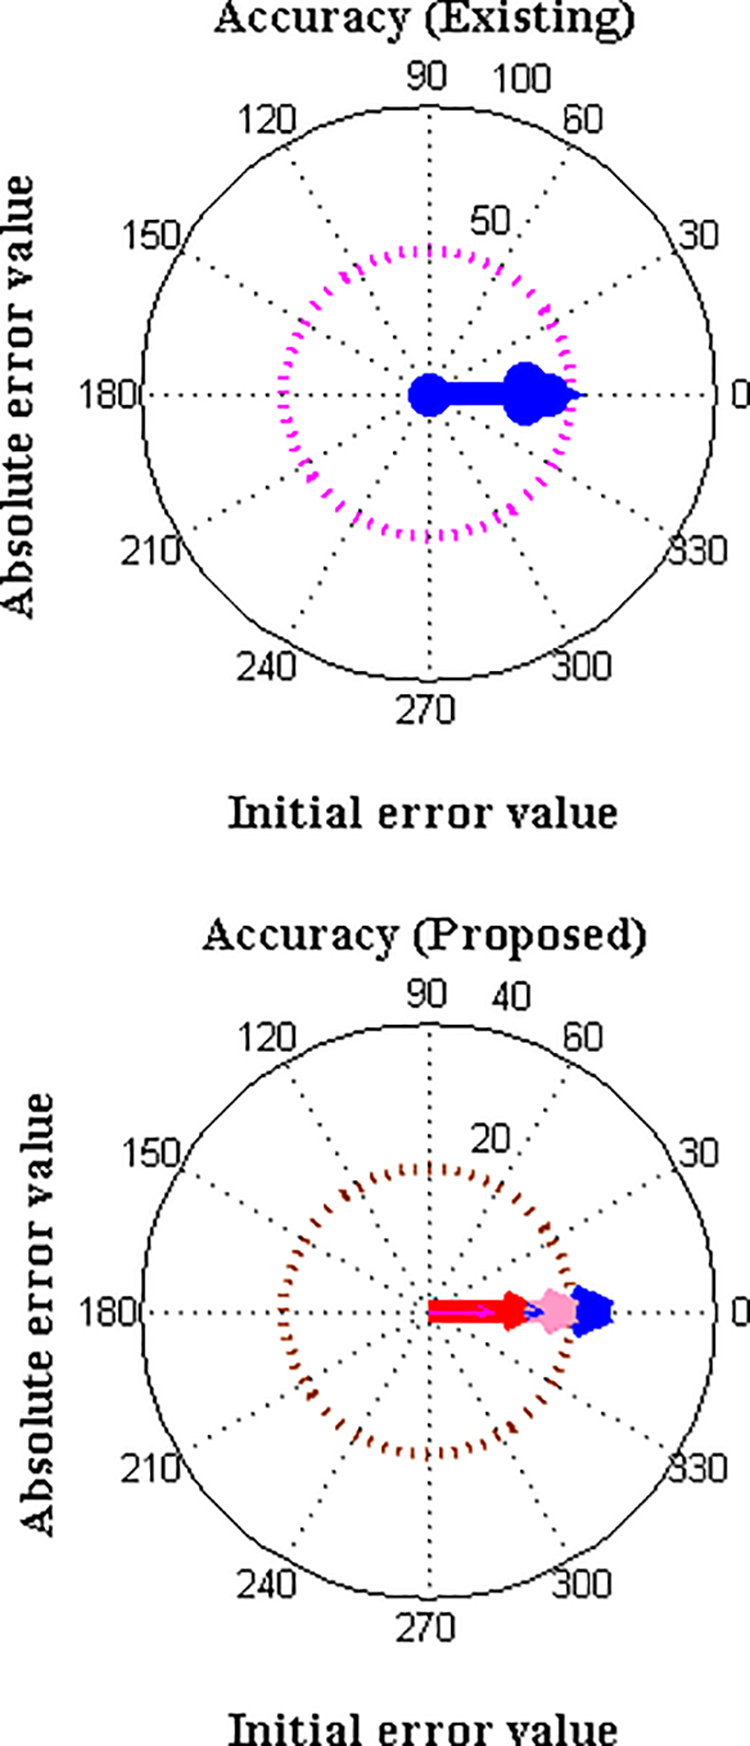
Figure 3: Error representations
Fig. 3 shows that the initial error values for transportation systems are substantially smaller and are equal to 1, 2, 1, 5, 1, 9, and 2, with absolute error values ranging from 0.3 to 0.5. The indicated difference between control functions is insignificant for moving locations because it is minimized. As the result shown in Table 3, the accuracy of the two-point function transportation system is maximized during sum-up configurations. However, the accuracy of errors will likely be reduced over time to the degree that, in the case of the proposed method, even reaches 9% of the total data. However, the current strategy merely reduces the accuracy of errors to specific percentage values, and it stays at 42 percent due to the need for more control strategies. This is further demonstrated by additional error values at extremely low levels, like 1.2 and 0.3, where with less than 1% of total error, the transportation application uses route management and artificial intelligence to deliver 25% as an accurate error control figure. However, the current method only offers a 54 percent reduction in control error values; as a result, two-point functions cannot be used in real-time applications for specified cluster regions.
Scenario 3
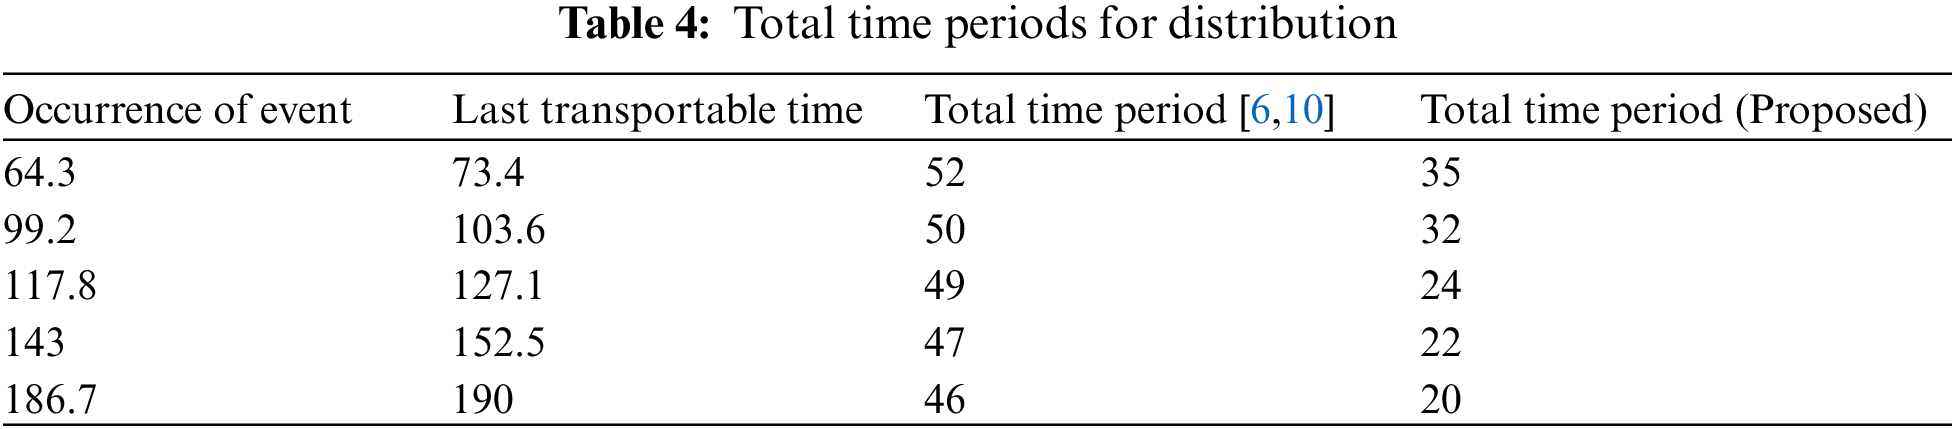
A time period of transition is usually needed while delivering a certain carriage to its final destination; in this case, that period is measured. Congestion is not permitted in any carriages that transport a heavy load to any required users. As a result, the transportation network must reach the end system without interruption at the lowest possible time, which necessitates both influx and departure periods. It is advised that the difference between an inward and an existing network takes the least time possible in a common mode without using optimization techniques. In contrast, if an optimization technique is used, the time it takes to finish a transportation project will entirely depend on the number of total carriage systems. Every time the transportation system’s volume is noted, the time for a certain event is measured, reflecting the overall length of time. However, the amount of a network changes with time as a difference between maximum and minimum transportation data, which is also considered in the suggested method. The period of representations is shown in Fig. 4.
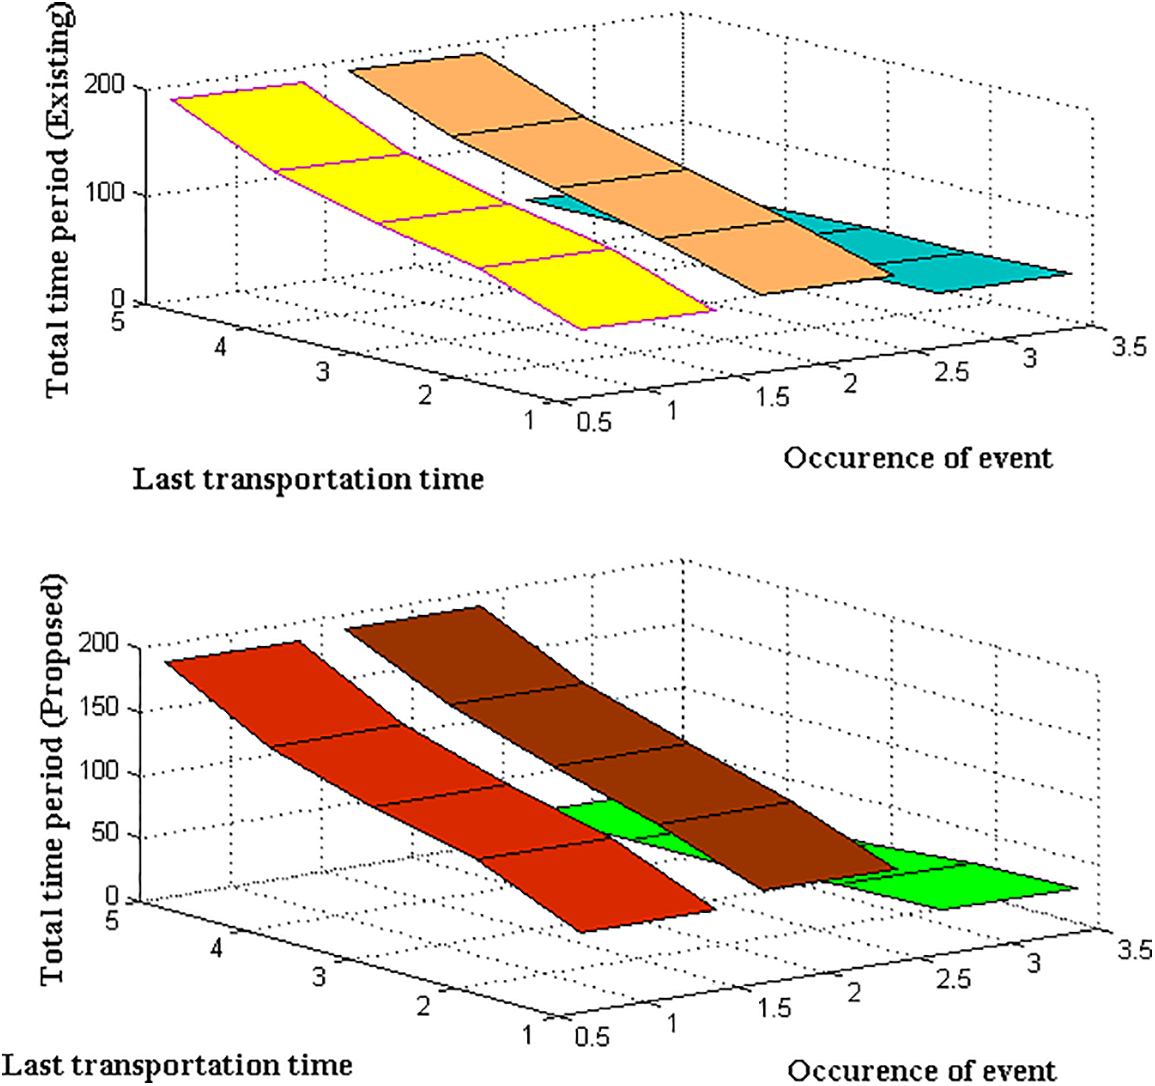
Figure 4: Period representations
Fig. 4 and Table 4 show that the suggested method considers 12 occurrences that occur throughout the time intervals of 64.3, 99.2, 117.8, 143, and 186.7. A common transportable time is observed to be 73.4, 103.6, 127.1, 152.5, and 190 for all the numerous events. As a result, the observed difference in individual periods is minor, and the data transfer time is calculated directly. As a result of data period measurement, the anticipated method employing automated transmission technology offers reduced times. The overall period of representation concerning data transfer is higher than with the existing approach [10], which does not ensure any automatic data reporting system. The proposed method gives 24 s as the entire period, whereas the current approach requires roughly 47 s for data transmission functions. This can be provided with several events that occur at 117.8-second intervals with a transportable time of 127.1 s.
Scenario 4
The total efficiency control shows that the transportation systems have accurate measurements. Therefore, it is essential to maximize the suggested method’s efficiency by considering the fractional rates of delivered packets. The volume of the entire network is tested with various alterations to the total load to simulate a transportation network with great efficiency. But regardless of delivered packets, the speed factor can also be used to gauge the effectiveness of a transportation network. Transportation efficiency can be greatly boosted when a vehicle is not congested and if the delivery rate is significantly faster. Despite the requirements above, some congestion will always occur during product delivery. As a result, some assessment measures are determined using a single source of control point establishment and gestures. The efficiency percentage is increased, and idle and queue periods are decreased due to a single control point. The data efficiency of the suggested and existing methods is shown in Fig. 5.
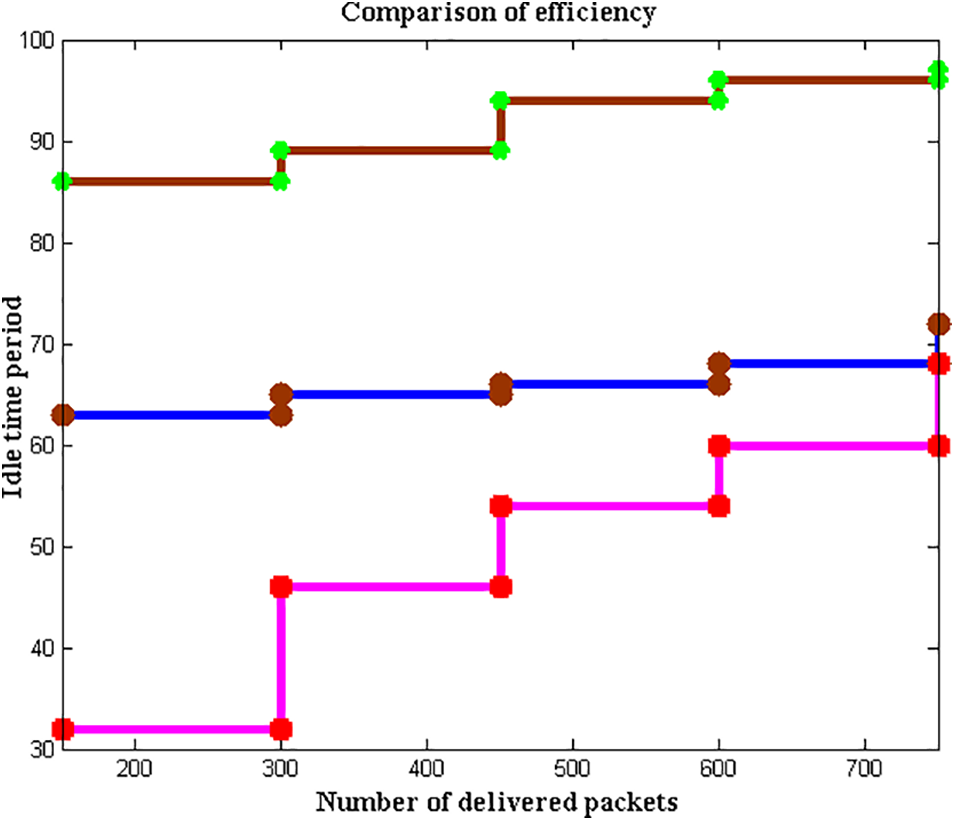
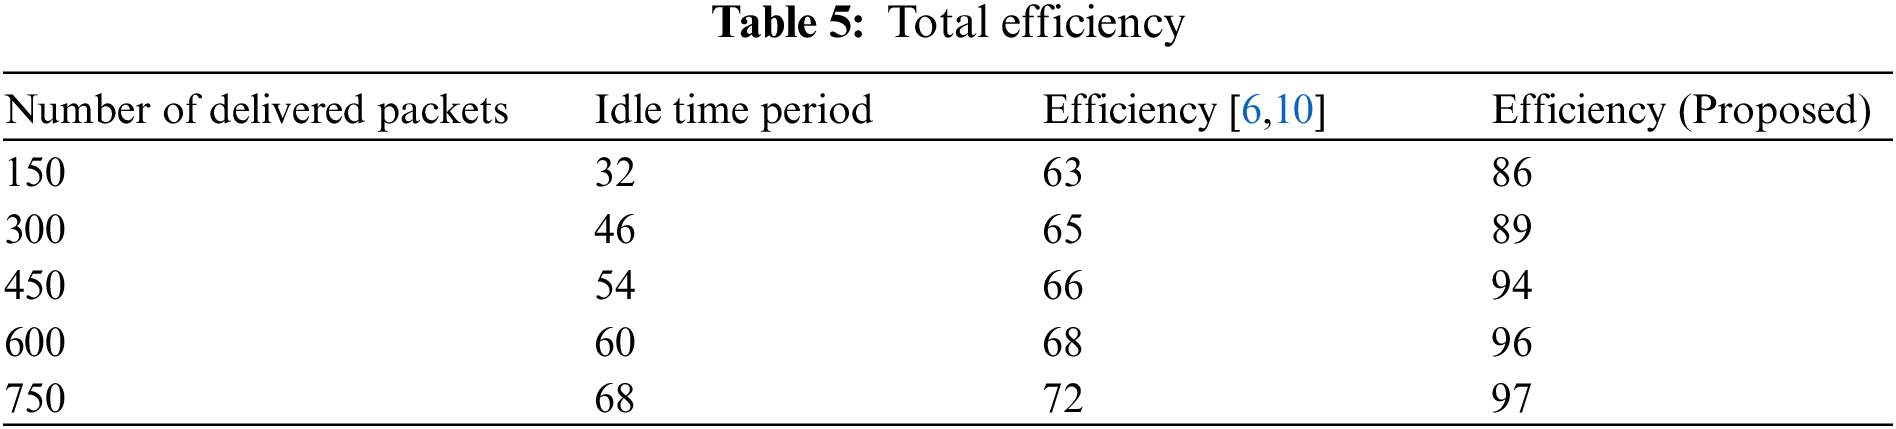
Figure 5: Comparison of efficiency
From Fig. 5 and Table 5, it is clear that the projected method’s efficiency is significantly higher than that of the current strategy. To demonstrate this case study in practice, 150, 300, 450, 600, and 750 packets were delivered daily. In contrast, the idle period for delivering a packet is 32, 46, 54, 60, and 68, which is significantly less for the daytime period. The proposed method offers a 97 percent efficiency with such delivery cases, which is superior to the old case’s 72 percent efficiency. The automatic monitoring systems in the suggested technique give 86 percent efficiency even in other circumstances with a minimum number of delivered packets of 150. At the same time, even at low delivery rates and idle periods, the existing method still achieves 63 percent efficiency [10]. Therefore, the route management technique with the artificial intelligence algorithm is the only one that can be utilized in real-time for transportation applications.
Automatic operating methods are used to resolve new processing strategies for transportation applications to overcome various difficulties in real-time situations. The suggested method uses analytical representations during the design phase, which are then translated into programming loop-based systems. Before being processed by an artificial intelligence optimization tool, the developed model is further integrated using route management techniques. The basic integration process establishes the current number of transport vehicles and informs people about road traffic jams. As a result, the anticipated model will enable users to choose the shortest and least congested routes with intelligence. The proposed system formulations additionally address additional significant issues with load reduction techniques by allowing transport vehicles to enter cluster locations dependent on load. Additionally, it is seen that analytical representations play a significant role in comparison to geographical location-based methods in the comparison state with existing methods. This insightful analytical approach enables the suggested method to resolve all challenges associated with real-time transportation applications. Furthermore, the next stage of contributions is linked to the data transfer strategy at both cluster regions (inter and intra-cluster areas), where two distinct cluster mixtures are chosen to reduce control error functions. This is done after solving the two primary challenges. To evaluate the effectiveness of the suggested method, four scenarios are taken into account, and the results are compared to the current methodology. The observed output makes it abundantly evident that the projected model of transportation networks delivers optimized results in all defined situations and resolves the minimization and maximization objective functions. In the future, real-time connections between transportation application scenarios can be made using simple short-route handling techniques and efficient data transfer processes.
Funding Statement: The article processing charge (APC) was funded by the Research Management Centre (RMC), Universiti Malaysia Sabah, through the Journal Article Fund UMS/PPI-DPJ1.
Conflicts of Interest: The authors declare they have no conflicts of interest to report regarding the present study.
References
1. S. Shitharth, F. S. Alotaibi, H. Manoharan, A. O. Khadidos, K. H. Alyoubi et al., “Reconnoitering the significance of security using multiple cloud environments for conveyance applications with blowfish algorithm,” Journal of Cloud Computing, vol. 11, no. 76, pp. 1–16, 2022. [Google Scholar]
2. X. G. Luo, H. B. Zhang, Z. L. Zhang, Y. Yu and K. Li, “A new framework of intelligent public transportation system based on the internet of things,” IEEE Access, vol. 7, no. 2, pp. 55290–55304, 2019. [Google Scholar]
3. F. Zhu, Y. Lv, Y. Chen, X. Wang, G. Xiong et al., “Parallel transportation systems: Toward IoT-enabled smart urban traffic control and management,” IEEE Transactions on Intelligent Transportation Systems, vol. 21, no. 10, pp. 4063–4071, 2020. [Google Scholar]
4. S. Chavhan, D. Gupta, S. Garg, A. Khanna, B. J. Choi et al., “Privacy and security management in intelligent transportation system,” IEEE Access, vol. 8, no. 3, pp. 148677–148688, 2020. [Google Scholar]
5. U. K. Lilhore, A. L. Imoize, C. T. Li, S. Simaya, S. K. Pani et al., “Design and implementation of an ML and IoT based adaptive traffic-management system for smart cities,” Sensors, vol. 22, no. 8, pp. 1–26, 2022. [Google Scholar]
6. M. Humayun, M. S. Alsaqer and N. Jhanjhi, “Energy optimization for smart cities using IoT,” Applied Artificial Intelligence, vol. 36, no. 1, pp. 2410–2426, 2022. [Google Scholar]
7. B. Wang and F. Liu, “Task arrival based energy efficient optimization in smart-IoT data center,” Mathematical Biosciences and Engineering, vol. 18, no. 3, pp. 2713–2732, 2021. [Google Scholar] [PubMed]
8. Q. Yu, Y. Wang, X. Jiang, B. Zhao, X. Zhang et al., “Optimization of vehicle transportation route based on IoT,” Mathematical Problems in Engineering, vol. 2021, no. 2015, pp. 1–10, 2021. [Google Scholar]
9. M. Vojtek, M. Kendra, V. Zitricky and J. Siroky, “Mathematical approaches for improving the efficiency of railway transport,” Open Engineering, vol. 10, no. 1, pp. 57–63, 2020. [Google Scholar]
10. Y. Zhang, X. Kou, H. Liu, S. Zhang and L. Qie, “IoT-enabled sustainable and cost-efficient returnable transport management strategies in multimodal transport systems,” Sustainability, vol. 14, no. 18, pp. 1–22, 2022. [Google Scholar]
11. S. K. Pramanik, F. B. Suja, S. Zain and B. K. Pramanik, “Bibliometric analysis and system review of vehicle routing optimization for emergency material distribution,” Bioresource Technological Reports, vol. 9, no. 6, pp. 100310, 2019. [Google Scholar]
12. R. I. Meneguette, “A vehicular cloud-based framework for the intelligent transport management of big cities,” International Journal of Distributed Sensor Networks, vol. 2016, no. 2016, pp. 1–9, 2016. [Google Scholar]
13. F. Zantalis, G. Koulouras, S. Karabetsos and D. Kandris, “A review of machine learning and IoT in smart transportation,” Future Internet, vol. 11, no. 4, pp. 1–23, 2019. [Google Scholar]
14. A. A. Ouallane, A. Bahnasse, A. Bakali and M. Talea, “Overview of road traffic management solutions based on IoT and AI,” Procedia Computer Science, vol. 198, no. 2021, pp. 518–523, 2021. [Google Scholar]
15. K. Iqbal, M. A. Khan, S. Abbas, Z. Hasan and A. Fatima, “Intelligent transportation system (ITS) for smart-cities using mamdani fuzzy inference system,” International Journal of Advanced Computer Science and Applications, vol. 9, no. 2, pp. 94–105, 2018. [Google Scholar]
16. C. X. Qi, Y. J. Sun and J. M. Cheng, “Transportation management system for ubiquitous computing,” in Proc. 2010 IEEE ICSOLI, Delhi, India, pp. 311–314, 2010. [Google Scholar]
17. K. Kampova, K. Makka and K. Zvarikova, “Implementation of security management principles in transport,” in SHS Web Conf., Zilina, Slovakia, vol. 92, pp. 06016, 2021. [Google Scholar]
18. A. A. Laghari, A. K. Jumani and R. A. Laghari, “Review and state of art of fog computing,” Achieves of Computational Methods in Engineering, vol. 28, no. 5, pp. 3631–3643, 2021. [Google Scholar]
19. R. Nazir, A. A. Laghari, K. Kumar, S. David and M. Ali, “Survey on wireless network security,” Achieves of Computational Methods in Engineering, vol. 29, no. 3, pp. 1591–1610, 2022. [Google Scholar]
20. I. S. Huang, Y. H. Lu, M. Shafiq, A. A. Laghari and R. Yadav, “A generative adversarial network model based on intelligent data analytics for music emotion recognition under IoT,” Mobile Information Systems, vol. 2021, pp. 1–8, 2021. [Google Scholar]
21. W. Hyder and J. K. Pabani, “Self-organized Ad Hoc mobile underwater sensor networks,” IEEE Sensors Journal, vol. 23, no. 2, pp. 1635–1644, 2023. [Google Scholar]
22. A. A. Khan, A. A. Laghari, A. A. Shaikh, Z. A. Shaikh and A. K. Jumani, “Innovation in multimedia using IoT systems,” Multimedia Computing Systems and Virtual Reality, vol. 2, no. 2, pp. 171–187, 2022. [Google Scholar]
23. A. A. Khan, A. A. Laghari, Z. A. Shaikh, Z. Dacko-Pikiewicz and S. Kot, “Internet of Things (IoT) security with blockchain technology: A state-of-the-art review,” IEEE Access, vol. 10, no. 11, pp. 122679–122695, 2022. [Google Scholar]
24. A. A. Laghari, K. Wu, R. A. Laghari, M. Ali and A. A. Khan, “A review and state of art of internet of things (IoT),” Achieves of Computational Methods in Engineering, vol. 29, no. 3, pp. 1395–1413, 2022. [Google Scholar]
25. L. Zhang, Q. Liu, W. Yang, N. Wei and D. Dong, “An improved K-nearest neighbor model for short-term traffic flow prediction,” Procedia Social Behavioral Sciences, vol. 96, no. 1, pp. 653–662, 2013. [Google Scholar]
26. J. Myung, D. K. Kim, S. Y. Kho and C. H. Park, “Travel time prediction using K nearest neighbor method with combined data from vehicle detector system and automatic toll collection system,” Transportation Research Record, vol. 20, no. 2256, pp. 51–59, 2011. [Google Scholar]
27. W. Alhalabi, A. Al-Rasheed, H. Manoharan, E. Alabdulkareem, M. Alduailij et al., “Distinctive measurement scheme for security and privacy in internet of things applications using machine learning algorithms,” Electronics, vol. 12, no. 3, pp. 1–17, 2023. [Google Scholar]
28. O. M. Mirza, H. Mujlid, H. Manoharan, S. Selvarajan, G. Srivastava et al., “Mathematical framework for wearable devices in the internet of things using deep learning,” Diagnostics, vol. 12, no. 2750, pp. 1–17, 2022. [Google Scholar]
29. H. A. Alterazi, P. R. Kshirsagar, H. Manoharan, S. Selvarajan, N. Alhebaishi et al., “Prevention of cyber security with the internet of things using particle swarm optimization,” Sensors, vol. 22, no. 6117, pp. 1–17, 2022. [Google Scholar]
30. G. B. Mohammad, S. Shitharth, S. A. Sayed, R. Dugyala, K. Sreenivasa Rao et al., “Mechanism of internet of things (IoT) integrated with radio frequency identification (RFID) technology for healthcare system,” Mathematical Problems in Engineering, vol. 2022, no. 1, pp. 1–8, 2022. [Google Scholar]
31. S. Laghari, S. Manickam, A. Khallel, S. U. Rehman and S. Karuppayah, “SECS/GEMsec: A mechanism for detection and prevention of cyber-attacks on SECS/GEM communications in Industry 4.0 landscape,” IEEE Access, vol. 9, no. 1, pp. 154380–154394, 2021. [Google Scholar]
Cite This Article
 Copyright © 2023 The Author(s). Published by Tech Science Press.
This work is licensed under a Creative Commons Attribution 4.0 International License , which permits unrestricted use, distribution, and reproduction in any medium, provided the original work is properly cited.
 Downloads
 Citation Tools