
 Submit a Paper
 Propose a Special lssue
 Open Access
ARTICLE
Feature Enhanced Stacked Auto Encoder for Diseases Detection in Brain MRI
1 School of Computer Sciences, Universiti Sains Malaysia, Penang, 1180, Malaysia
2 Department of Computer Science and IT, The University of Chenab, Gujrat, 50700, Pakistan
* Corresponding Authors: Umair Muneer Butt. Email: ; Sukumar Letchmunan. Email:
Computers, Materials & Continua 2023, 76(2), 2551-2570. https://doi.org/10.32604/cmc.2023.039164
Received 12 January 2023; Accepted 18 May 2023; Issue published 30 August 2023
 View Full Text
 Download PDF
Abstract
The detection of brain disease is an essential issue in medical and research areas. Deep learning techniques have shown promising results in detecting and diagnosing brain diseases using magnetic resonance imaging (MRI) images. These techniques involve training neural networks on large datasets of MRI images, allowing the networks to learn patterns and features indicative of different brain diseases. However, several challenges and limitations still need to be addressed further to improve the accuracy and effectiveness of these techniques. This paper implements a Feature Enhanced Stacked Auto Encoder (FESAE) model to detect brain diseases. The standard stack auto encoder’s results are trivial and not robust enough to boost the system’s accuracy. Therefore, the standard Stack Auto Encoder (SAE) is replaced with a Stacked Feature Enhanced Auto Encoder with a feature enhancement function to efficiently and effectively get non-trivial features with less activation energy from an image. The proposed model consists of four stages. First, pre-processing is performed to remove noise, and the greyscale image is converted to Red, Green, and Blue (RGB) to enhance feature details for discriminative feature extraction. Second, feature Extraction is performed to extract significant features for classification using Discrete Wavelet Transform (DWT) and Channelization. Third, classification is performed to classify MRI images into four major classes: Normal, Tumor, Brain Stroke, and Alzheimer’s. Finally, the FESAE model outperforms the state-of-the-art, machine learning, and deep learning methods such as Artificial Neural Network (ANN), SAE, Random Forest (RF), and Logistic Regression (LR) by achieving a high accuracy of 98.61% on a dataset of 2000 MRI images. The proposed model has significant potential for assisting radiologists in diagnosing brain diseases more accurately and improving patient outcomes.Keywords
The brain is the human body’s most complex part, with about 80 million neurons connecting itself with different body nerves and performing diverse functions [1]. Diseases related to the brain are considered one of the deadliest. There are different types of brain diseases depending upon the type, location, and nature, such as Brain tumours, Brain stroke, and Alzheimer’s [2]. Cancer is the most significant and carcinogenic health problem faced by many people around the globe, as every sixth death is due to cancer [3]. Brain Cancer is a form of cancer considered most aggressive and heterogeneous [4].
Magnetic Resonance Imaging (MRI) has become increasingly important in diagnosing and treating various brain diseases [5,6]. However, human experts’ interpretation of MRI images can be time-consuming and prone to errors [7]. Artificial Intelligence (AI) plays a vital role in healthcare, particularly in radiology, due to its capability to learn features as it facilitates clinical decisions and treatments [8,9]. It also incorporates and streamlines the expertise of radiologists and doctors for detecting and categorizing the complicated patterns of diseases within images [10–12]. Machine learning and deep learning techniques have emerged as promising solutions for the accurate and efficient analysis of MRI images [13].
Machine learning and deep learning techniques have emerged as promising tools for improving the accuracy and efficiency of medical image analysis [14]. In recent years, deep learning-based studies have demonstrated impressive results in classifying medical images, including MRI scans [15]. Various studies have utilized pre-trained Convolutional Neural Network (CNN) models for feature extraction and classification of brain MRI images, achieving high accuracy rates [16]. However, there are still challenges in developing accurate and efficient deep-learning models for medical image analysis, such as the need for high-quality labelled data and the potential risk of overfitting [17].
Several recent studies have proposed SAE-based methods for disease detection in brain MRI. For example, Han et al. [18] proposed a 3D SAE with dropout regularization for brain tumor segmentation. They achieved state-of-the-art results on the BraTS 2018 dataset, with an overall dice score of 0.854. In addition to segmentation, SAE-based methods have also been proposed for disease classification in brain MRI. For example, Sethi et al. [19] proposed a 2D SAE for the classification of Alzheimer’s disease. They achieved a classification accuracy of 92.38% on the ADNI dataset. In recent years, SAE has gained significant attention due to its ability to automatically extract relevant features from raw data [20,21]. It has been successfully applied in various domains, including image classification, speech recognition, and natural language processing [22].
However, the performance of SAE can be limited by the complexity and heterogeneity of medical images. Moreover, several challenges are associated with using machine learning and deep learning for disease detection in MRI. One of the main challenges is the availability of large and diverse datasets. Without adequate data, machine learning and deep learning models may not accurately capture the disease’s complexity, leading to false positives or negatives.
In this paper, we propose a Feature-Enhanced Stacked Auto Encoder (FESAE) for detecting four brain diseases in MRI and classify them into four major classes: Normal, Tumor, Brain Stroke, and Alzheimer’s. The proposed FESAE model captures additional features from coloured images to enhance the accuracy of detecting diseases from brain MRI. The following sections discuss the challenges in state-of-the-art and the contributions made by this study.
Several challenges faced in state-of-the-art that need serious attention from researchers to achieve high accuracy are discussed below.
• A grayscale image is used in most literature, leading to significant feature extraction issues.
• Features are only extracted from the spatial or frequency domain, resulting in less accuracy.
• Traditional machine learning techniques previously used with fewer features extracted from spatial or frequency domains lead to less promising results.
• Binary class classification is used primarily.
• When using Machine learning techniques, if the whole image is given as input to the classifier, it increases the complexity of the method.
This study proposes FESAE to detect and classify four categories of brain disease in brain MRI. Primarily, this study contributes in the following directions.
• First, this study uses colour images instead of grayscale images for feature extraction. Colour images provide richer information about the scene, which can lead to better feature representation and improved accuracy.
• Second, this study explores feature extraction techniques that combine information from spatial and frequency domains, such as wavelet transforms. This can help capture more diverse and representative features and improve the model’s accuracy.
• Third, FESAE has shown promising results in addressing the limitations of traditional machine learning techniques by extracting features from high-dimensional inputs and achieving high accuracy.
• Fourth, this study uses a multi-class classification approach to provide more detailed and nuanced predictions than binary classification.
• Finally, this study uses two thousand images for experimental evaluation with a distribution of 500 images for each category to solve the data availability issues and use Channelization for solving complexity issues faced by state-of-the-art.
The rest of the paper is organized as follows. Section 2 provides a literature review of the relevant work on deep learning models for detecting brain diseases. Section 3 describes the proposed FESAE model and its architecture in detail. Section 4 presents the experimental setup and results from evaluating the proposed model. Finally, Section 5 concludes the paper and discusses future research directions. We believe the proposed FESAE model can contribute to developing accurate and reliable diagnostic tools for brain diseases and ultimately improve patient outcomes.
MRI is a widely used technique for diagnosing and evaluating brain diseases. Automated detection of brain diseases using machine learning techniques can improve the accuracy and speed of diagnosis. However, interpreting MRI scans can be challenging and time-consuming, requiring the expertise of experienced radiologists. In this literature review, we will discuss using SAEs for detecting brain diseases in MRI scans.
Several studies have investigated using SAEs for detecting brain diseases in MRI scans. One study by Havaei et al. [20] used an SAE to detect gliomas in brain MRI scans. They trained the SAE on a large dataset of MRI scans and found that the SAE could accurately detect gliomas with a sensitivity of 93% and a specificity of 94%. Another study by Chen et al. [21] used an SAE to detect Alzheimer’s disease in brain MRI scans. They trained the SAE on a dataset of MRI scans from the Alzheimer’s Disease Neuroimaging Initiative (ADNI). They found that the SAE could accurately detectAlzheimer’s disease with an area under the Receiver Operating Characteristic (ROC) curve of 0.96.
Debnath et al. [22] used the Fuzzy C-Means clustering algorithm for classifying 3D brain tumour images. The results for tumour detection have been obtained by calculating the confidence function values of segmented pixels. The dataset of BRATS 2018 was used and achieved 0.980% specificity. Rasool et al. [23] introduced a hybrid approach with a CNN model and Support Vector Machine (SVM) to diagnose three kinds of tumours in the brain. The methodology developed was extracting features using CNN, and SVM was used to classify brain tumour images into three classes. Shahamat et al. [24] used Deep Learning based evolutionary approach, which is three-dimensional CNN; it classifies brain MRI scans into two groups normal and abnormal. The methodology used in this paper for visualization is based on Genetic algorithm-based brain masking. This framework is evaluated on Alzheimer’s and Autism patients. The accuracy rate for Alzheimer’s is 85%, and for autism is 70%. Mallick et al. [25] used a deep wavelet Autoencoder with a deep neural network classifier for cancer detection for brain MRI. A combination of Deep Wavelet Autoencoder and Deep neural network proposed a classifier that tremendously affects image compression and shrinks the feature set size. The accuracy of this classifier is 92% when compared with Probabilistic Neural Network and Time delay neural network.
Choudhury et al. [26] proposed an automatic model-based artificial neural network approach for detecting brain tumours. Two steps adopted are segmentation and classification for analyzing the tumour area in images. This model has 92% precision with 89% sensitivity and a 94% specificity rate. Huang et al. [27] used a Neural network for brain MRI. A differential feature map is used along with Squeeze and excitation blocks to enhance the performance of MRI images for brain tumour detection. Two steps involved in this algorithm are image rectification and image classification. The experimental analysis shows that this system has an accuracy rate of 98%. Kakhandaki et al. [28] perform brain Haemorrhages MRI classification using Naïve Bayes-Probabilistic Kernel Approach. Three stages followed to get desired results are pre-processing, segmentation and classification. Combined features were extracted using a minimal binary pattern and Gray-Level Co-Occurrence Matrix (GLCM). The accuracy is not defined in the paper. Similarly, Zaw et al. [29] perform brain tumour MRI classification using Naïve Bayes classification. The stages defined in this paper are pre-processing, segmentation, feature extraction, and classification. After applying filters at the pre-processing stage, noise is removed, and the image is converted into a grayscale. Lastly, Bayes’ theorem of probability is used as a classifier to classify images into two categories normal and abnormal. The overall accuracy of this classifier is 94%.
Furthermore, Sharma et al. [30] present a Hybrid Technique which helps detect tumored brain parts. K-means and ANN combine to give better results. The proposed system is divided into three stages: In pre-processing, image quality is enhanced by Histogram equalization. In classification, the dataset is trained to identify tumour images. Acharya et al. [31] perform K Nearest Neighbour (KNN) classification. The stages involved in this paper are filtering, feature extraction, feature selection, and classification. In the feature selection stage Student’s t-test-based process is used. The Computer-Aided-Brain-Diagnosis (CABD) tool with the ST+KNN technique is used in the classification stage. The accuracy provided by this classifier is 94.5%.
Fayaz et al. [32] utilized Artificial Neural Network for brain MRI classifications, malignant or benign. The approach consists of three stages: pre-processing, feature extraction, and classification. A median filter is used to remove noise at the pre-processing stage. Colour moments are extracted as mean features from images presented to a simple feed-forward artificial neural network for classification and achieved 91.8% accuracy. Kumar et al. [33] proposed an automatic model-based artificial neural network approach for detecting brain tumours. Two steps adopted are segmentation and classification for analyzing the tumour area in images. This model has 92% precision with 89% sensitivity and a 94% specificity rate. Halder et al. [34] exploit SVM and Fuzzy feature selection to detect Tumor in Brain MRI. First, informative features were selected and reduced using the fuzzy c-means algorithm to get non-trivial information. Second, an SVM helps to classify the scan images. The proposed method aims to produce higher specificity and sensitivity than the previous methods.
Lei et al. [35] used a sparse constrained level algorithm for brain tumour segmentation in MR images. The proposed methodology identifies common characteristics and constructs the sparse model according to the characteristics. The accuracy rate of this model is 96%. Lu et al. [36] aim to improve the accuracy and efficiency of fault diagnosis in rotary machinery components by developing a deep learning-based method. They propose a Stacked Denoising Autoencoder (SDAE) algorithm that can extract features from the raw vibration signals of the machinery components. The features are then used to identify the health state of the components, including normal state and different fault states. Lin et al. [37] improve the accuracy and efficiency of classifying epileptic ElectroEncephaloGram (EEG) signals by developing a stacked sparse autoencoder (SSAE) algorithm. The algorithm can learn the discriminative features from the raw EEG signals and then classify them into normal or epileptic signals.
Pan et al. [38] formulated a computational model that predicts the body’s RiboNucleic Acid (RNA) protein interaction in the same year. They diagnose RNA-protein interaction in our body and achieve an accuracy of 0.89%. Chen et al. [39] presented a Stack denoising autoencoder framework, which provides protein interaction with the pathogen-host to reveal the critical molecular biology of the cell. The approach will result in achieving efficient prediction performance for pathogen-host-protein interaction. Kannadasan et al. [40] demonstrate the potential of deep neural networks in classifying diabetes data. Using stacked autoencoders allows for learning complex representations of the input data, which can improve classification accuracy. Their model achieved an accuracy of 94.4% in classifying diabetes data and an accuracy of 91.6% in classifying healthy data.
Khamparia et al. [41] used a Stack autoencoder for classifying chronic kidney disease data using Softmax as a classifier and utilizing multimedia data for the classification of chronic kidney from the UCI dataset, and its accuracy was 100%. Saravanan et al. [42] proposed Deep Learning Assisted Convolutional Auto-Encoders Framework (DL-CAEF) is aimed at the early detection of glaucoma and recognition of the anterior visual pathway from retinal fundus images. The framework combines an encoder with a conventional CNN to minimize image reconstruction and classification errors. The framework can potentially improve the early detection of glaucoma in ageing populations. Menagadevi et al. [43] use multiscale pooling residual autoencoder to learn hierarchical representations of images and extract important features for classification. The pre-processing steps, including modified optimal curvelet thresholding and hybrid enhancement approach, help improve the MRI images’ quality and clarity. The high accuracy of 99.77% for Kaggle and 98.21% for the ADNI dataset achieved by SVM is impressive, and it suggests that this approach has great potential for clinical application.
Adem [44] diagnose breast cancer using the KNN algorithm with Stack autoencoder. The proposed hybrid approach results in high-dimensional data set with classified accuracy of about 91.42%. Li et al. [45] classify images of thyroid nodules using Stack denoising sparse autoencoder. This classifier divides images into two categories and has an accuracy of 92.9%. Using SAE, the above-predicted model gave accurate results. Stack Autoencoder is vital in detecting numerous diseases in the human body. Wang et al. [46] diagnose diseases presented multi-source similarity information with a Deep stack autoencoder model. This framework predicts circular RNA disease associations and achieves an accuracy of 88.08% for training data. Correspondingly, Li et al. [47] used a Stacked Sparse autoencoder for detecting the nucleus in pathological image analysis. This technique has a case-based postprocessing framework, which helps detect the nucleus. The proposed model gives average accuracy of 0.835%. Mehrnia et al. [48] present an interesting development in atrial fibrillation diagnosis and treatment. Quantifying left atrial fibrosis using 3D Late Gadolinium Enhancement (LGE) MRI is an important step towards improving patient selection for catheter ablation and predicting AF recurrence post-intervention. However, the lack of standardization and reproducibility in current methods for fibrosis quantification has been a limitation to their clinical application.
The use of SAEs for detecting brain diseases in MRI scans has shown promising results in several studies [46,47]. However, further research is needed to validate these results and investigate these models’ generalizability to different populations and disease types. One potential limitation of using SAEs for disease detection in MRI scans is the need for large amounts of labelled training data. Additionally, the interpretability of SAEs can be challenging, as the features learned by the model may not be easily understandable by humans. In addition, the performance of SAE can be limited by the complexity and heterogeneity of medical images.
Let X = {x1, x2, x3,xn} are a set of MRI images where, xi ∈ [0, 1, 2, , L] grey scale levels. Similarly, Y ∈ [0, 1, 2, 3] four major classes: Normal, Tumor, Brain Stroke, and Alzheimer’s. The aim is to construct a FESAE classifier such that:
Here, f is a function that assign a class to input image X parametrized by
where xi is the ith input image of X,
Automatic disease detection provides disciplined innovation in medicine, efficiently automating the system to provide faster and more consistent results. This paper implements a model named FESAE to detect brain diseases. The standard stack auto encoder’s results are trivial and not robust enough to boost the system’s accuracy. Therefore, the standard Stack autoencoder is replaced with a Feature Enhanced Stacked Auto Encoder with having feature Enhancement function to get non-trivial features from an image to improve the accuracy of the classifier. The proposed method consists of four stages, as shown in Fig. 1.
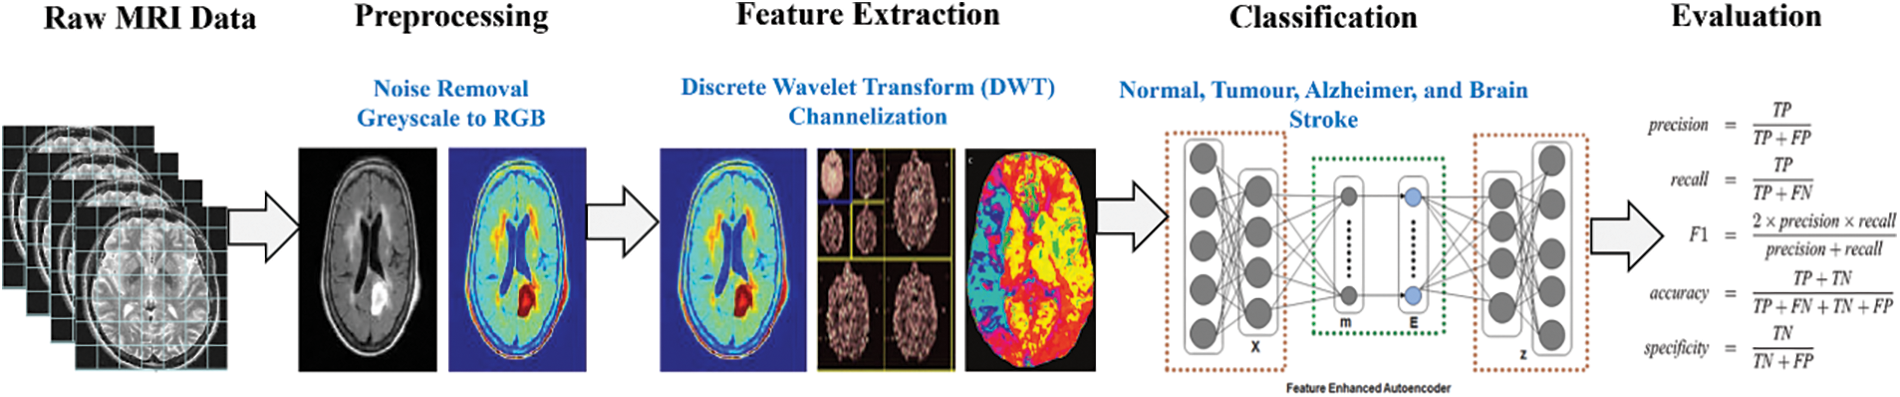
Figure 1: Proposed stages for disease detection in brain MRI
In this stage, the image quality for further processing is improved to make the complex process more accessible and faster. Three steps are performed during this stage: formatting, Channelization, and noise removal.
The first step is removing the salt and pepper noise from the image using a median filter.
The second step is formatting. In this step, the grayscale image is converted into a coloured image. Converting the image is to gain more informative features from a coloured image.
The third step is Channelization. This step divides the image into three channels red, blue and green.
Significant features for classification are identified and extracted during this stage. Since processing the whole image is very time-consuming, some important characteristics that could describe the entire image without losing any valuable information should be used. These features should be so informative that they can represent the whole image, retaining the most relevant characteristics. We extract mixed features from DWT and Channelization. The features extracted from Channelization are in colour, texture, and shape. In DWT, the LL band image is divided into 2nd level because information could be lost by further dividing the features. The feature could be extracted by a trial and error mechanism. Features are filtered through a classifier, and the features with greater accuracy are used in the classification process. Finally, we have at least 500 features from Channelization and DWT.
The division of MRI images into different classes is called classification. We use deep learning stack feature enhanced auto encoder technique as a classifier to overcome the hindrances. Before discussing the proposed work, there is a mechanism of Stack Auto Encoder (SAE) for detecting brain diseases, and the limitations of Stack Auto Encoder must be discussed. The core objective of the Autoencoder is to reduce the reconstruction error, and SAE is used to diminish the features extracted at DWT and Channelization. These extracted features then pass to the classifier (SAE) to train the system. Fig. 2 shows the mechanism of the standard Stack auto-encoder.
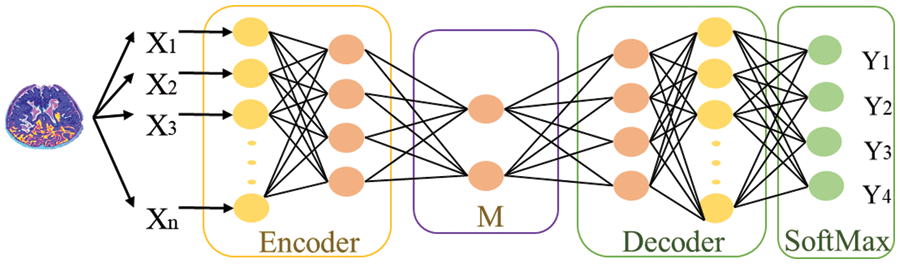
Figure 2: Mechanism of SAE for classifying features into different classes
3.4 Extracting Non-Trivial Features during the Training Process of SAE
The purpose of using autoencoders is to minimize errors while reconstructing the input during the training process. So it can extract features in an unsupervised manner using the simple network structure and different parameters. During feature extraction in autoencoders, they extract those trivial features to make an output. In simple autoencoders, there comes the point where there is no discrimination between extracted features. This is because auto encoders play a role in extracting features; they do not consider whether they are robust. L1 and L2 regularization is used to enhance the ability of autoencoders to extract discriminative and non-trivial features. Finally, we proposed a stacked feature-enhanced autoencoder with dynamic feature-enhanced factors to diagnose the salient features from different brain images.
This paper contributes by summarizing the shortcomings faced during extracting robust features.
• A stacked feature-enhanced autoencoder is proposed to get discriminative features.
• Feature-enhanced factors include assorted features, information related to the activation function, and weights between features for the training process.
• The proposed model differs from stacks of enhanced and dynamic enhanced feature factors.
Constraints for the training process through mutual competition and enhancement are as follows:
Competition: In autoencoders, the input and hidden neuron layers are linked by weight matrix W. Conversely, hidden neuron and output layers are associated with each other through bias to adjust the output. For example, based on activation energy [49], neurons are divided into positive and negative neurons. Those neurons with the highest activation energy are considered winners (positive), and those with the lowest activation energy are termed suppressed (negative).
Enhancement: An energy loss occurs due to inactive looser neurons, which will be compensated by redistributing the activation energy of average looser neurons among the winner neurons. Eqs. (3) and (4) depict the scenario to accomplish this: let
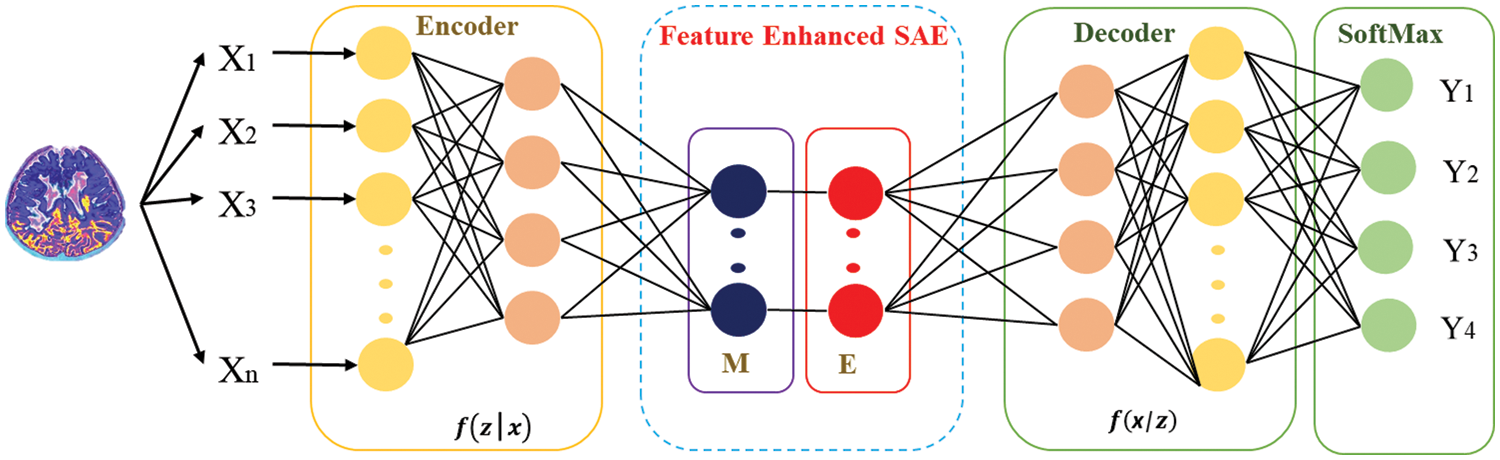
Figure 3: Structure of autoencoder along with enhanced features
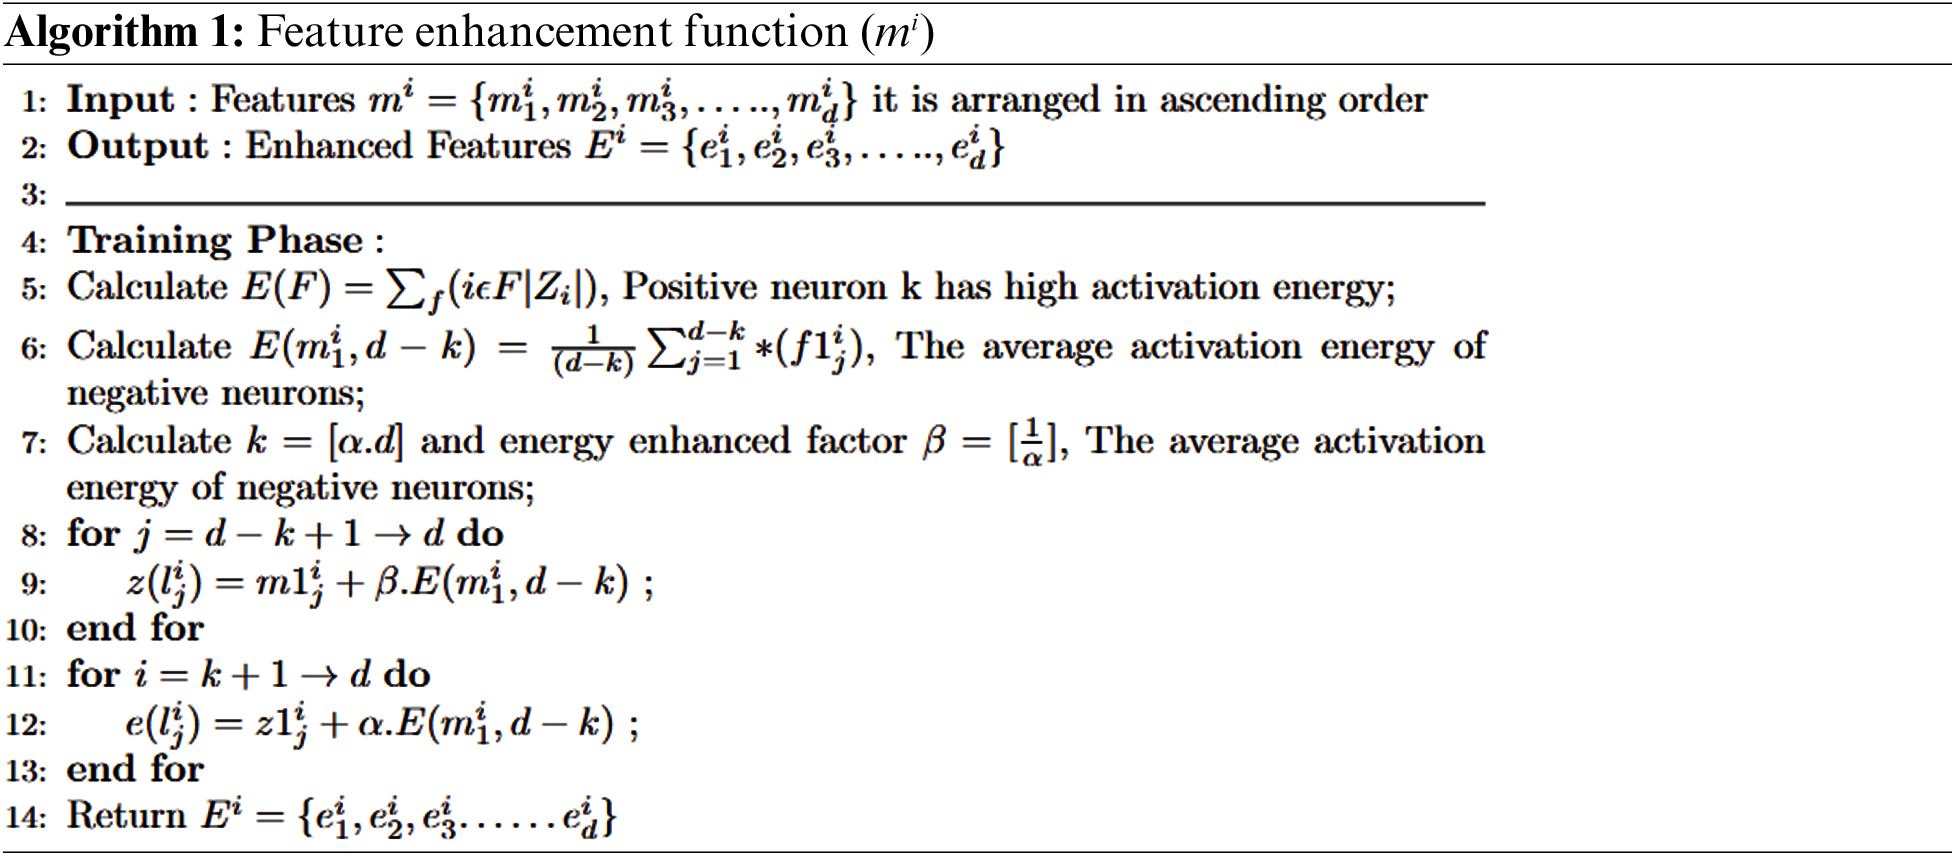
Fig. 4 depicts that feature-enhanced auto encoders combine to form feature-enhanced layers to achieve discriminative and robust features from original images. Each layer has multiple features mi,1
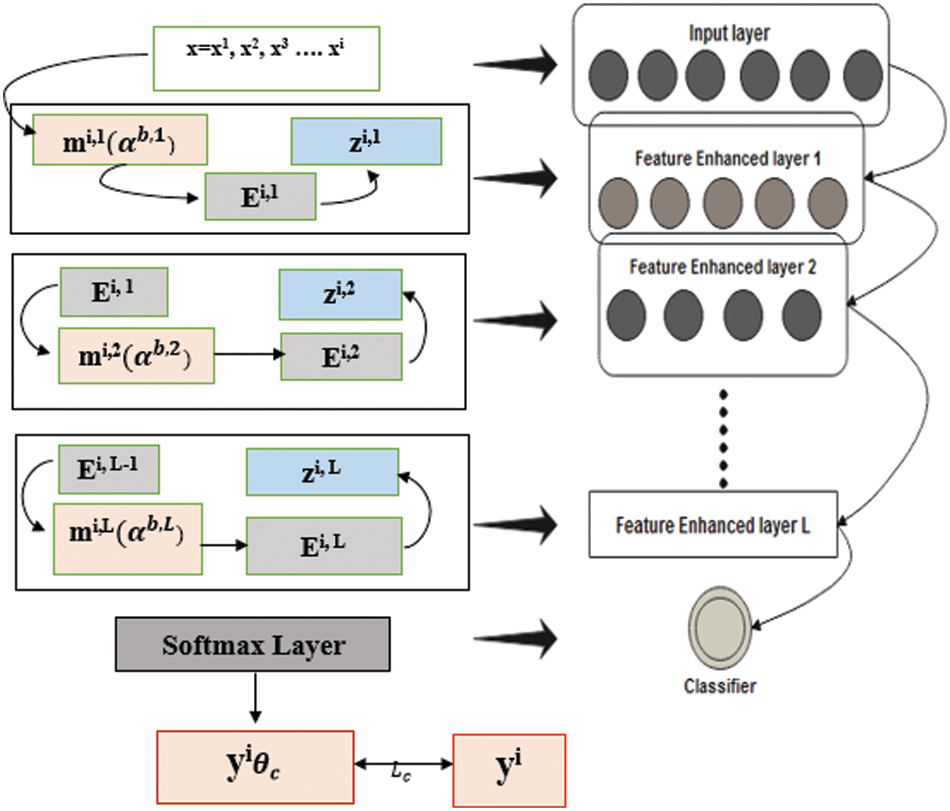
Figure 4: Structure of FESAE with dynamic feature enhanced function
The input
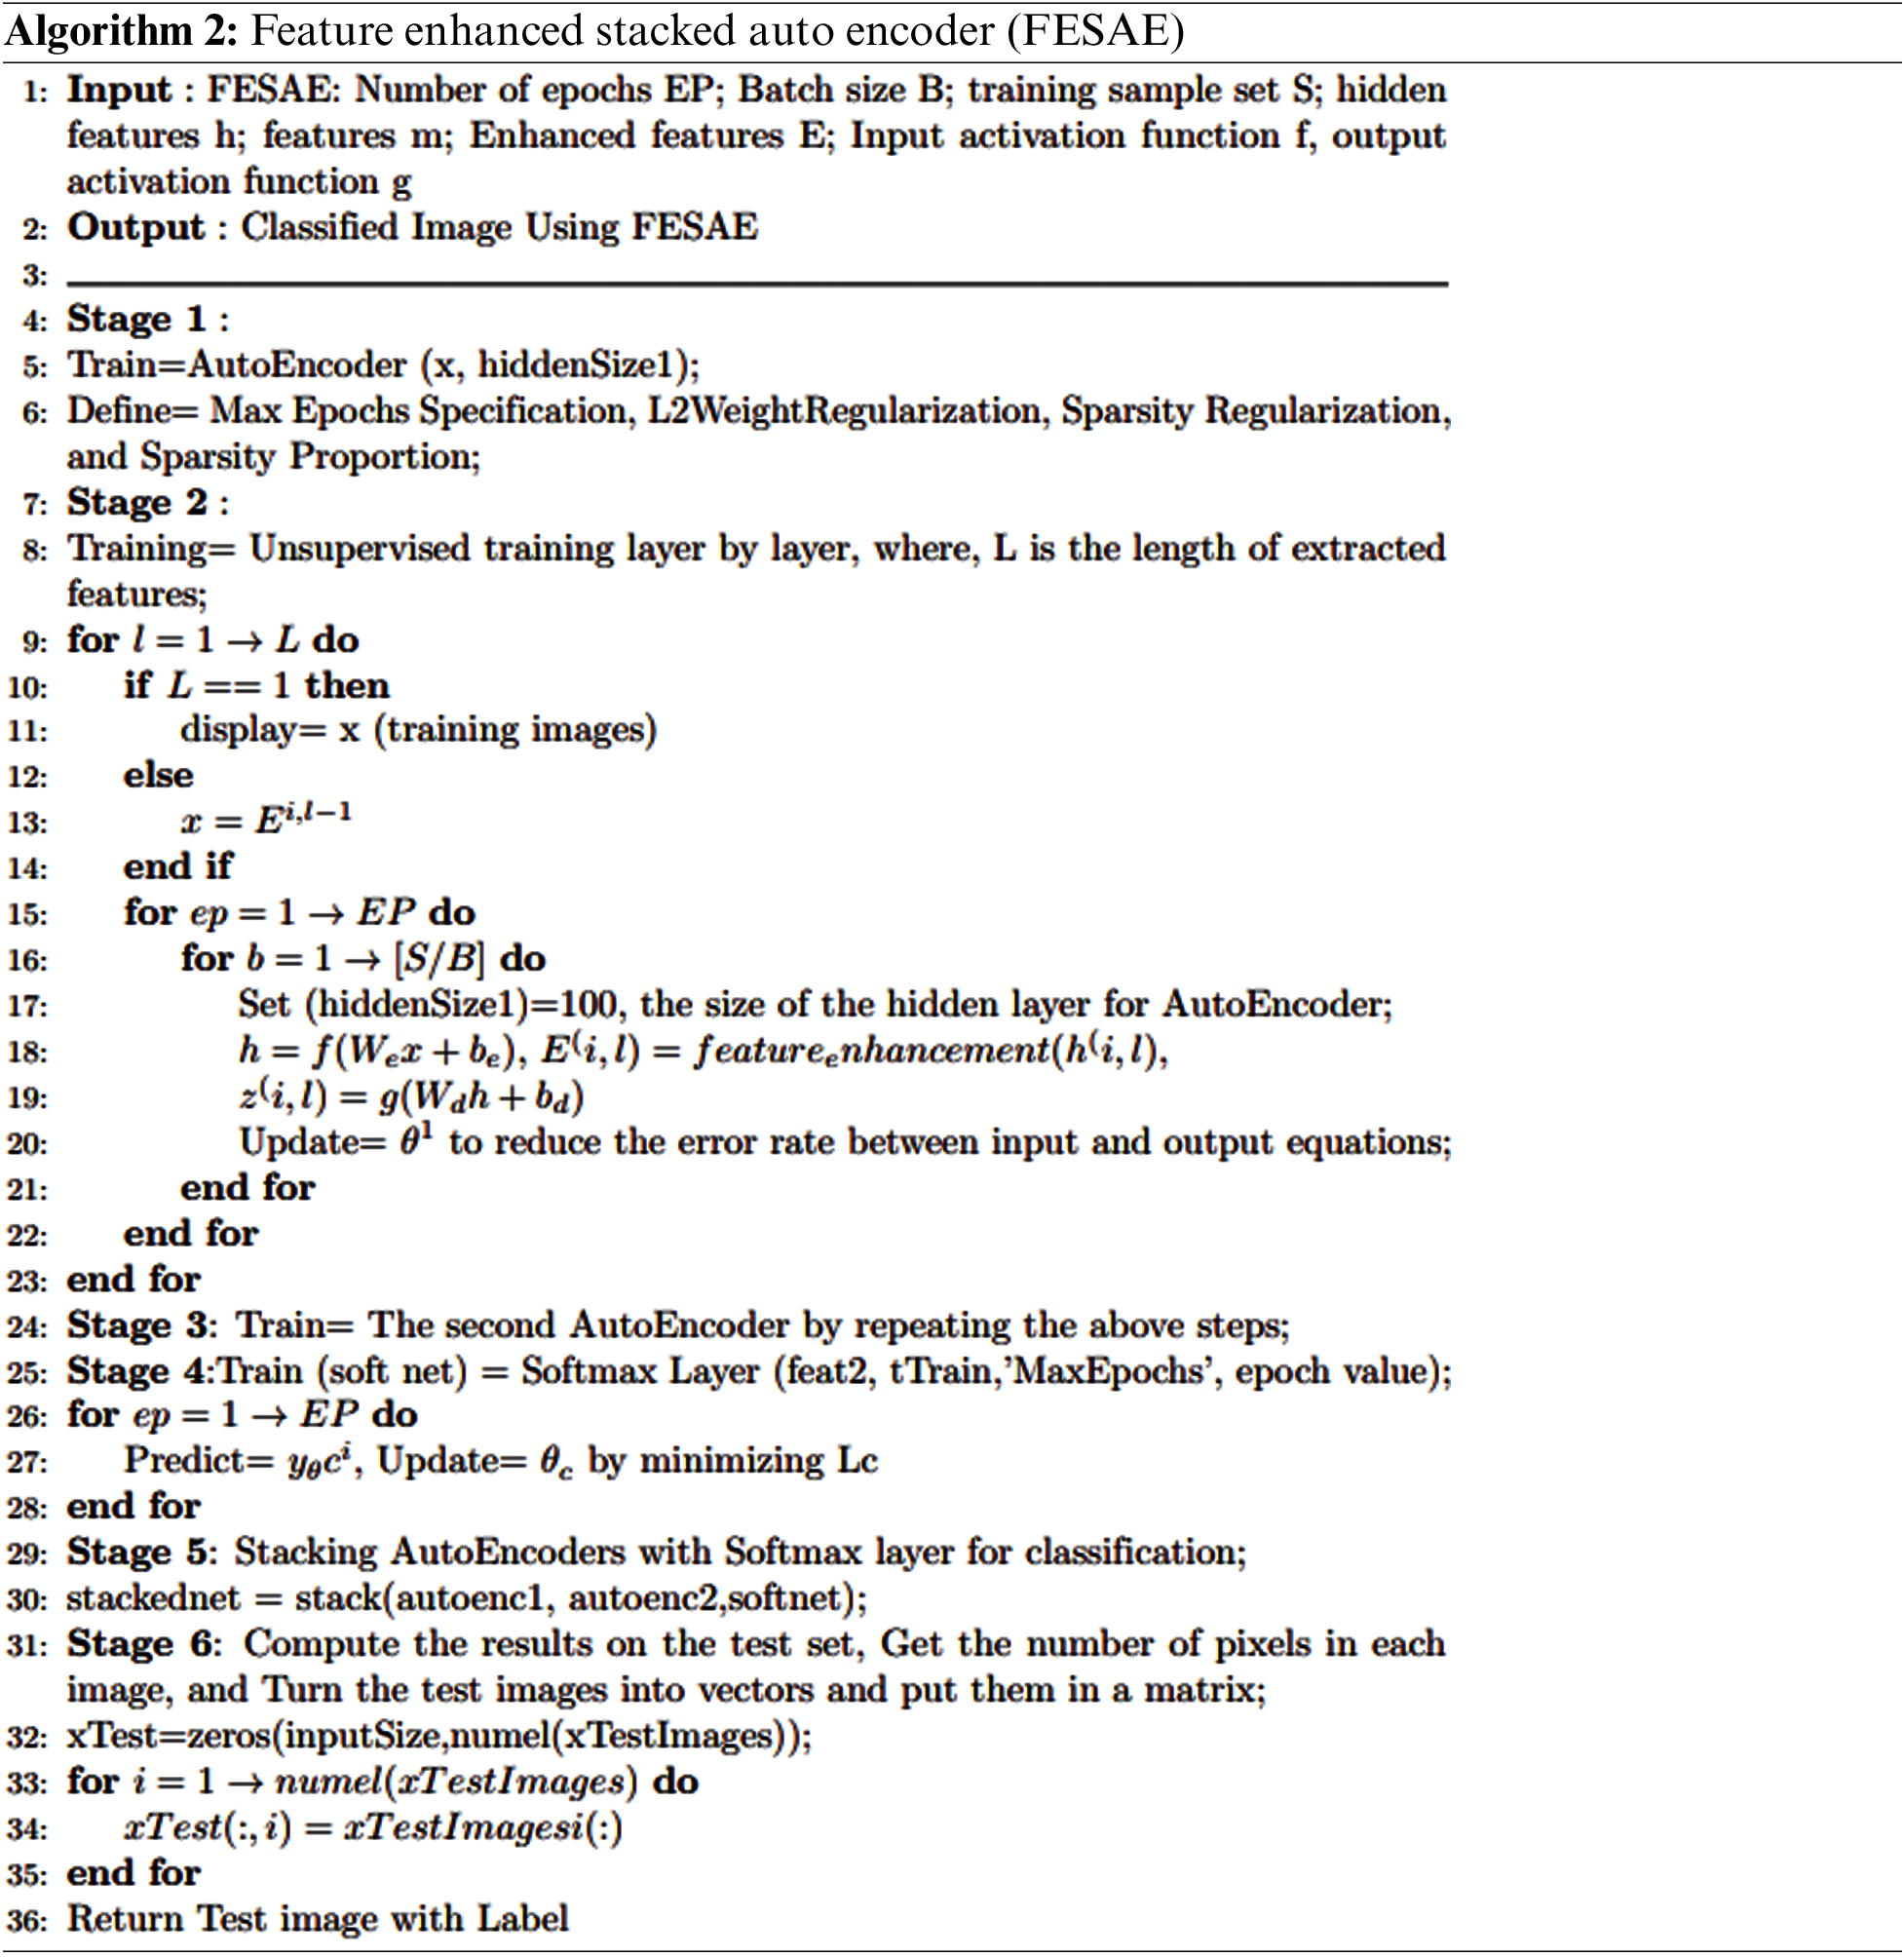
Consequently, the stacked multiple FESAE layers obtained, which have nonlinear features from higher and lower layers, are enhanced without human effort. The final structure of the model obtained had three layers with a 500-100-50 structure where 500 shows the size of the first layer, 100 shows the size of the second layer, and 50 shows the size of the last hidden layer. The number of epochs for the first hidden layer varied from 300 to 800 hundred with an increment of 100. Similarly, the second hidden layer has epochs from 250 to 500 with an increment of 50. The epochs of the last layer were 50 to 300 with an increment of 50. L2 weight regularization, sparsity regularization, and sparsity proportion are kept constant for each layer to simplify the system execution.
This section discusses the experimental evaluation performed in this study on MRI using FESAE. Experiments are performed using two different dataset partitions with 70:30 and 60:40 splits. Moreover, state-of-the-art evaluation measures are used to evaluate the proposed model’s performance. Finally, a comparison is performed with state-of-the-art to check the effectiveness of the proposed model.
This section discusses the dataset collected from the Kaggle and the Harvard medical college website [27]. The total number of MRI images used was two thousand, with a distribution of five hundred for each category of normal images, images with brain stroke, Alzheimer’s disease brain tumour. These images are pre-processed with the skull removed and noise removed with median filters to improve the image quality. Fig. 5 shows the MRI images of normal, tumour, Alzheimer, and brain stroke under discussion.
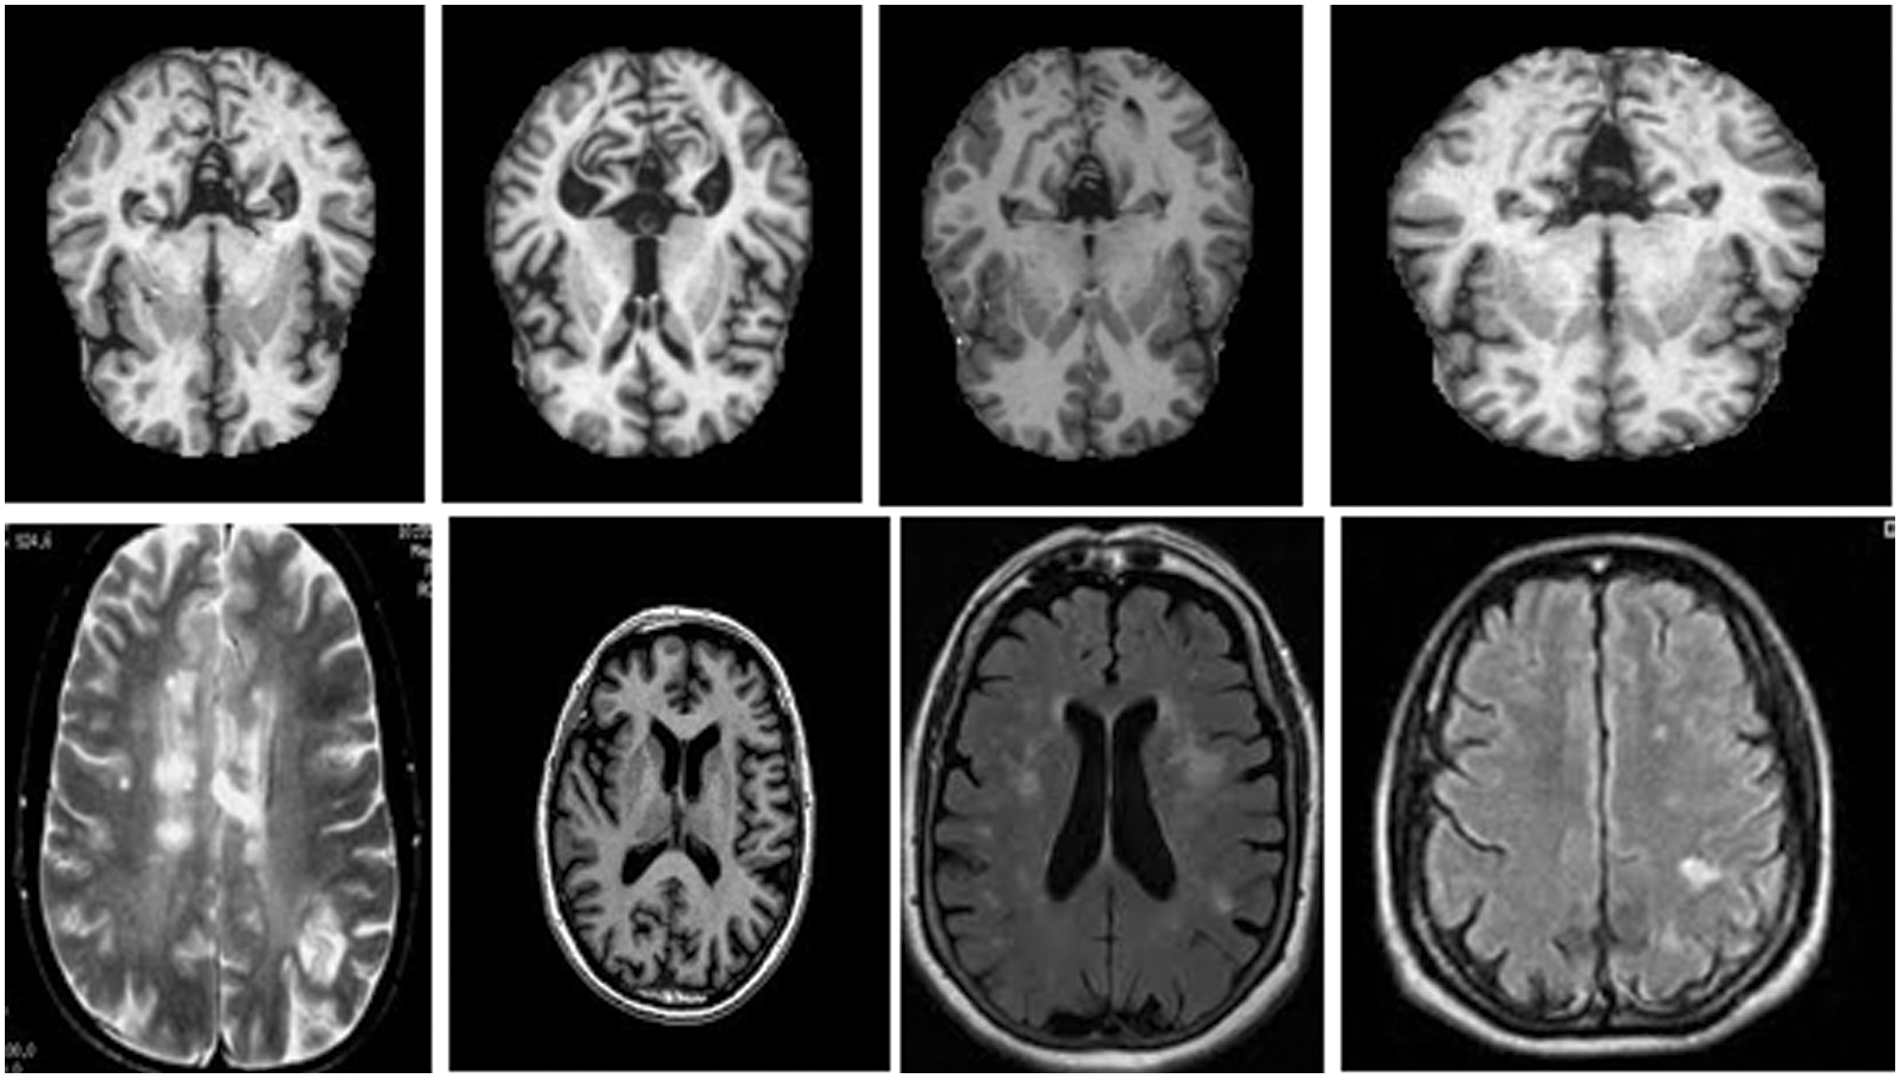
Figure 5: Brain MRI Images [27]
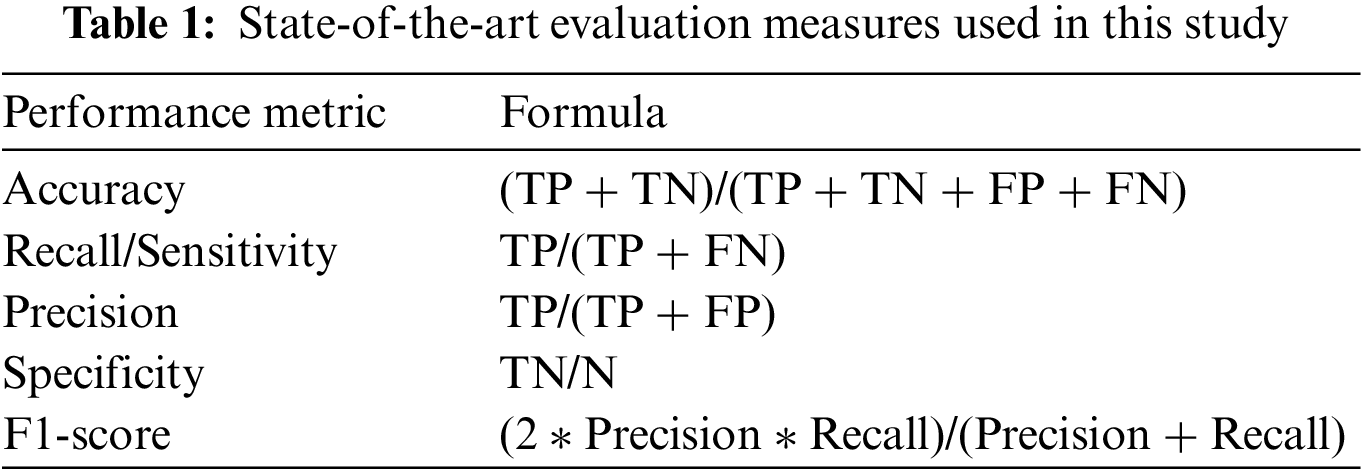
This study uses five state-of-the-art evaluation measures (accuracy, Sensitivity, Specificity, Recall, F1-score, and Receiver Operating Characteristic (ROC)) to evaluate the proposed methodology [51,52]. Table 1 shows the evaluation measure used in this study. True Positive (TP) demonstrates that a patient was accurately diagnosed, whereas True Negative (TN) demonstrates that a person who does not possess a disease was correctly identified. False Negative (FN) reveals that the patient has a disease despite being expected to be healthy. Additionally, the patient is healthy, according to False Positive (FP), despite the diagnosis of the disease. Accuracy depicts the diseases that are correctly classified. Sensitivity is the aptitude to categorize images with diseased areas. Specificity is used to recognize images with no symptoms of a diseased area. The harmonic mean of a classifier’s accuracy and recall is used to create the F1-score, which integrates both metrics into a single number. F1-score is employed to access the performance of two classifiers. Finally, ROC visually compares two classifiers by plotting TP and FP rates at various thresholds.
This section discusses the results of the proposed model under different experimental setups. Table 2 shows the comparative analysis of the proposed approach with state-of-the-art Machine learning and deep learning algorithms (Logistic regression, Artificial neural network, Random Forest, and Stack autoencoder). The proposed model, FESAE, has the highest accuracy of 98.82% compared to other state-of-the-art algorithms. Moreover, the proposed approach achieved the highest precision, recall, specificity, and F1-score (0.9933, 0.9737, 0.9965, and 2.9731).
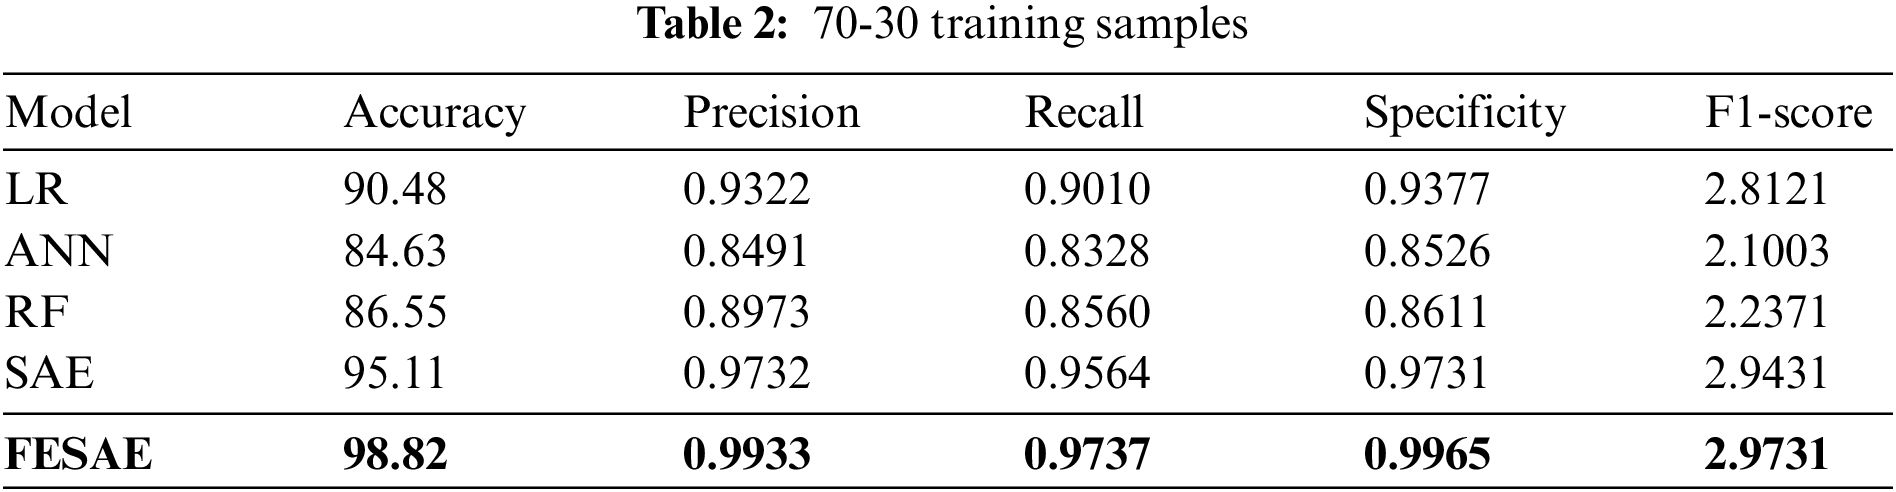
Fig. 6 shows the ROC curve that comprehends different algorithm statistical measures (True positive and False positive). The proposed approach obtained the highest Area Under Curve (AUC) of 0.9, which means FESAE has a high true positive rate.
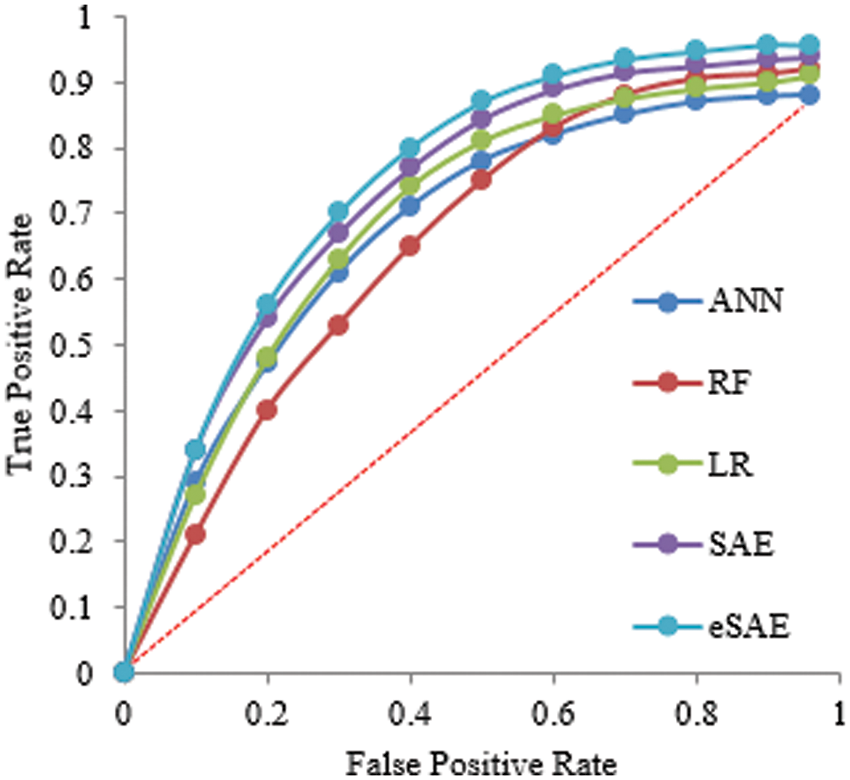
Figure 6: Statistical comparison of five classifiers having a 70-30 ratio for training
Tables 2 and 3 show the supremacy of the proposed approach compared to state-of-the-art in the training and testing phase with 98% accuracy, 0.9844 precision, 0.9795 recall, 0.9751 specificity, and 2.9687 F1-score. In the 70-30 division, the testing ratio for the dataset is 30%. Fig. 7 illustrates the ROC curve as FESAE has the highest True positive and ANN has the highest false positive rates for a testing sample of a 70-30 ratio. This graph helps to comprehend and compare the diagnostic power of different algorithms in this paper.
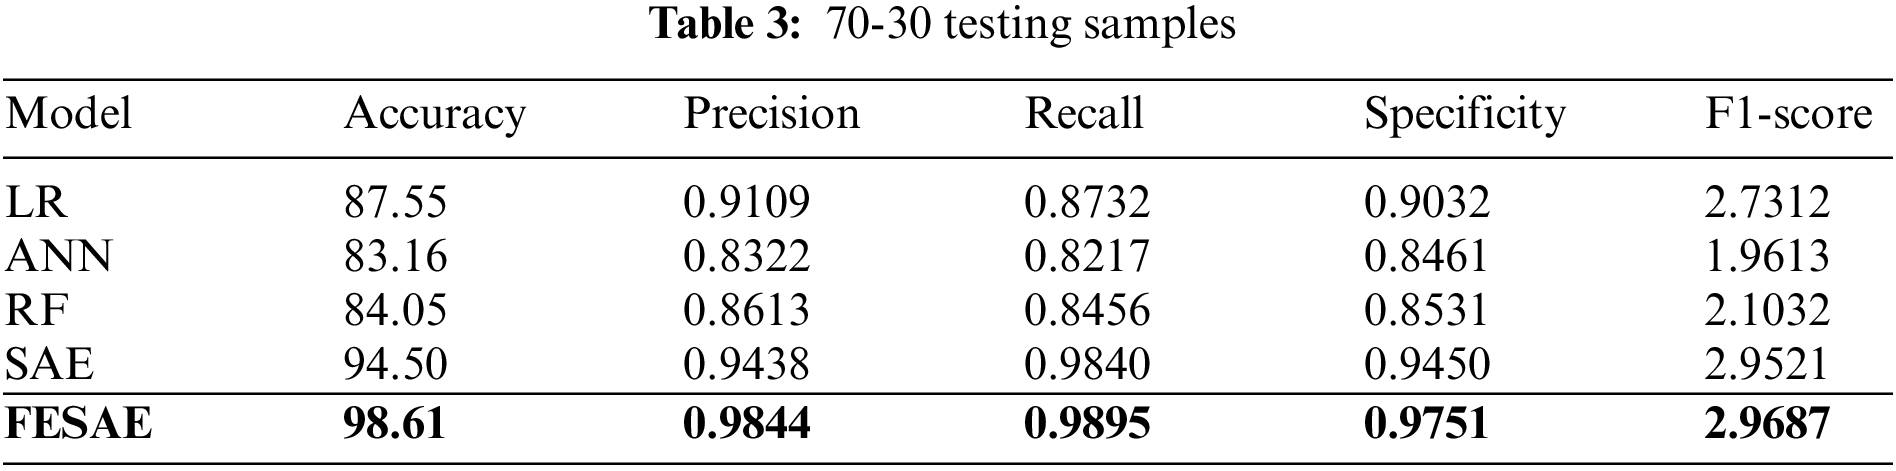
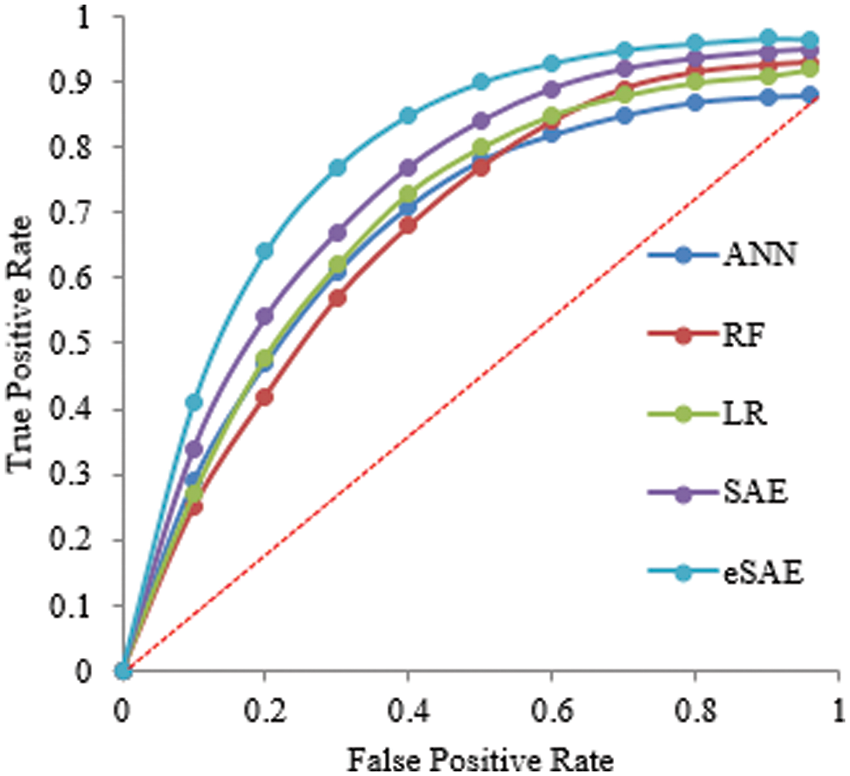
Figure 7: Statistical comparison of five classifiers having a 70-30 ratio for testing
Table 4 shows the evaluation of the proposed approach at 60-40 division of the dataset for training and testing. The proposed approach (FESAE) outperforms with 97.90 accuracy, 0.9768 precision, 0.9912 Recall, 0.9774 Specificity, and 2.9736 F1-score. Fig. 8 depicts the proposed approach’s accuracy and superiority compared to state-of-the-art algorithms with the highest True positive rate.
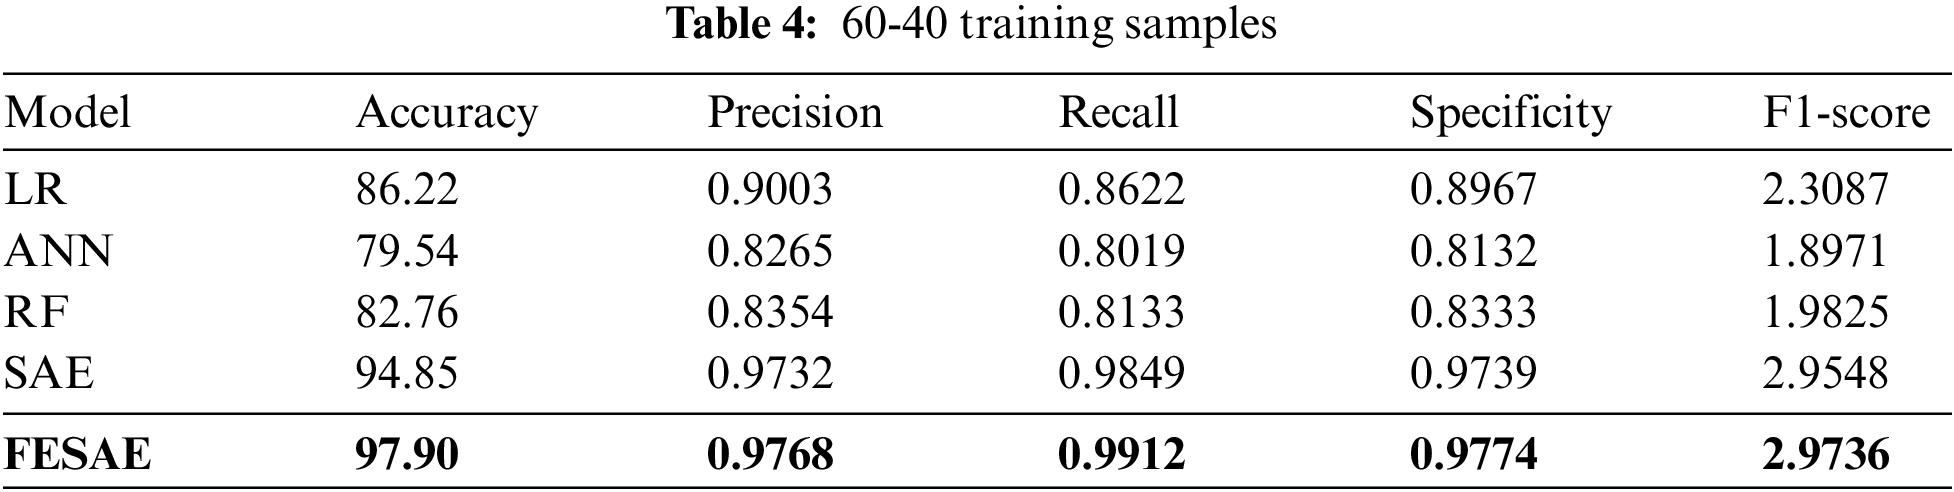
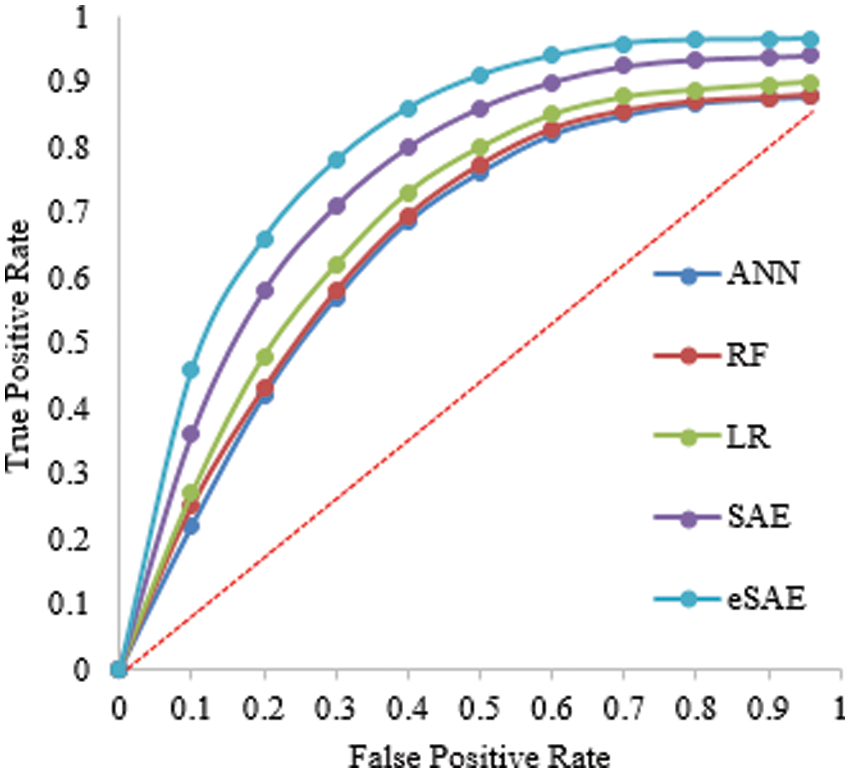
Figure 8: Statistical comparison of five classifiers having a 60-40 training ratio
The proposed FESAE again outperforms compared to state-of-the-art algorithms. The results of testing samples of a 60-40 ratio as shown in Table 5. However, the 70-30 training and testing ratio gave better results than the 60-40. Fig. 9 shows the ROC curve of the 60-40 testing that the true positive rate for FESAE is highest compared to the state-of-the-art.

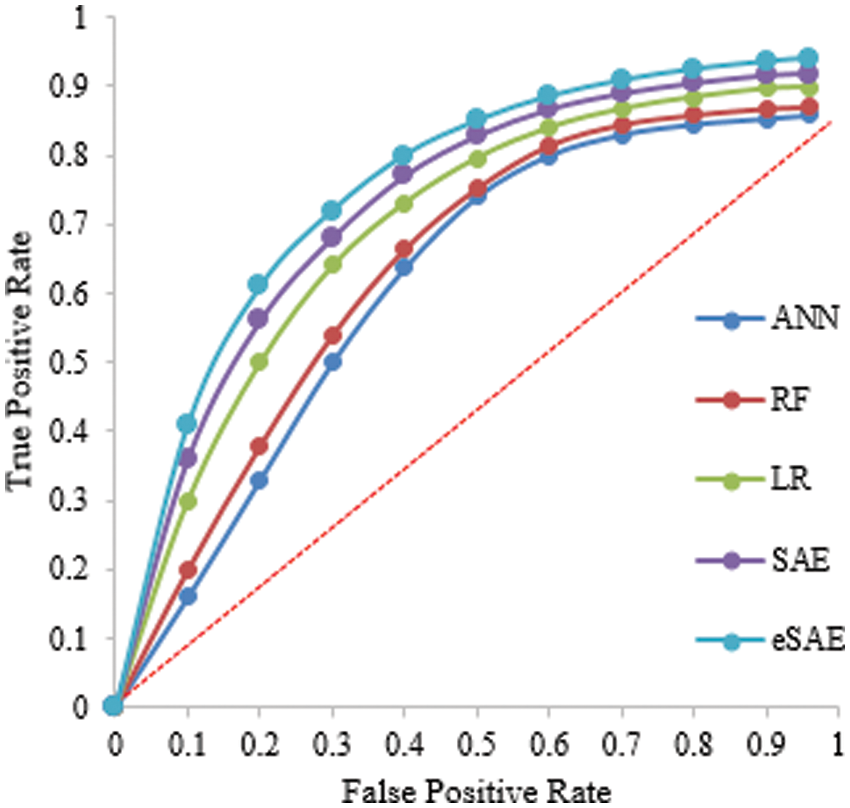
Figure 9: Statistical comparison of five classifiers having a 60-40 testing ratio
4.4 Comparison of the Proposed Approach with State-of-the-art
This section compares the proposed approach with state-of-art under the same experimental setup. It is evident from Table 6 and Fig. 10 that the proposed method outperforms the state-of-the-art by achieving 98.61% accuracy. This study also used the same hyperparameters for comparative analysis.

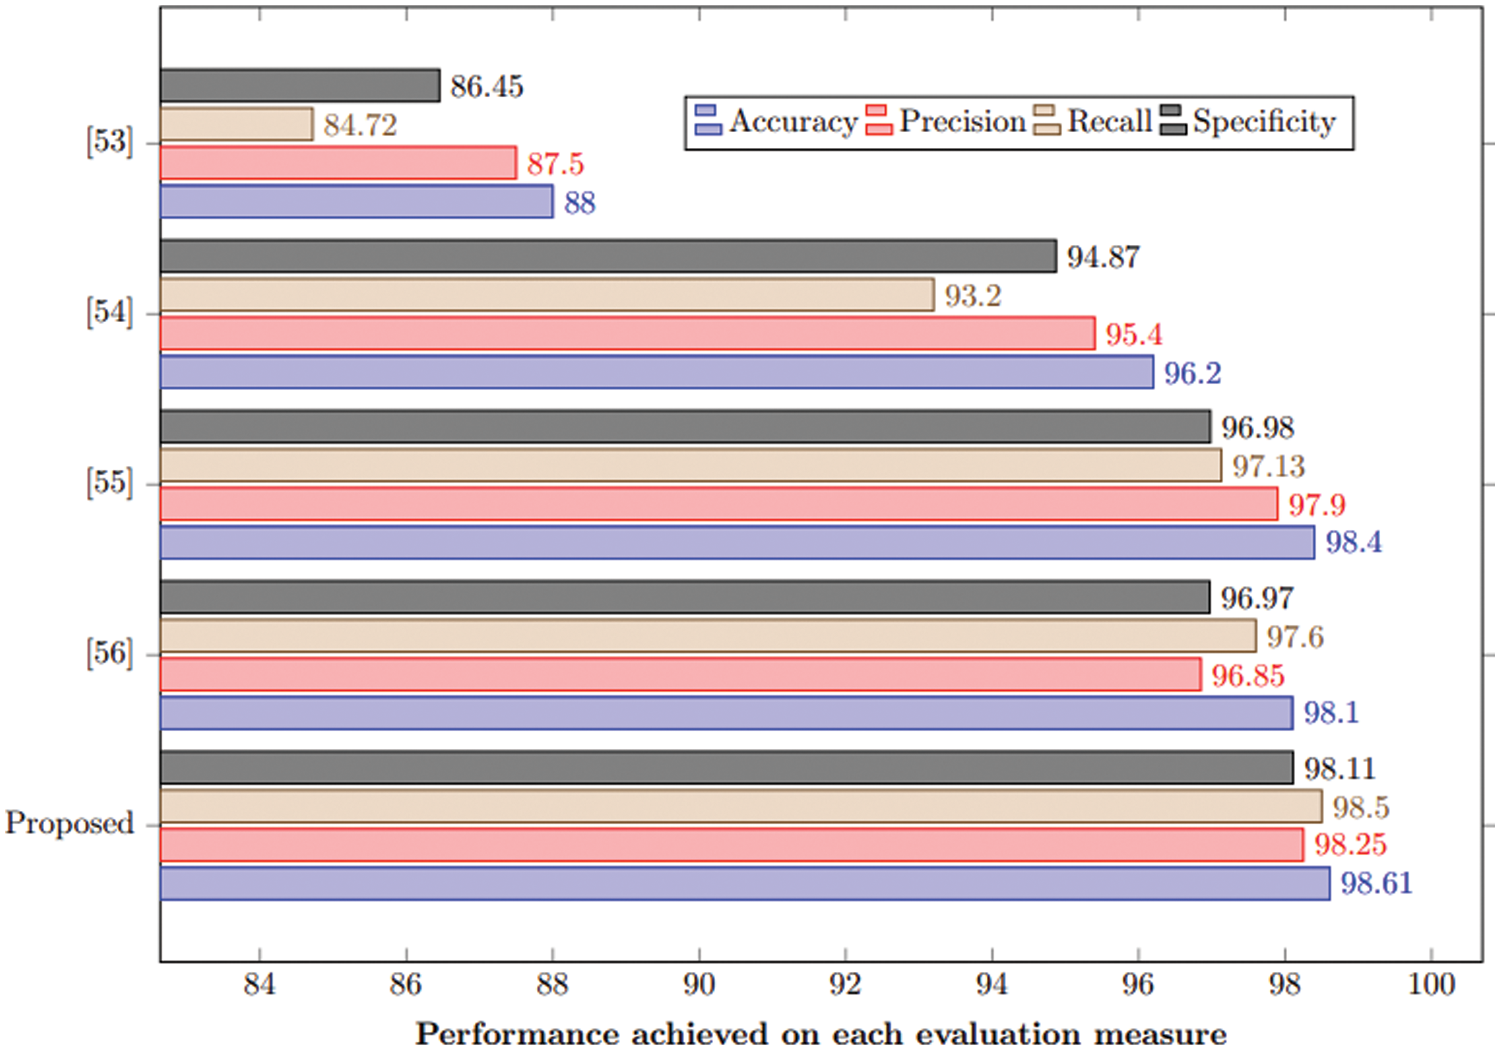
Figure 10: Comparison of the proposed method with state-of-the-art
This paper has targeted a critical drawback associated with the Stack Auto Encoder algorithm with special reference to Feature Enhanced Stacked Auto Encoder (FESAE). In the prior algorithm, features with less or redundant information were added to an image, resulting in less accuracy. However, this issue is resolved in the proposed methodology by introducing some modifications at the Feature Extraction stage. In the FESAE feature, an enhanced factor is introduced to discriminate features with less activation energy to get non-trivial features to train the Autoencoder more effectively and accurately. Feature-enhanced auto encoders combine to form enhanced feature layers to achieve discriminative and robust features from original images. Each layer has multiple features which are further trained by the FESAE classifier. Experimental results have been obtained for two different ratios of the dataset (70-30 and 60-40), but the maximum accuracy for the proposed system is obtained on a 70-30 ratio for four different classes (normal, Alzheimer, brain tumour, and stroke) of the dataset. This study outperforms compared to state-of-the-art machine learning and deep learning algorithms by achieving 98.82% accuracy on the training sample and 98.61% on testing samples. The proposed model has significant potential for assisting radiologists in diagnosing brain diseases more accurately and improving patient outcomes.
However, there are also some limitations to using the FESAE model for disease detection in brain MRI. One limitation is that the model requires a large amount of labelled data to be trained effectively, increasing its computational complexity. This can be a challenge in medical imaging, where obtaining labelled data can be time-consuming and expensive. Additionally, the model may not generalize to unseen data if the training data does not represent the studied population. Finally, the model may be unable to detect all types of diseases or have difficulty distinguishing between similar types.
Funding Statement: This work was supported by financial support from Universiti Sains Malaysia (USM) under FRGS Grant Number FRGS/1/2020/TK03/USM/02/1 and the School of Computer Sciences USM for their support.
Availability of Data and Materials:: Data used in the article is present on Kaggle and the Harvard medical college website [27].
Conflicts of Interest: The authors declare that they have no conflicts of interest to report regarding the present study.
References
1. J. Lisman, “The challenge of understanding the brain: Where we stand in 2015,” Neuron, vol. 86, no. 4, pp. 864–882, 2015. [Google Scholar] [PubMed]
2. M. E. Shenton, R. Kikinis, F. A. Jolesz, S. D. Pollak, M. LeMay et al., “Abnormalities of the left temporal lobe and thought disorder in schizophrenia: A quantitative magnetic resonance imaging study,” New England Journal of Medicine, vol. 327, no. 9, pp. 604–612, 1992. [Google Scholar] [PubMed]
3. P. Brennan and G. D. Smith, “Identifying novel causes of cancers to enhance cancer prevention: New strategies are needed,” JNCI: Journal of the National Cancer Institute, vol. 114, no. 3, pp. 353–360, 2022. [Google Scholar] [PubMed]
4. H. Moch, M. B. Amin, D. M. Berney, E. M. Compérat, A. J. Gill et al., “The 2022 World Health Organization classification of tumours of the urinary system and male genital organs—part A: Renal, penile, and testicular tumours,” European Urology, vol. 82, no. 5, pp. 483–486, 2022. [Google Scholar]
5. E. Molinari, T. R. Mendoza and M. R. Gilbert, “Opportunities and challenges of incorporating clinical outcome assessments in brain tumor clinical trials,” Neuro-Oncology Practice, vol. 6, no. 2, pp. 81–92, 2019. [Google Scholar] [PubMed]
6. M. Sharma, S. Gupta, H. Aggarwal, T. Aggarwal, D. Gupta et al., “Quantum Grey Wolf optimization and evolutionary algorithms for diagnosis of Alzheimer’s disease,” International Journal of Modelling, Identification and Control, vol. 41, no. 1–2, pp. 53–67, 2022. [Google Scholar]
7. H. Mzoughi, I. Njeh, A. Wali, M. B. Slima, A. BenHamida et al., “Deep multiscale 3D convolutional neural network (CNN) for MRI gliomas brain tumor classification,” Journal of Digital Imaging, vol. 33, no. 4, pp. 903–915, 2020. [Google Scholar] [PubMed]
8. F. Jiang, Y. Jiang, H. Zhi, Y. Dong, H. Li et al., “Artificial intelligence in healthcare: Past, present and future,” Stroke and Vascular Neurology, vol. 2, no. 4, pp. 230–243, 2017. [Google Scholar] [PubMed]
9. D. Sheth and M. L. Giger, “Artificial intelligence in the interpretation of breast cancer on MRI,” Journal of Magnetic Resonance Imaging, vol. 51, no. 5, pp. 1310–1324, 2020. [Google Scholar] [PubMed]
10. A. Dey, “Machine learning algorithms: A review,” International Journal of Computer Science and Information Technologies, vol. 7, no. 3, pp. 1174–1179, 2016. [Google Scholar]
11. J. E. VanEngelen and H. H. Hoos, “A survey on semi-supervised learning,” Machine Learning, vol. 109, no. 2, pp. 373–440, 2020. [Google Scholar]
12. B. Kiumarsi, K. G. Vamvoudakis, H. Modares and F. L. Lewis, “Optimal and autonomous control using reinforcement learning: A survey,” IEEE Transactions on Neural Networks and Learning Systems, vol. 29, no. 6, pp. 2042–2062, 2017. [Google Scholar]
13. X. Zhang, Y. Li, X. Peng, X. Qiao, H. Zhang et al., “Correlation encoder-decoder model for text generation,” in 2022 Int. Joint Conf. on Neural Networks (IJCNN), Padua, Italy, pp. 1–7, 2022. [Google Scholar]
14. D. Ravì, C. Wong, F. Deligianni, M. Berthelot, J. Andreu-Perez et al., “Deep Learning for health informatics,” IEEE Journal of Biomedical and Health Informatics, vol. 21, no. 1, pp. 4–21, 2016. [Google Scholar]
15. Y. Mo, Y. Wu, X. Yang, F. Liu and Y. Liao, “Review the state-of-the-art technologies of semantic segmentation based on deep learning,” Neurocomputing, vol. 493, no. 1, pp. 626–646, 2022. [Google Scholar]
16. I. Abd El Kader, G. Xu, Z. Shuai, S. Saminu, I. Javaid et al., “Brain tumor detection and classification on MR images by a deep wavelet auto-encoder model,” Diagnostics, vol. 11, no. 9, pp. 15–89, 2021. [Google Scholar]
17. M. Panda and B. Das, “Grey wolf optimizer and its applications: A survey,” in Proc. of the Third Int. Conf. on Microelectronics, Computing and Communication Systems, Singapore, Springer, pp. 179–194, 2019. [Google Scholar]
18. R. Han, Z. Liu and C. P. Chen, “Multiscale 3D convolution feature-based Broad Learning System for Alzheimer’s Disease diagnosis via MRI images,” Applied Soft Computing, vol. 1, no. 20, pp. 10–21, 2022. [Google Scholar]
19. M. Sethi, S. Rani, A. Singh and J. L. V. Mazón, “A CAD system for Alzheimer’s disease classification using neuroimaging MRI 2D slices,” Computational and Mathematical Methods in Medicine, vol. 22, no. 1, pp. 1–11, 2022. [Google Scholar]
20. M. Havaei, A. Davy, D. Warde-Farley, A. Biard, A. Courville et al., “Brain tumor segmentation with deep neural networks,” Medical Image Analysis, vol. 35, no. 1, pp. 18–31, 2017. [Google Scholar] [PubMed]
21. H. Chen, Q. Dou, L. Yu, J. Qin and P. A. Heng, “VoxResNet: Deep voxelwise residual networks for brain segmentation from 3D MR images,” NeuroImage, vol. 170, no. 1, pp. 446–455, 2018. [Google Scholar] [PubMed]
22. S. Debnath, F. A. Talukdar and M. Islam, “Complete 3D brain tumour detection using a two-phase method along with confidence function evaluation,” Multimedia Tools and Applications, vol. 81, no. 1, pp. 437–458, 2022. [Google Scholar]
23. M. Rasool, N. A. Ismail, W. Boulila, A. Ammar, H. Samma et al., “A hybrid deep learning model for brain tumour classification,” Entropy, vol. 24, no. 6, 799, 2022. [Google Scholar]
24. H. Shahamat and M. S. Abadeh, “Brain Magnetic Resonance Imaging analysis using a deep learning based evolutionary approach,” Neural Networks, vol. 12, no. 6, pp. 218–234, 2020. [Google Scholar]
25. P. K. Mallick, S. H. Ryu, S. K. Satapathy, S. Mishra, G. N. Nguyen et al., “Brain MRI image classification for cancer detection using deep wavelet autoencoder-based deep neural network,” IEEE Access, vol. 7, no. 1, pp. 46278–46287, 2019. [Google Scholar]
26. C. L. Choudhury, C. Mahanty, R. Kumar and B. K. Mishra, “Brain tumor detection and classification using convolutional neural network and deep neural network,” in 2020 Int. Conf. on Computer Science, Engineering and Applications (ICCSEA), Gunupur, India, pp. 1–4, 2020. [Google Scholar]
27. Z. Huang, H. Xu, S. Su, T. Wang, Y. Luo et al., “A computer-aided diagnosis system for brain magnetic resonance imaging images using a novel differential feature neural network,” Computers in Biology and Medicine, vol. 121, no. 1, 103818, 2020. [Google Scholar]
28. N. Kakhandaki, S. B. Kulkarni, K. Ramesh and U. P. Kulkarni, “Classification of brain haemorrhages in MRI using naïve bayes-probabilistic kernel approach,” Journal of Cases on Information Technology (JCIT), vol. 21, no. 3, pp. 51–65, 2019. [Google Scholar]
29. H. T. Zaw, N. Maneerat and K. Y. Win, “Brain tumour detection based on Naïve Bayes Classification,” in 2019 5th Int. Conf. on Engineering, Applied Sciences and Technology (ICEAST), Luang Prabang, Laos,pp. 1–4, 2019. [Google Scholar]
30. M. Sharma, G. N. Purohit and S. Mukherjee, “Information retrieves from brain MRI images for tumor detection using hybrid technique K-means and artificial neural network (KMANN),” in Networking Communication and Data Knowledge Engineering, Singapore: Springer, pp. 145–157, 2018. [Google Scholar]
31. U. R. Acharya, S. L. Fernandes, J. E. WeiKoh, E. J. Ciaccio, M. K. M. Fabell et al., “Automated detection of Alzheimer’s disease using brain MRI images-a study with various feature extraction techniques,” Journal of Medical Systems, vol. 43, no. 9, pp. 1–14, 2019. [Google Scholar]
32. M. Fayaz, A. S. Shah, F. Wahid and A. Shah, “A robust technique of brain MRI classification using color features and k-nearest neighbor’s algorithm,” International Journal of Signal Processing, Image Processing and Pattern Recognition, vol. 9, no. 10, pp. 11–20, 2016. [Google Scholar]
33. D. V. Kumar and V. V. J. R. Krishniah, “An automated framework for stroke and haemorrhage detection using decision tree classifier,” in Int. Conf. on Communication and Electronics Systems (ICCES),Coimbatore, India, pp. 1–6, 2016. [Google Scholar]
34. A. Halder and O. Dobe, “Detection of tumor in brain MRI using fuzzy feature selection and support vector machine,” in 2016 Int. Conf. on Advances in Computing, Communications and Informatics (ICACCI), Jaipur, India, pp. 1919–1923, 2016. [Google Scholar]
35. X. Lei, X. Yu, J. Chi, Y. Wang, J. Zhang et al., “Brain tumor segmentation in MR images using a sparse constrained level set algorithm,” Expert Systems With Applications, vol. 168, no. 1, pp. 114–262, 2021. [Google Scholar]
36. C. Lu, Z. Y. Wang, W. L. Qin and J. Ma, “Fault diagnosis of rotary machinery components using a stacked denoising autoencoder-based health state identification,” Signal Processing, vol. 130, no. 1, pp. 377–388, 2017. [Google Scholar]
37. Q. Lin, S. Q. Ye, X. M. Huang, S. Y. Li, M. Z. Zhang et al., “Classification of epileptic EEG signals with stacked sparse Autoencoder based on deep learning,” in Int. Conf. on Intelligent Computing, Lanzhou, China, Springer, pp. 802–810, 2016. [Google Scholar]
38. X. Pan, Y. X. Fan, J. Yan and H. B. Shen, “IPMiner: Hidden ncRNA-protein interaction sequential pattern mining with stacked Autoencoder for accurate computational prediction,” BMC Genomics, vol. 17, no. 1, pp. 1–14, 2018. [Google Scholar]
39. H. Chen, J. Shen, L. Wang and J. Song, “Leveraging stacked denoising autoencoder in prediction of pathogen-host protein-protein interactions,” in 2017 IEEE Int. Congress on Big Data (BigData Congress), Honolulu, HI, USA, pp. 368–375, 2017. [Google Scholar]
40. K. Kannadasan, D. R. Edla and V. Kuppili, “Type 2 diabetes data classification using stacked autoencoders in deep neural networks,” Clinical Epidemiology and Global Health, vol. 7, no. 4, pp. 530–535, 2019. [Google Scholar]
41. A. Khamparia, G. Saini, B. Pandey, S. Tiwari, D. Gupta et al., “KDSAE: Chronic kidney disease classification with multimedia data learning using deep stacked autoencoder network,” Multimedia Tools and Applications, vol. 79, no. 47, pp. 35425–35440, 2020. [Google Scholar]
42. V. Saravanan, R. D. J. Samuel, S. Krishnamoorthy and A. Manickam, “Deep learning assisted convolutional auto-encoders framework for glaucoma detection and anterior visual pathway recognition from retinal fundus images,” Journal of Ambient Intelligence and Humanized Computing, vol. 1, no. 1, pp. 1–11, 2022. [Google Scholar]
43. M. Menagadevi, S. Mangai, N. Madian and D. Thiyagarajan, “Automated prediction system for Alzheimer detection based on deep residual autoencoder and support vector machine,” Optik, vol. 27, no. 2, pp. 170–212, 2023. [Google Scholar]
44. K. Adem, “Diagnosis of breast cancer with Stacked Autoencoder and Subspace kNN,” Physica A: Statistical Mechanics and its Applications, vol. 55, no. 1, pp. 124591, 2020. [Google Scholar]
45. S. Li, H. Jiang, J. Bai, Y. Liu and Y. D. Yao, “Stacked sparse autoencoder and case-based postprocessing method for nucleus detection,” Neurocomputing, vol. 35, no. 9, pp. 494–508, 2019. [Google Scholar]
46. L. Wang, Z. H. You, J. Q. Li and Y. A. Huang, “IMS-CDA: Prediction of CircRNA-disease associations from the integration of multi-source similarity information with deep stacked autoencoder model,” IEEE Transactions on Cybernetics, vol. 51, no. 11, pp. 5522–5531, 2020. [Google Scholar]
47. Z. Li, K. Yang, L. Zhang, C. Wei, P. Yang et al., “Classification of thyroid nodules with stacked denoising sparse autoencoder,” International Journal of Endocrinology, vol. 2020, no. 1, pp. 1–8, 2020. [Google Scholar]
48. M. Mehrnia, E. Kholmovski, R. Passman, A. Katsaggelos, S. Nazarian et al., “Stochastic fibrosis signatures from 3D LGE: Novel threshold-free quantification of left atrial fibrosis,” in Joint Annual Meeting ISMRM-ESMRMB and ISMRT 31st Annual Meeting, London, England, UK, pp. 36–44, 2022. [Google Scholar]
49. N. Dhengre and S. Sinha, “K sparse autoencoder-based accelerated reconstruction of magnetic resonance imaging,” The Visual Computer, vol. 38, no. 3, pp. 837–847, 2022. [Google Scholar]
50. X. Nie, S. Liu and G. Xie, “A novel autoencoder with dynamic feature enhanced factor for fault diagnosis of wind turbine,” Electronics, vol. 9, no. 4, pp. 600–619, 2020. [Google Scholar]
51. L. Mishra and S. Verma, “Graph attention autoencoder inspired CNN based brain tumor classification using MRI,” Neurocomputing, vol. 50, no. 3, pp. 236–247, 2022. [Google Scholar]
52. P. Jyothi and A. R. Singh, “Deep learning models and traditional automated techniques for brain tumor segmentation in MRI: A review,” Artificial Intelligence Review, vol. 1, no. 1, pp. 1–47, 2022. [Google Scholar]
53. I. Wahlang, A. K. Maji, G. Saha, P. Chakrabarti, M. Jasinski et al., “Brain magnetic resonance imaging classification using deep learning architectures with gender and age,” Sensors, vol. 22, no. 5, pp. 1766, 2022. [Google Scholar] [PubMed]
54. C. Srinivas, N. P. KS, M. Zakariah, Y. A. Alothaibi, K. Shaukat et al., “Deep transfer learning approaches in performance analysis of brain tumor classification using MRI images,” Journal of Healthcare Engineering, vol. 22, no. 1, pp. 1–32, 2022. [Google Scholar]
55. M. O. Khairandish, M. Sharma, V. Jain, J. M. Chatterjee and N. Z. Jhanjhi, “A hybrid CNN-SVM threshold segmentation approach for tumor detection and classification of MRI brain images,” IRBM, vol. 43, no. 4, pp. 290–299, 2022. [Google Scholar]
56. T. Muezzinoglu, N. Baygin, I. Tuncer, P. D. Barua, M. Baygin et al., “PatchResNet: Multiple patch division-based deep feature fusion framework for brain tumor classification using MRI images,” Journal of Digital Imaging, vol. 1, no. 1, pp. 1–15, 2023. [Google Scholar]
Cite This Article
 Copyright © 2023 The Author(s). Published by Tech Science Press.
This work is licensed under a Creative Commons Attribution 4.0 International License , which permits unrestricted use, distribution, and reproduction in any medium, provided the original work is properly cited.
 Downloads
 Citation Tools