
 Submit a Paper
 Propose a Special lssue
 Open Access
ARTICLE
Underwater Waste Recognition and Localization Based on Improved YOLOv5
1 School of Mechanical Engineering, North China University of Water Resources and Electric Power, Zhengzhou, 450011, China
2 Henan Key Laboratory of Underwater Intelligent Equipment, (713th Research Institute of China State Shipbuilding Corporation Limited), Zhengzhou, 40015, China
* Corresponding Author: Jinxing Niu. Email:
Computers, Materials & Continua 2023, 76(2), 2015-2031. https://doi.org/10.32604/cmc.2023.040489
Received 20 March 2023; Accepted 05 June 2023; Issue published 30 August 2023
 View Full Text
 Download PDF
Abstract
With the continuous development of the economy and society, plastic pollution in rivers, lakes, oceans, and other bodies of water is increasingly severe, posing a serious challenge to underwater ecosystems. Effective cleaning up of underwater litter by robots relies on accurately identifying and locating the plastic waste. However, it often causes significant challenges such as noise interference, low contrast, and blurred textures in underwater optical images. A weighted fusion-based algorithm for enhancing the quality of underwater images is proposed, which combines weighted logarithmic transformations, adaptive gamma correction, improved multi-scale Retinex (MSR) algorithm, and the contrast limited adaptive histogram equalization (CLAHE) algorithm. The proposed algorithm improves brightness, contrast, and color recovery and enhances detail features resulting in better overall image quality. A network framework is proposed in this article based on the YOLOv5 model. MobileViT is used as the backbone of the network framework, detection layer is added to improve the detection capability for small targets, self-attention and mixed-attention modules are introduced to enhance the recognition capability of important features. The cross stage partial (CSP) structure is employed in the spatial pyramid pooling (SPP) section to enrich feature information, and the complete intersection over union (CIOU) loss is replaced with the focal efficient intersection over union (EIOU) loss to accelerate convergence while improving regression accuracy. Experimental results proved that the target recognition algorithm achieved a recognition accuracy of 0.913 and ensured a recognition speed of 45.56 fps/s. Subsequently, Using red, green, blue and depth (RGB-D) camera to construct a system for identifying and locating underwater plastic waste. Experiments were conducted underwater for recognition, localization, and error analysis. The experimental results demonstrate the effectiveness of the proposed method for identifying and locating underwater plastic waste, and it has good localization accuracy.Keywords
Plastic waste in water bodies has gained widespread attention due to its persistence and negative impact on aquatic ecosystems and human health [1]. Plastic accounts for over 80% of the artificial debris observed in rivers. Removing plastic waste from underwater environments would have a tremendous benefit to the underwater ecosystem. Research has demonstrated that removing plastic waste from underwater environments can significantly benefit the underwater ecosystem [2]. However, current methods for removing plastic waste from inland water surfaces rely mainly on mechanical equipment such as manual salvage ships, while underwater plastic waste removal is performed through manual manipulation of robotic arms, which is both time-consuming and inefficient. Fortunately, autonomous underwater vehicles (AUV) have introduced a new approach to underwater plastic waste removal. During the process of underwater waste cleaning with AUV, an excellent target detection and localization algorithm is crucial.
However, even minor changes in the environment can significantly alter the appearance of underwater objects. For example, changes in lighting can affect shallower waters, and turbid waters can make objects difficult to observe [3,4]. Traditional identification methods typically involve human visual counting [5,6], sampling with nets [7], or counting plastic samples within a fence in a specific area [8]. While Ge et al. [9] used laser radar to identify waste on the shore, and Lorenzo-Navarro et al. [10] proposed a method using the Sauvola threshold algorithm for plastic classification and counting. However, traditional methods require a significant amount of human or additional equipment, and the efficient is low [11].
Target detection is one of the core problems in computer vision, which involves identifying and locating objects of interest within images or videos and determining their size and position in the scene. With the development of deep learning, significant progress has been made in this area, bringing new advances to the recognition and detection of underwater plastic waste. By extensively training models, deep learning can extract target features from images and use them to complete object classification and recognition tasks. This approach has been widely employed in underwater target detection. In order to solve the problems of the complex underwater environment and insufficient underwater light in the detection of underwater plastic waste, Hu et al. [12] proposed an improved underwater plastic waste detection algorithm based on YOLOv5n. Kylili et al. [13] proposed a CNN algorithm for classifying floating plastic fragments in water bodies, but the algorithm requires object-centered cropped images. Liu et al. [14] improved the detection ability of underwater waste based on the YOLOv3 model using adversarial learning to enable the model to learn the features of the same target in different underwater environments.
In terms of underwater target localization, Xing et al. [15] propose a novel RGB-D camera and inertial measurement unit (IMU) fusion-based cooperative and relative close-range localization approach for special environments, and the efficiency of RGB-D camera for underwater application is validated. Yang et al. [16] proposed a novel vision-based underwater positioning system using a light detection and ranging (LiDAR) camera and an inertial measurement unit. The previous work has inspired us to employ RGB-D cameras for close-range underwater object localization.
Indeed, the previous studies mainly focused on the recognition or the localization of underwater waste without integrating these two tasks. Therefore, these studies have limited usefulness for AUV to collect underwater waste. Furthermore, due to the complexity of the underwater environment and the substantial attenuation of light in water, the images captured by the camera often exhibit blurriness, low contrast, and color inconsistencies. Plastic waste in the water is often small, making it challenging to discern. We aim to address these challenges to accurately provide AUVs with the types and three-dimensional spatial coordinates of underwater plastic waste.
Therefore, this article proposes an improved YOLOv5-based method for recognizing and localizing underwater waste. The main contributions of this article are as follows:
1. Introducing a CLAHE and Retinex-based weighted fusion algorithm to improve the quality of underwater images.
2. Designing a network model that combines CNN and Transformer based on the MobileViT backbone, introducing attention mechanism and CSP structure in the neck of the model, using Focal EIOU as the model’s loss function, and adding a small object detection layer. The new network has higher recognition accuracy and detection speed.
3. Combining the MobileViT-YOLOv5 algorithm with the RealSense depth camera to achieve recognition and localization of underwater waste.
4. Adding underwater plastic waste images collected in real-world scenarios to the open-source DeepTrash underwater waste dataset and randomly adjusting the contrast and brightness of the images to expand the dataset.
2 Underwater Image Enhancement Algorithm Based on Weighted Fusion
This section mainly introduces several components of the weighted fusion algorithm for enhancing underwater images, including weighted logarithmic transformation, adaptive gamma correction, improved MSR algorithm, CLAHE algorithm, and fusion rules. The image enhancement process proposed in this article is then explained in detail.
2.1 Weighted Logarithmic Transformation
The logarithmic curve exhibits a steeper slope for lower value ranges and a flatter slope for higher value ranges. As a result, logarithmic transformation can expand the low grayscale values and compress the high grayscale values of an image [17]. However, the changes in brightness in the dark areas of the image after logarithmic transformation are not significant. Hence, this article proposes the use of a weighted logarithmic transformation [18] for brightness enhancement. A coefficient is added to the logarithmic transformation formula, which is equal to 1 when
Here, s represents the output of the corresponding pixel
The traditional Gamma correction algorithm is a global enhancement technique that modifies the distribution of pixel gray levels in an image using a nonlinear transformation function of gray values, resulting in nonlinear tone changes. This method can adjust images with excessively high or low gray levels, improving the overall brightness and contrast. The formula for Gamma transformation is:
Here,
Traditional correction algorithms use the same enhancement function for pixels with different gray levels, which can lead to contrast distortion. Moreover, the adjustment coefficient
2.3 The Improved Multi-Scale Retinex Algorithm
The single-scale Retinex (SSR) algorithm [21] utilizes a Gaussian filter to estimate the illumination component, expressed as follows:
The SSR algorithm has only one adjustable parameter
Here,
Bilateral filtering is a non-linear filtering algorithm proposed based on the Gaussian filtering algorithm. It consists of two functions: geometric spatial distance factor and pixel difference decision coefficient, which comprehensively consider the spatial domain and pixel range domain. It has strong edge-preserving, denoising, and smoothing capabilities, and compared with the Gaussian filter, it can retain more edge and detail information. The mathematical expression of bilateral filtering is:
Here,
2.4 Contrast Limited Adaptive Histogram Equalization
Histogram equalization (HE) is a non-linear transformation technique used to improve the contrast and clarity of an entire image by transforming the grayscale histogram of the image into a uniform distribution. However, the performance of HE is poor when there are areas in the image that are significantly brighter or darker than other areas. CLAHE [23] is an algorithm that can enhance the local contrast of an image. This method first divides the image into several blocks, applies HE to each block, and sets a threshold. When a certain grayscale value in the image histogram exceeds the threshold, the value is clipped, and the excess is evenly distributed among other grayscale levels. In this, the CLAHE algorithm is used to process images, which limits the excessive enhancement of contrast, avoids introducing unnecessary noise, and effectively enhances details in the images.
After preprocessing with the CLAHE and MSR algorithms, two enhanced underwater images are obtained, which need to be fused using a weighted fusion rule [24].
To start with, the R, G and B channel values of the two enhanced images are extracted, and the weight Wpta is calculated as shown in Eq. (8):
Then, calculate the weights Wptb of the images in the hue, saturation and value (HSV) color space using formula (9):
Normalize the weights as shown in Eq. (10):
Finally, the two preprocessed images
Here,
In summary, the flowchart of the underwater enhancement algorithm proposed in this article is illustrated in Fig. 1.
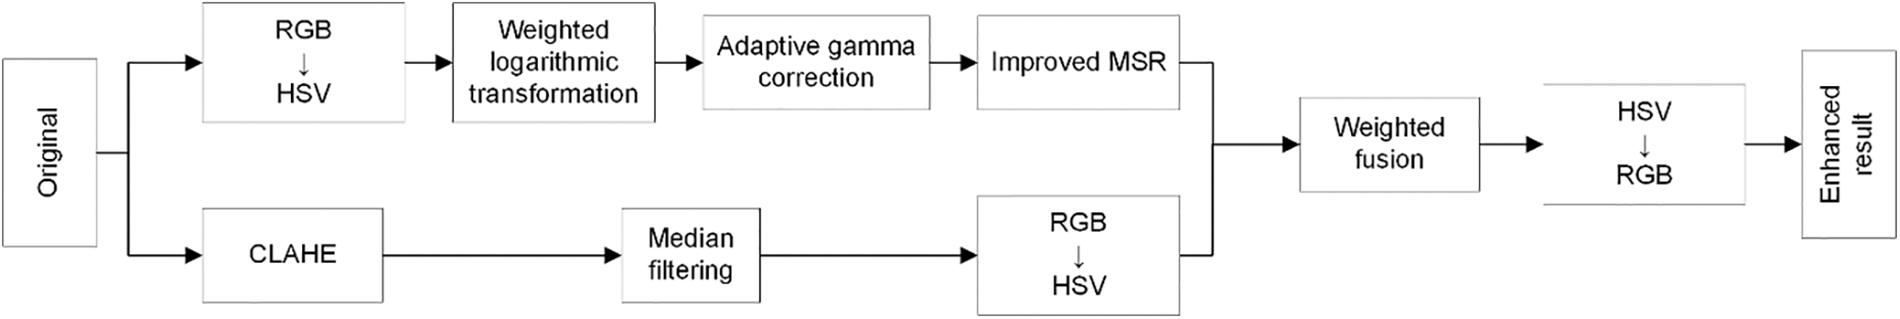
Figure 1: Flow chart of underwater image enhancement algorithm based on weighted fusion
The algorithm flowchart for the underwater enhancement proposed in this article is shown in Fig. 1, and the algorithm steps are as follows:
1. Convert the original RGB image
2. Perform CLAHE and median filtering on the original image
3. Weighted fusion is performed on
3 Improved Algorithm Based on YOLOv5
The ViT model based on the Transformer architecture exhibits powerful performance in various computer vision tasks. However, the large number of parameters in the Transformer model and its slow inference speed make it unfriendly to common devices, requiring high device performance. Even when reducing the size of Transformer models to match the resource constraints of mobile devices, there may be a significant drop in model accuracy and performance that is notably lower than that of lightweight CNNs. To address this issue, researchers have attempted to combine CNN and Transformer structures and proposed new network models, such as Conformer [25], Mobile-Former [26], and CoTNet [27]. Building on this work, Mehta et al. [28] designed MobileViT, which uses the former to extract local features and the latter to extract global features. Compared to traditional lightweight CNNs under given parameter constraints, MobileViT has better performance, generalization ability, and robustness. The network architecture is illustrated in Fig. 2.

Figure 2: MobileViT network model [28]
The MobileViT network is mainly composed of mobilenet-v2 block (MV2) and MobileViT-block. The structure diagram of MobileVit-block indicates that the input feature map obtains both local and global information in the input image after being processed by MobileVit-block. As a result, compared to CNN networks with the same number of parameters, the feature maps output by MobileViT contain richer feature information.
Since the introduction of the spatial pyramid pooling (SPP) [29] module in YOLOv3, both YOLOv4 and YOLOv5 have continued to use this design. YOLOv5 improved on the SPP module and proposed the spatial pyramid pooling fast (SPPF) module to enhance its efficiency. In this article, we introduce spatial pyramid pooling cross stage partial (SPPCSPC) [30] based on the SPP module, illustrated in Fig. 3. The CSP structure [31] is incorporated into the SPP module, where the input is divided into three different branches, and the feature maps from each branch are fused to enrich the feature information.
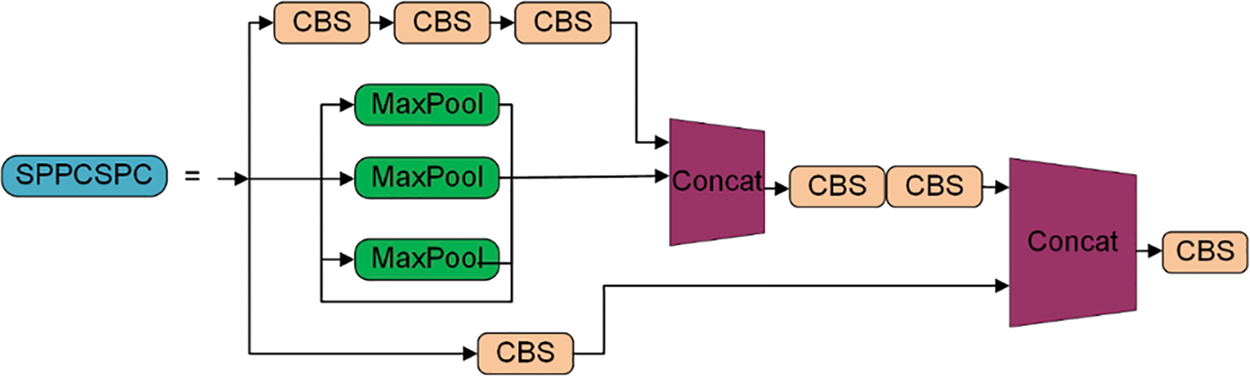
Figure 3: SPPCSPC module [30]
In recent years, attention mechanisms have been widely applied in deep learning to focus on specific parts of input information. The convolutional block attention module (CBAM) [32] is a simple and effective attention module based on spatial and channel attention, used to focus on local feature information. The transformer encoder block can capture global feature information, which is helpful in the field of object detection. Inspired by this, the CBAM module and transformer encoder block (TRE) [33] are introduced into the neck part of the original YOLOv5. The new structure can utilize attention mechanisms to dig some features and focus on more interesting target areas.
The CBAM module, illustrated in Fig. 4, is a module that combines both channel attention and spatial attention. The input feature map is processed sequentially by the channel attention submodule and the spatial attention submodule, which focus on information in the channel and spatial dimensions respectively. The corresponding weights are then fed back to the original input. This enables easy integration of the module into existing network structures for end-to-end training, and the computational cost of adding the module is negligible.
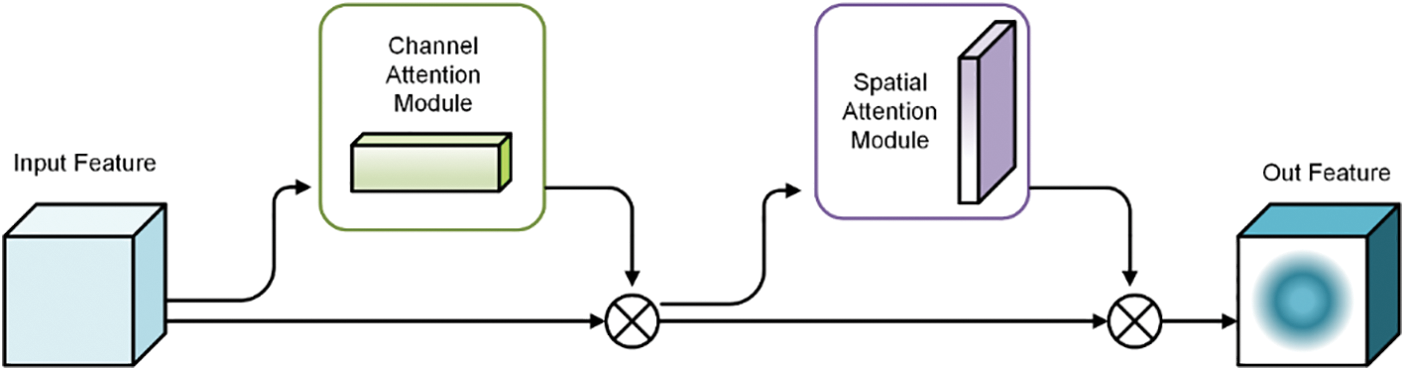
Figure 4: CBAM module [32]
Illustrated in Fig. 5, the TRE module mainly comprises two components: a multi-head attention block and a feedforward neural network structure. LayerNorm and dropout are employed to facilitate network convergence and mitigate overfitting. Multi-head attention allows the network to not only attend to the current position but also capture contextual semantic information, enabling it to extract more comprehensive and relevant features from the input.
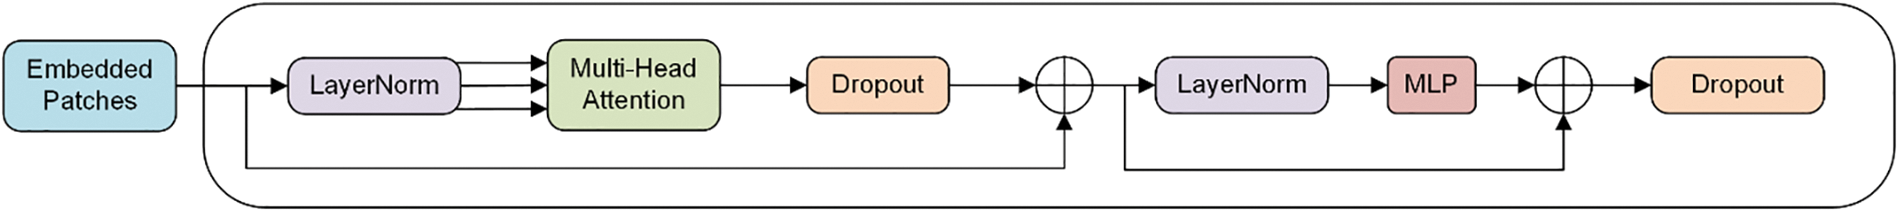
Figure 5: Transformer encoder structure [33]
YOLOv5 uses CIOU-Loss as the localization loss function, which reflects the relative proportion difference of aspect ratio rather than the true difference of width and height. EIOU [34] separates the aspect ratio into width and height, calculates them separately for predicted and ground truth boxes based on CIOU. EIOU mainly consists of three factors: overlapping area, center point distance, and width and height differences. The formula is as follows:
Here,
During the generation of predicted boxes, there is an issue of sample imbalance in the training process of box regression, where the number of high-quality anchor boxes with small regression errors is much smaller than the number of low-quality anchor boxes with large errors. To address this, focal loss is combined with EIOU to distinguish high-quality and low-quality anchor boxes. The formula is as follows:
Here,
3.5 Implementation of Improved Algorithm
The improved model architecture is illustrated in Fig. 6:
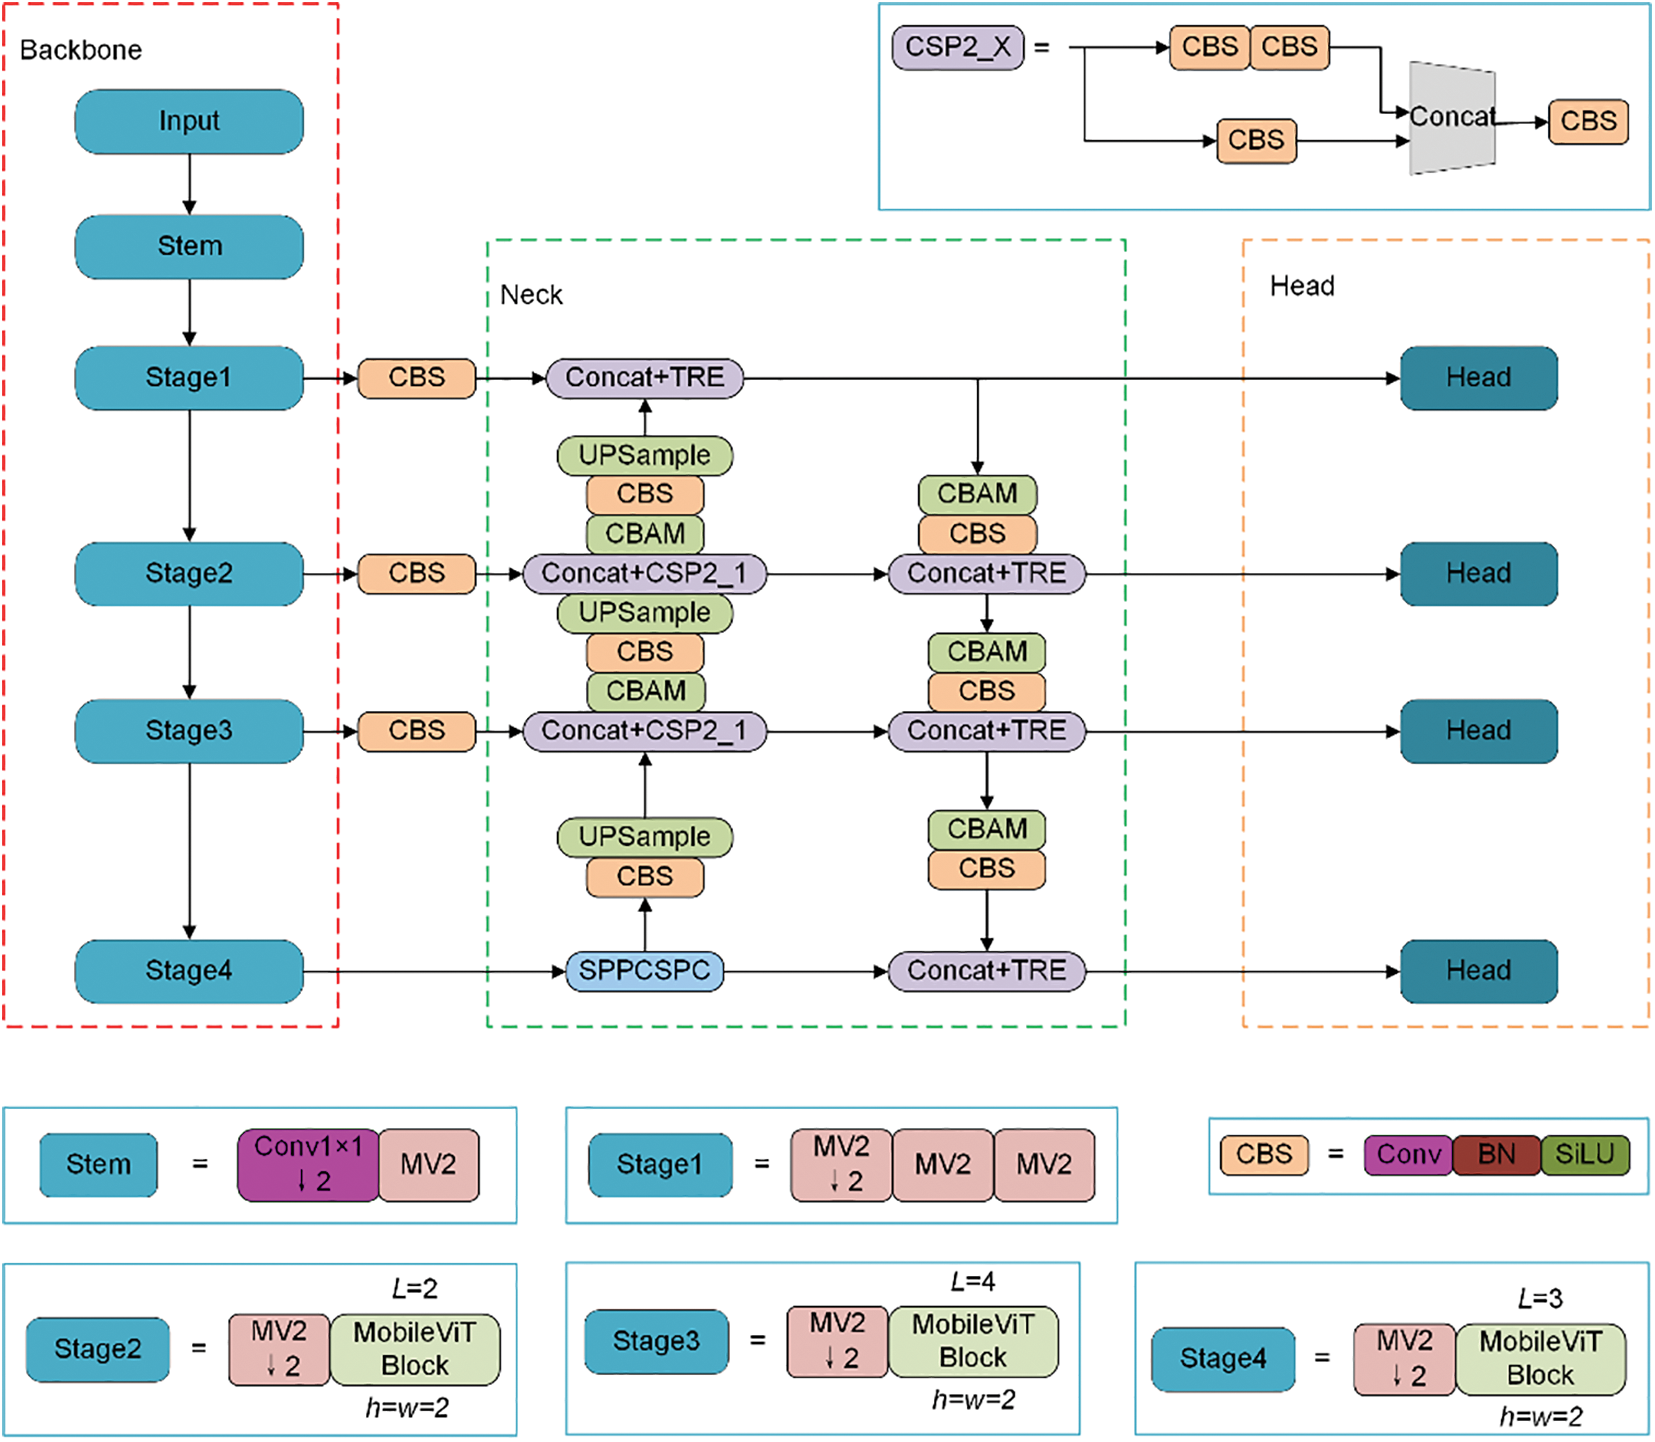
Figure 6: Improved YOLOv5 model
The last fully connected layer and global pooling layer of the MobileViT network are not involved in feature extraction and are therefore discarded. The improved model uses the weights of the MobileViT network as the pre-training model. So, during training and detection, the input image of the MobileViT network is scaled to 256 × 256, which makes it difficult to extract feature information from small objects in the image. To address this, a small object detection layer is added, consisting of four object detection layers to mitigate the negative impact of object size changes in the image. The improved model uses a lightweight MobileViT network as the backbone, which reduces a significant amount of parameters compared to the original backbone. As a classification network, the MobileViT network only needs to extract semantic information from the image, not positional information. Positional information is more present in shallow feature maps, while semantic information is more present in deep feature maps. Object detection tasks require both positional and semantic information. By concatenating shallow and deep feature maps (concatenating along the channel direction) and inputting the features extracted from each stage to path-aggregation network (PANet) for feature fusion, rich feature information can be obtained.
In PANet, to improve feature fusion, the original CSP2_X module was replaced with the TRE module, and a CBAM module was added after the TRE module to capture both global and local information and enhance the features. PANet utilizes both bottom-up upsampling and top-down downsampling, as well as attention modules for information extraction, which can enhance object detection for different object sizes.
4 Experiments and Results Analysis
4.1 Underwater Enhancement Algorithm
To demonstrate the effectiveness of the proposed underwater enhancement algorithm, underwater images were captured in the laboratory and compared with the CLAHE and the Multi-Scale Retinex with Color Restoration (MSRCR) [35] algorithms. The results are illustrated in Fig. 7.
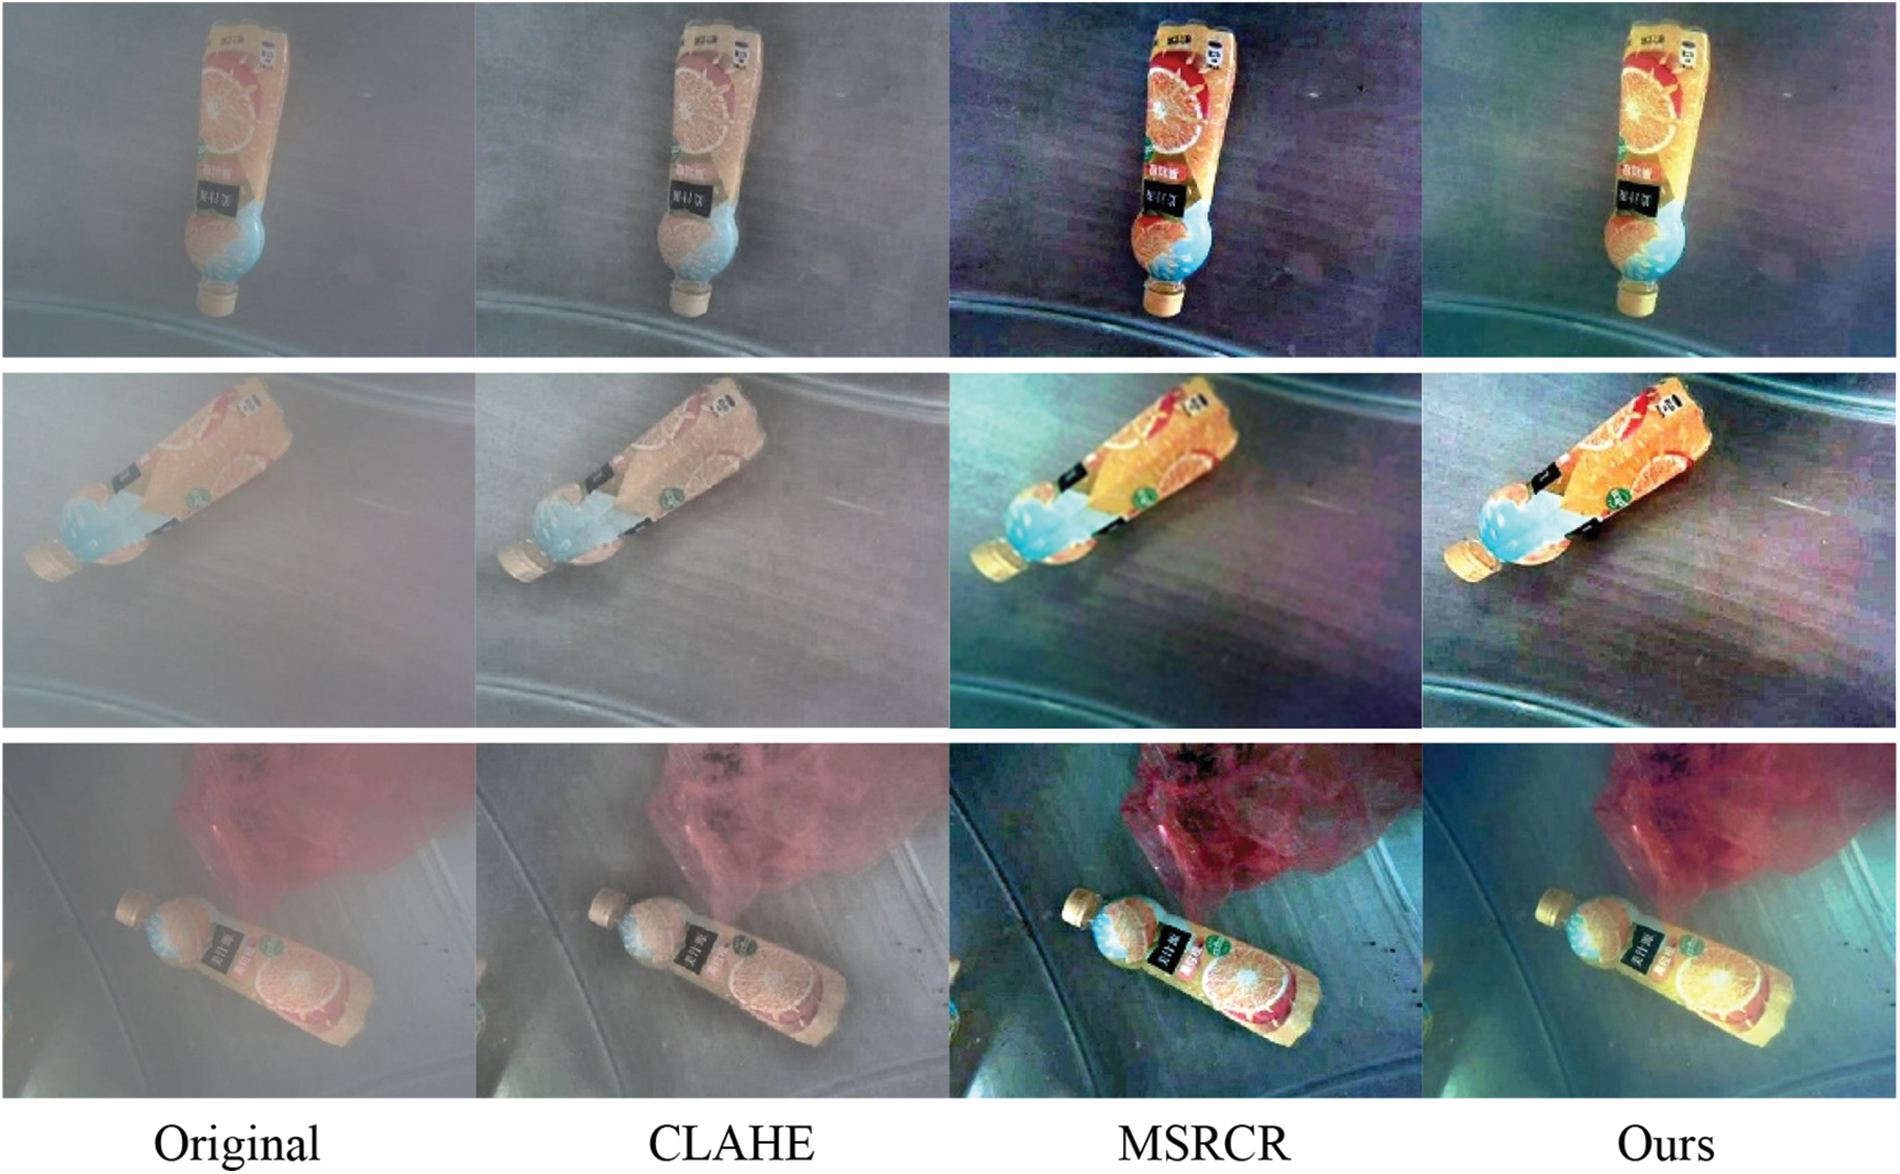
Figure 7: Comparison of enhanced images
From a visual standpoint, the CLAHE algorithm does not significantly enhance the brightness of the image, but only improves the details, which is not ideal. The MSRCR algorithm performs well in terms of brightness and contrast, it does not perform well in terms of color restoration. In contrast, our proposed method yields a natural and smooth transition in brightness, improves detail information effectively, and produces natural and delicate colors.
The objective evaluation of underwater image enhancement is primarily carried out by the peak signal-to-noise ratio (PSNR), structural similarity (SSIM), underwater color image quality evaluation (UCIQE), and entropy. PSNR is utilized to measure the level of image distortion or noise, with higher values indicating better image distortion and noise levels. SSIM assesses the similarity between two images, taking into account brightness, contrast, and structure, with higher values indicating less image distortion. UCIQE evaluates the performance of images in terms of chromaticity, saturation, and contrast, with higher values indicating higher image quality. Lastly, entropy measures the richness of image details, with higher values indicating more abundant details. Table 1 shows the objective evaluation metric values of the enhancement results for different algorithms.

4.2 Object Recognition Algorithm
4.2.1 Dataset and Experimental Environment
In summary, compared to other classical algorithms, the proposed method in this article shows a more abundant enhancement effect in color details and better brightness adjustment. In terms of objective evaluation, it performs better than other algorithms in noise control, image quality, distortion level, and information entropy.
Based on the DeepTrash dataset shared by Gautam et al. [36], underwater plastic waste images were added as experimental datasets. The experimental dataset contains two categories: plastic and bottles. To increase the dataset size, the contrast and brightness of the original dataset images were randomly adjusted, and the dataset was scaled and flipped. Before training, the experimental data was divided into training-validation sets and test sets in 9:1 ratio. The training validation set was randomly divided into a training set and a validation set in 9:1 ratio. The dataset division is shown in Table 2.

The experiment was performed using the Pytorch-GPU 1.7.1 deep learning framework, with an Intel (R) Xeon (R) Gold 6330 CPU @ 2.00 GHz processor and an NVIDIA RTX A5000 24 G graphics card. The experiment was conducted on an Ubuntu 20.04.4 operating system, with the NVIDIA driver version 470.103.01, CUDA version 11.3, and CUDNN version 8.2.1.
The experiment utilized the YOLOv5 pre-trained model and implemented transfer learning. The model was trained for 300 iterations (epochs) with an input size of 256 × 256. During the initial 60 iterations, only pre-trained weights were loaded, and the backbone network was frozen with a batch size of 64. For the subsequent 240 iterations, the backbone network was unfrozen with a batch size of 32. The network model training hyperparameters were set as follows: the optimizer utilized Stochastic gradient descent (SGD) with a momentum of 0.937, weight decay of 0.0005, and the SGD momentum was the trend of the loss function value during training. The maximum learning rate was set to 0.04, while the minimum learning rate was limited to 0.0016. Mosaic data augmentation and cosine annealing were employed. The loss function value changed during the model training process, illustrated in Fig. 8. The loss value gradually decreased during the first 60 iterations. The loss function value was increased suddenly from the 61st iteration, and it began to converge gradually from the 210th iteration.
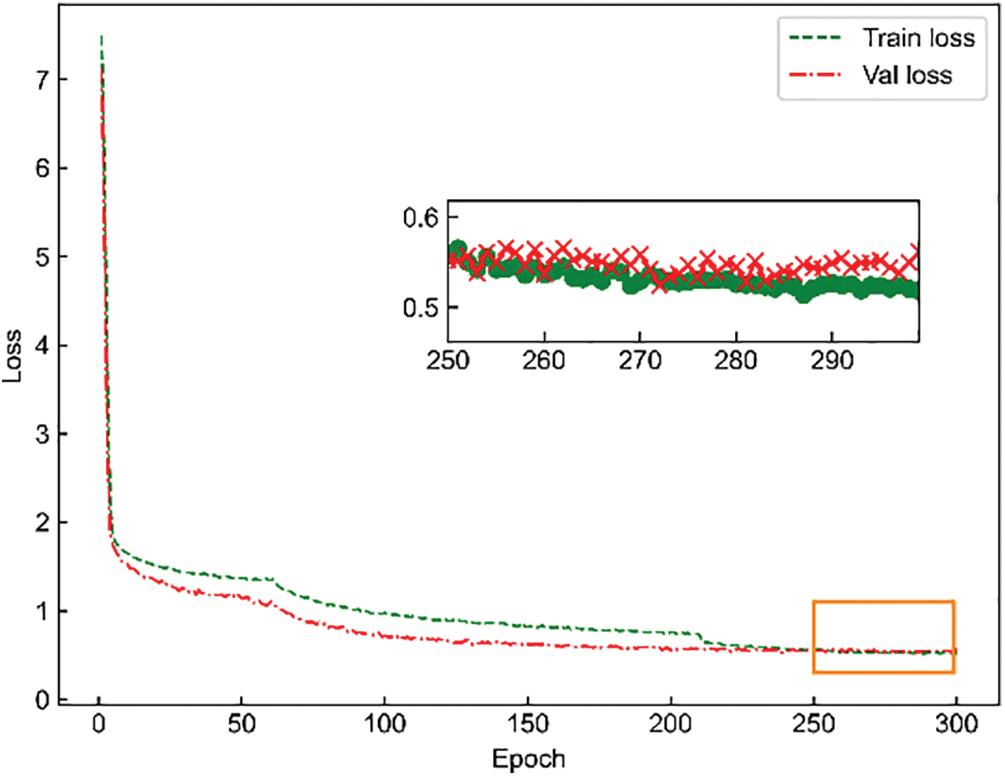
Figure 8: Change in loss value
4.2.2 Comparative Analysis of Different Detection Models
To demonstrate the superiority of our improved object detection algorithm, we conducted extensive experiments on the dataset and compared our results with the latest methods. The performance of the models is evaluated using the following metrics: precision (P), recall (R), average precision (AP), and mean average precision (mAP_0.5). In addition, the detection speed was assessed in terms of the number of plastic waste images detected per second (fps/s). The complexity of the models was quantified by the number of model parameters.
To verify the effectiveness of the proposed algorithm, experiments were conducted to train and evaluate its performance, as well as the performance of five other algorithms: YOLOv5-m, YOLOX-m, YOLOv4, YOLOv3, and faster region-based convolutional neural networks (Faster-RCNN). All six algorithms were trained and evaluated under the same software, hardware environment, and dataset, and their performance was analyzed.
The analysis results are shown in Table 3. Compared to the YOLOv5-m algorithm, Ours achieves an 18.84% increase in detection speed, a 2.9% improvement in detection accuracy, and a mere 5.99% increase in model parameters. In comparison to the anchor-free YOLOX-m algorithm, Ours improves detection speed by 22.60%, detection accuracy by 3.65%, and has a model parameter that is 88.9% smaller than YOLOX-m. Compared to YOLOv4, Ours increases detection speed by approximately 3.8%, improves detection accuracy by 4.3%, and reduces model parameters by 65.01%. Compared to YOLOv3, the detection accuracy improves by 5.9%, and the model parameters are only 36.35% of YOLOv3. Lastly, when compared to the two-stage Faster-RCNN algorithm, Ours is 1.88 times faster in detection speed and achieves an 18.1% improvement in detection accuracy. These results indicate that Ours has superior overall performance and can meet the requirements of underwater waste detection tasks.

4.2.3 Underwater Waste Detection Results
The test set was used to select several images for detection, and the results are illustrated in Fig. 9.
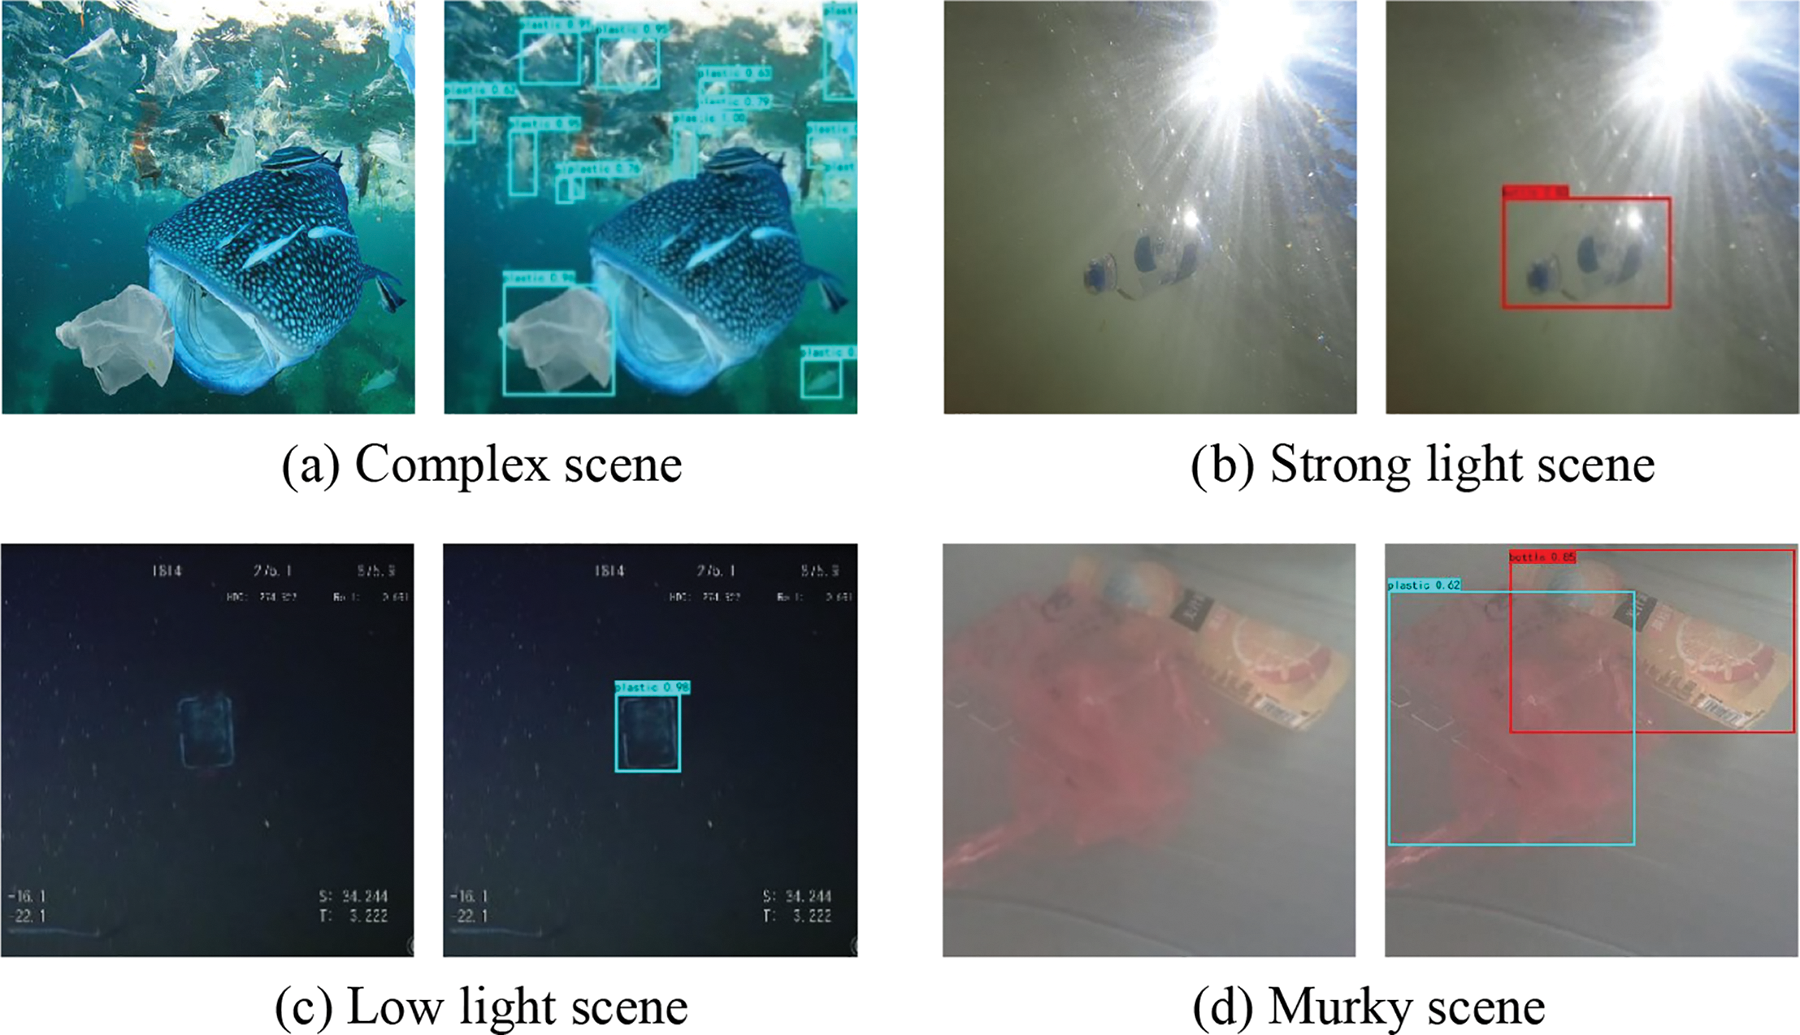
Figure 9: Performance of the target detection algorithm at different scenarios
The original images are shown on the left, while the recognition results are on the right. Fig. 9a presents a complex environment, with numerous small plastic bags in the image. It belongs to a scene that features a complex small target. Fig. 9b shows a strong light environment with direct sunlight. Fig. 9c depicts a dimly lit environment with low light. Fig. 9d showcases a murky environment in the laboratory, with water impurities that affect judgment. In all the scenarios mentioned above, the proposed algorithm was successful in detecting the targets. The detection results demonstrate that the model proposed in this article can accomplish underwater waste detection in complex small target scenes, strong light scenes, dimly lit scenes, and murky scenes.
4.3 Experimental Results on Recognition and Localization
RGB-D camera can not only capture real-time RGB images of the scene like a regular camera but also simultaneously capture the corresponding depth image of the scene. An RealSense D415 was used as the experimental RGB-D depth camera for image acquisition and localization recognition.
To verify the feasibility of the proposed method, experiments were conducted in a laboratory underwater environment with the device. Some of the detection results are illustrated in Fig. 10, where the left side of each image is the original image, and the right side shows the recognition result.
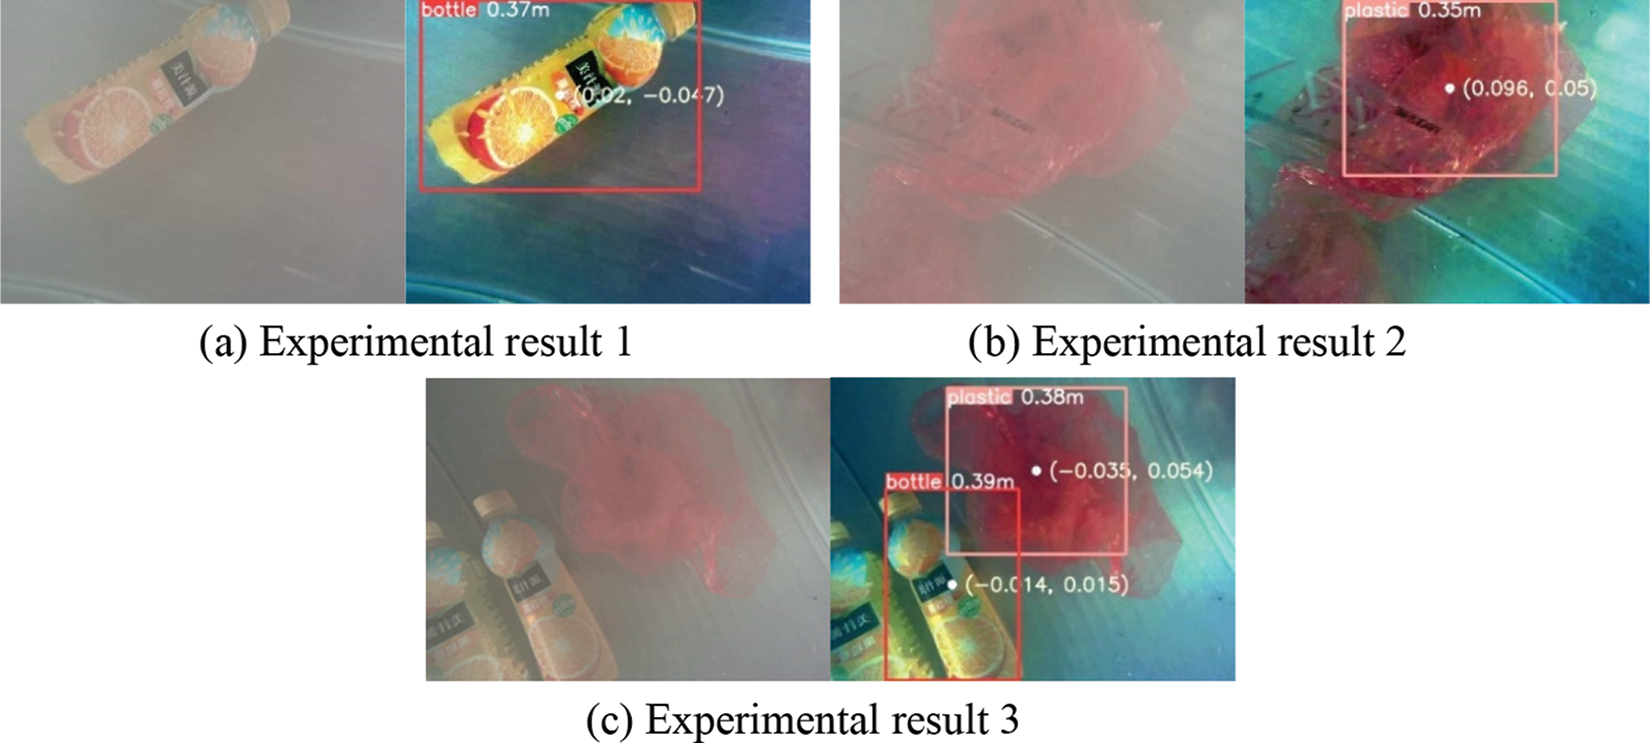
Figure 10: Recognition and localization experimental results
The 3D coordinates of the detected object are approximated by the 3D coordinates of the center point of the object detection box. In the figure, the white solid point in the rectangular box is the center point of the object detection box. Its coordinates represent the coordinates of this point in the camera coordinate system obtained by transformation. The number after the category represents the distance from the center point of the object detection box to the camera, which is the depth value of this point.
This position accuracy is analyzed through 10 experiments, and results are shown in Table 4. According to Table 4, after determining the pixel coordinates and depth value of the underwater target’s center point, its three-dimensional coordinates in the camera coordinate system can be calculated through the calibrated intrinsic and extrinsic parameters. Experimental results have shown that the measurement error between the measured and actual depth is within 0.008 m, indicating the system’s high overall positioning accuracy that can meet practical needs.

In summary, the proposed method in this article can enhance underwater images and achieve real-time identification of underwater garbage. It can use RGB-D cameras to locate the garbage with high precision.
The underwater waste recognition and localization is studied in this article. Firstly, a weighted fusion-based underwater image enhancement algorithm is proposed to improve image quality. Experimental results show that the proposed algorithm has better enhancement effects on brightness, contrast, detail information, and color restoration, and the enhanced results have smoother transitions with better visual effects. Secondly, an improved YOLOv5-based algorithm is proposed. Experimental results show that the improved algorithm has higher detection accuracy and faster detection speed on the underwater waste dataset, which meets the requirements of real-time detection. Finally, the RGB-D camera, underwater image enhancement, and underwater detection and recognition tasks are combined. The Realsense-D415 camera is used to get the color and depth image. The center point coordinates of the detection box are obtained to complete the recognition and localization of underwater targets. The experimental results demonstrate the effectiveness of the proposed method for identifying and locating underwater plastic waste, and it has good recognition and localization accuracy. However, due to the influence of water flow, the underwater targets may undergo frequent movement, we will study on the identification and localization of dynamic targets in water subsequently.
Acknowledgement: The authors would like to thank the anonymous reviewers and the editor for the very instructive suggestions that led to the much-improved quality of this article.
Funding Statement: This study was supported by the Foundation of Henan Key Laboratory of Underwater Intelligent Equipment under Grant No. KL02C2105, Project of SongShan Laboratory under Grant No. YYJC062022012, Training Plan for Young Backbone Teachers in Colleges and Universities in Henan Province under Grant No. 2021GGJS077, Key Scientific Research Projects of Colleges and Universities in Henan Province under Grant No. 22A460022, North China University of Water Resources and Electric Power Young Backbone Teacher Training Project under Grant No. 2021-125-4.
Conflicts of Interest: The authors declare that they have no conflicts of interest to report regarding the present study.
References
1. L. G. A. Barboza, A. D. Vethaak, B. R. B. O. Lavorante, A. K. Lundebye and L. Guilhermino, “Marine microplastic debris: An emerging issue for food security, food safety and human health,” Marine Pollution Bulletin, vol. 133, no. 8, pp. 336–348, 2018. [Google Scholar] [PubMed]
2. L. C. M. Lebreton, J. Zwet, J. W. Damsteeg and B. Slat, “River plastic emissions to the world’s oceans,” Nature Communications, vol. 8, no. 1, pp. 15611–15620, 2017. [Google Scholar] [PubMed]
3. F. Cameron, M. J. Islam and J. Sattar, “Enhancing underwater imagery using generative adversarial networks,” in Proc. ICRA, Brisbane, QLD, Australia, pp. 7159–7165, 2018. [Google Scholar]
4. H. M. Lu, Y. J. Li, X. Xu, L. He, Y. Li et al., “Underwater image descattering and quality assessment,” in Proc. ICIP, Phoenix, AZ, USA, pp. 1998–2002, 2016. [Google Scholar]
5. T. V. Emmerik, T. C. K. Le, M. Loozen, K. V. Oeveren, E. Strady et al., “A methodology to characterize riverine macroplastic emission into the ocean,” Frontiers in Marine Science, vol. 5, pp. 372–382, 2018. [Google Scholar]
6. G. D. Fernández and G. Hanke, “Toward a harmonized approach for monitoring of riverine floating macro litter inputs to the marine environment,” Frontiers in Marine Science, vol. 4, pp. 86–92, 2017. [Google Scholar]
7. S. Rech, V. M. Caquilpán, J. F. Pantoja, M. M. Rivadeneira, D. J. Madariaga et al., “Rivers as a source of marine litter-a study from the SE Pacific,” Marine Pollution Bulletin, vol. 82, no. 1–2, pp. 66–75, 2014. [Google Scholar] [PubMed]
8. L. Lahens, E. Strady, T. C. Kieu-Le, R. Dris, K. Boukerma et al., “Macroplastic and microplastic contamination assessment of a tropical river (Saigon River, Vietnam) transversed by a developing megacity,” Environmental Pollution, vol. 236, no. 2, pp. 661–671, 2018. [Google Scholar] [PubMed]
9. Z. P. Ge, H. H. Shi, X. F. Mei, Z. J. Dai and D. J. Li, “Semi-automatic recognition of marine debris on beaches,” Scientific Reports, vol. 6, no. 1, pp. 25759–25767, 2016. [Google Scholar] [PubMed]
10. J. Lorenzo-Navarro, M. Castrillon-Santana, E. Santesarti, M. D. Marsico, I. Martinez et al., “SMACC: A system for microplastics automatic counting and classification,” IEEE Access, vol. 8, pp. 25249–25261, 2020. [Google Scholar]
11. T. V. Emmerik and A. Schwarz, “Plastic debris in rivers,” Wiley Interdisciplinary Reviews: Water, vol. 7,no. 1, pp. 1–25, 2020. [Google Scholar]
12. Z. Hu and C. Xu, “Detection of underwater plastic waste based on improved yolov5n,” in Proc. ICFTIC, Qingdao, China, pp. 404–408, 2022. [Google Scholar]
13. K. Kylili, I. Kyriakides, A. Artusi and C. Hadjistassou, “Identifying floating plastic marine debris using a deep learning approach,” Environmental Science and Pollution Research, vol. 26, no. 17, pp. 17091–17099, 2019. [Google Scholar] [PubMed]
14. H. Liu, P. H. Song and R. W. Ding, “WQT and DG-YOLO: Towards domain generalization in underwater object detection,” 2020. [Online]. Available: https://arxiv.org/abs/2004.06333 [Google Scholar]
15. H. Xing, L. Shi, K. Tang, S. X. Guo, X. H. Hou et al., “Robust RGB-D camera and IMU fusion-based cooperative and relative close-range localization for multiple turtle-inspired amphibious spherical robots,” Journal of Bionic Engineering, vol. 16, no. 3, pp. 442–454, 2019. [Google Scholar]
16. H. Yang, Z. Xu and B. Jia, “An underwater positioning system for uuvs based on lidar camera and inertial measurement unit,” Sensors, vol. 22, no. 14, pp. 5418, 2022. [Google Scholar] [PubMed]
17. W. Y. Chen, C. X. Yang and H. Yang, “Multiscale retinex infrared image enhancement based on the fusion of guided filtering and logarithmic transformation algorithm,” Infrared Technology, vol. 44, no. 4, pp. 397–403, 2022. [Google Scholar]
18. M. Z. Zhang, “Underground pedestrian detection model based on Dense-YOLO network,” Journal of Mine Automation, vol. 48, no. 3, pp. 86–90, 2022. [Google Scholar]
19. G. Cao, L. H. Huang, H. W. Tian, X. L. Huang, Y. B. Wang et al., “Contrast enhancement of brightness-distorted images by improved adaptive gamma correction,” Computers & Electrical Engineering, vol. 66, no. 1, pp. 569–582, 2018. [Google Scholar]
20. V. Magudeeswaran and B. Subramani, “Image contrast and color enhancement using adaptive gamma correction and histogram equalization,” Optik, vol. 183, no. 1, pp. 329–337, 2019. [Google Scholar]
21. D. J. Jobson, Z. Rahman and G. A. Woodell, “Properties and performance of a center/surround retinex,” IEEE Transactions on Image Processing, vol. 6, no. 3, pp. 451–462, 1997. [Google Scholar] [PubMed]
22. Z. Rahman, D. J. Jobson and G. A. Woodell, “Multi-scale retinex for color image enhancement,” in Proc. of 3rd IEEE Int. Conf. on Image Processing, Lausanne, Switzerland, vol. 3, pp. 1003–1006, 1996. [Google Scholar]
23. K. Zuiderveld, Contrast limited adaptive histogram equalization. San Diego, USA: Graphics Gems, Academic Press Professional, Inc., pp. 474–485, 1994. [Google Scholar]
24. Y. Y. Ben, R. Tang, P. A. Dai and Q. Li, “Image enhancement algorithm for underwater vision based on weighted fusion,” 2022. [Online]. Available: https://doi.org/10.13700/j.bh.1001-5965.2022.0540 [Google Scholar] [CrossRef]
25. Z. L. Peng, W. Huang, S. Z. Gu, L. X. Xie, Y. W. Wang et al., “Conformer: Local features coupling global representations for visual recognition,” 2021. [Online]. Available: https://arxiv.org/abs/2105.03889 [Google Scholar]
26. Y. P. Chen, X. Y. Dai, D. D. Chen, M. C. Liu, X. Y. Dong et al., “Mobile-Former: Bridging MobileNet and transformer,” 2021. [Online]. Available: https://arxiv.org/abs/2108.05895 [Google Scholar]
27. Y. H. Li, T. Yao, Y. W. Pan and T. Mei, “Contextual transformer networks for visual recognition,” 2021. [Online]. Available: https://arxiv.org/abs/2107.12292 [Google Scholar]
28. S. Mehta and M. Rastegari, “MobileViT: Light-weight, general-purpose, and mobile-friendly vision Transformer,” 2021. [Online]. Available: https://arxiv.org/abs/2110.02178 [Google Scholar]
29. K. He, X. Zhang, S. Ren and J. Sun, “Spatial pyramid pooling in deep convolutional networks for visual recognition,” IEEE Transactions on Pattern Analysis and Machine Intelligence, vol. 37, no. 9, pp. 1904–1916, 2015. [Google Scholar] [PubMed]
30. C. Y. Wang, A. Bochkovskiy and H. Y. M. Liao, “YOLOv7: Trainable bag-of-freebies sets new state-of-the-art for real-time object detectors,” 2022. [Online]. Available: https://arxiv.org/abs/2207.02696 [Google Scholar]
31. C. Y. Wang, H. Y. M. Liao, Y. H. Wu, P. Y. Chen, J. W. Hsieh et al., “A new backbone that can enhance learning capability of CNN,” in Proc. CVPRW, Seattle, WA, USA, pp. 1571–1580, 2020. [Google Scholar]
32. S. Woo, J. Park, J. Y. Lee and I. S. Kweon, “Cbam: Convolutional block attention module,” in Proc. ECCV, Munich, Germany, pp. 3–19, 2018. [Google Scholar]
33. X. Zhu, S. Lyu, X. Wang and Q. Zhao, “TPH-YOLOv5: Improved YOLOv5 based on transformer prediction head for object detection on drone-captured scenarios,” in Proc. ICCVW, Montreal, BC, Canada, pp. 2778–2788, 2021. [Google Scholar]
34. Y. F. Zhang, W. Ren, Z. Zhang, Z. Jia, L. Wang et al., “Focal and efficient IOU loss for accurate bounding box regression,” Neurocomputing, vol. 506, no. 9, pp. 146–157, 2022. [Google Scholar]
35. D. J. Jobson, Z. Rahman and G. A. Woodell, “A multiscale retinex for bridging the gap between color images and the human observation of scenes,” IEEE Transactions on Image Processing, vol. 6, no. 7, pp. 965–976, 1997. [Google Scholar] [PubMed]
36. T. Gautam, R. S. Jeanne, P. Olivier and L. Jay, “A robotic approach towards quantifying epipelagic bound plastic using deep visual models,” 2021. [Online]. Available: https://arxiv.org/abs/2105.01882 [Google Scholar]
37. G. Zheng, S. T. Liu, F. Wang, Z. M. Li and J. Sun, “Yolox: Exceeding yolo series in 2021,” 2021. [Online]. Available: https://arxiv.org/abs/2107.08430 [Google Scholar]
38. B. Alexey, C. Y. Wang and H. Y. M. Liao, “Yolov4: Optimal speed and accuracy of object detection,” 2021. [Online]. Available: https://arxiv.org/abs/2004.10934 [Google Scholar]
39. R. Joseph and A. Farhadi, “Yolov3: An incremental improvement,” 2018. [Online]. Available: https://arxiv.org/abs/1804.02767 [Google Scholar]
40. S. Q. Ren, K. M. He, R. Girshick and J. Sun, “Faster R-CNN: Towards real-time object detection with region proposal networks,” IEEE Transactions on Pattern Analysis & Machine Intelligence, vol. 39, no. 6, pp. 1137–1149, 2017. [Google Scholar]
Cite This Article
 Copyright © 2023 The Author(s). Published by Tech Science Press.
This work is licensed under a Creative Commons Attribution 4.0 International License , which permits unrestricted use, distribution, and reproduction in any medium, provided the original work is properly cited.
 Downloads
 Citation Tools