
 Submit a Paper
 Propose a Special lssue
 Open Access
ARTICLE
SNSVM: SqueezeNet-Guided SVM for Breast Cancer Diagnosis
1 School of Computing and Mathematical Sciences, University of Leicester, Leicester, LE1 7RH, UK
2 Department of Computer Science, HITEC University Taxila, Taxila, Pakistan
3 Department of Information Systems, Faculty of Computing and Information Technology, King Abdulaziz University, Jeddah, 21589, Saudi Arabia
* Corresponding Author: Yudong Zhang. Email:
Computers, Materials & Continua 2023, 76(2), 2201-2216. https://doi.org/10.32604/cmc.2023.041191
Received 14 April 2023; Accepted 09 June 2023; Issue published 30 August 2023
 View Full Text
 Download PDF
Abstract
Breast cancer is a major public health concern that affects women worldwide. It is a leading cause of cancer-related deaths among women, and early detection is crucial for successful treatment. Unfortunately, breast cancer can often go undetected until it has reached advanced stages, making it more difficult to treat. Therefore, there is a pressing need for accurate and efficient diagnostic tools to detect breast cancer at an early stage. The proposed approach utilizes SqueezeNet with fire modules and complex bypass to extract informative features from mammography images. The extracted features are then utilized to train a support vector machine (SVM) for mammography image classification. The SqueezeNet-guided SVM model, known as SNSVM, achieved promising results, with an accuracy of 94.10% and a sensitivity of 94.30%. A 10-fold cross-validation was performed to ensure the robustness of the results, and the mean and standard deviation of various performance indicators were calculated across multiple runs. This model also outperforms state-of-the-art models in all performance indicators, indicating its superior performance. This demonstrates the effectiveness of the proposed approach for breast cancer diagnosis using mammography images. The superior performance of the proposed model across all indicators makes it a promising tool for early breast cancer diagnosis. This may have significant implications for reducing breast cancer mortality rates.Keywords
Breast cancer [1–4] is a significant global health concern, affecting millions of women every year [5,6]. Timely identification of breast cancer is crucial for successful treatment. Traditional methods of diagnosis are time-consuming, expensive, and potentially invasive for the patient. The growing interest in machine learning techniques is spurring ongoing research into new and improved models for breast cancer diagnosis, which will lead to improvements in the accuracy and efficiency of medical diagnosis and a reduction in the need for invasive procedures [7].
Machine learning (ML) [8–10], particularly convolutional neural networks (CNNs) [11–13], has shown encouraging results in medical image analysis tasks. However, the high number of parameters in most used models may hinder their widespread use in clinical settings. SqueezeNet [14,15], a lightweight CNN architecture, is designed to achieve high accuracy in image classification while minimizing the number of parameters needed in the network. By reducing the number of parameters, SqueezeNet can improve the computational efficiency of the network and make it easier to deploy on devices with limited resources.
Support vector machine (SVM) [16,17], a commonly utilized ML technique for classification tasks, has achieved significant success in various applications [18–20]. SVM is useful in situations where the data is non-linearly separable, as it can employ kernel functions to map the input data into a higher-dimensional feature space where linear separation is possible. SVM has demonstrated strong capabilities in a range of medical image analysis tasks [21,22], particularly in the area of breast cancer diagnosis [23]. In the proposed model, the SVM classifier is used to classify the features extracted by SqueezeNet.
The use of ML methods for assisting in the diagnosis of breast cancer has become increasingly popular. This research [24] developed a novel approach for the automatic classification of thermal images using thermal-mammogram image processing techniques and smart devices. The proposed model outperforms other classifiers, achieving high precision, accuracy, and recall scores of 98.44%, 98.83%, and 100%, respectively, according to comparative analysis. This study [25] proposed a medical IoT-based system for early detection by hyperparameter-optimized neural networks. The system utilized both SVM and multilayer perceptron (MLP) to compare baseline classifiers for malignant and benign classification. The proposed method using CNN achieved a high accuracy of 98.5% in classifying. This study [26] proposed a deep learning cascaded feature selection framework to overcome the feature dimensionality curse problem. CNNs that were pre-trained were used to extract features from breast mammograms. The framework used a univariate strategy to select optimized key features with statistical significance, overcoming the curse of dimensionality and multicollinearity issues. The evaluation of the proposed framework yielded highly promising results, demonstrating the effectiveness of deep learning in breast cancer classification
Chen et al. [27] developed an automatic program using wavelet energy entropy and linear regression classifier that showed superior results in detecting breast abnormalities. Guo et al. [28] used wavelet energy to extract features, leading to improved accuracy in distinguishing benign and malignant tumors. Samala et al. [29] investigated the generalization error of a deep CNN that utilized transfer learning to classify mammogram images as benign or malignant. The proposed custom-designed CNN network [30] achieved impressive accuracy in distinguishing between metastatic and non-metastatic cells. The proposed framework by Baghdadi et al. [31] for breast cancer classification uses CNN and transfer learning. Eight classical pre-trained models were compared to arrive at the optimal choice. Manta ray foraging optimization achieved high accuracy on both histological and ultrasound data. The results of this study [32] showed that the sliced-Wasserstein autoencoder might be a promising approach for breast ultrasound image anomaly detection. However, further research is needed to address the challenge of reducing false positives in the reconstruction-based approach.
After reviewing these studies, it is evident that researchers have been consistently making advancements in utilizing deep learning for breast cancer classification. Nevertheless, the issue that the CNN model involves many parameters has remained. With increased parameters, the model becomes more complex, requiring more computational and storage resources for training and inference.
The proposed model overcomes the limitations of the previous methods. Compared to the deep learning methods mentioned earlier, the SVM approach guided by the lightweight SqueezeNet has fewer parameters. This is particularly important in medical image analysis, as computing resources always are limited. In all, this study has several novel contributions:
a) The proposed novel SNSVM can effectively diagnose breast cancer using mammography images and has the potential to help reduce breast cancer mortality rates.
b) Outperforming state-of-the-art models with higher accuracy and specificity while maintaining sensitivity.
Although not extensively used, the mini-MIAS dataset [33] is a valuable resource for classifying breast abnormalities. It encompasses 322 single-breast mammogram slices, each boasting a size of 1024 × 1024 pixels. Within the dataset, 113 images are labeled as abnormal, while the remaining 209 are normal. A selection of 100 images of healthy breasts and 100 images of diseased breasts was randomly made to form the input dataset to address the issue of the imbalanced dataset.
The dataset includes six categories of abnormal mammography images, exemplified in Fig. 1. In preprocessing, multiple data augmentation (MDA) is used [34,35]. MDA involves generating new images from existing data by applying various transformations to increase the size of a training dataset artificially. Although MDA does not directly improve the data's quality, it provides a larger and more diverse image dataset for the model to learn from.
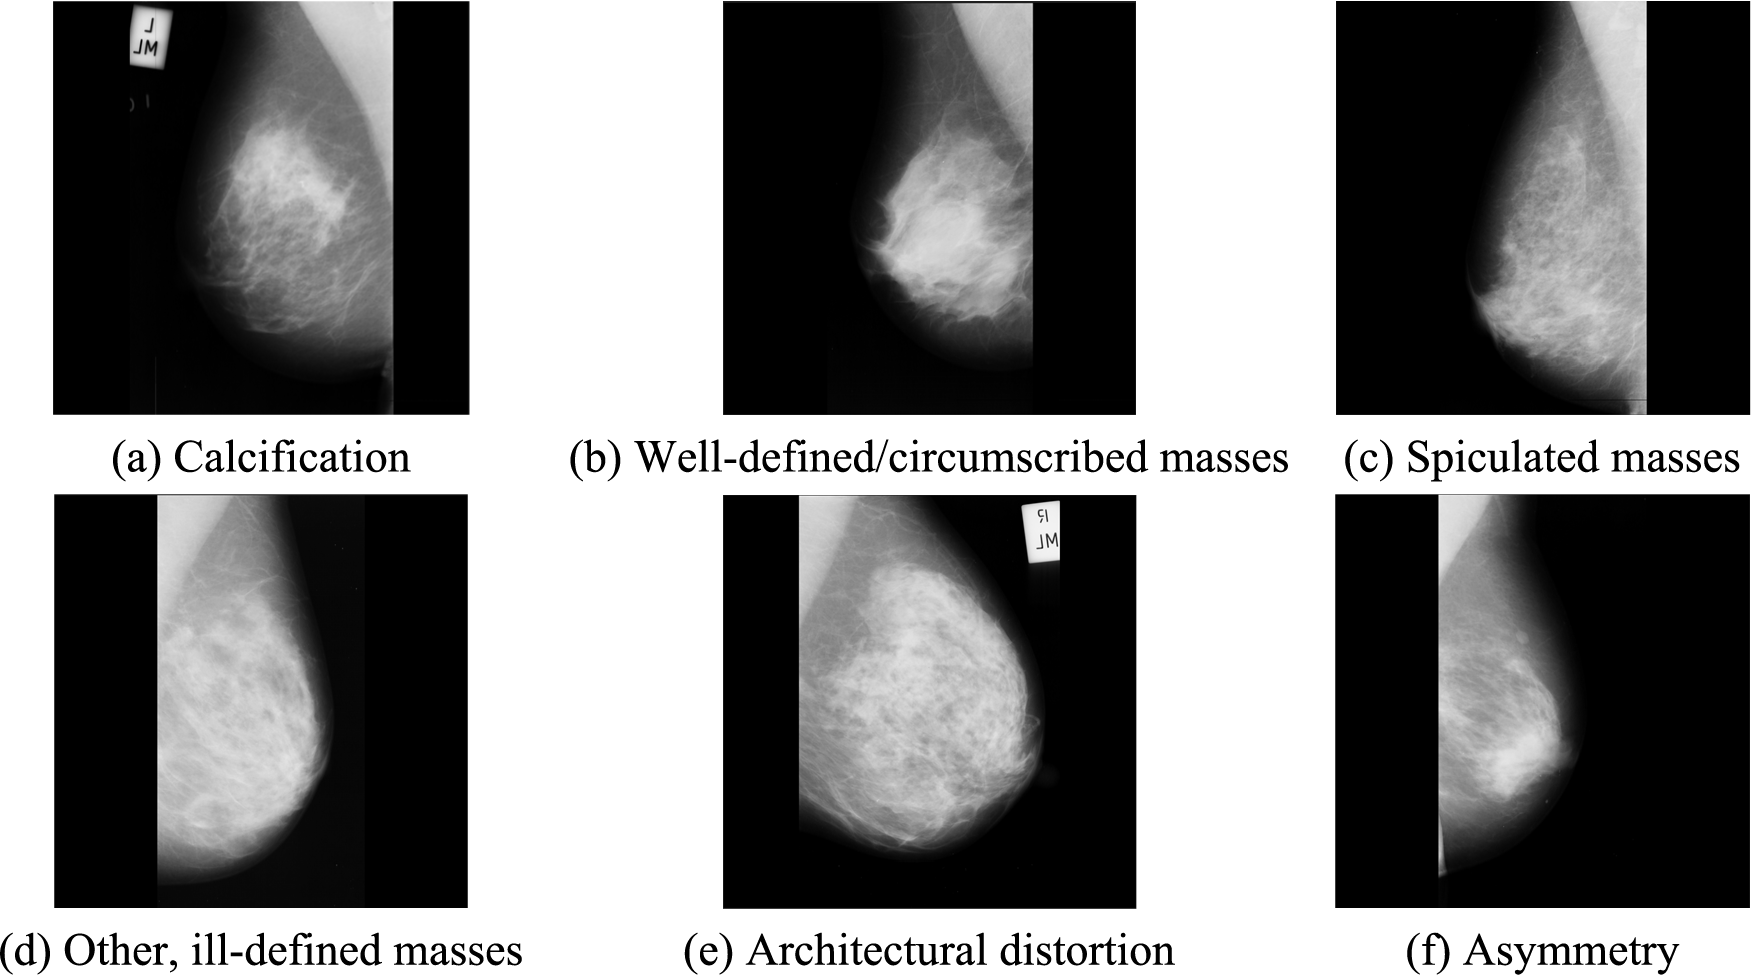
Figure 1: Examples of abnormal breast types in the mini-MIAS dataset
3.1 Fire Module and SqueezeNet with Complex Bypass
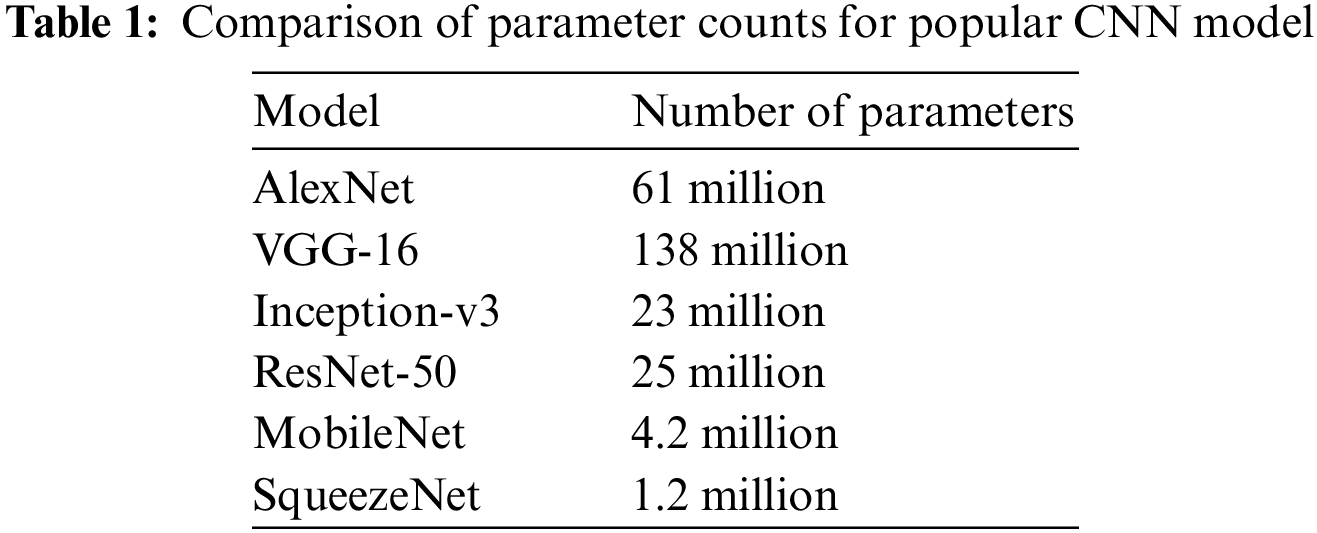
SqueezeNet [14,36] is chosen as the base architecture for this project due to its small size and low number of parameters. Compared to larger models like AlexNet [37–39], VGG [40,41], or ResNet [42–44], SqueezeNet has a significantly smaller number of parameters, making it easier to train on limited computational resources. Table 1 compares the number of parameters of various deep learning models.
Additionally, SqueezeNet has achieved comparable accuracy to larger models on image classification tasks [45,46]. With these advantages, SqueezeNet is a suitable choice for this project.
The fire module [47] is a fundamental building block in the SqueezeNet architecture, as shown in Fig. 2. The module contains two parts of convolutions, namely the squeeze layer and the expanding layer. The purpose of the 1 × 1 convolutional in the squeeze layer is to capture inter-channel relationships and is analogous to a fully connected layer operating on the channel dimension.
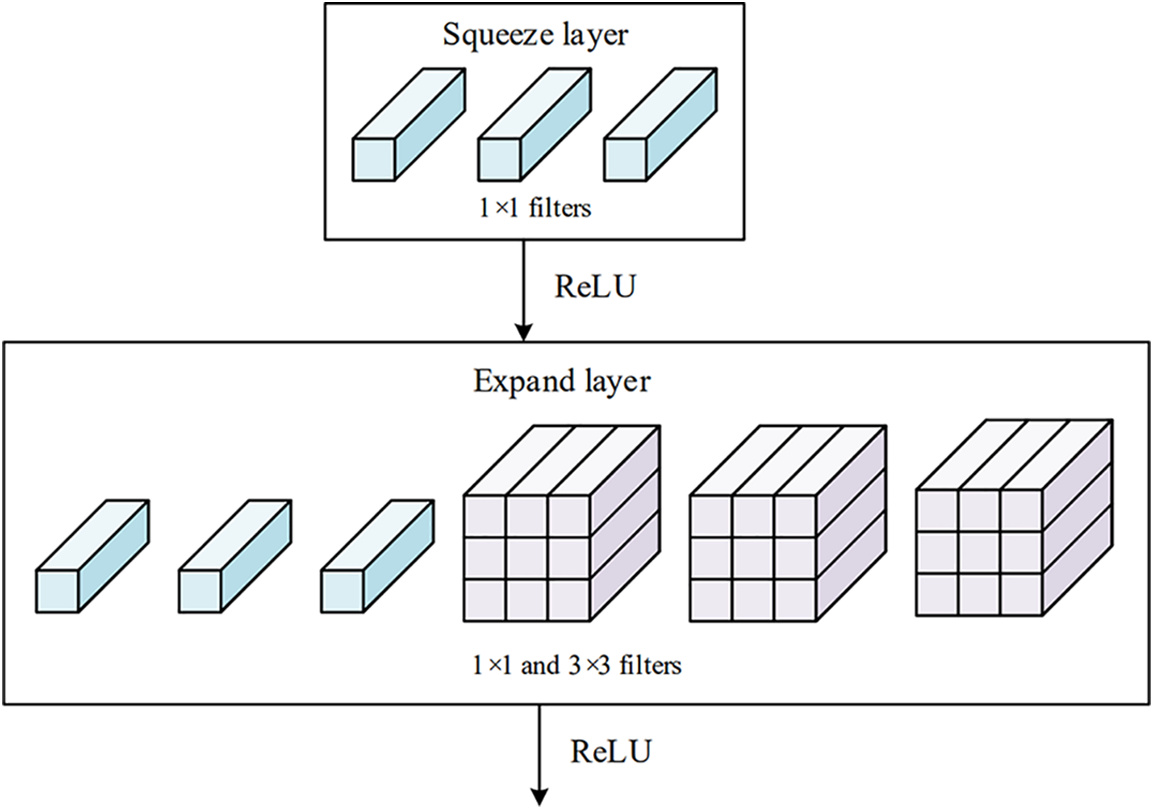
Figure 2: Structure of fire module
The expand layer aims to increase the number of channels. It combines 1 × 1 and 3 × 3 convolutions, allowing for a deeper representation of features. It is important to note that the expanding layer maintains the spatial dimensions of the input feature maps but increases the number of output channels. Figs. 3 and 4 compare the performance of the SqueezeNet with and without complex bypass.
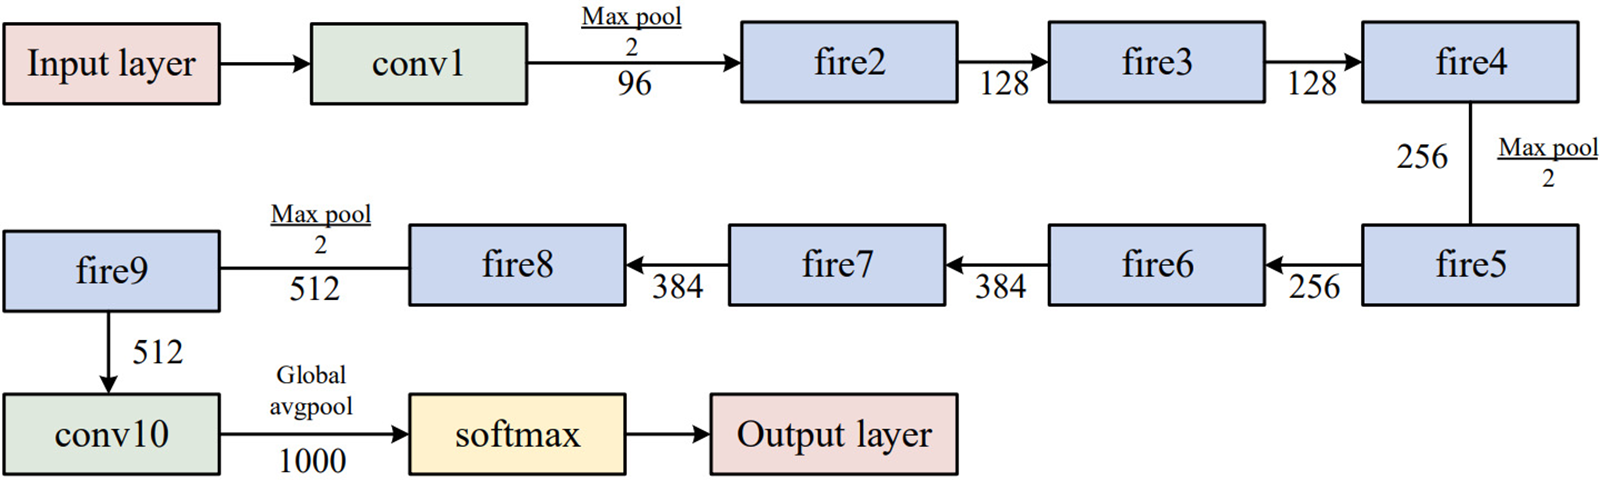
Figure 3: Original SqueezeNet structure
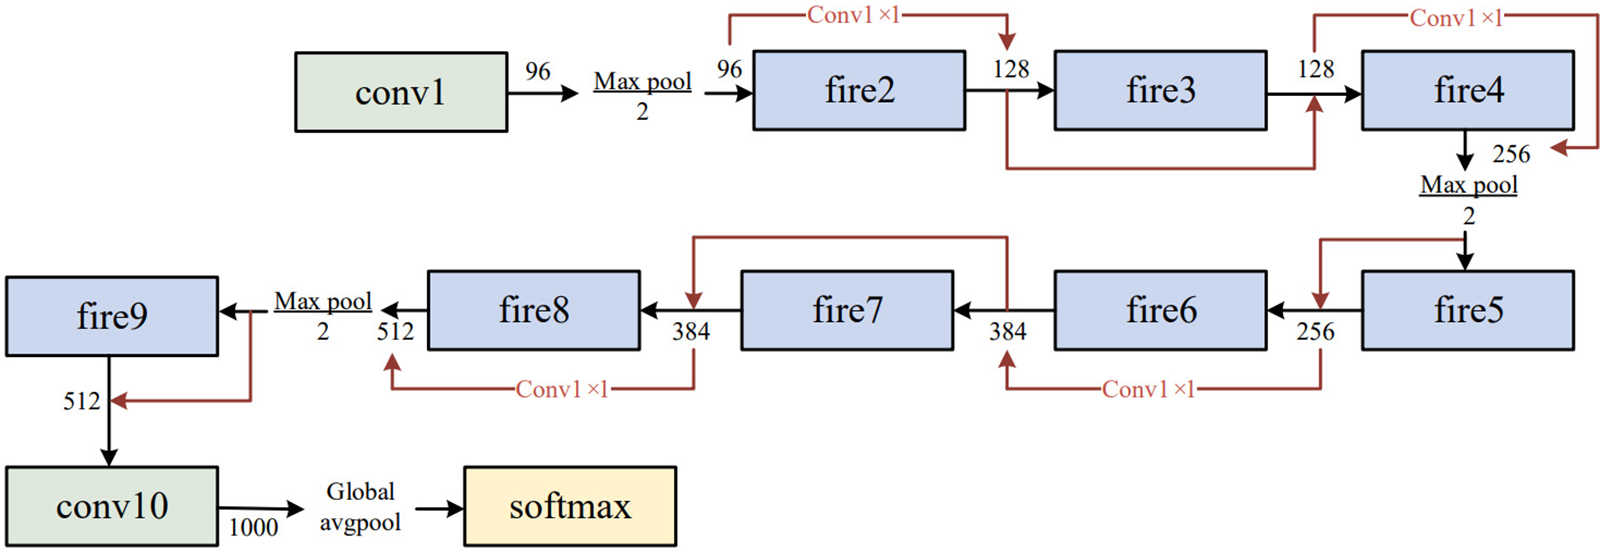
Figure 4: SqueezeNet with complex bypass
The fire module has a limitation in cases where the number of input channels is identical to the number of output channels. This situation restricts the options for the fire module, which can only employ a straightforward bypass connection. If the number of input and output channels differs, a complex bypass connection must be used, which may result in a less efficient network and higher computational cost.
In this study, SVM is trained on the SqueezeNet features extracted from the mini-MIAS dataset and is used to classify the mammogram images into six categories. SVM is a widely used binary classifier that is known for its high accuracy in both linear and non-linear classification tasks, but it can also be used for multi-class classification.
The primary concept behind SVM is to construct a hyperplane or a set of hyperplanes that can effectively separate different classes in the input space, as shown in Fig. 5.
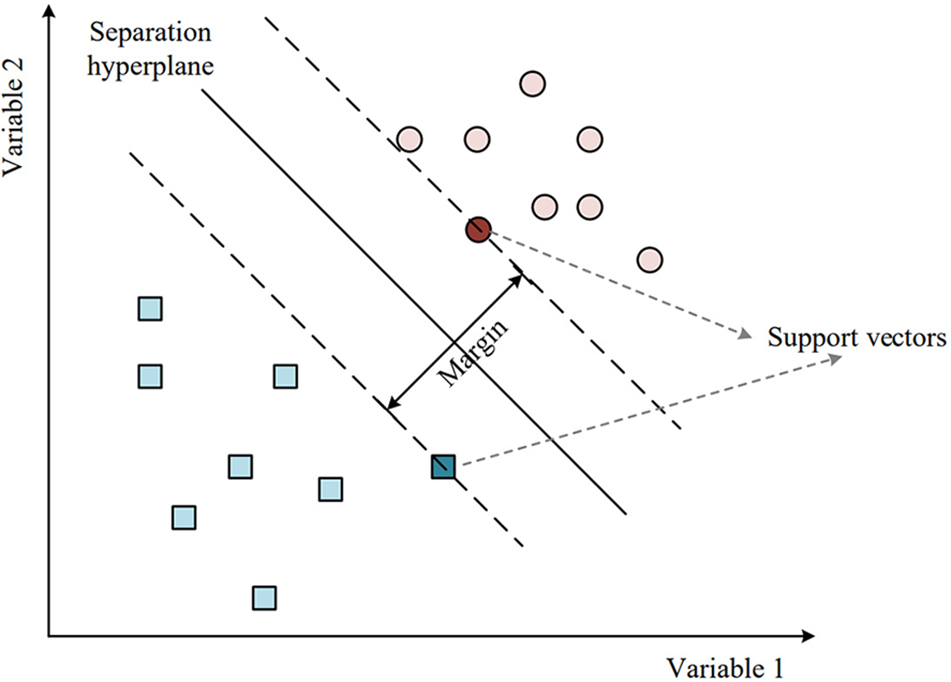
Figure 5: Separation hyperplane of SVM
The equation for the linear decision hyperplane is:
where the weight vector is denoted by
In classification tasks, SVM seeks to identify the optimal hyperplane for separating data points into distinct classes, with the widest possible margin between the closest data points of each class. The margin is defined as the maximum distance between the hyperplane and the closest data points in the training set, and it is an important concept in SVM [48]. A larger margin indicates that the classifier is more robust to new data points. o find the optimal hyperplane, SVM seeks to minimize the classification error while maximizing the margin, which can be achieved by finding the optimal values of
The optimization problem of SVM can be formulated as follows:
where the input vector is denoted by
where
Considering the Karush-Kuhn-Tucker condition [49], the dual Lagrangian can be derived as follows:
In the case of non-linear SVM, kernel functions are introduced to map the input data into a higher-dimensional space. The optimization problem, in this case, becomes:
where
Gaussian kernel:
where
Polynomial kernel:
where
Cross-validation is widely used in machine learning and statistics to estimate the performance of a predictive model on a limited dataset. The basic idea is to divide the dataset into two or more folds, one for testing the model and the other for training it [50].
K-fold cross-validation is a commonly used method of cross-validation. The dataset
In the
In the end, the model’s performance is assessed by taking the average of the accuracy values obtained over
where
K-fold cross-validation is a useful approach for assessing the generalization performance of a model and tuning the hyperparameters of an algorithm or model. It is a powerful technique for evaluating models, especially when the dataset is small. It helps to reduce overfitting by using multiple validation sets. Fig. 6 shows the illustration of K-fold cross-validation (
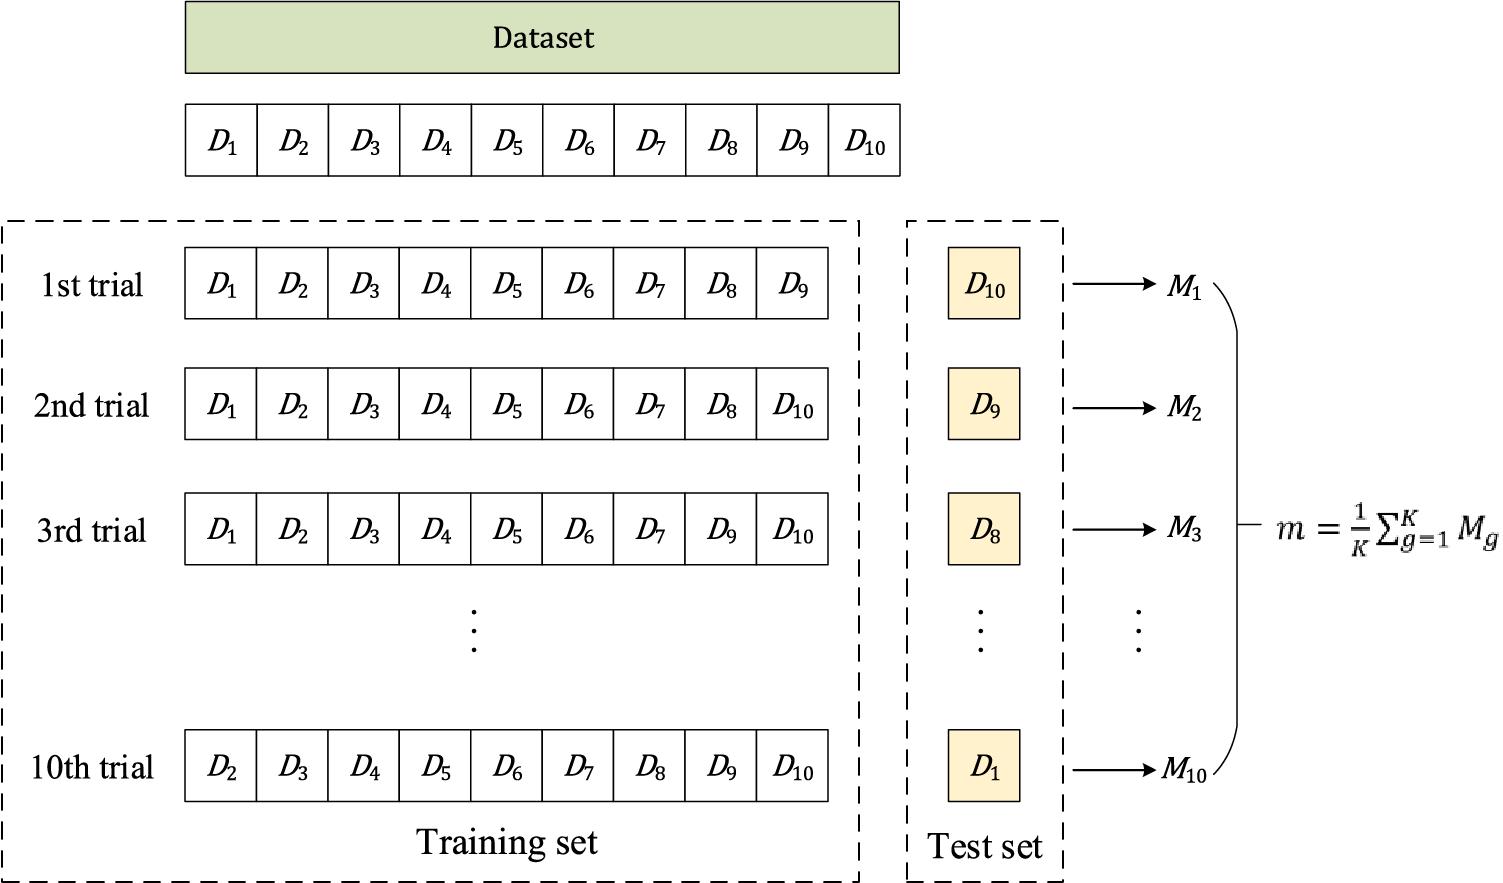
Figure 6: Illustration of 10-fold cross-validation
The results of the MDA can be observed in Fig. 7, which includes five data augmentation methods: random translation, rotation, Gamma-correction, and Gaussian noise injection, scaling. These methods have increased the diversity of the dataset, addressing the limitation of having a small dataset size.
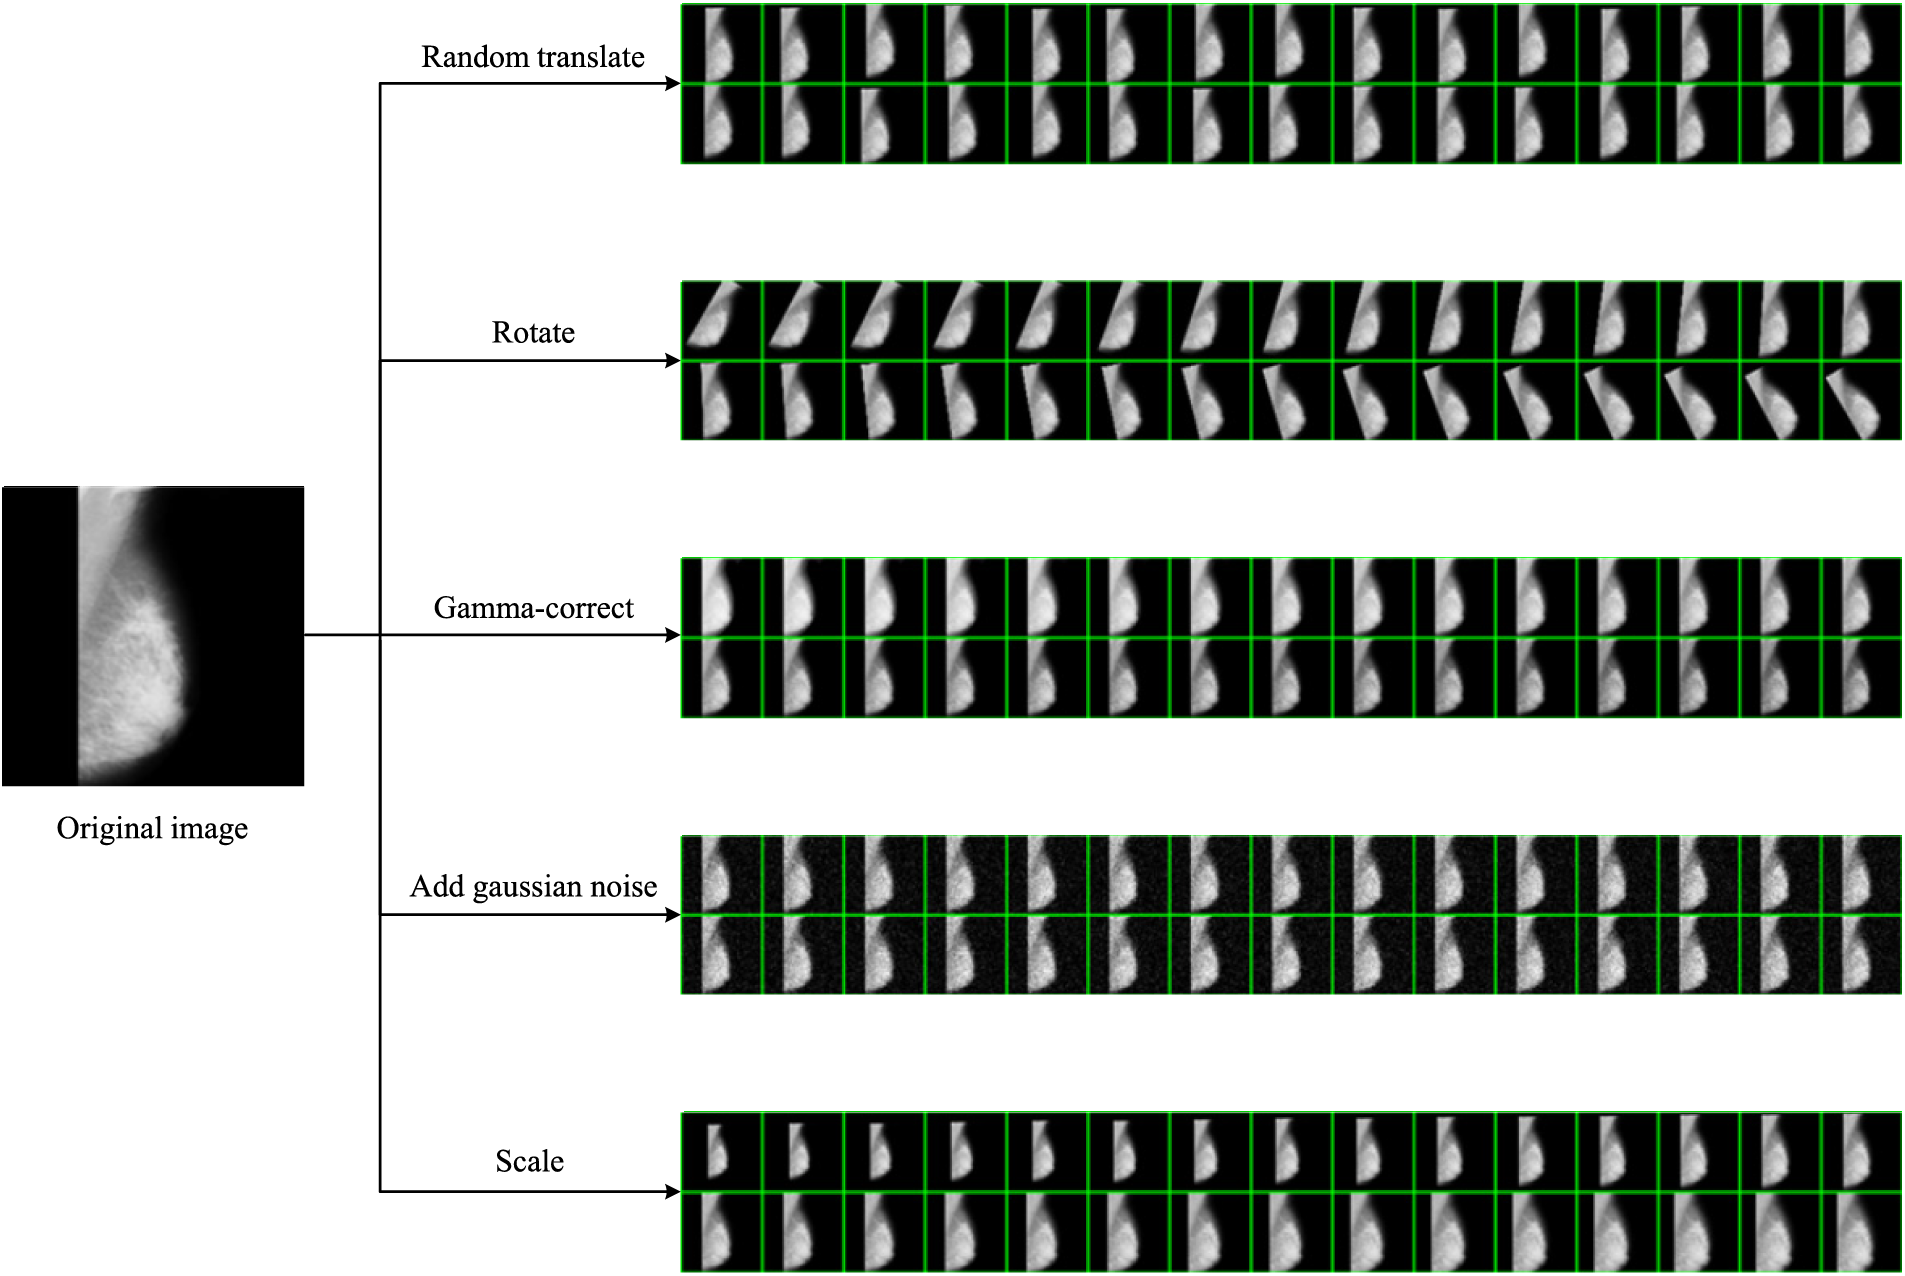
Figure 7: Results of MDA
Random translation allows the objects or patterns in the images to shift within the image space, enabling the model to learn to recognize objects regardless of their specific location. Rotation augmentation introduces variations in the orientation of objects. Gamma correction can adjust the image brightness, which can be useful for handling varying lighting conditions. Gaussian noise injection adds random noise to the images, simulating noise commonly present in real-world data. Scaling augmentation alters the size of objects in the images, allowing the model to learn to recognize objects at different scales.
The SNSVM model is evaluated by running 10-fold cross-validation ten times. The results are listed in Table 3. The mean and standard deviation (MSD) of all runs are calculated to display the performance of the model and the fluctuations from multiple runs.
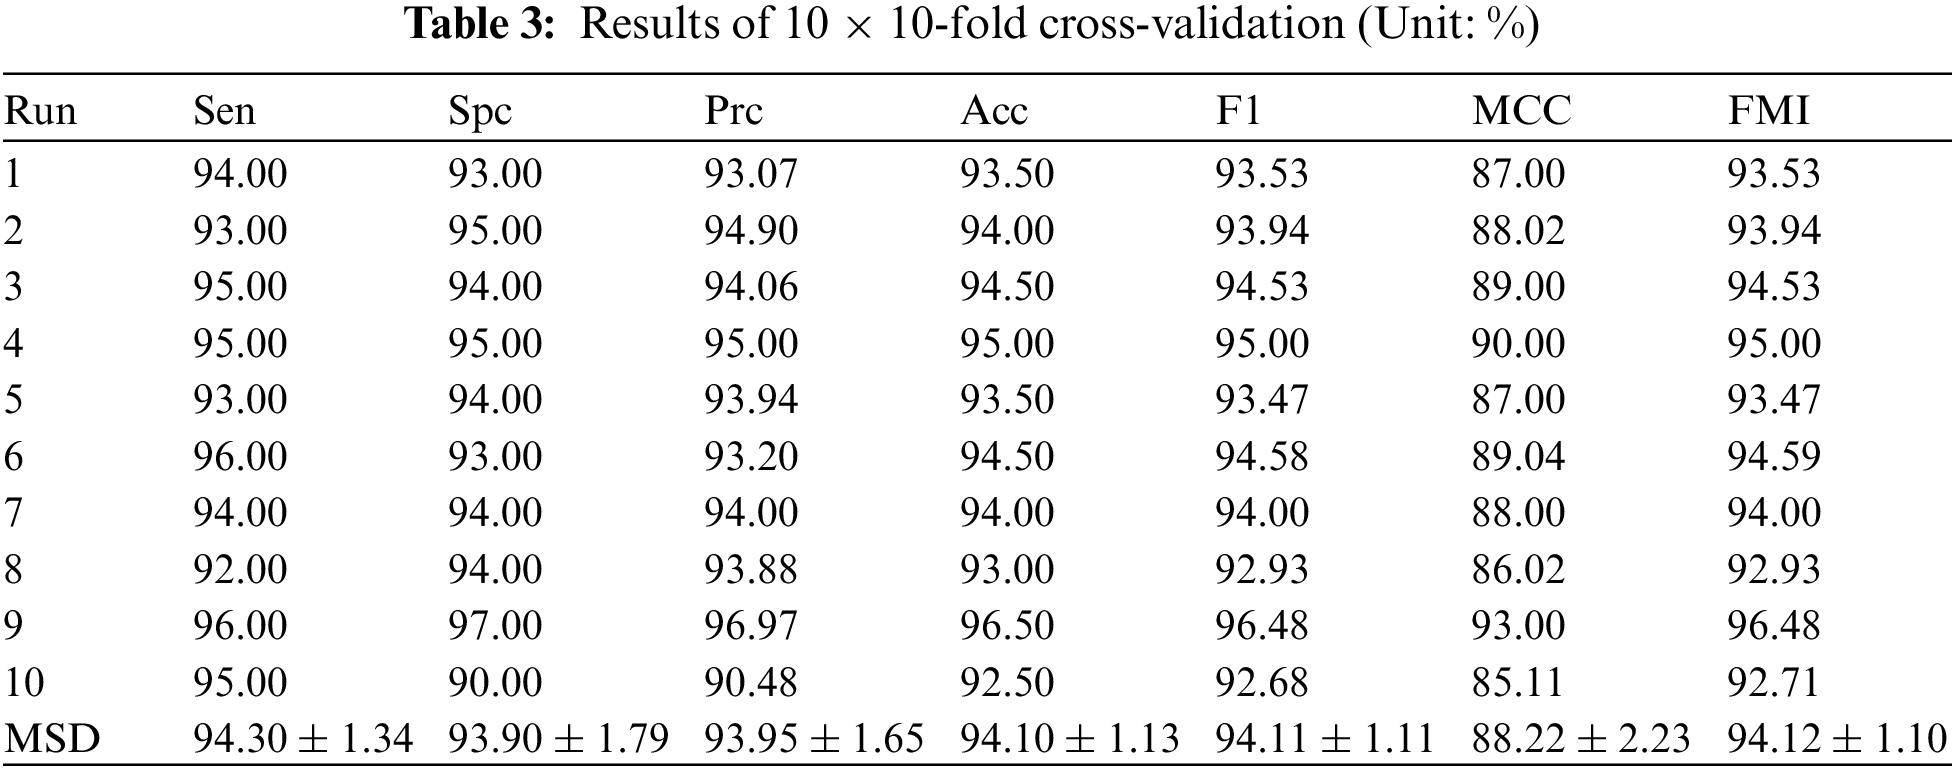
The sensitivity (Sen) is 94.30% ± 1.34%, the specificity (Spc) is 93.90% ± 1.79%, the precision (Prc) is 93.95% ± 1.65%, the accuracy (Acc) is 94.10% ± 1.13%, the F1 score is 94.11% ± 1.11%, the MCC is 88.22% ± 2.23%, and the FMI is 94.12% ± 1.10%.
Results rounded to two decimal places strikes a balance between result accuracy and readability. Overly precise results make data difficult to understand. The indicators presented in Table 3 suggest that the proposed model demonstrates good performance. After multiple runs, the final indicators obtained by averaging various indicators are consistently high, exceeding 90, except MCC.
The important indicator, accuracy, has an average value of 94.10% across multiple runs. The small standard deviation values indicate that there is little fluctuation in the same indicator across multiple runs. MCC is currently showing the largest fluctuation, only 2.23%. These MSD results for multiple indicators indicate that the SNSVM model is effective in the task.
The accuracy curves in Fig. 8 are obtained by iterating over the experiment process and plotted using Matlab. The light blue indicates the actual training results. The smoothed training results are indicated by dark blue.
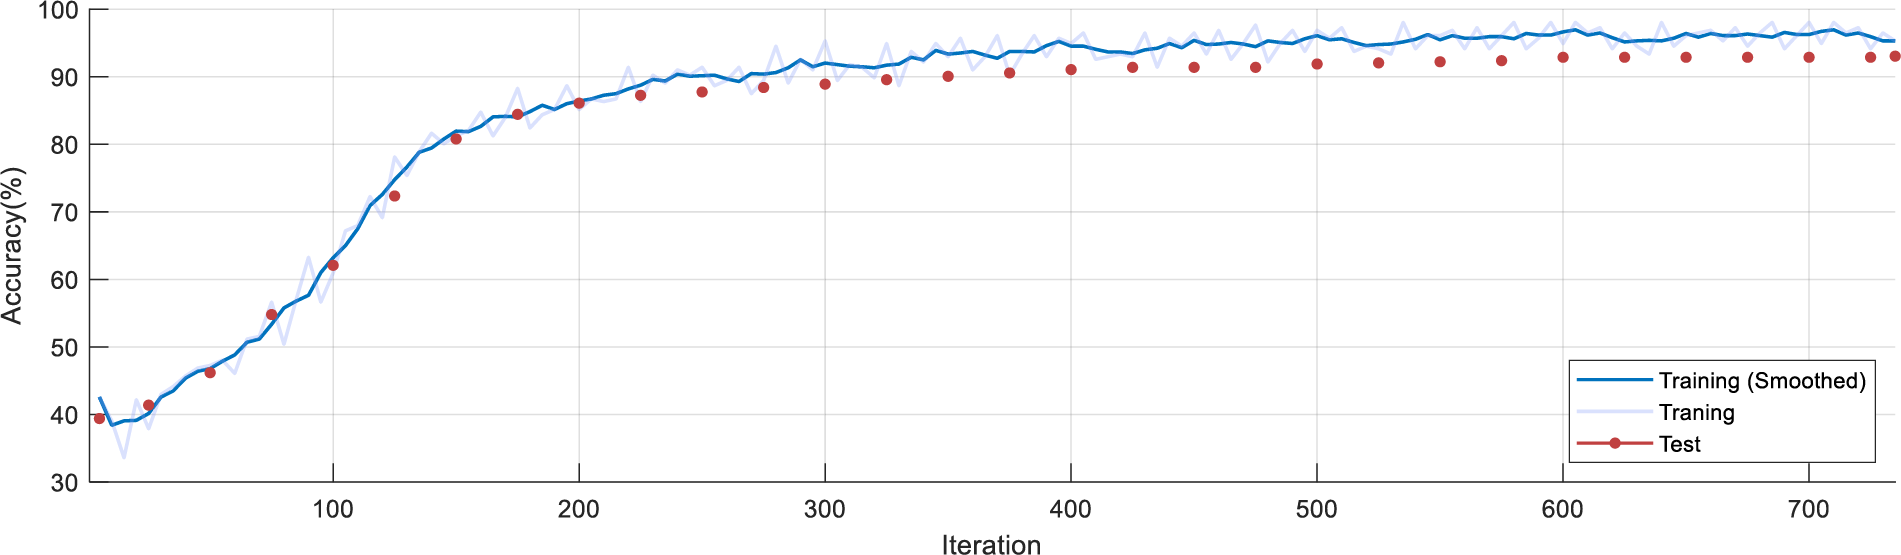
Figure 8: Accuracy convergence plot with iteration number
The red dots indicate the test accuracy for each iteration. Fig. 8 shows that the accuracy increases rapidly during the initial 0–200th iteration. In the 200th–400th iteration, the curve improves at a slower rate. After the 400th iteration, the test and training results remained consistently above 90%.
4.4 Receiver Operating Characteristic (ROC) Curve
The ROC curve is a visual tool for evaluating the performance of a binary classification model. It illustrates the trade-off between the true positive rate (TPR) and the false positive rate (FPR). The ROC curves in Fig. 9 are plotted by combining TPR and FPR from the ten runs. TPR is calculated as the number of true positive predictions divided by the total number of actual positives. FPR stands for False Positive Rate and is calculated as the number of false positive predictions divided by the total number of actual negatives. A high TPR indicates that the model is correctly identifying positive cases, while a low FPR indicates that the model is not falsely identifying negative cases as positive.
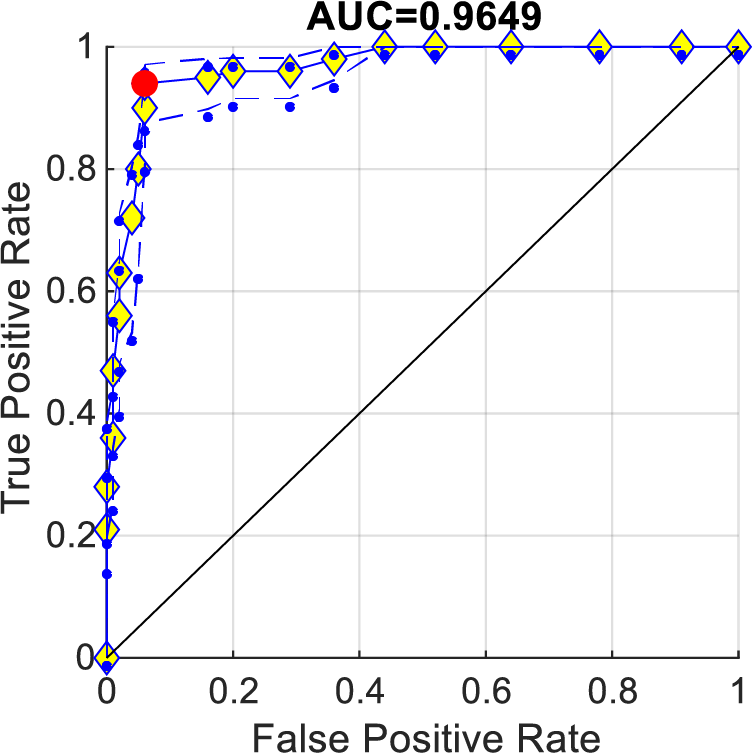
Figure 9: ROC curve
The area under the ROC curve (AUC) is a common metric used to summarize the performance of a classifier. An AUC value of 1 indicates perfect discrimination, which is practically impossible. An AUC value below 0.5 means worse performance than random guessing. Consequently, the AUC value of a model’s ROC curve increases as the curve approaches the upper left corner (0, 1), indicating a better classification performance of the model.
To better visualize whether the AUC is greater than 0.5, a solid black line connecting (0, 0) and (1, 1) is added. The area below this black line is 0.5. Obviously, the ROC curve obtained using SNSVM has an AUC = 0.9649 greater than 0.5. The cut-off point is used to determine the optimal classification threshold for the model, which balances the trade-off between TPR and FPR. The most prominent red point in Fig. 9 represents the cut-off point of the ten runs.
4.5 Comparison with State-of-the-Art Models
SNSVM is compared with state-of-the-art models, which include WEE + LRC [27], SVM [28], GoogleNet [29], CNNDL [30], MRFOTL [31], and SWAE [32], as shown in Table 4. A comparison of the results reveals that in each of the indicators, the proposed SNSVM gets the best results, but there is some fluctuation in the multiple validations. Based on Table 4, Fig. 10 is generated.
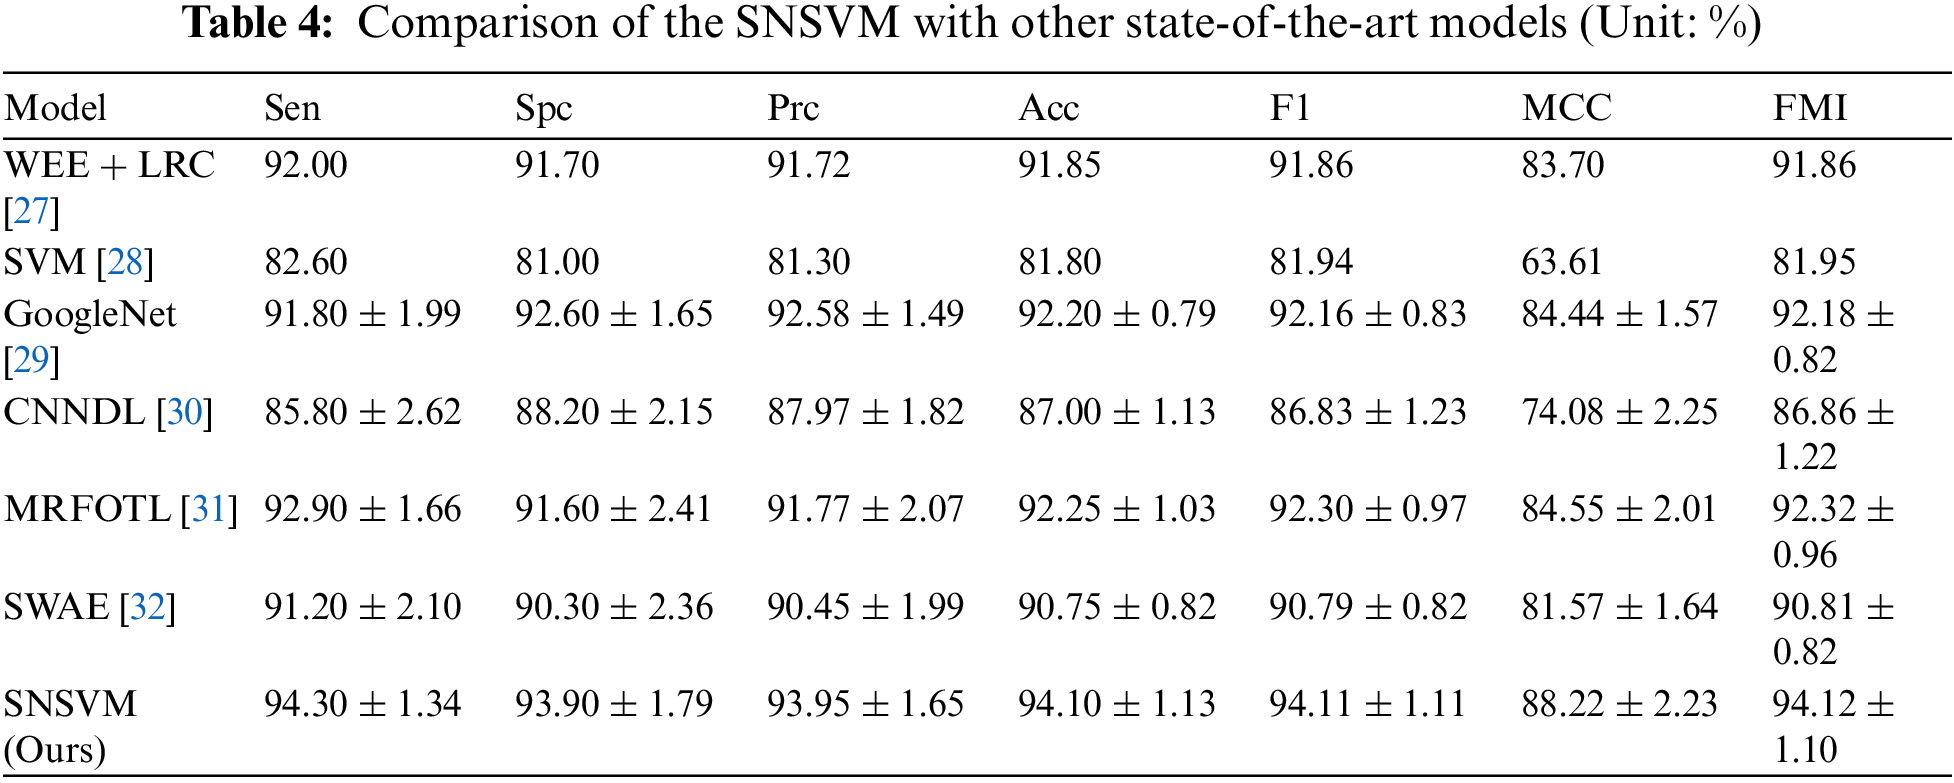
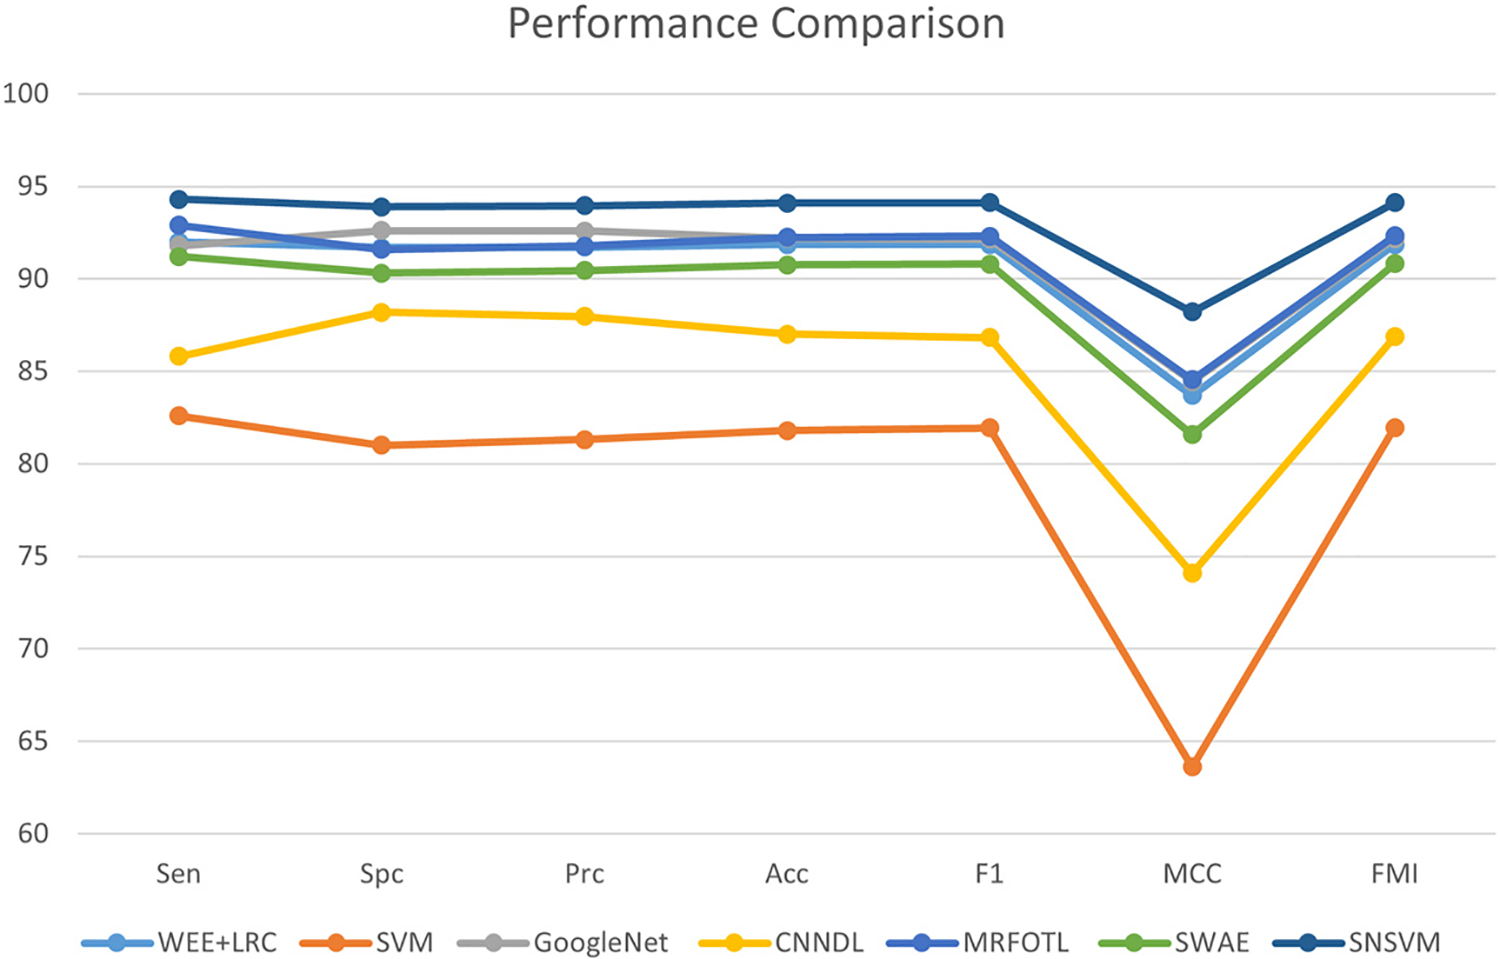
Figure 10: Comparison of SNSVM with other models
A model is proposed in this study, utilizing an SVM classifier guided by SqueezeNet with complex bypass. The dataset used for training is the publicly available breast cancer image dataset, mini-MIAS. Evaluation indicators include Sen, Spc, Prc, Acc, F1, MCC, and FMI. The experimental findings demonstrate that the proposed model surpasses the existing state-of-the-art models in all the performance metrics and exhibits reasonable fluctuations.
To enhance the performance of the SNSVM model, exploration of different algorithms and improvement of existing ones are planned to capture underlying patterns in the data more effectively. Thorough feature engineering will be conducted to extract relevant information and reduce noise. Furthermore, fine-tuning the model's hyperparameters will be pursued to achieve improved results. The aim is to optimize the model and increase its predictive power through these steps, resulting in a more effective decision.
Funding Statement: This paper is partially supported by MRC, UK (MC_PC_17171); Royal Society, UK (RP202G0230); BHF, UK (AA/18/3/34220); Hope Foundation for Cancer Research, UK (RM60G0680); GCRF, UK (P202PF11); Sino-UK Industrial Fund, UK (RP202G0289); LIAS, UK (P202ED10, P202RE969); Data Science Enhancement Fund, UK (P202RE237); Fight for Sight, UK (24NN201); Sino-UK Education Fund, UK (OP202006); BBSRC, UK (RM32G0178B8).
Conflicts of Interest: The authors declare that they have no conflicts of interest to report regarding the present study.
References
1. J. Aldrich, P. Ekpo, M. Rupji, J. M. Switchenko, M. A. Torres et al., “Racial disparities in clinical outcomes on investigator-initiated breast cancer clinical trials at an urban medical center,” Clinical Breast Cancer, vol. 23, no. 1, pp. 38–44, 2023. [Google Scholar] [PubMed]
2. W. C. Dan, X. Y. Guo, G. Z. Zhang, S. L. Wang, M. Deng et al., “Integrative analyses of radiation-related genes and biomarkers associated with breast cancer,” European Review for Medical and Pharmacological Sciences, vol. 27, no. 1, pp. 256–274, 2023. [Google Scholar] [PubMed]
3. E. Roberts, S. Howell and D. G. Evans, “Polygenic risk scores and breast cancer risk prediction,” Breast, vol. 67, no. 7, pp. 71–77, 2023. [Google Scholar] [PubMed]
4. J. Zatecky, O. Kubala, P. Jelinek, M. Lerch, P. Ihnat et al., “Magnetic marker localisation in breast cancer surgery,” Archives of Medical Science, vol. 19, no. 1, pp. 122–127, 2023. [Google Scholar] [PubMed]
5. M. Sansone, R. Fusco, F. Grassi, G. Gatta, M. P. Belfiore et al., “Machine learning approaches with textural features to calculate breast density on mammography,” Current Oncology, vol. 30, no. 1, pp. 839–853, 2023. [Google Scholar] [PubMed]
6. R. L. Siegel, K. D. Miller, H. E. Fuchs and A. Jemal, “Cancer statistics, 2022,” CA: A Cancer Journal for Clinicians, vol. 72, no. 1, pp. 7–33, 2022. [Google Scholar] [PubMed]
7. S. Kumar, P. Parthasarathi, M. A. Hogo, M. Masud, J. F. Al-Amri et al., “Breast cancer detection using breastnet-18 augmentation with fine tuned VGG-16,” Intelligent Automation and Soft Computing, vol. 36, no. 2, pp. 2363–2378, 2023. [Google Scholar]
8. Z. M. Ali, A. M. Galal, S. Alkhalaf and I. Khan, “An optimized algorithm for renewable energy forecasting based on machine learning,” Intelligent Automation and Soft Computing, vol. 35, no. 1, pp. 755–767, 2023. [Google Scholar]
9. S. Deepa, K. P. Sridhar, S. Baskar, K. B. Mythili, A. Reethika et al., “IoT-enabled smart healthcare data and health monitoring based machine learning algorithms,” Journal of Intelligent & Fuzzy Systems, vol. 44, no. 2, pp. 2927–2941, 2023. [Google Scholar]
10. H. X. Ren, B. Khailany, M. Fojtik and Y. Q. Zhang, “Machine learning and algorithms: Let us team up for EDA,” IEEE Design & Test, vol. 40, no. 1, pp. 70–76, 2023. [Google Scholar]
11. L. Cheng, R. Khalitov, T. Yu, J. Zhang and Z. R. Yang, “Classification of long sequential data using circular dilated convolutional neural networks,” Neurocomputing, vol. 518, no. 1, pp. 50–59, 2023. [Google Scholar]
12. N. R. Franco, S. Fresca, A. Manzoni and P. Zunino, “Approximation bounds for convolutional neural networks in operator learning,” Neural Networks, vol. 161, pp. 129–141, 2023. [Google Scholar] [PubMed]
13. A. A. Semenoglou, E. Spiliotis and V. Assimakopoulos, “Image-based time series forecasting: A deep convolutional neural network approach,” Neural Networks, vol. 157, no. 11, pp. 39–53, 2023. [Google Scholar] [PubMed]
14. Y. Zhang, M. A. Khan, Z. Zhu and S. Wang, “SNELM: SqueezeNet-guided ELM for COVID-19 recognition,” Computer Systems Science and Engineering, vol. 46, no. 1, pp. 13–26, 2023. [Google Scholar] [PubMed]
15. K. R. Kanaparthi and S. S. Ilango, “A survey on training issues in chili leaf diseases identification using deep learning techniques,” Procedia Computer Science, vol. 218, no. 3, pp. 2123–2132, 2023. [Google Scholar]
16. A. Kurani, P. Doshi, A. Vakharia and M. Shah, “A comprehensive comparative study of artificial neural network (ANN) and support vector machines (SVM) on stock forecasting,” Annals of Data Science, vol. 10, no. 1, pp. 183–208, 2023. [Google Scholar]
17. K. D. Thangavel, U. Seerengasamy, S. Palaniappan and R. Sekar, “Prediction of factors for controlling of green house farming with fuzzy based multiclass support vector machine,” Alexandria Engineering Journal, vol. 62, no. 3, pp. 279–289, 2023. [Google Scholar]
18. Q. Wan, H. Zhao, J. Li and P. Xu, “Human sleeping posture recognition based on sleeping pressure image,” IEEE Sensors Journal, vol. 23, no. 4, pp. 4069–4077, 2023. [Google Scholar]
19. V. Meiler, J. Pfeiffer, L. Bifano, C. Kandlbinder-Paret and G. Fischerauer, “Approaches to detect microplastics in water using electrical impedance measurements and support vector machines,” IEEE Sensors Journal, vol. 23, no. 5, pp. 4863–4872, 2023. [Google Scholar]
20. Z. Ye, T. Zuo, W. Chen, Y. Li and Z. Lu, “Textual emotion recognition method based on ALBERT-BiLSTM model and SVM-NB classification,” Soft Computing, vol. 27, no. 8, pp. 5063–5075, 2023. [Google Scholar]
21. P. Kaur and R. K. Singh, “A review on optimization techniques for medical image analysis,” Concurrency and Computation: Practice and Experience, vol. 35, no. 1, pp. e7443, 2023. [Google Scholar]
22. S. A. A. Rub, A. Alaiad, I. Hmeidi, M. Quwaider and O. Alzoubi, “Hydrocephalus classification in brain computed tomography medical images using deep learning,” Simulation Modelling Practice and Theory, vol. 123, no. 3, pp. 102705, 2023. [Google Scholar]
23. Y. Sahu, A. Tripathi, R. K. Gupta, P. Gautam, R. K. Pateriya et al., “A CNN-SVM based computer aided diagnosis of breast cancer using histogram K-means segmentation technique,” Multimedia Tools and Applications, vol. 82, no. 9, pp. 14055–14075, 2023. [Google Scholar]
24. D. Banumathy, O. I. Khalaf, C. A. T. Romero, J. Indra and D. K. Sharma, “CAD of BCD from thermal mammogram images using machine learning,” Intelligent Automation and Soft Computing, vol. 34, no. 1, pp. 667–685, 2022. [Google Scholar]
25. R. O. Ogundokun, S. Misra, M. Douglas, R. Damaševičius and R. Maskeliūnas, “Medical internet-of-things based breast cancer diagnosis using hyperparameter-optimized neural networks,” Future Internet, vol. 14, no. 5, pp. 153, 2022. [Google Scholar]
26. N. A. Samee, G. Atteia, S. Meshoul, M. A. Al-antari and Y. M. Kadah, “Deep learning cascaded feature selection framework for breast cancer classification: Hybrid CNN with univariate-based approach,” Mathematics, vol. 10, no. 19, pp. 3631, 2022. [Google Scholar]
27. Y. Chen, Y. Zhang, H. Lu, X. Chen, J. Li et al., “Wavelet energy entropy and linear regression classifier for detecting abnormal breasts,” Multimedia Tools and Applications, vol. 77, no. 3, pp. 3813–3832, 2018. [Google Scholar]
28. Z. Guo, M. Suchkov, L. Jiang and L. Yan, “Breast cancer detection via wavelet energy and support vector machine,” in 27th Institute of Electrical and Electronics Engineers Int. Conf. on Robot and Human Interactive Communication, Nanjing, China, pp. 758–763, 2018. [Google Scholar]
29. R. K. Samala, H. Chan, L. M. Hadjiiski, M. A. Helvie and C. D. Richter, “Generalization error analysis for deep convolutional neural network with transfer learning in breast cancer diagnosis,” Physics in Medicine and Biology, vol. 65, no. 10, pp. 13, 2020. [Google Scholar]
30. M. B. Khan, P. S. Saha and R. Shahrior, “Feasible detection of breast cancer metastasis using a CNN-based deep learning model,” in Int. Conf. on Electronics, Communications and Information Technology (ICECIT), Khulna, Bangladesh, pp. 1–4, 2021. [Google Scholar]
31. N. A. Baghdadi, A. Malki, H. M. Balaha, Y. AbdulAzeem, M. Badawy et al., “Classification of breast cancer using a manta-ray foraging optimized transfer learning framework,” PeerJ Computer Science, vol. 8, pp. 1–31, 2022. [Google Scholar]
32. C. H. Yun, B. Eom, S. Park, C. Kim, D. Kim et al., “A study on the effectiveness of deep learning-based anomaly detection methods for breast ultrasonography,” Sensors, vol. 23, no. 5, pp. 2864, 2023. [Google Scholar] [PubMed]
33. P. Balaji, V. Muniasamy, S. M. Bilfaqih, A. Muniasamy, S. Tharanidharan et al., “Chimp optimization algorithm influenced type-2 intuitionistic fuzzy C-means clustering-based breast cancer detection system,” Cancers, vol. 15, no. 4, pp. 1131, 2023. [Google Scholar] [PubMed]
34. K. Ding, Z. Xu, H. Tong and H. Liu, “Data augmentation for deep graph learning: A survey,” Association for Computing Machinery Special Interest Group on Knowledge Discovery in Data Explorations Newsletter, vol. 24, no. 2, pp. 61–77, 2022. [Google Scholar]
35. D. Karimi, G. Nir, L. Fazli, P. C. Black, L. Goldenberg et al., “Deep learning-based Gleason grading of prostate cancer from histopathology images—Role of multiscale decision aggregation and data augmentation,” IEEE Journal of Biomedical and Health Informatics, vol. 24, no. 5, pp. 1413–1426, 2019. [Google Scholar] [PubMed]
36. E. Başaran, “Classification of white blood cells with SVM by selecting SqueezeNet and lime properties by MRMR method,” Signal Image and Video Processing, vol. 16, no. 7, pp. 1821–1829, 2022. [Google Scholar]
37. I. Naseer, T. Masood, S. Akram, A. Jaffar, M. Rashid et al., “Lung cancer detection using modified AlexNet architecture and support vector machine,” Computers, Materials & Continua, vol. 74, no. 1, pp. 2039–2054, 2023. [Google Scholar]
38. P. K. Sethy, A. G. Devi, B. Padhan, S. K. Behera, S. Sreedhar et al., “Lung cancer histopathological image classification using wavelets and AlexNet,” Journal of X-Ray Science and Technology, vol. 31, no. 1, pp. 211–221, 2023. [Google Scholar] [PubMed]
39. K. A. Zakry, I. Hipiny and H. Ujir, “Classification of dances using AlexNet, ResNet18 and SqueezeNet1_0,” IAES International Journal of Artificial Intelligence, vol. 12, no. 2, 602, 2023. [Google Scholar]
40. R. Dey, R. C. Balabantaray and S. Samanta, “Recognition of handwritten characters from Devanagari, Bangla, and Odia languages using transfer-learning-based VGG-16 networks,” Imaging Science Journal, vol. 70, no. 2, pp. 61–74, 2022. [Google Scholar]
41. Q. Lin, Z. X. Man, Y. C. Cao and H. J. Wang, “Automated classification of whole-body SPECT bone scan images with VGG-based deep networks,” International Arab Journal of Information Technology, vol. 20, no. 1, pp. 1–8, 2023. [Google Scholar]
42. Y. W. Lu, W. L. Ma, X. Dong, M. Brown, T. Lu et al., “Differentiate Xp11.2 translocation renal cell carcinoma from computed tomography images and clinical data with ResNet-18 CNN and XGBoost,” Computer Modeling in Engineering & Sciences, vol. 136, no. 1, pp. 347–362, 2023. [Google Scholar]
43. A. A. Mashaal, M. A. A. Eldosoky, L. N. Mahdy and K. A. Ezzat, “Classification of human sperms using ResNet-50 deep neural network,” International Journal of Advanced Computer Science and Applications, vol. 14, no. 2, pp. 709–713, 2023. [Google Scholar]
44. H. Sahli, A. Ben Slama, A. Zeraii, S. Labidi and M. Sayadi, “ResNet-SVM: Fusion based glioblastoma tumor segmentation and classification,” Journal of X-Ray Science and Technology, vol. 31, no. 1, pp. 27–48, 2023. [Google Scholar] [PubMed]
45. K. Geetha, “An integrated approach for crop production analysis from geographic information system data using SqueezeNet,” Journal of Soft Computing Paradigm, vol. 3, no. 4, pp. 308–321, 2022. [Google Scholar]
46. M. Rasool, N. A. Ismail, A. Al-Dhaqm, W. Yafooz and A. Alsaeedi, “A novel approach for classifying brain tumours combining a SqueezeNet model with SVM and fine-tuning,” Electronics, vol. 12, no. 1, pp. 149, 2023. [Google Scholar]
47. G. Zhang, L. Zhu, R. Huang, Y. Xu, X. Lu et al., “A deep learning model for the differential diagnosis of benign and malignant salivary gland tumors based on ultrasound imaging and clinical data,” Quantitative Imaging in Medicine and Surgery, vol. 13, no. 5, 2989, 2023. [Google Scholar] [PubMed]
48. H. Kandil, A. Soliman, N. S. Alghamdi, J. R. Jennings and A. El-Baz, “Using mean arterial pressure in hypertension diagnosis versus using either systolic or diastolic blood pressure measurements,” Biomedicines, vol. 11, no. 3, pp. 849, 2023. [Google Scholar] [PubMed]
49. H. A. E. W. Khalifa and P. Kumar, “Multi-objective optimisation for solving cooperative continuous static games using Karush-Kuhn-Tucker conditions,” International Journal of Operational Research, vol. 46, no. 1, pp. 133–147, 2023. [Google Scholar]
50. C. Kavitha, V. Mani, S. Srividhya, O. I. Khalaf and C. A. Tavera Romero, “Early-stage Alzheimer’s disease prediction using machine learning models,” Frontiers in Public Health, vol. 10, pp. 240, 2022. [Google Scholar]
51. I. López-Cuenca, A. Marcos-Dolado, M. Yus-Fuertes, E. Salobrar-García, L. Elvira-Hurtado et al., “The relationship between retinal layers and brain areas in asymptomatic first-degree relatives of sporadic forms of Alzheimer’s disease: An exploratory analysis,” Alzheimer’s Research & Therapy, vol. 14, no. 1, pp. 1–18, 2022. [Google Scholar]
52. S. M. Mojtabaei, J. Becque, I. Hajirasouliha and R. Khandan, “Predicting the buckling behaviour of thin-walled structural elements using machine learning methods,” Thin-Walled Structures, vol. 184, pp. 110518, 2023. [Google Scholar]
Cite This Article
 Copyright © 2023 The Author(s). Published by Tech Science Press.
This work is licensed under a Creative Commons Attribution 4.0 International License , which permits unrestricted use, distribution, and reproduction in any medium, provided the original work is properly cited.
 Downloads
 Citation Tools