
 Submit a Paper
 Propose a Special lssue
 Open Access
ARTICLE

An Improved Jump Spider Optimization for Network Traffic Identification Feature Selection
School of Computer Science, Hubei University of Technology, Wuhan, 430068, China
* Corresponding Author: Yalin Hu. Email:
Computers, Materials & Continua 2023, 76(3), 3239-3255. https://doi.org/10.32604/cmc.2023.039227
Received 16 January 2023; Accepted 18 May 2023; Issue published 08 October 2023
 View Full Text
 Download PDF
Abstract
The massive influx of traffic on the Internet has made the composition of web traffic increasingly complex. Traditional port-based or protocol-based network traffic identification methods are no longer suitable for today’s complex and changing networks. Recently, machine learning has been widely applied to network traffic recognition. Still, high-dimensional features and redundant data in network traffic can lead to slow convergence problems and low identification accuracy of network traffic recognition algorithms. Taking advantage of the faster optimization-seeking capability of the jumping spider optimization algorithm (JSOA), this paper proposes a jumping spider optimization algorithm that incorporates the harris hawk optimization (HHO) and small hole imaging (HHJSOA). We use it in network traffic identification feature selection. First, the method incorporates the HHO escape energy factor and the hard siege strategy to form a new search strategy for HHJSOA. This location update strategy enhances the search range of the optimal solution of HHJSOA. We use small hole imaging to update the inferior individual. Next, the feature selection problem is coded to propose a jumping spiders individual coding scheme. Multiple iterations of the HHJSOA algorithm find the optimal individual used as the selected feature for KNN classification. Finally, we validate the classification accuracy and performance of the HHJSOA algorithm using the UNSW-NB15 dataset and KDD99 dataset. Experimental results show that compared with other algorithms for the UNSW-NB15 dataset, the improvement is at least 0.0705, 0.00147, and 1 on the accuracy, fitness value, and the number of features. In addition, compared with other feature selection methods for the same datasets, the proposed algorithm has faster convergence, better merit-seeking, and robustness. Therefore, HHJSOA can improve the classification accuracy and solve the problem that the network traffic recognition algorithm needs to be faster to converge and easily fall into local optimum due to high-dimensional features.Keywords
Network traffic identification provides the foundation and basis for subsequent network protocol involvement, network operation management, and network traffic scheduling. It also provides means for detecting network attacks and traffic cleaning in network security [1]. In the process of network protocol design, we provide data support for network design and application design by classifying network traffic and profoundly analyzing the evolutionary trend of traffic. In network operation management, traffic classification can identify abnormal and spam traffic. Traffic classification can also optimize network bandwidth resources and improve operational efficiency. In network traffic scheduling, network traffic classification can be used to control different application traffic differently and improve the quality of service. In network abnormal traffic detection, it detects abnormal and attacking behaviors in the network by establishing a model of the normal behavior of network traffic, which provides an essential guarantee for network security. Network traffic identification is of great significance.
The port-based traffic identification method has a more significant advantage in the early days. This method matches corresponding network traffic applications by detecting the port number in TCP/UDP packet headers. However, with the changing development of network applications, this simple and fast port identification method is becoming less and less applicable. Moore et al. [2,3] pointed out as early as 2004 to 2005 that port-based network traffic identification methods identified less and less network traffic with lower and lower accuracy. In addition to port-based techniques, traffic classification based on deep packet inspection (DPI) has been proposed. This technique has a higher classification accuracy, but the DPI technique takes longer to analyze the feature string and is not very timelier. And the DPI technique has a relatively high false detection rate for encrypted traffic [4]. In addition, as protocol versions are constantly changing, new private protocols emerge, and current protocol versions need to be re-parsed. Traditional methods based on network protocol parsing are also not widely used. The use of traditional traffic classification identification methods has yet to meet the needs of Internet traffic identification.
Machine learning has now been applied to network traffic identification. However, most of the current network traffic classification methods are based on traditional machine learning approaches, and the classification performance depends on the design of traffic features. Designing a set of features that can accurately characterize the traffic requires a lot of manual experience and feature engineering skills. Traffic feature selection and extraction is the method’s most essential and computationally intensive part. Deep learning methods are used to build end-to-end deep learning models by autonomously learning from the original traffic set to high-dimensional features [5]. In this case, the classification process is entirely unknowable, and the process between the input and output is like a black box. To eliminate the impact of redundant and irrelevant features on network traffic identification, researchers have begun to use metaheuristics for high-dimensional data feature selection by taking advantage of the greater flexibility and self-organization of metaheuristics. However, traditional violent search or meta-inspired search algorithms have limitations in slow convergence and low search efficiency. How to determine the better feature search strategy has a significant impact on the network traffic classification results. The jumping spider optimization algorithm (JSOA) has fewer parameters and simple principles. It has a faster convergence speed and search capability than traditional Arithmetic Optimization algorithms (AOA) and harris hawk optimization (HHO) algorithms [6].
Considering the abovementioned problems, we propose a jumping spider optimization algorithm incorporating HHO and small hole imaging (HHJSOA). We use it in network traffic identification feature selection. A coding scheme for jumping spider individuals is proposed to find the optimal individuals by multiple algorithm iterations. The optimal individuals are used as the selected features for KNN classification. We use the UNSW-NB15 dataset and the KDD99 dataset. Then compare the proposed method with feature selection methods based on other algorithms to verify the effectiveness of our proposed HHJSOA algorithm. The main contributions of this paper are as follows:
1. A new feature selection method for network traffic identification is proposed. The method solves the drawback that the redundant data in the network traffic dataset leads to slow convergence of network traffic identification algorithm and falls into local optimum. The performance of the proposed method is compared with other methods using benchmark test functions and two different datasets.
2. Propose a new HHJSOA algorithm based on the JSOA algorithm. HHJSOA has a robust global search capability and local development capability.
3. The HHJSOA algorithm is a network traffic identification feature selection method. We use the binary version of HHJSOA to select the optimal combination of features, i.e., the optimal jump spider individual.
4. Fusion of HHO constitutes a novel search strategy for HHJSOA. Small hole imaging updates inferior jumping spider individuals to prevent JSOA from falling into local optimum. The escape energy factor of HHO, hard siege strategy, and small hole imaging play an essential role in the feature selection process of HHJSOA.
The rest of this paper is organized as follows: Section 2 introduces the research related to network traffic identification. Section 3 introduces some basic concepts. Section 4 introduces our proposed method. Section 5 provides the experimental design and analysis. The last section outlines the limitations and future directions of this study.
2.1 Network Traffic Identification Methods Based on Traditional Methods
In the current network environment, achieving high accuracy in network traffic identification is no longer possible by relying on port numbers alone. Traditionally, DPI is the most accurate classification technique. Sen et al. [7] analyzed the packet load content by tracing and parsing the network packets. Afterwards, the internally embedded application signature is identified to identify P2P traffic accurately. This approach addresses the limitations of port number-based application classification. Bujlow et al. [8] compared traffic classification tools based on DPI identification methods, including commercial and open-source tools. The results demonstrate that the DPI-based classification method can classify traffic well in practical applications. Seddiki et al. [9] proposed an architecture for FlowQoS that facilitates users to configure the quality of service based on applications and devices. The two components of FlowQoS include a flow classifier and an SDN-based rate shaper. The classifier is used to identify flows under different protocols. Existing home routers cannot assign priority to each flow, so a dual-switch topology is used to implement flow-by-flow quality of service. Once the classifier determines the application type of the flow, the SDN rate shaper assigns the appropriate rate to the flow, thus classifying it. However, it is not widely deployed and used due to complexity and compatibility issues. However, this method cannot identify encrypted traffic and is less time-sensitive.
These traditional methods can meet the needs of network traffic classification to some extent but still have limitations for the current network environment.
2.2 Network Traffic Identification Methods Based on Machine Learning
To address the limitations of traditional network traffic identification methods, more and more machine learning methods are applied to network traffic identification. Moore et al. [10] designed 249 statistical features for the labeled dataset to describe the traffic, including a large amount of statistical information in addition to IP and port numbers. Most of the features applied to machine learning algorithms in subsequent studies are derived from this, and by combining different algorithms, the classification of network traffic is achieved. However, the effectiveness of network traffic classification based on traditional machine learning depends primarily on whether the manually designed network traffic features can represent the characteristics of the traffic well. Facing the increasingly complex network environment, it becomes increasingly difficult to create suitable traffic features. Zhou et al. [11] proposed to combine entropy estimation and artificial neural network (ANN) to optimize the classification model further and select suitable traffic features. In IoT cloud security, Elaziz et al. [12] proposed an intrusion detection method using deep learning and a roll tail search algorithm. CNN learns significant features in network traffic autonomously, and features with minimum fitness value are evaluated using the CapSA algorithm and KNN. The relevance of the features is improved while reducing the data dimensionality. Has high classification performance on multiple datasets. Rago et al. [13] proposed a traffic classification method based on a convolutional neural network. They use raw traffic data as input and convolutional neural networks to implement autonomous feature learning and improve classification accuracy. However, the abovementioned methods are prone to over-fitting problems on data sets with unbalanced samples. Dong [14] proposed a cost-sensitive support vector machine (SVM) model. An SVM-based traffic classification model was constructed using network traffic features, and the SVM model was further optimized. The classification accuracy is improved while reducing the computational cost and solving the data imbalance problem. Although deep learning can autonomously learn the high-dimensional features of network traffic, which solves the shortcomings of traditional machine learning to design traffic features manually, its black-box property determines that its classification process is uninterpretable and cannot provide network managers with more basis for decision-making.
Intelligent optimization algorithms are more self-organizing and have optimization capabilities. It can control the behavior of the whole group through the interaction of individuals without supervision, and the algorithm is easy to implement. Liu et al. [15] used the optimization ability of HHO to solve the shortcomings of clustering algorithms that tend to fall into local optimum. A data traffic classification method combining a clustering algorithm and improved HHO is proposed. The improved HHO is used to generate initial clustering centers. The initial center position is the guiding centroid for data traffic classification. Good classification results have been achieved in datasets. Sayed et al. [16] proposed an improved extreme optimization (EO) version. Optimization of EO search efficiency by chaotic mapping and transfer function. Apply it to the feature selection task of machine learning. Alrowais et al. [17] proposed a new intrusion detection method. This method uses an AOA to initialize the cluster set and the AOA algorithm to optimize the parameters of the classification model. This method optimizes the recognition effect of the model. Yang et al. [18] proposed an adaptive integration model. In this method, the salp swarm algorithm (SSA) is used to form the wrapper selection feature, and SSA is applied to the weight optimization of the matrix. Then, a new classifier is integrated with an adaptive weighted voting method to realize the accurate identification of abnormal traffic in multiple dimensions. These methods use an intelligent optimization algorithm to optimize the machine learning algorithm or improve the network traffic identification model combined with the machine learning algorithm, achieving good results in high-dimensional feature selection.
From the no-free lunch theorem [19], it is clear that no single algorithm can solve all optimization problems. Some algorithms still have the drawback of falling into local optimum after improvement, and algorithms with more robust search capability are needed to solve the network traffic identification feature selection problem.
3.1 Jumping Spider Optimization Algorithm
A new group intelligence algorithm called JSOA was proposed in 2021, which is conceptually simple, easy to implement, and efficient in finding the best. The jumping spider attack and search behaviors are switched randomly, and JSOA uses a position migration equation to update individual positions of low information rate jumping spiders.
The attack behavior of jumping spiders corresponds to the development of algorithms with persecution attacks and jumping attacks. Jumping spiders choose their attacks by the size of r, a random number between [0, 1]. When
When
The size of
The search behavior of the jumping spider corresponds to the exploration of the algorithm, including global and local search, and the search method is selected by the size of r.
When
When
The jumping spiders with low pheromone ratios less than or equal to 0.3 for the current iteration were relocated. The model for calculating the pheromone ratio of jumping spiders is as follows:
This paper uses the KNN learning algorithm to calculate the classification accuracy of selected feature subsets. The KNN algorithm finds the nearest K points of the sample to be predicted by the Euclidean distance and gives the prediction based on the majority of K points. The Euclidean distance is as follows:
4 HHJSOA for Network Traffic Identification Feature Selection
4.1 A New and Enhanced Search Strategy Incorporating Harris Hawk Optimization
The division of the search phase of the JSOA algorithm is based entirely on the size of random numbers, which prevents the global and local stages of the algorithm from being correctly balanced. On the one hand, the search space of jumping spiders is more extensive, and it is difficult to miss critical search information. On the other hand, the local exploration of JSOA is poor, and it is easy to fall into the local optimum. HHO is an intelligent population algorithm proposed in 2019, where HHO decreases prey’s energy and enters the local exploitation phase as the number of iterations increases. Due to Lévy wandering, HHO is highly resistant to local optima and disturbances and can successfully prevent the algorithm from “prematurely.” Therefore, this paper introduces the HHO prey escape energy factor E to form a seamless transition from global to local search in JSOA. The following is the equation for the escape energy factor E:
According to the escape energy factor E, We divide the jumping spider predation process into an intensive search phase, a search phase, and an attack phase. This search strategy solves the shortcomings of unbalanced global exploration and local development stages of JSOA and JSOA, easily falling into local optimization.
Several steps of the algorithm are listed below:
When E > 1, jumping spiders jump and search for prey, and prey are found and hide in the nearby area, and the population updates its position using Eq. (2);
When 0.5 < E < 1, the jumping spiders searched the area where the prey might be hidden. As the number of iterations increased, the jumping spiders kept searching for the target while the target kept escaping, and the prey’s energy value E decreased until E < 0.5, i.e., the target was exhausted, and the population updated its position using the Eqs. (4) or (5);
When E < 0.5, the prey’s energy is depleted, and according to the persecutory attack Eq. (1), the jumping spider starts its attack to catch it.
However, the persecution attack has only information interaction between the current individual and random individuals and lacks global exploration. The escape energy factor E is always less than one at the end of the iteration. This situation will lead the algorithm to a local optimum. Therefore, consider introducing the hard siege equation of HHO. The equation relies on the current position and the optimal individuals to achieve a diverse information interaction process. The following is the jumping spider hard siege equation:
4.2 Poor Solution Update Mechanism Using the Small Hole Imaging
If the child performs worse than the parent, the parent will be kept by the following generation without any improvements, according to the JSOA algorithm’s flow. This type of update wastes the computational resources used for this iteration, slows down the method’s convergence, and leads it to inferior accuracy of its converge. The process is assumed to enter the next iteration without improving the parent. In this case, the small hole imaging concept [20] is used to overcome this deficiency of the primary jump spider optimization process and regenerate the reverse solution. If the new solution outperforms the previous one, the old key is changed to a better one. Fig. 1 shows how small hole imaging works.

Figure 1: Small hole imaging diagram
The dynamically changing inertia weight
The hybrid algorithm forms a new type of jumping spider search strategy. The global exploration capability of the original algorithm is retained, and the convergence is faster and more exploitable. The HHJSOA process is shown in Fig. 2.
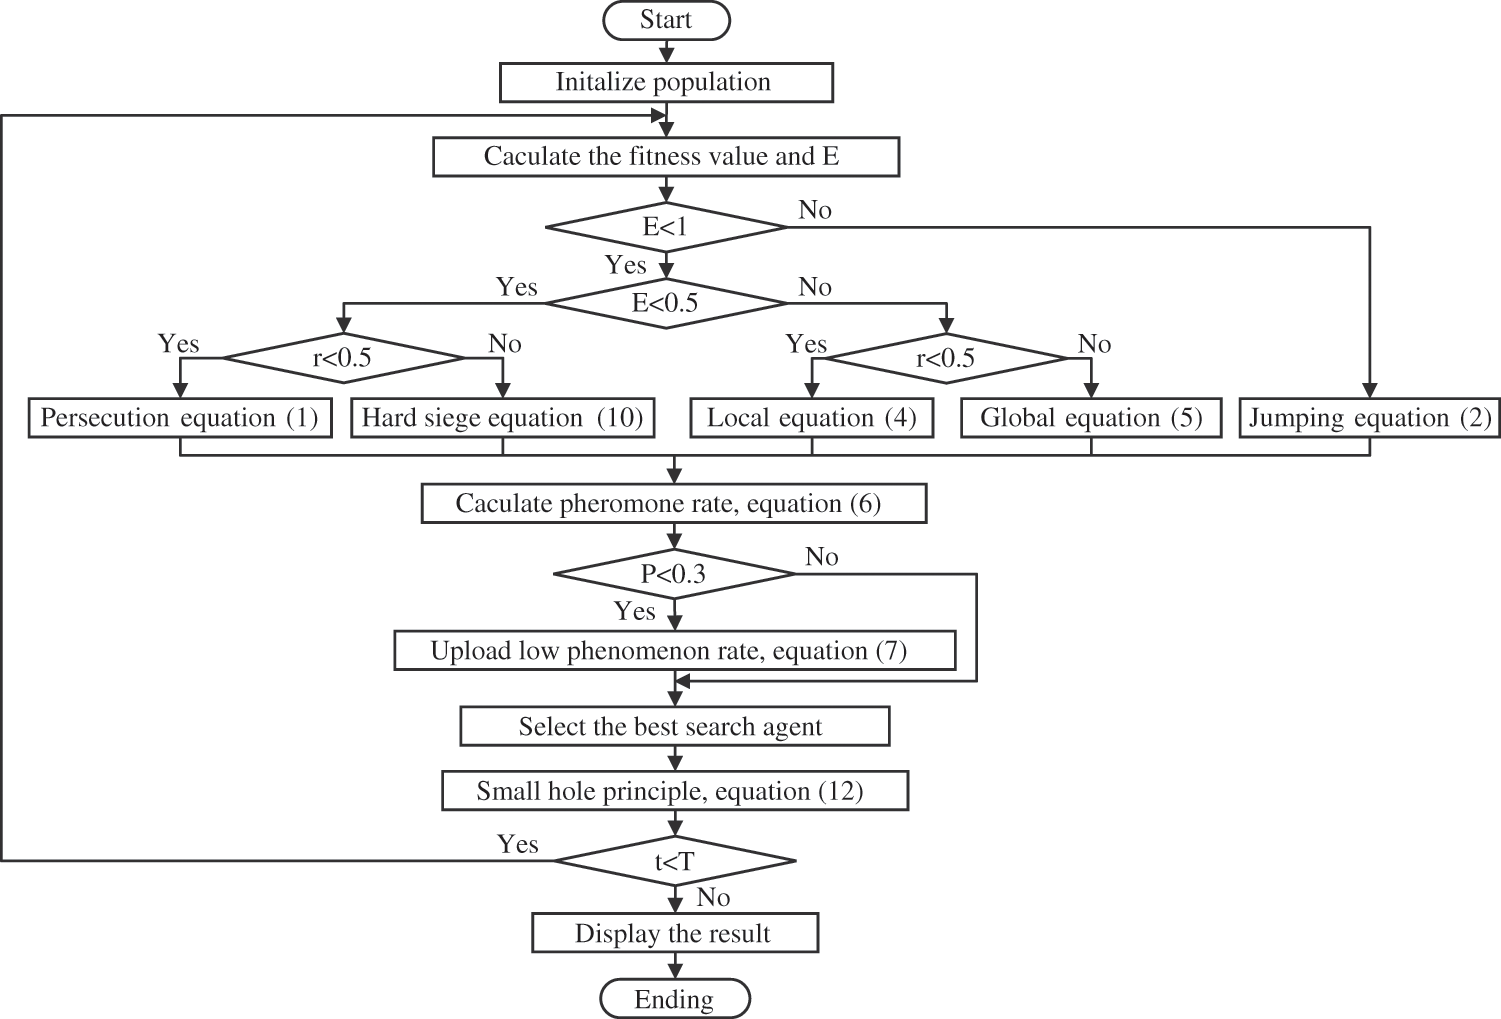
Figure 2: HHJSOA flow chart
4.3 HHJSOA for Network Traffic Identification Feature Selection
For the feature selection problem in traffic recognition, the following main processes are used to optimize the problem in this paper. To obtain a better feature subset scheme and classification accuracy. The flowchart of HHJSOA for the network traffic identification feature selection method is given in Fig. 3.

Figure 3: HHJSOA for network traffic identification feature selection flowchart
A jumping spider is a search agent using the HHJSOA algorithm for feature selection. Each jump spider is encoded as a binary string, representing the feature selection scheme. The feature selection scheme is to select an acceptable 0/1 string. Each dimension takes 1 (selected) and 0 (unselected) values in the feature selection process. As shown in Fig. 3, according to the feature optimization method in this paper, the feature selection method for network traffic identification based on HHJSOA mainly has the following process:
Step 1: Load the dataset, pre-clean, and generalize the training data to get the collated dataset D.
Step 2: Set the search agent population size N, the maximum number of iterations T, and the initialization parameters.
Step 3: Initialize the position of each jumping spider in the jumping spider population; since the jumping spider’s positions are decimal numbers, they need to be mapped to 0 or 1 by the mapping function, shown in Eqs. (15) and (16).
According to the mapping scheme, let the jumping spider position of HHJSOA be
where
Step 4: Binary decoding is performed for each jumping spider individual, and the jumping spider individual position is updated according to the HHJSOA search strategy; the jumping spider individual is mapped between [0, 1] according to Eq. (15), and the jumping spider individual position is updated using Eq. (16).
Step 5: Decode each jumping spider individual again, compare the updated jumping spider individual fitness value to the fitness value of the original jumping spider individual, and keep the better jumping spider individual.
Step 6: Determine whether the iteration reaches the termination condition; if yes, end the iteration. Otherwise, execute Step 4.
5 Experimental Design and Analysis
Section 5 is divided into two parts—the first part experiments with the effectiveness analysis of the HHJSOA algorithm. The second part validates the algorithm HHJSOA performance in network traffic identification on the UNSW-NB15 and KDD99 datasets. The experiments use an NVIDIA GeForce MX130 graphics card and Intel (R) Core (TM) i5-8265U (1.80 GHz) processor. The software environment is Windows 10, and the experiments are executed in Matlab2018b.
This section uses the UNSW-NB15 dataset for comparison experiments. UNSW-NB15 has 2540004 data and contains 49 features in ten categories, including one normal type and nine attack types. Table 1 records the details of UNSW-NB15. The attack types are “Fuzzers,” “Analysis,” “Backdoors,” “DoS, “Exploits,” “Generic,” “Reconnaissance,” “Shellcode,” and “Shellcode” and “Worms.” The original UNSW-NB15 dataset has redundant samples. The feature values are the same, but the categories are different. Therefore, we use a subset version of the UNSW-NB15 dataset. 175,341 data in the training set and 82,332 in the test set of the subset version of the UNSW-NB15 dataset, containing 41 features. A random sample of 10% of the data from the training and test sets of the subset is taken as the training and test sets, respectively.

The KDD99 dataset contains 41 categories, of which 38 are numeric features, and 3 are character-based features. Each connection record in the dataset can be categorized as “Normal,” “DOS,” “R2L”, “U2R,” and “Probing.” We processed 10% of kddcup.data_10_percent_corrected, and the test dataset was corrected. After that, 10% of the data are randomly selected from the training and test sets as the experimental dataset.
5.2 HHJSOA Performance Analysis
Six standard test functions were chosen to test whether the HHJSOA algorithm significantly improved performance. The search space, dimensionality, and theoretical optimum of the test functions are described in Table 1.
HHJSOA was compared with JSOA, jumping spider optimization with chaotic drifts (CJSOA) [22], Nonlinear-based chaotic harris hawks optimization (NCHHO) [23], An improved grey wolf optimizer (IGWO) [24], JSOA, and Tunicate Swarm Algorithm (TSA) [25]. Set the number of populations
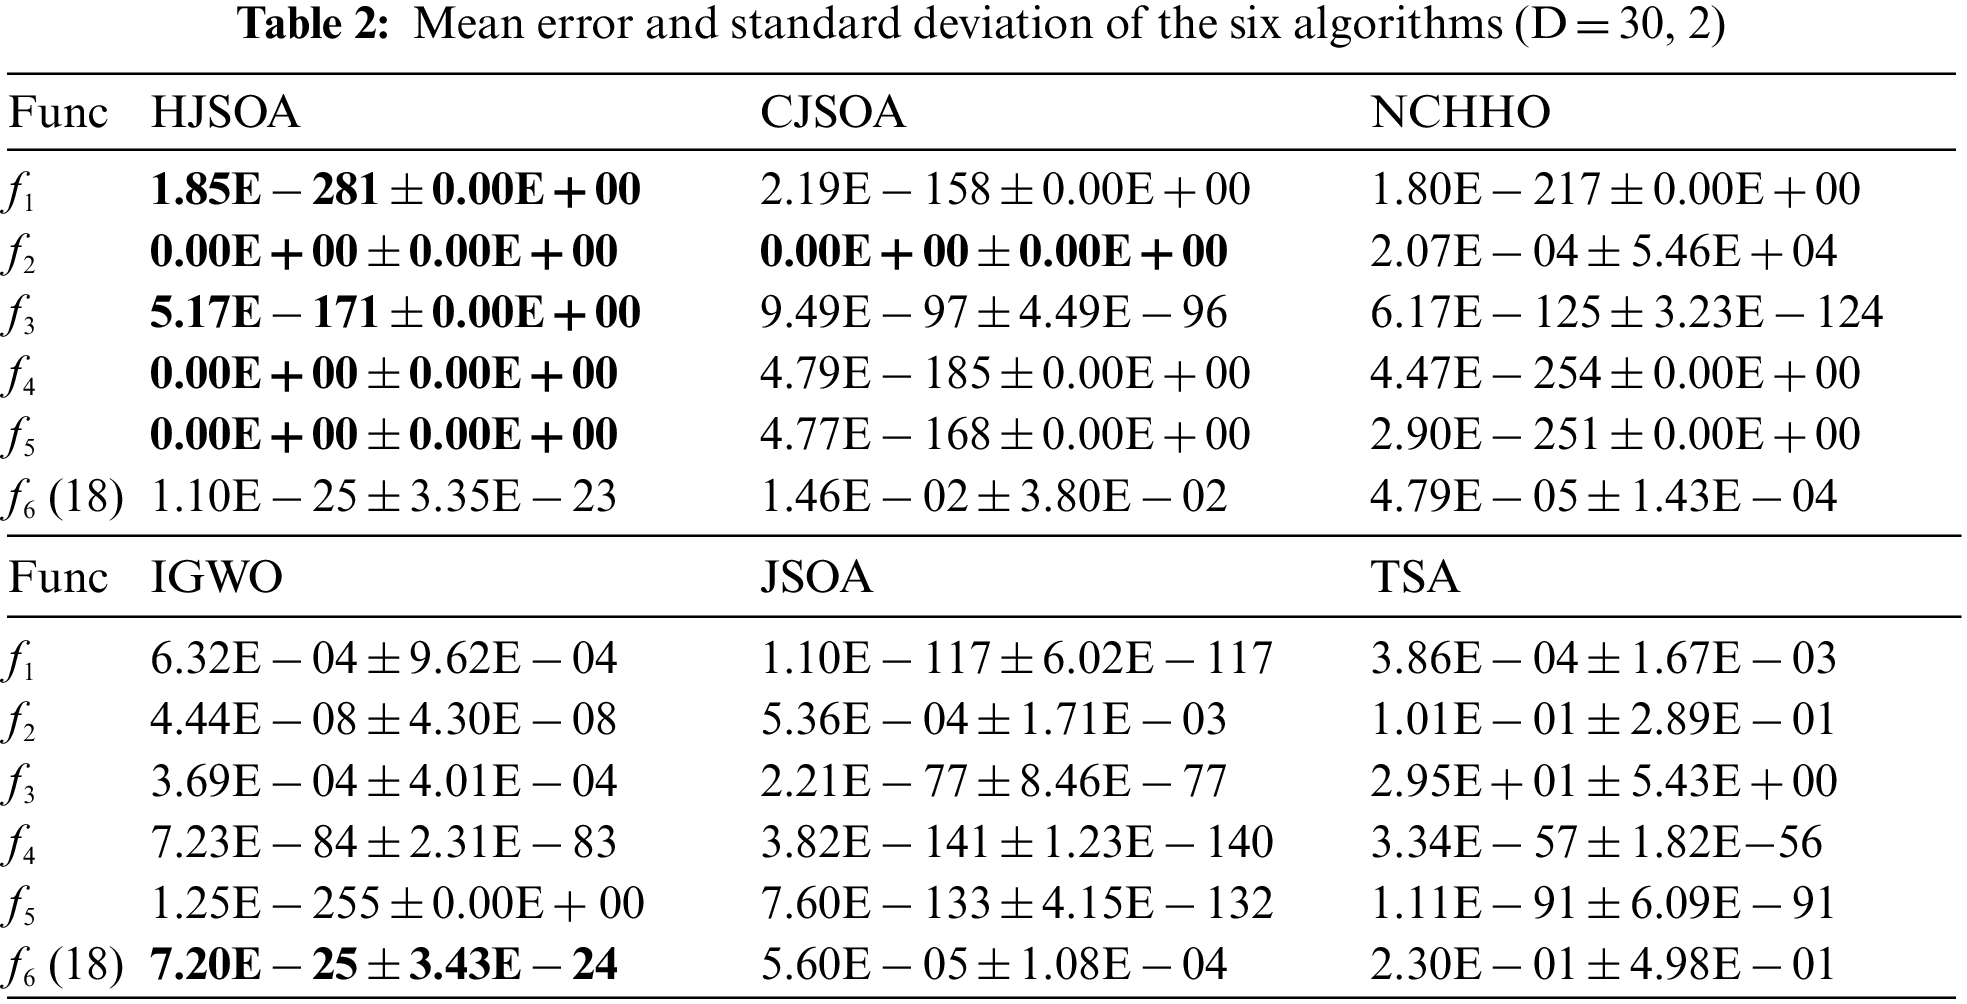

Figure 4: Convergence curves of the fitness values of the 6 algorithms on partial functions
As seen from Table 2, HHJSOA achieves similar results to IGWO on
To make a more objective evaluation of the algorithms, we used the Friedman and Wilcoxon tests in mathematical statistics to make an overall comparative analysis of the convergence ability of the algorithms. Table 3 shows the results of the Fireman test for all algorithms for six functions (D = 30, 50, 100, 2). The smaller the Ranking value, the stronger the optimization ability of the algorithm. Table 4 shows the Wilcoxon test results of the six algorithms on the functions. It is determined whether there is a significant difference between the algorithms.

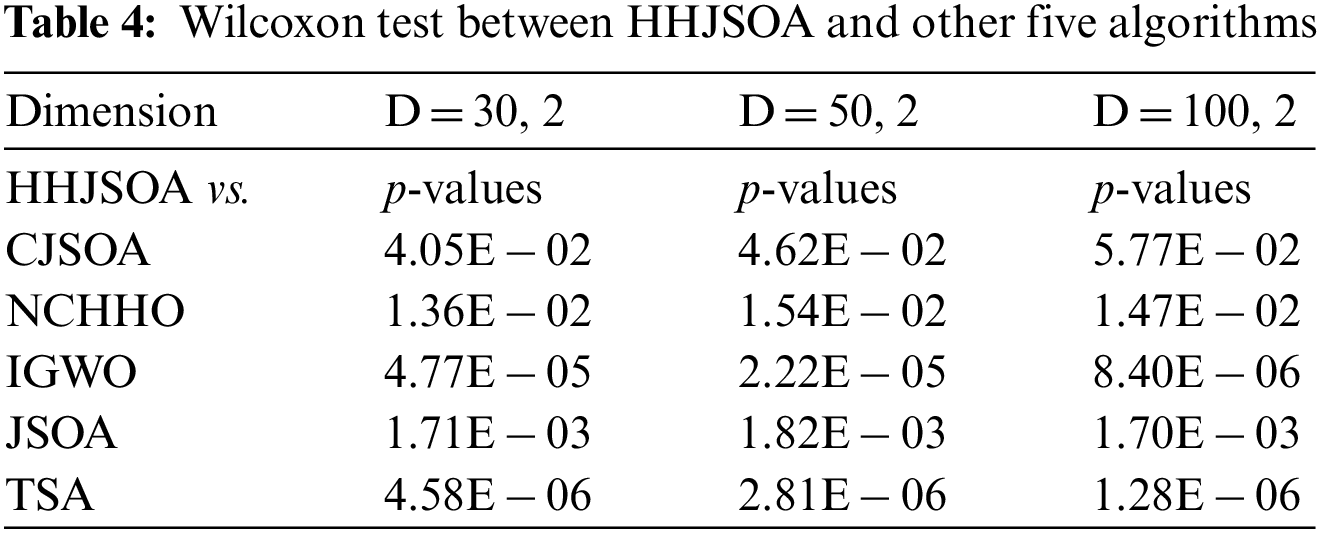
As seen from Table 3, the ranking values of HHJSOA are 1.71, 1.69, and 1.69 for different dimensions. This ranking is the smallest among all the algorithms. It is smaller than the basic JSOA algorithm by 2.24, 2.26, and 2.25, respectively. For the other algorithms, HHJSOA is at least 1.00, 1.00, and 0.99 smaller, respectively. Therefore, the algorithm’s overall performance suits both high and low-dimensional functions. Compared with the comparison algorithms, HHJSOA has a better competitive edge. As seen from Table 4, at
5.3 HHJSOA for Network Traffic Identification Feature Selection Performance Analysis
Set the population size N = 30 and the maximum number of iterations T = 500. Fig. 5 shows the convergence curves of the fitness values of the six algorithms HHO, EO, WOA, GWO, JSOA, and HHJSOA on different datasets. The convergence curve of the fitness value reflects the convergence speed of the algorithm and the ability of the algorithm to jump out of the local optimum. A boxplot is a statistical graph describing the dispersion of a set of data. It can also reflect the stability of the optimization effect. The size of the interquartile range (IQR) is used in the boxplot to describe the dispersion of the optimization effect. To avoid experimental errors, the experiments were recorded 20 times the optimal fitness value for each algorithm. Fig. 6 shows the boxplot of HHJSOA with the other five algorithms on the two datasets.
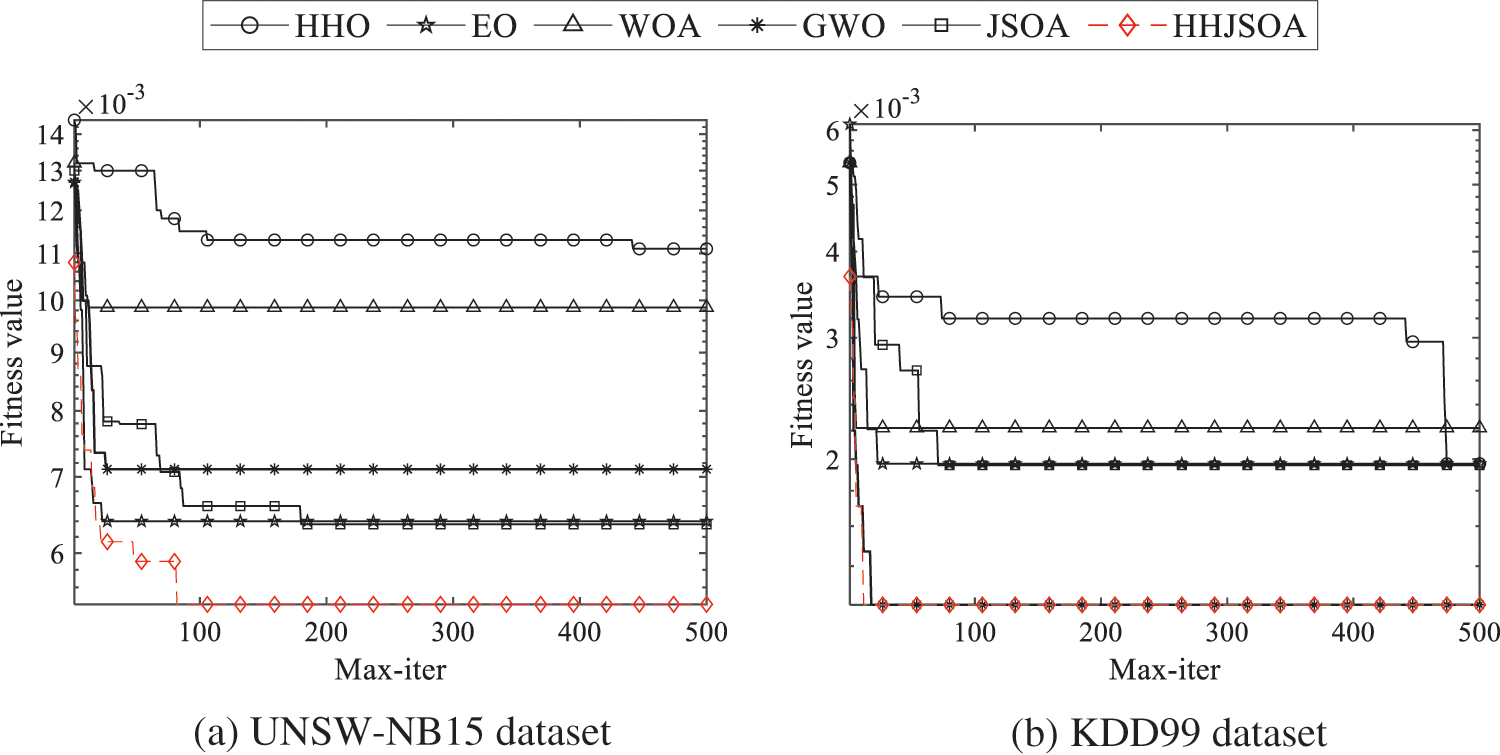
Figure 5: Comparison convergence curves of each algorithm on different datasets
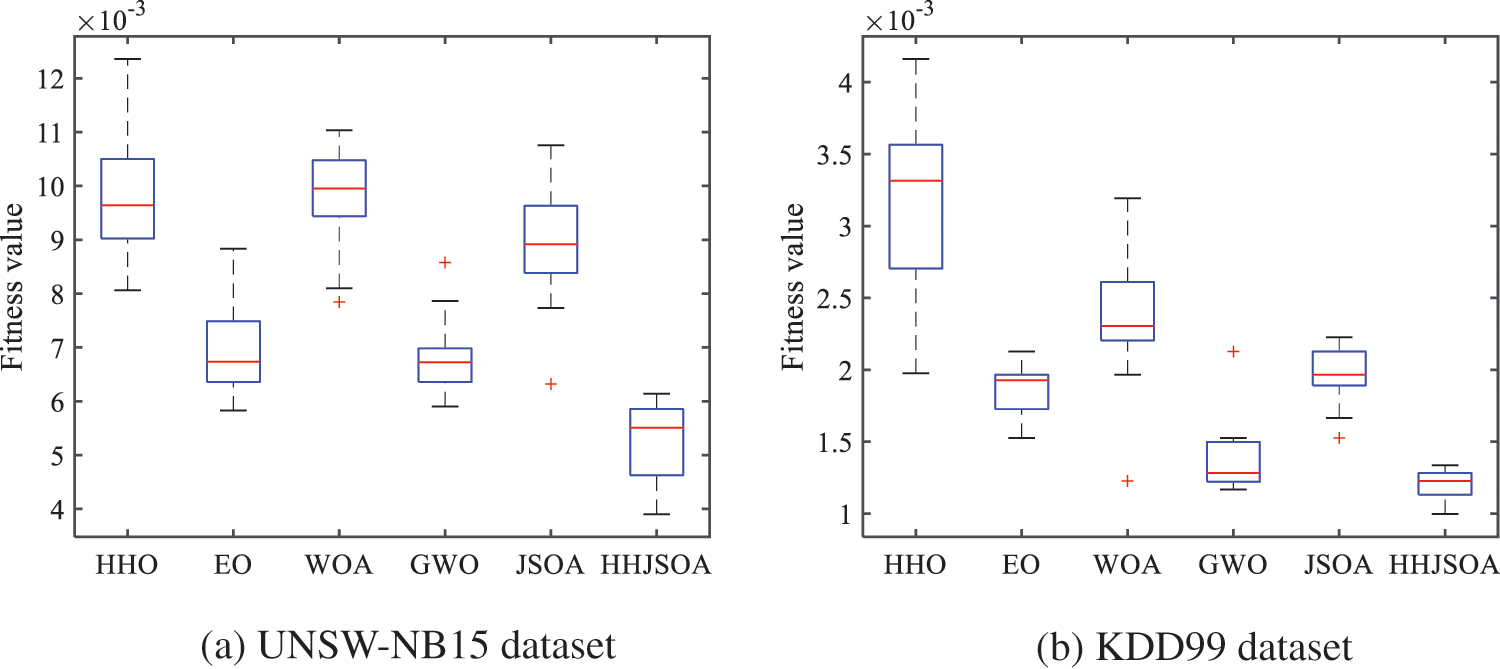
Figure 6: Boxplot for each algorithm on different datasets
As seen from Fig. 5, the JSOA algorithm converges quickly in the early stage, but the results are not good in the later stage. As the number of iterations of the algorithm increases, the algorithm keeps falling into and jumping out of the local optimum. On the UNSW-NB15 dataset, after 200 generations, JSOA can no longer jump out of the local optimum. The other algorithms fall into a local optimum on both data sets after about 100 generations and cannot jump out. On the KDD99 dataset, HHO has the ability to jump out of the current local optimum at a later stage, but no longer has a stronger local search capability after 500 generations. The GWO algorithm achieves comparable results to HHJSOA on the KDD99 dataset. But in contrast, HHJSOA converges faster in comparison. Collectively, HHJSOA is more capable of jumping out of local optimum and converging faster.
As seen from Fig. 6, the WOA, GWO, and JSOA algorithms produce outliers among the twenty optimal results on the UNSW-NB15 dataset. They are 0.00784, 0.00858, and 0.00632, respectively. This situation indicates that WOA, GWO, and JSOA easily fall into the local optimum. The median of HHJSOA is 0.00552, and the median of HHO, EO, WOA, GWO, and JSOA algorithms are 0.00977, 0.00665, 0.00979, 0.00682, and 0.00882, respectively. The median of HHJSOA is the lowest, at least 0.00113, smaller than the other algorithms. Therefore, HHJSOA each time produced the best quality jumping spider individual compared to several different algorithms. The IQR of HHJSOA is 0.00139, and the IQRs of the HHO, EO, WOA, GWO, and JSOA algorithms are 0.00148, 0.00110, 0.00100, 0.00060, and 0.00140, respectively. The IQR of HHJSOA is 0.00039 larger than that of EO, but overall, HHJSOA achieves a better fitness value each time is better. On the KDD99 dataset, WOA, GWO, and JSOA also produce outliers of 0.00122, 0.00212, and 0.00166, respectively. The median of HHJSOA is 0.00122, and the IQR is 0.00015. The IQR and median of HHJSOA are the smallest among the remaining three algorithms. This indicates that the optimal fitness value obtained by the HHJSOA algorithm is the least discrete among the six algorithms.
To show the experimental results more clearly, we record each algorithm’s correct rate, fitness value, and number of features after 20 independent runs in Table 5.
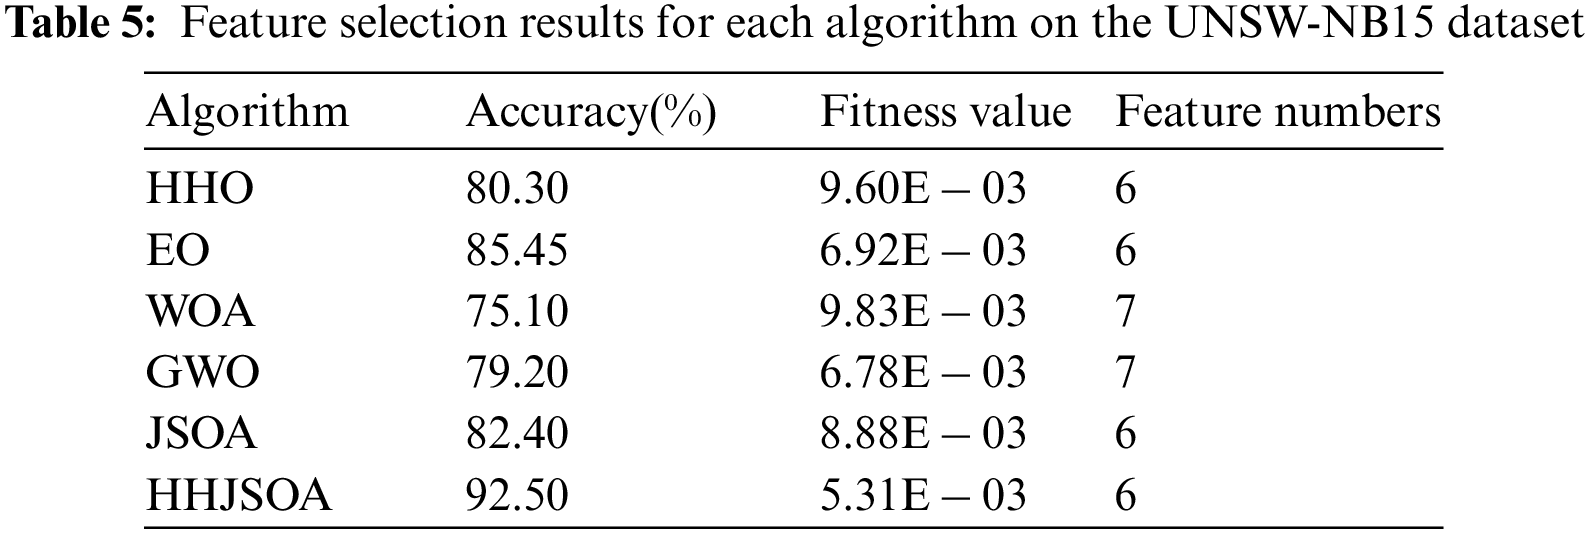
As seen from Table 5, HHJSOA achieves an accurate rate of 92.50%, while HHO, EO, WOA, GWO, and JSOA are 80.30, 85.45, 75.10, 79.20, and 82.40, respectively. Compared with the basic JSOA algorithm, HHJSOA achieves a 10.1% improvement in the accuracy rate and at least a 7.05% improvement compared with other algorithms. The HHO classification accuracy is higher, but the convergence speed is slower. It shows that HHJSOA converges faster while improving classification accuracy. Regarding the number of features, WOA and GWO are 7, and HHJSOA is 6. HHO, EO, and JSOA achieve the same results as HHJSOA. However, from the average fitness value, HHJSOA is only 0.00531, the smallest among several algorithms. It indicates that the HHJSOA algorithm converges faster and has a more vital ability to jump out of the local optimum while ensuring a higher classification accuracy.
6 Conclusion and Future Directions
Traffic identification is crucial for network structure design, operation management, quality assurance, and security. To address the problem that high-dimensional features make machine learning algorithms take a long time to converge, and classification algorithms easily fall into local optimum. In this paper, we propose an improved jumping spider optimization algorithm HHJSOA. Firstly, we fuse HHO and use the escape energy factor and hard siege strategy to balance the global and local search of JSOA. Secondly, the original optimal solution is optimized using small hole imaging. The shortcomings of the original algorithm JSOA with poor convergence and easy fall into local optimum are solved. The effectiveness of the HHJSOA algorithm is verified by solving six different benchmark functions. The HHJSOA algorithm solves the network traffic identification feature selection problem. The results show that HHJSOA performs best compared with HHO, EO, WOA, GWO, and JSOA algorithms on the UNSW-NB15 dataset and KDD99 dataset. However, the correct classification rate of HHJSOA is less than 95%. The classification effectiveness of the HHJSOA-based feature selection method for network traffic identification used in this paper is related to the optimal feature subset evaluator. However, the selected optimal feature subset is evaluated only on the KNN classification algorithm. In future work, other classification algorithms can be added for comparative study to choose a classifier more suitable for HHJSOA to solve the high-dimensional network traffic identification feature selection problem.
Acknowledgement: The authors would like to thank the anonymous reviewers for their valuable comments, which improved the quality of our original manuscript.
Funding Statement: This work is funded by the National Natural Science Foundation of China under Grant No. 61602162.
Author Contributions: study conception and design: X.H, H.Y, C.W, and H.L; data collection: H.Y; analysis and interpretation of results: X.H, H.Y, and C.W; draft manuscript preparation: X.H, H.Y, C.W, and H.L, All authors reviewed the results and approved the final version of the manuscript.
Availability of Data and Materials: The datasets used in this study are all publicly available datasets, which you can access in the following websites. https://www.kaggle.com/datasets/mrwellsdavid/unsw-nb15. http://kdd.ics.uci.edu/databases/kddcup99/kddcup99.html.
Conflicts of Interest: The authors declare that they have no conflicts of interest to report regarding the present study.
References
1. J. V. Gomes, P. R. M. Inácio, M. Pereira, M. M. Freire and P. P. Monteiro, “Detection and classification of peer-to-peer traffic: A survey,” ACM Computing Surveys, vol. 45, no. 3, pp. 1–40, 2013. [Google Scholar]
2. A. W. Moore and K. Papagiannaki, “Toward the accurate identification of network applications,” in Proc. of PAM, Boston, MA, USA, pp. 41–54, 2005. [Google Scholar]
3. A. Madhukar and C. Williamson, “A longitudinal study of P2P traffic classification,” in Proc. of MASCOTS, Monterey, CA, USA, pp. 179–188, 2006. [Google Scholar]
4. J. Zhang, X. Chen, Y. Xiang, W. Zhou and J. Wu, “Robust network traffic classification,” IEEE/ACM Transactions on Networking, vol. 23, no. 4, pp. 1257–1270, 2014. [Google Scholar]
5. Y. LeCun, Y. Bengio and G. Hinton, “Deep learning,” Nature, vol. 521, no. 7553, pp. 436–444, 2014. [Google Scholar]
6. H. Peraza-Vázquez, A. Peña-Delgado, P. Ranjan, C. Barde, A. Choubey et al., “A bio-inspired method for mathematical optimization inspired by arachnida salticidade,” Mathematics, vol. 10, no. 1, pp. 102, 2022. [Google Scholar]
7. S. Sen, O. Spatscheck and D. Wang, “Accurate, scalable in-network identification of P2P traffic using application signatures,” in Proc. of WWW04, New York, NY, USA, pp. 512–521, 2004. [Google Scholar]
8. T. Bujlow, V. Carela-Español and P. Barlet-Ros, “Independent comparison of popular DPI tools for traffic classification,” Computer Networks, vol. 76, no. 5, pp. 75–89, 2015. [Google Scholar]
9. M. S. Seddiki, M. Shahbaz, S. Donovan, S. Grover, M. Park et al., “FlowQoS: QoS for the rest of us,” in Proc. of ACM SIGCOMM Workshop HotSDN’14, New York, NY, USA, pp. 207–208, 2014. [Google Scholar]
10. A. W. Moore and D. Zuev, “Internet traffic classification using Bayesian analysis techniques,” in Proc. of SIGMETRICS, New York, NY, USA, pp. 50–60, 2005. [Google Scholar]
11. K. Zhou, W. Wang, C. Wu and H. Teng, “Practical evaluation of encrypted traffic classification based on a combined method of entropy estimation and neural networks,” ETRI Journal, vol. 42, no. 3, pp. 311–323, 2020. [Google Scholar]
12. M. A. Elaziz, M. A. A. Al-qaness, A. Dahou, R. A. lbrahim and A. A. EI-Latif, “Intrusion detection approach for cloud and IoT environments using deep learning and capuchin search algorithm,” Advances in Engineering Software, vol. 176, pp. 103402, 2023. [Google Scholar]
13. A. Rago, G. Piro, G. Boggia and P. Dini, “Multi-task learning at the mobile edge: An effective way to combine traffic classification and prediction,” IEEE Transactions on Vehicular Technology, vol. 69, no. 9, pp. 10362–10374, 2020. [Google Scholar]
14. S. Dong, “Multi class SVM algorithm with active learning for network traffic classification,” Expert Systems with Applications, vol. 176, pp. 114885, 2021. [Google Scholar]
15. Q. Liu, M. Li, N. Cao, Z. Zhang and G. Yang, “Improved harris combined with clustering algorithm for data traffic classification,” IEEE Access, vol. 10, pp. 72815–72824, 2022. [Google Scholar]
16. G. I. Sayed, G. Khoriba and M. H. Haggag, “A novel chaotic equilibrium optimizer algorithm with S-shaped and V-shaped transfer functions for feature selection,” Journal of Ambient Intelligence and Humanized Computing, vol. 13, no. 6, pp. 3137–3162, 2022. [Google Scholar]
17. F. Alrowais, R. Marzouk, M. K. Nour, H. Mohsen, A. M. Hilal et al., “Intelligent intrusion detection using arithmetic optimization enabled density based clustering with deep learning,” Electronics, vol. 11, no. 21, pp. 3541, 2022. [Google Scholar]
18. Z. Yang, Z. Liu, X. Zong and G. Wang, “An optimized adaptive ensemble model with feature selection for network intrusion detection,” Concurrency and Computation: Practice and Experience, vol. 35, no. 4, pp. e7529, 2023. [Google Scholar]
19. D. H. Wolpert and W. G. Macready, “No free lunch theorems for optimization,” IEEE Transactions on Evolutionary Computation, vol. 1, no. 1, pp. 67–82, 1997. [Google Scholar]
20. D. M. Zhang, H. Xu, Y. R. Wang and L. Q. Wang, “Whale optimization algorithm for embedded circle mapping and one dimensional oppositional learning based small hole imaging,” Control and Decision,vol. 36, no. 5, pp. 1173–1180, 2021. [Google Scholar]
21. M. Mafarja, I. Aljarah, A. A. Heidari, A. I. Hammouri, H. Faris et al., “Evolutionary population dynamics and grasshopper optimization approaches for feature selection problems,” Knowledge-Based Systems, vol. 145, no. 3, pp. 25–45, 2018. [Google Scholar]
22. L. Muthuramalingam, K. Chandrasekaran and F. J. Xavier, “Electrical parameter computation of various photovoltaic models using an enhanced jumping spider optimization with chaotic drifts,” Journal of Computational Electronics, vol. 21, no. 4, pp. 905–941, 2022. [Google Scholar]
23. A. A. Dehkordi, A. S. Sadiq, S. Mirjalili and K. Z. Ghafoor, “Nonlinear-based chaotic harris hawks optimizer: Algorithm and internet of vehicles application,” Applied Soft Computing, vol. 109, pp. 107574, 2021. [Google Scholar]
24. M. H. Nadimi-Shahraki, S. Taghian and S. Mirjalili, “An improved grey wolf optimizer for solving engineering problems,” Expert Systems with Applications, vol. 166, pp. 113917, 2021. [Google Scholar]
25. S. Kaur, L. K. Awasthi, A. L. Sangal and G. Dhiman, “Tunicate swarm algorithm: A new bio-inspired based metaheuristic paradigm for global optimization,” Engineering Applications of Artificial Intelligence, vol. 90, pp. 103541, 2020. [Google Scholar]
Cite This Article
 Copyright © 2023 The Author(s). Published by Tech Science Press.
This work is licensed under a Creative Commons Attribution 4.0 International License , which permits unrestricted use, distribution, and reproduction in any medium, provided the original work is properly cited.
 Downloads
 Citation Tools