
 Submit a Paper
 Propose a Special lssue
 Open Access
ARTICLE
A Smart Heart Disease Diagnostic System Using Deep Vanilla LSTM
1 Department of Computer Science, COMSATS University Islamabad, Attock Campus, Attock, Pakistan
2 Department of Computer Science, COMSATS University Islamabad, Islamabad, Pakistan
3 Department of Computer Science, UET Taxila, Taxila, Pakistan
4 Department of AI and Big Data, Soonchunhyang University, Asan, Korea
5 Department of Industrial Security, Chung-Ang University, Seoul, 06974, Korea
* Corresponding Author: Seungmin Rho. Email:
Computers, Materials & Continua 2023, 77(1), 1251-1279. https://doi.org/10.32604/cmc.2023.040329
Received 14 March 2023; Accepted 19 June 2023; Issue published 31 October 2023
 View Full Text
 Download PDF
Abstract
Effective smart healthcare frameworks contain novel and emerging solutions for remote disease diagnostics, which aid in the prevention of several diseases including heart-related abnormalities. In this context, regular monitoring of cardiac patients through smart healthcare systems based on Electrocardiogram (ECG) signals has the potential to save many lives. In existing studies, several heart disease diagnostic systems are proposed by employing different state-of-the-art methods, however, improving such methods is always an intriguing area of research. Hence, in this research, a smart healthcare system is proposed for the diagnosis of heart disease using ECG signals. The proposed framework extracts both linear and time-series information on the ECG signals and fuses them into a single framework concurrently. The linear characteristics of ECG signals are extracted by convolution layers followed by Gaussian Error Linear Units (GeLu) and time series characteristics of ECG beats are extracted by Vanilla Long Short-Term Memory Networks (LSTM). Following on, the feature reduction of linear information is done with the help of ID Generalized Gated Pooling (GGP). In addition, data misbalancing issues are also addressed with the help of the Synthetic Minority Oversampling Technique (SMOTE). The performance assessment of the proposed model is done over the two publicly available datasets named MIT-BIH arrhythmia database (MITDB) and PTB Diagnostic ECG database (PTBDB). The proposed framework achieves an average accuracy performance of 99.14% along with a 95% recall value.Keywords
Currently, for all the future generation technologies, the Internet of Things (IoT) is the developing trend [1]. It is immersed with several healthcare applications amalgamated with wearable monitoring systems [2]. The quality and coherence of the service are improved and magnified by employing the aspects of IoT in medical devices. This is the main reason why different industries of healthcare are adopting the IoT [3]. Different people, especially older people having chronic conditions and patients needing stable management are highly facilitated by the remarkable advantages of IoT [4]. Within the interval of standard time, different parameters of health such as real-time changes and updates on the severity of medical parameters are gathered by using healthcare applications based on IoT. Due to this, a gigantic amount of health information and data is generated. Moreover, the most pivotal future technology is IoT and it comes into view in several health industries [5]. Generally in the environment of high risks such as in Environment, Health, and Safety (EHS) industries [6], the great and astonishing potential of IoT is revealed. More specifically, in these environments, the life of patients are at risk and these applications based on IoT are deployed to provide safe, cost-effective, and dependable solutions [7]. Additionally, elderly people who prefer to stay home and are in favor of ease, are nursed by remote monitoring using IoT [8]. Around the globe, the emergence of IoT in the healthcare industry has encouraged different researchers in the IT field to develop smart applications which include health-aware suggestions such as mobile healthcare, and intelligent healthcare systems [5]. In 2021, the estimated size of the IoT healthcare market is a net worth of approximately $136 billion [9]. A compound annual growth (CAGR) is expected to rise the market is about 23.4% in upcoming years [9].
To examine heart disease, various types of patient data are collected. This data about the health conditions of patients is collected by smart wearable gadgets. More explicitly, this includes blood pressure, glucose level, and heart rate. The sensors placed on wearable equipment monitored continuously this data and send the recorded information to smartphones [10]. The whole IoT network is connected with ECG sensor nodes that are backed up [11]. This incorporates the functionality of plug-and-play [12]. Cloud servers are used to store this massive data collected by smart wearable gadgets [13]. Consequently, this data can be accessed distantly which includes both historical and real-time data [14]. In addition, the primary reasons for heart disease include stress, obesity, excessive use of oily and salty foods, genetic factors, hypertension, depression, and no daily exercise [15]. There are several studies conducted on heart patients. These research studies show that within a time of total 90 days, there are about 30 patients that had been readmitted. This readmission range varies from 25% to 54% in 3–6 months [15]. The main symptoms of heart disease include the abnormal frequency in the heartbeat of the patient. These symptoms are known as Arrhythmias.
These arrhythmias may cause and develop more severe levels of symptoms of heart disease which include such as rapid atrial fibrillation, persistent ventricular tachycardia, paroxysmal supraventricular tachycardia, etc. These are also causes of chest tightness, low blood pressure, sweating, dizziness, and sudden death [16]. All these heart conditions require early diagnosis and treatment [17]. The most common and persistent type of arrhythmia is Atrial fibrillation (AF) [18]. The risk of heart failure, stroke, and dementia is highly associated with AF, and it usually increases with age. Of the total population, about 1%–2% of people have AF in 2009 [18]. Later on, in the next 20–30 years this rate of AF patients becomes doubled and tripled in Europe and the United States [19]. In China, the AF patient rate is about 6.5 per 1000 people and the majority of people belong to the age group of 60 and above. Its rate is lower in people of middle-aged. In addition, some other types of arrhythmias are more dangerous and serious than AF, which include atrial flutter, ventricular bigeminy, bradycardia, etc. There is an almost 15% global mortality rate of patients suffering from tachyarrhythmias [20]. Therefore, the scope of attaining the facilities remotely is expanded by IoT which further enhances the quality of service [21]. These kinds of devices can facilitate chronic heart patients. Patients with such chronic diseases have a hazard of demise because at any moment the functionality of the heart stops working [22]. For accurate detection of heart disease, the real-time electronic stethoscope is also designed [23]. Such kind of automated heart disease detection systems can be integrated as a module with different real-time systems [24]. Therefore, there is a need for an effective and timely diagnosis of heart disease in these patients by monitoring their heartbeat signals. One of the important non-invasive diagnostic tools for monitoring electrical changes in heart conditions over time is the ECG. Some samples of ECG signals from MIT-DB and PTB ECG database is shown in Fig. 1.
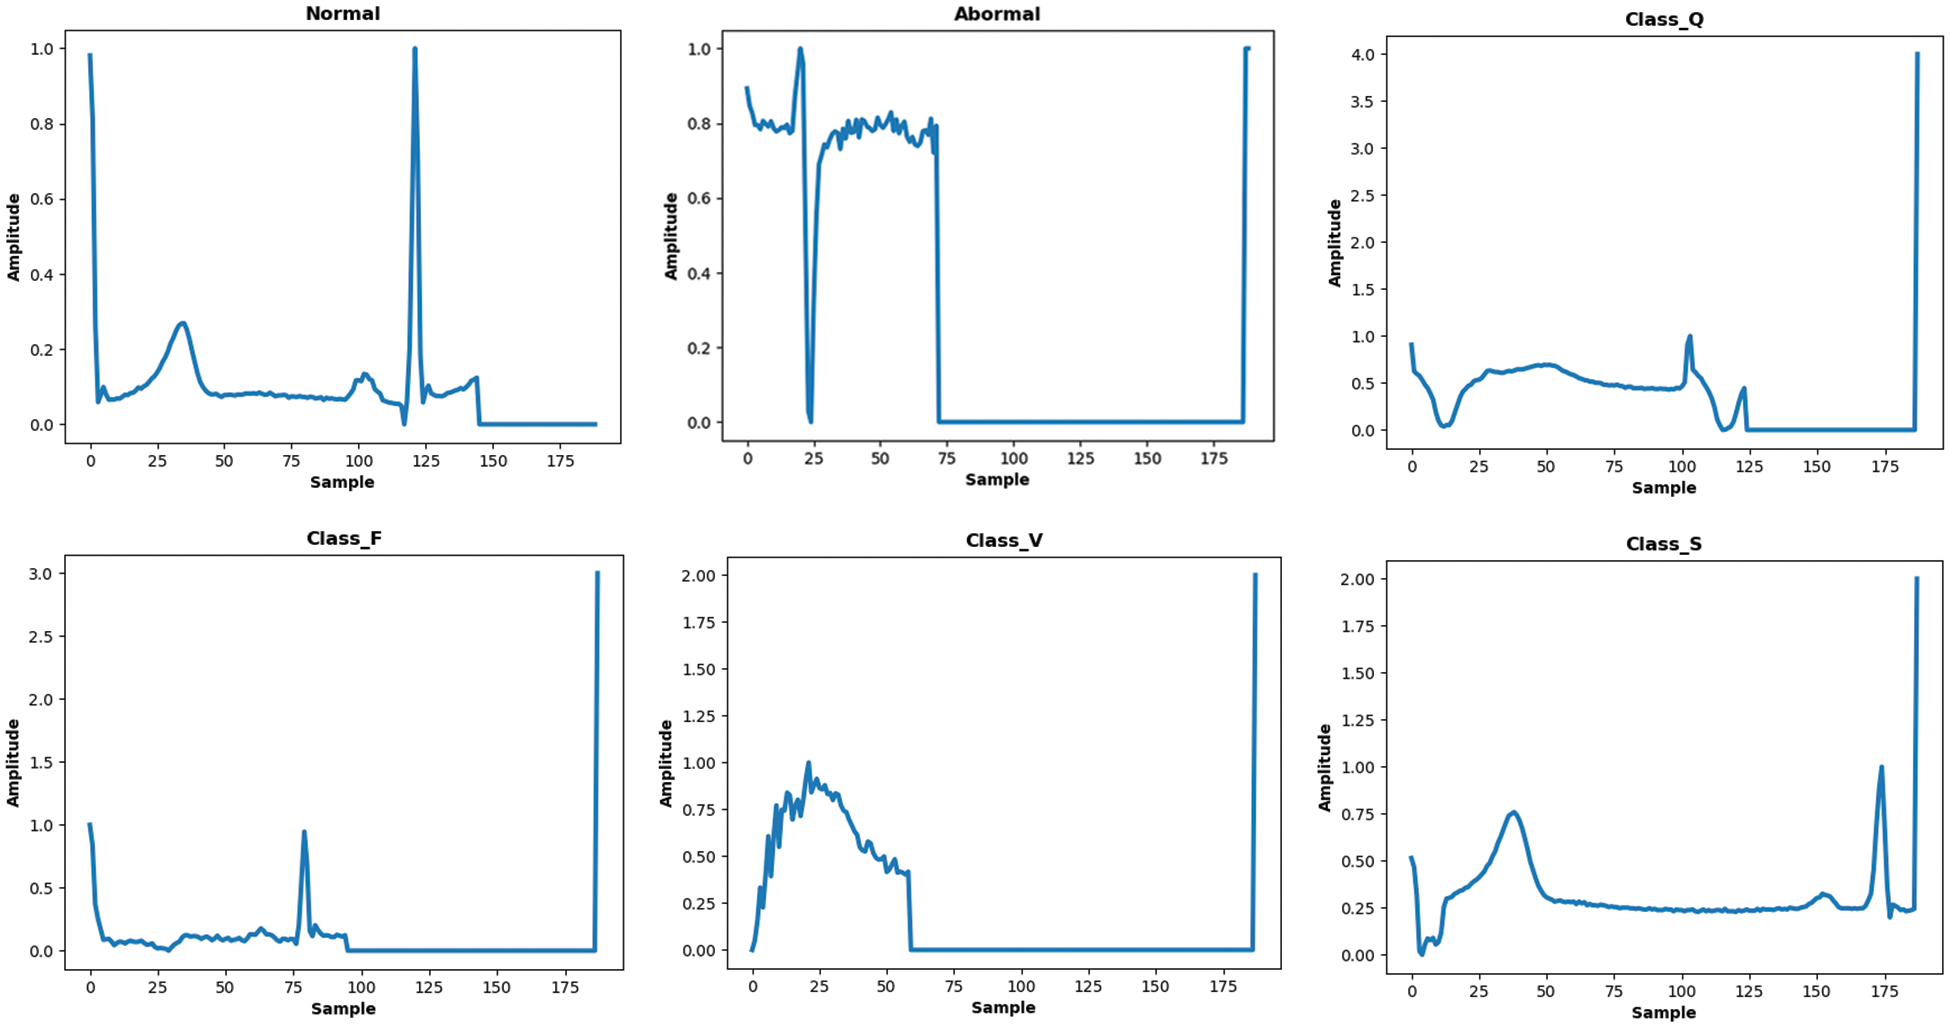
Figure 1: Samples of ECG signals from MITDB and PTB databases belong to several classes
It effectively records the abnormal frequencies, electrical activities of the heart, and rhythm of heartbeat signals [25]. The physiological information in the ECG signals is used by cardiologists for analyzing heart function and disorders. Due to the low amplitudes and non-linear nature of ECG signals, the naked eye does not observe the very small changes in the ECG data [26]. In addition, for accurate diagnosis of cardiac abnormalities in heartbeat signals, a 24-h Holter recording process is required. The manual analysis of ECG data is time-consuming and incommodious due to large-size recordings. Generally, each signal which belongs to a different type of arrhythmia requires different treatments. Therefore, it is necessary to first classify the type of arrhythmias before giving treatment to the patients.
As a result, automated systems based on current technologies are required for signal processing procedures that have reduced the time and effort of human analysis while also improving diagnostic accuracy in comparison to previous approaches. A great deal of work has recently been put into developing an automated healthcare monitoring system for heart disease. All of these research studies are classified based on the approaches used, as some used traditional machine learning methods, while others used deep learning-based methods and ensemble learning methods [27]. Traditional machine learning-based approaches involve different algorithms such as naive Bayes, decision trees, K-nearest neighbor, and random forest algorithms to perform the prediction of heart diseases using categorical attributes [28]. However, these approaches are also extended to work with ECG signals for heart disease prediction [29,30]. Feature fusion-based approaches combine the data from different modalities such as sensors and medical records of patients to perform the prediction of heart disease [31]. More recently, Generative Adversarial Networks (GAN) based approaches are being used in place of SMOTE for heart disease diagnosis, because of its ability to produce synthetic data to tackle class-imbalance concerns [32]. Different types of modalities are also employed to diagnose heart disease instead of only ECG features which include clinical features and image modality such as detection of heart disease by performing segmentation of coronary arteries [33,34]. Cardia Magnetic imaging resonance is also utilized to detect abnormalities in coronary arteries of the heart [35]. Following on, some ensemble deep learning-based methods are also employed in the prediction of heart disease [36,37]. Currently, deep learning-based techniques are also heavily used in heart disease predictions. An IoT-centered deep learning model has been designed to perform the diagnosis process in three stages [38].
Likewise, some modified versions of deep neural networks are also proposed with substantial improvement in accuracy to perform the classification of ECG signals into normal and abnormal classes [39]. Such state-of-the-art deep learning models and their variants are not limited to the detection of heart disease, they are also applicable to several other applications and domains [40–45].
In comparison with all these studies, an important research question arises what if two different characteristics of ECG signals are modeled in a single algorithm simultaneously to classify them? Second, some existing research studies employ different separate methods of feature selection in ECG classification to diagnose cardiac disorders e-g Relief feature selection (FS) algorithm [46] and stationary wavelet transform (SWT) [47], etc. In addition, the deep learning methods draw or downscaled the set of features using pooling operations in which only maximum activations are picked up, therefore, what if, during the feature selection or downscaling process of ECG vectors, we capture or select more prominent and adaptive ECG features using a mixing operation rather than picking up only the maximum activations? Moreover, the use of the activation function in the deep learning model also plays a significant role, so what if GeLu is employed that captures a probabilistic view of a unit’s outcome during learning? To answer these questions, a new deep-learning model for heart disease classification using ECG signals is suggested. The proposed framework considers both linear and time series characteristics of ECG signals simultaneously during their learning. Furthermore, a dimensionality reduction of ECG signal features is accomplished through generalized gated pooling which in turn downscales the feature vector in a more adaptive and generalized fashion due to mixing operations. The GeLu is employed to further boost the model performance during learning and it performs better than other activations functions [48]. As a result, in contrast with previous works, we approach the problem from a different perspective, first in terms of the information that ECG holds, then in terms of how to select the activations of ECG feature vectors in an adaptive manner, and finally, how to enhance deep learning model performance and convergence using best activation operations (i.e., the use of GeLu). In addition, the proposed framework is validated on two different datasets as well as considering the data imbalance issues using SMOTE. The following are the contributions of this work in the form of points. The proposed framework for the diagnosis of heart disease using IoT-based ECG data is presented in Fig. 2.
• A deep learning model for heart disease diagnosis is suggested based on concurrent learning of linear and time series characteristics of ECG signals.
• During model learning, a responsive and adaptive feature of ECG beats is selected by downscaling operation through generalized gating pooling.
• Gaussian Error Linear Units (GeLu) are employed as an activation function to boost the performance of the deep learning model.
• The suggested deep learning model performs well in the diagnosis of heart disease and can serve as a module in IoT systems for people in remote areas.
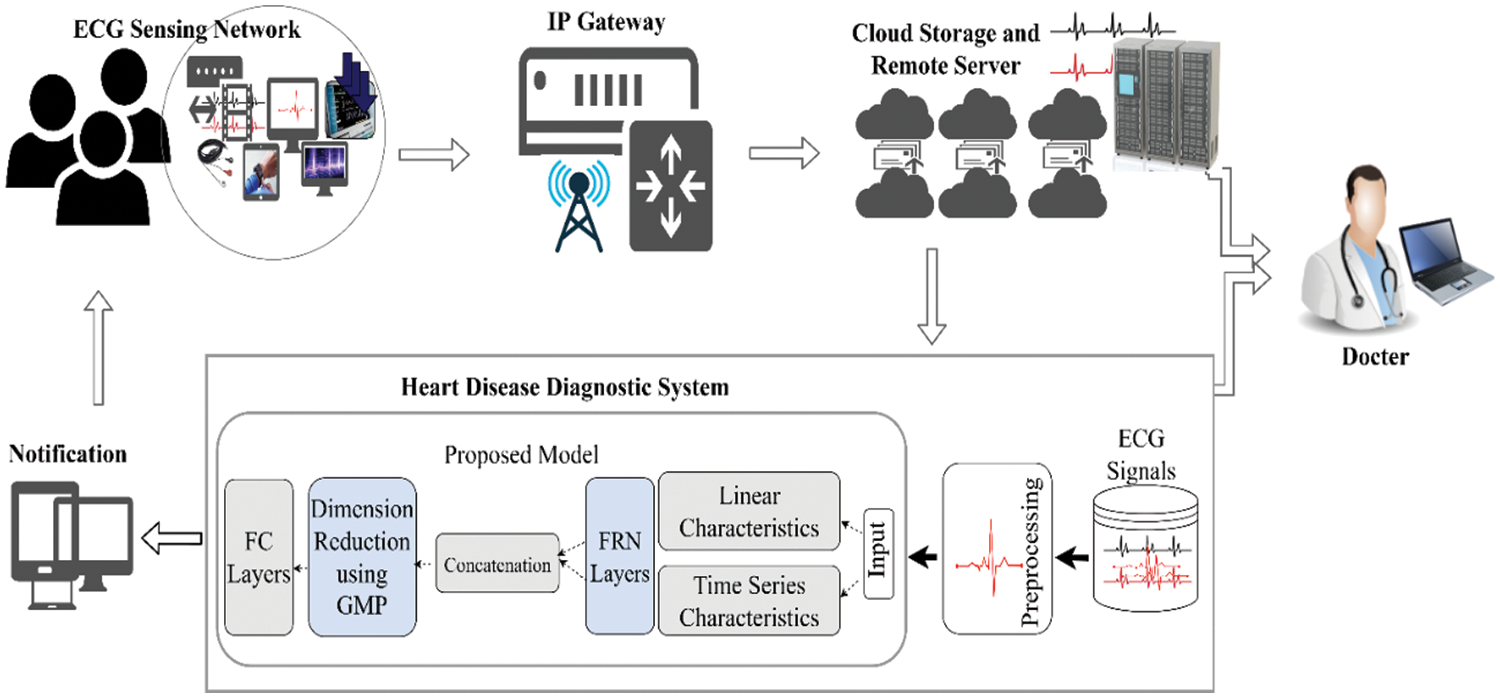
Figure 2: A schematic overview of the proposed framework
The rest of the paper is categorized into several sections: Section 2 describes the related work, Section 3 explains the proposed framework, and Section 4 presents the results followed by a conclusion.
In literature, there is an immense amount of work put forward by various researchers. An extensive set of models are designed to diagnose heart disease. In this section, some existing frameworks for this problem are described.
The literature on IoT base frameworks for the detection of heart diseases includes different types of studies such as sensor-based studies, machine-learning methods, hybrid machine-learning methods, and deep-learning methods. In sensor-based studies, Abdel-Basset et al. [49] took data from several sources to analyze patients with heart failure by using computer-supported frameworks with IoT. Initially, the users first provide the data of symptoms of heart failure from the body sensors. This data is taken from users’ mobile with the help of Bluetooth and further, it is transmitted to the database of the cloud by the smart gateway. Depending upon the symptoms of the diseases, the patients are divided into several groups by clinicians. In the end, the neutrosophic multi-criteria decision-making (NMCDM) method is combined with the IoT framework to diagnose the patients with optimal time and cost as well as observe heart failures. The efficiency and performance of the high-level system are corroborated by experimental outcomes. Similarly, for the storage and processing of abundant wearable sensor data, a three-tier scalable architecture is recommended by Kumar et al. [50]. The data complications from the several wearable IoT-based sensor devices are taken care of by Tier 1. In the environment of cloud computing, this data is further stored in Apache HBase by Tier 2. Subsequently, a prediction framework based on the logistic regression for the disease of the heart by using Apache Mahout is stored in Tier 3. Furthermore, grave diseases are observed and analyzed by Kumar et al. [51]. In their work, a mobile healthcare application based on IoT along with the cloud was proposed. To examine the health conditions, a fuzzy temporal-based neural classifier is employed in the framework. The experimental analysis of their work shows the superiority of their system in comparison with other frameworks.
Aside from sensor-based approaches, the automated detection of cardiac diseases is further utilized in basic frameworks using machine learning as in the work of Ali et al. [52]. In their work, the feature vectors are first normalized before their division into two non-overlapping sets of train and test. In the next stage, the neural network approach is followed to operate on training data and attain good performance. Al-Makhadmeh et al. used the high-order Boltzmann deep belief neural networks (NN) for the diagnosis of heart disease [53]. Vijayashree et al. proposed an algorithm based on Particle swarm optimization and support vector machine (PSO-SVM) to recognize heart disease using six categorical attributes [54]. More precisely, a PSO combined with an SVM is used to build the fitness function. Based on the functions of tuning and diversities of the population this fitness function finds the optimal weights. They compared their performance with other suggested models and reported suitable improvements over them. Liu et al. proposed their work into two stages [46]. In the first stage, three separate modules are developed: (i) discretization of data, (ii) feature extraction by utilizing the FS algorithm, and (iii) heuristic rough set algorithm for feature reduction. In the second stage, ensemble learning is used with the help of the C4.5 classifier. In addition, a dataset from the UCI repository named Statlog (Heart) dataset is used for experimentation. Furthermore, a traditional machine-learning-based automated system was developed by Haq et al. to perform the predictions of heart disease [55]. In their work, three different feature selection algorithms are deployed which are combined with several classifiers. Their proposed technique efficiently classifies healthy and unhealthy patients. Similarly, hybrid machine learning models are used in the work of Mohan et al. for the prediction of cardiovascular disease [56]. A linear model was coined with a hybrid random forest referred to as HRFLM which shows a performance of 88.7%. Moreover, the classification of heart disease using features engineering techniques with the input of ECG signals is also exploited by a different group of researchers. These techniques are mainly divided into feature extraction of signals followed by the classification process. The most commonly used feature extraction techniques include the RR intervals [57], segmentation of ECG curves [58], samples, signal energy, wavelet coefficients, and high-order statistics. For this type of method, the effectiveness and correlation of features are very important. To remove noise, several techniques are adopted such as the weighted LD model [59] and floating sequential search. Afterward, several classifiers are used to classify the signals such as SVM, Artificial Neural Networks (ANN), and K-nearest neighbor (KNN). For example, Acharya et al. proposed a traditional machine-learning-based computer-aided diagnosis (CAD) system for ECG signals classification [60]. In their work, ECG is classified into four different classes by first extracting the feature vectors of signals using entropy. Sufi et al. diagnose cardiac abnormalities with the help of a rule-based system and attained 97% accuracy [61]. The approach of independent component analysis (ICA) was adopted by Martis et al. to classify ECG signals into three different classes which include normal, atrial flutter, and atrial fibrillation [62]. Varatharajan et al. presented the approach of classifying ECG signals in cloud computing by using enhanced SVM combined with Linear Discriminant Analysis (LDA) [63]. Yeh et al. diagnosed cardiac arrhythmia by analyzing the ECG signals using the method of cluster analysis (CA) [64]. This method accurately classifies the beats into normal and abnormal classes. Li et al. used the random forest and wavelet packet entropy (WPE) to perform the classification of ECG signals followed by the Association for the Advancement of Medical Instrumentation (AAMI) recommendations and the scheme of inter patients [65]. de Albuquerque et al. proposed the automated approach for the detection of arrhythmia using the Optimum-Path Forest (OPF) classifier [66]. Pławiak proposed innovative research in which cardiac disorders are classified into 17 different classes based on the analysis of ECG signals as an evolutionary-neural system [67]. In general, these traditional methods show very effective results in classifying the ECG signals of the known database, but their performance suddenly drops when appearing in new data due to poor generalization. They also exhibit overfitting issues on new data. Thus, these methods are unreliable and not applicable to real-world IoT systems.
Moreover, the classification of heart disease based on ECG signals using deep learning techniques is also employed. In such techniques, the data of ECG signals is given as input to a deep learning-based framework. These methods exclude the overhead of signal preprocessing and feature extraction and selection. The deep learning approaches are given preference over traditional machine learning approaches, especially for the interpretation of medical imaging-related problems. Convolutional Neural networks (CNN) are noise-insensitive, and if the ECG signal is noisy, and are also capable of extracting relevant information from the noisy signal [68]. The performance of CNNs is greatly dependent upon the layer-by-layer architecture and hyper-parameters configurations. For example, an 11-layer deep architecture is proposed by Acharya et al. to classify the ECG segments of duration 2 to 5 s [26]. These ECG signals belong to four different types of classes of heart disease. They attained an accuracy of 98.09%.
In some recent works, Yildirim used the deep bidirectional LSTM model along with wavelet sequence (DBLSTM-WS) to classify the ECG signals into five different classes [69]. In their work, they claimed that the improvement in the performance of ECG signals is due to the wavelet sequence. The pathologies present in 12-lead ECG signals are detected by Mostayed et al. with the help of the recurrent neural networks (RNN) network which is comprised of two bi-directional LSTM layers [70]. A classification algorithm based on specific ECG was proposed by Zhang et al. by using RNN [71]. This algorithm learns the correlation of time from the samples of ECG signals having different heart rates. Similarly, Kiranyaz et al. utilized the approach of 1D CNNs to classify ECG signals in real-time which are patient-specific [72]. Li et al. classified the ECG signals into five types using 1D CNN [73]. These classes are ventricular premature contraction, normal, right bundle branch block, atrial premature contraction, and left bundle branch block. Yin et al. integrated the Impulse Radio Ultra-Wideband (IR-UWB) radar with the monitoring system of ECG by using CNN [74]. Jun et al. proposed the 2D CNN for the classification of arrhythmia ECG and reported outstanding results in the pattern recognition field [75]. Salem et al. utilized the technique of transfer learning by using 2D-CNN to classify ECG patterns into four distinct classes [76]. Jabeen et al. [77] proposed an IoT-based automated recommender system for cardiovascular disease and achieve 98% results. Çınar et al. [78] suggested the LSTM and hybrid CNN-SVM-based model to perform the classification of heartbeats for the early detection of congestive heart failure. In their work, ECG signals are represented in the form of spectrogram images and have achieved 96.77% accuracy. Similarly, Li et al. [79] performed the ECG beats classification by employing the deep residual network (ResNet) with 1D-convolutional layers. In their work, five different types of heartbeats are classified with an average accuracy of 99.38%. Radhakrishnan et al. [80] proposed the automated method for the detection of AF which is the most common kind of cardiac arrhythmia. In addition, El Bouny et al. [47] designed the framework in which discriminative heartbeat features are extracted using SWT. Later, CNN is used in conjunction with SWT to perform the classification. It is observed that in most of the recent works, deep neural networks are the most used approach for ECG signals analysis to perform heart disease diagnosis.
However, these approaches are not only widely used in heart disease; they are also widely used in other diseases, such as COVID-19, which is the most common disease at the present time [81]. Continuing to expand on established approaches, this research study presents a new technique for classifying ECG signals which considers two different types of information that ECG carries and fused them into a single model. The model learns both types of information simultaneously along with the more responsive method of downscaling of features i-e generalized gated pool along with powerful GELU units to bring non-linearity.
In this section, we describe the data and materials used in the research and proposed methodology to classify the ECG data. The section begins by discussing ECG data preparation, followed by the suggested technique for classifying ECG signals. The ECG signals from different IoT devices are given as input to the framework whose outputs are predictions regarding the signals as abnormal or normal. The internal architecture of the proposed work is given in Fig. 3.
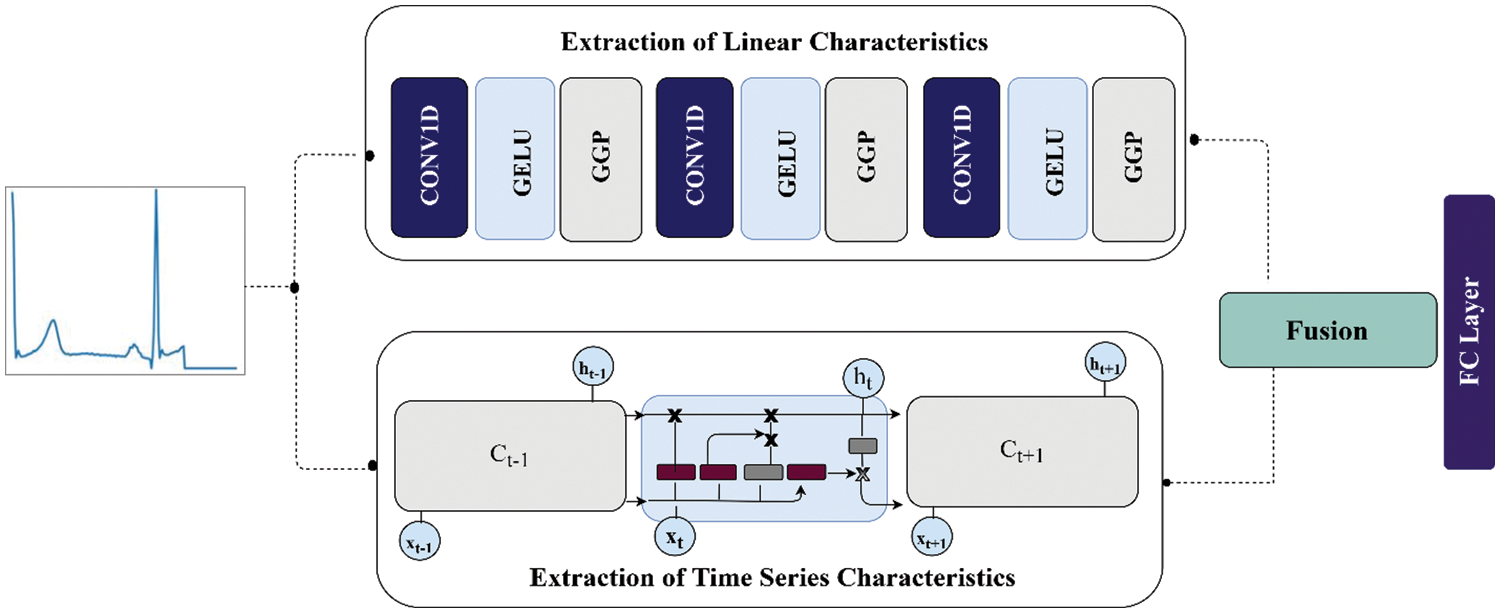
Figure 3: The internal architecture of the proposed work
3.1 Preprocessing of ECG Signals
The ECG signals are given as input to the IoT-based heart disease prediction framework. The simple and effective method for extracting beats includes seven different steps [82]. First, the continuous ECG signals are divided into the window of 10 s. In the range between 0 and 1, all the amplitudes of ECG signals are normalized. Afterward, based on the methods of zero crossings of the first derivative, the local maximums set is derived. Then the candidate set of ECG-R peaks is found by applying a 0.9 threshold on local maximums which are normalized in the previous step.
The median of RR intervals of time is computed with the help of the nominal heartbeat of the window (W). The signal length of 1.2 W is chosen for each R-Peak. In the end, all the records are padded with the help of inserting zeros to a specified fixed dimension. With different morphologies, this preprocessing is effective and simple in the extraction of RR intervals. Additionally, the lengths of all beats that are extracted are identical. These same length beats are essential to give as an input to all further parts of processing. The description of data in the form of attributes, classes, total instances, and per-class instances is given in Table 1 for both datasets. As we see that the number of instances in some classes for both databases is unbalanced. So, to resolve the data misbalancing, the SMOTE oversampling is used over those classes.

Synthetic Minority Oversampling Technique (SMOTE) is one of the most popular oversampling techniques to solve the issues of an imbalanced dataset [83–87]. With the help of this technique, the minority class is oversampled to create a balanced dataset. It uses the intuition of K-nearest neighbors and creates several synthetic examples in the direction of nearest neighbors. The oversampling ratio is determined by the number of nearest neighbors considered. In the first step, the difference between the nearest neighbors of the underlying instance is taken. Afterward, a random number between 0 and 1 is used to multiply with this difference and the resultant value is added to the underlying instance. Between two particular features, this operation causes random point selection along the segment of the line. This technique significantly forces the decision boundaries of minority classes in the dataset to become more general. Here in the study, we applied SMOTE oversampling over both datasets. This sampling efficiently overcomes the problem of data misbalancing.
3.3 Linear Characteristics of ECG Signals
To extract the linear characteristics of ECG signals, we have used CNN which is the most used type of artificial neural network as shown in Fig. 3. They were commonly applied to the interpretation of visual imagery data with feed-forward connections [88]. They were developed originally in the early 90s by LeCun [89]. In general, CNN consists of several layers such as convolution layers along with their weights, pooling, and fully connected layers. These layers incorporate the rotational and translational invariance along with compositionality to the learning model.
For each sub-region of the input vector, this layer computes the dot product with the help of the kernel matrix along with the additional bias term. After that, the input feature vectors are passed through the non-linear activation function and then passed the resultant feature vectors to the subsequent layers.
Consider the input of the vector of ECG beats
In the above Eq. (1), the I represents the index of the layer, the non-linear activation function is denoted by h, while the bias term is represented by symbol b and the total size of the filter is M. The weight for the feature vector j is denoted by

Figure 4: 1D convolution operation on ECG beat
3.3.2 Gaussian Error Linear Units
The Gaussian Error Linear unit (GELu) is used during the extraction of linear characteristics to bring the non-linearity [48]. A GELu is mathematically described in Eq. (2):
Moreover, the approximation of GELU is done by Eq. (3):
Or
In GELu, the error function is used to compute the cumulative distribution function of a Gaussian. This expression indicates the scaling of x by the amount of time it is greater than other inputs. For stochastic regularizer, the non-linearity is the transformation that is expected on the input x, which is
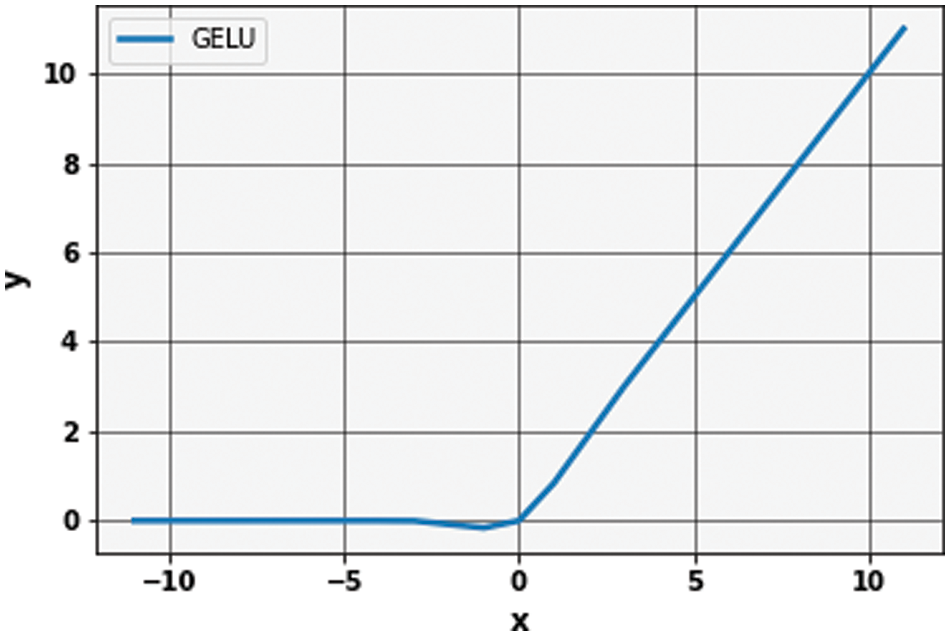
Figure 5: Graph of Gaussian error linear unit (GeLu)
3.3.3 Generalized Gated Pooling
The second name for the max-pool layer is the subsampling layer. This operation is usually followed to reduce the size of feature vectors. This layer’s input consists of small regions from which it generates a single output. This singular output can be computed in several ways. Here in this study, we use the more generalized form of pooling known as “Generalized Gated pooling” [90].
Consider the feature vector of ECG beats
In gate pooling, a dot product is taken among the region of the ECG feature vector that is being pooled and the gating mask. Both the gating mask and the region being pooled have the same dimensions. The resultant scalar value which resulted from this dot product is passed through the sigmoid to yield the mixing proportion. The features which are present in the ECG beat vector are operated with adaptation with this mixing proportion. Usually, in the case of max-pooling only maximum activations are picked up while in average pooling, the minimum activations slow down the impact of maximum activations. To overcome both issues, this pooling method is more suitable to select more prominent and significant values from a given feature vector. Fig. 6 shows the generalized Gated pooling pictorially.

Figure 6: A generalized gated pooling
3.4 Time Series Characteristics of ECG Signals
The time-series information of ECG signals is extracted by Vanilla LSTM cells. Generally, RNNs are an important sub-field of deep learning algorithms. It is widely used in time series and sequence data. RNN models come in a variety of variants, including LSTM, Bi-directional LSTM (Bi-LSTM), and Gated Recurrent Unit (GRU). The main limitations of RNNs include that they are not capable of storing large sequence information. To overcome this issue, the LSTM and Echo State Networks are introduced by researchers. The use of a memory cell is the central idea behind the architecture of LSTM. The state over time and non-linear units of gating are maintained by this memory cell. However, the original LSTM architecture was first proposed in 1997 by Hochreiter et al. [91]. This LSTM overcomes the problem of error backflow. In addition, although the input sequences are noisy, this is adapted to bridge time gaps of more than 1000 steps. On the other hand, these original LSTM architectures have no forgot gate and did not perform well on some tasks. Later on, the LSTM architectures proposed by Graves et al. are the most commonly used and referred to as Vanilla LSTM by people [92]. They will perform well on continual tasks due to the incorporation of forgot gates and during training, they will use full gradients. The main architecture of vanilla LSTM includes the input, forgot, and output gates. The decision-making in the cell about information thrown is done by forgot gate. Mathematically, forgot gate is described in Eqs. (6) and (7):
In the above equations, the output of forgot gate is represented by
In the above equations, the input and recurrent weights along with bias terms are (
Finally, the output cell decides which part of the information is passed as an output. Ultimately, at times t, the
In the above equations, the weights and bias of the output gate are denoted as
In the proposed research study, two different deep learning models are employed to extract information from ECG signals as shown in Fig. 3. The non-linear characteristics of the ECG beats are extracted by layers of CNN, while on the other hand, the time-series information in beats is extracted by vanilla LSTM. During linear learning of features of ECG signals, generalized gated pooling layers are deployed as shown in Fig. 6. More specifically, this input of ECG signal is fed into two separate models in parallel form. The total dimension of the ECG signals is a fixed size of 188 and 187 in both datasets. The ECG signals are passed to the first 1D convolution layer having a kernel size of 3 * 3 with 16 filters. Afterward, the GELu layer is deployed to bring non-linearity to the model. So, similarly, the output produced from GELu is given as an input to generalized gated pooling to reduce the dimensions of the input using a mixing operation with a selection of responsive features. Similarly, the output from generalized gated pooling is given to the second one-dimensional convolution layer of kernel size 3 * 3 and 32 filters. The features produced from this layer are given as an input to GELu followed by generalized gated pooling. In generalized mixed pooling, the pool size of
In the above equations, the symbols


In this section, we describe the data and results of the proposed framework along with the criteria for evaluation.
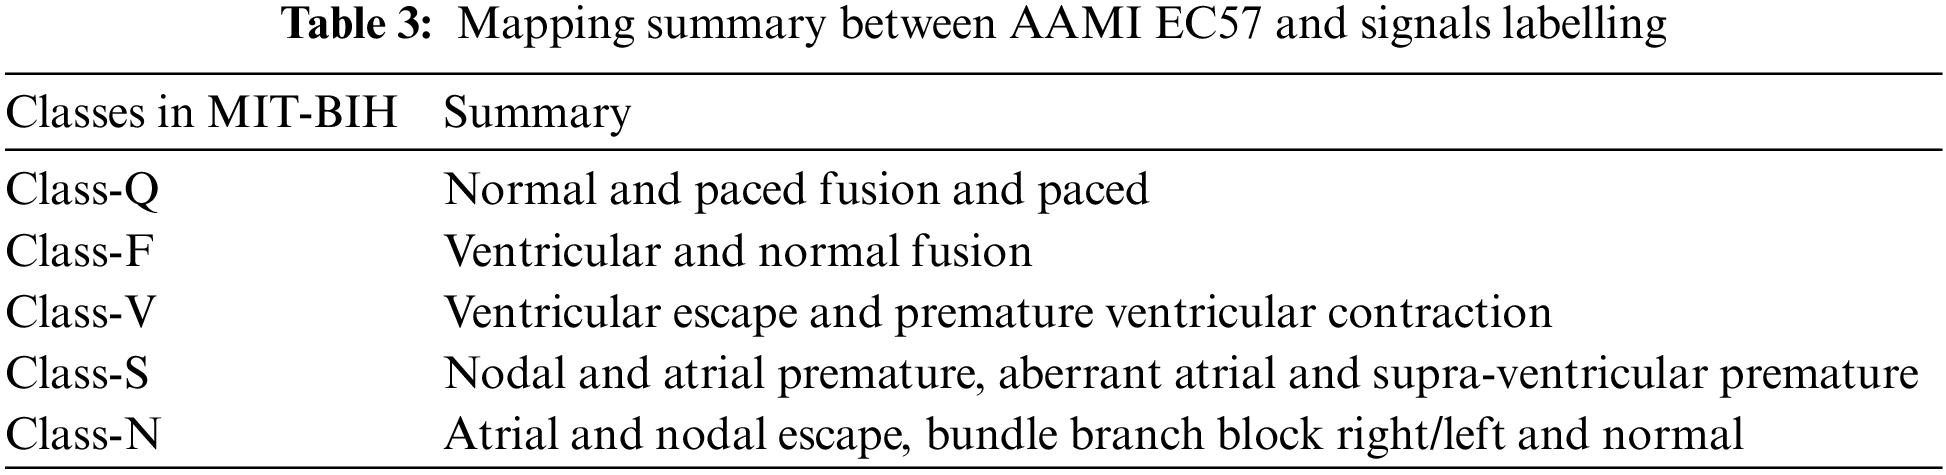
In this research study, the ECG signals and their corresponding annotation files are taken from public databases of PhysioNet. The first dataset is the MIT-BIH arrhythmia database (MITDB) which consists of six different classes of ECG signals from 47 subjects. The ECG recordings in this database are ambulatory and 48 half-hour excerpts of two-channel. The 360 samples per second and per channel are used to digitize each recording. Over a 10 mV range, the resolution is set to 11-bit. All the recordings are annotated by two or more expert cardiologists. In this dataset, all the five categories of beats annotation are according to the Association for the AAMI EC57 standard as shown in Table 3.
The second database that is used is the PTB. The ECG recording in this dataset is taken from a non-commercial prototype recorder with 16 input channels. The resolution, input voltage, and input resistance are set to 16-bit, ±16 mV, and 100 ohm, respectively. This database consists of the data of 290 subjects from age group 17 to 87 with a total of 549 records. There is a total of nine classes present in the dataset out of which one is a normal class. All other eight classes belong to different types of heart disorders which include Myocardial infarction, Dysrhythmia, Myocardial hypertrophy, Valvular heart disease, Bundle branch block, Cardiomyopathy/Heart failure, Myocarditis, and Miscellaneous. Here we are using the segmented and preprocessed form of ECG data of both datasets publicly available on Kaggle [93]. The details of those preprocessing steps on signals are described in Section 3.1.
The evaluation criteria used in the simulation include accuracy, recall, precision, and F-1 score. All these are described below in detail.
This measures the total number of classes that are predicted correctly by the underlying model out of all the classes [45,94,95]. Generally, it determines that out of all patients that are under-tested have a chance of heart disease and those who have not. The value of accuracy is high for the models which are better. The equation for computing the accuracy is given below:
This measures the ratio of true positives among all positive cases. In the case of heart disease, it is a measure of the model of correctly identifying those persons who have heart disease. Mathematically, it is defined as in Eq. (19):
The recall measures how our model accurately identifies the total heart patients from the overall relevant data. The mathematical equation is given in Eq. (20):
This measures the overall accuracy of the model by combining both precision and recall metrics. It can be computed by Eq. (21):
In the above Eqs. (18)–(21), “TN” denotes True negative, “TP” denotes true positive, “FP” denotes false positive, and “FN” denotes false negative.
4.3 Results on MIT-BIH Arrhythmia Database
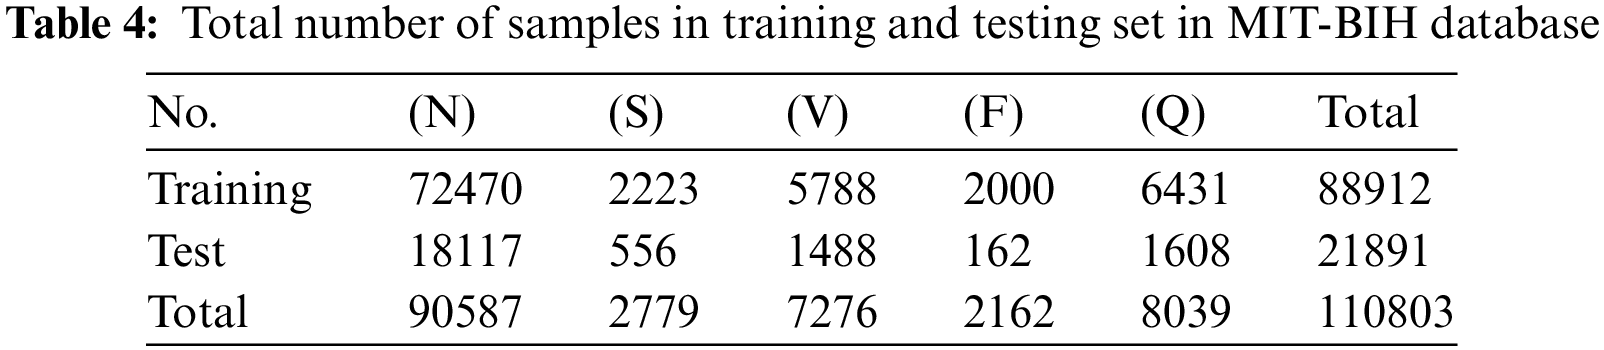
To evaluate the performance of the proposed framework we first evaluate it on the MIT-BIH Database. As mentioned before the total number of instances per class in this database is highly imbalanced. We will apply the SMOTE oversampling technique over minority classes to create a balanced dataset for training. The training and test sets are formed by an 80-20 split ratio of division. After division, the total number of training and testing instances per class is shown in Table 4. Following on, the training data of ECG signals is given as input to the proposed framework. The framework first extracts the linear characteristics of ECG beats which are further refined by Generalized Gated pooling. On the other hand, the time series information is also extracted from the ECG signals concurrently in the same model. Each piece of information is fused and passed to fully connected layers for classification. The class-wise performance of the MITBIH arrhythmia database is also given in Table 5. The model performs excellently on all classes present in the dataset. The precision in classes N, S, V, and F reaches above 90. Similarly, the recall of all classes and F-1 scores of all classes also achieved a good score. Similarly, the class-wise performance without any SMOTE technique is also given in Table 6. Furthermore, the combined results of the MIT-DB dataset on the test set are given in Table 7. As shown in Table 7, the proposed framework achieves the value of accuracy of 98.38%. Moreover, the other evaluation metrics which include precision, recall, and F-1 score in this experiment are 92%, 91%, and 91%, respectively.


It is observed that without SMOTE sampling the results are less as compared to the experiment with SMOTE oversampling. More specifically, as shown in Tables 5 and 6, the precision values for class S are improved by 6% after SMOTE. Similarly, in class F there is an improvement of 9% in precision after applying the SMOTE. On the other hand, we have also plotted the confusion matrices of these experiments (with and without oversampling) which are shown in Fig. 7. These matrices provide the overall summary of model prediction among each class present in the dataset. It is observed from the results that the proposed framework shows good performance in classifying the ECG signals into five different classes.
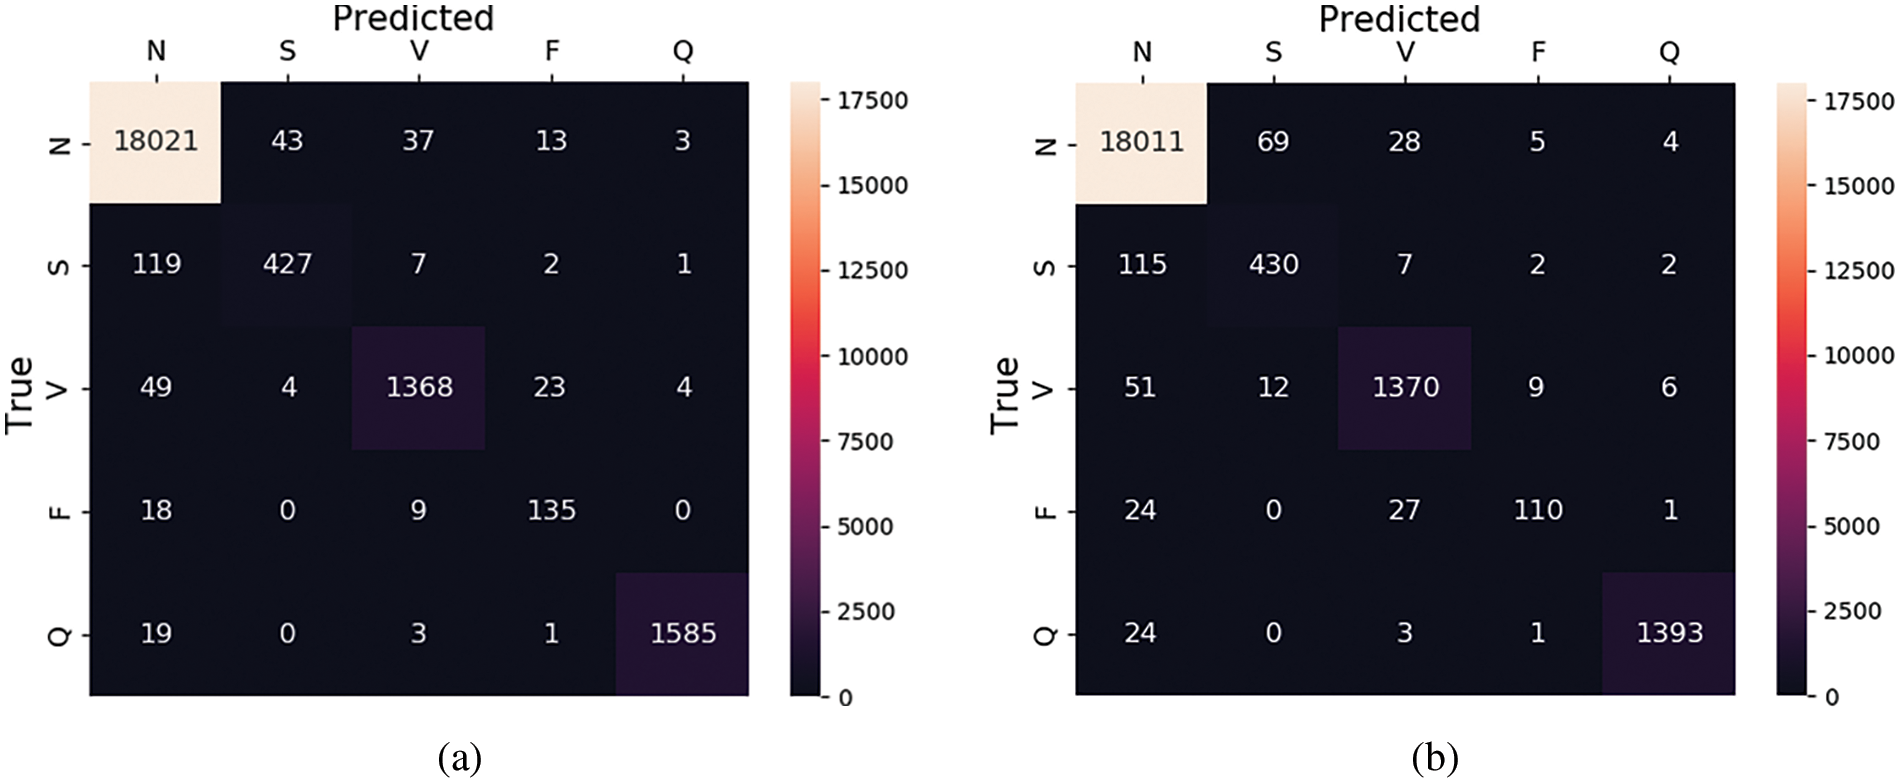
Figure 7: Confusion matrix for MIT-BIH database (a) with SMOTE and (b) without SMOTE
The main reason behind the good results is the effective learning of the characteristics of ECG signals. The fusion of two different types of information lifts the results. A high-performance unit named GELU brings effective non-linearity to the model. Moreover, the responsiveness nature of generalized gated pooling due to mixing operation selects more prominent features of ECG beats during linear learning. It is also necessary to mention here that our model has overall fewer parameters, which makes the network easier to train and more suitable in the environment of IoT-based remote systems. Moreover, during training of the proposed framework, the training history in the form of loss and accuracy is also recorded. The plots of training loss and accuracy are shown in Fig. 8. The x-axis represents the total number of epochs for which the model runs, and the y-axis represents the loss and accuracy values.

Figure 8: (a) Loss and (b) accuracy graph of MIT_BIH and PTB dataset during training
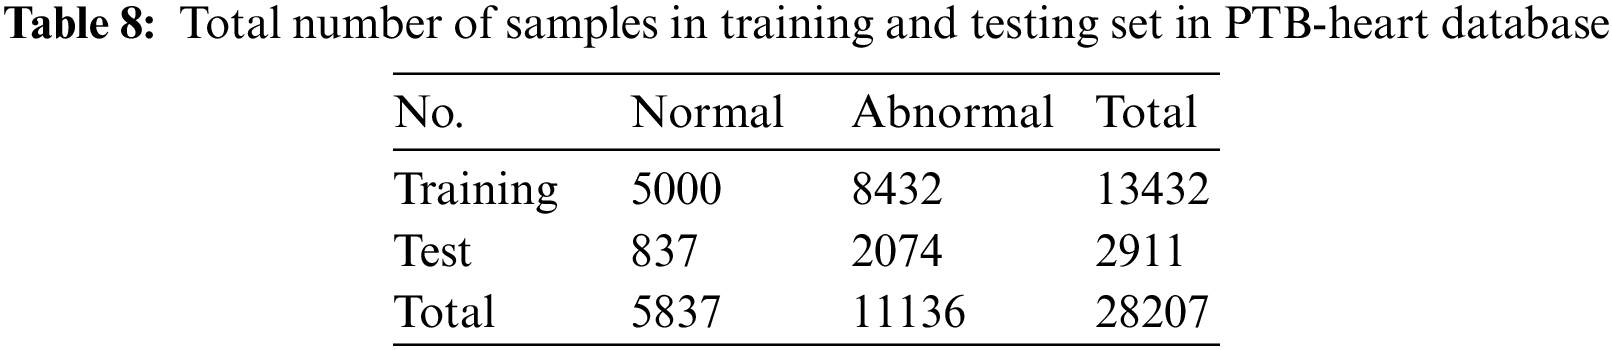
In the second phase of our evaluation, we evaluated the performance of the proposed framework on the PTB-Heart database. This dataset also suffers from high misbalancing in the data. The same technique of SMOTE oversampling is applied to this dataset to avoid misbalancing in the train set. The total number of training and testing instances for each class is shown in Table 8.
Moreover, all the other hyperparameters of the model remain the same in this experiment as in the first experiment. As this is a binary classification problem, so we replace the loss function at the last layer with the “binary_cross entropy” loss function, and on the classification layer, sigmoid activation is applied which is suitable for binary classification problems. As done previously, the ECG beats present in this dataset are also passed as input to the proposed model. The model performs a fusion of both linear and time series characteristics extracted by two different architectures simultaneously with feature reduction using generalized gated pooling. After training, the model can classify the signals present in the test set into two classes which are normal and abnormal. The results in the form of evaluation scores are shown in Table 7 while the class-wise performance of this dataset in terms of accuracy, precision, and recall is shown in Table 9. In this dataset, the proposed framework achieves a 100% value of accuracy along with a precision of 100%. The recall and F-1 score achieved by the model are also 100%. This dataset contains only the two classes of ECG signals which are easier to train with good prediction performances. It is observed that performance drops when the number of ECG signal classes is increased as presented in the previous experiment. After training, the model can classify the signals present in the test set into two classes which are normal and abnormal. The results in the form of evaluation scores are shown in Table 7 while the class-wise performance of this dataset in terms of accuracy, precision, and recall is shown in Table 9. In this dataset, the proposed framework achieves a 100% value of accuracy along with a precision of 100%. The recall and F-1 score achieved by the model are also 100%. This dataset contains only the two classes of ECG signals which are easier to train with good prediction performances. It is observed that performance drops when the number of ECG signal classes is increased as presented in the previous experiment Moreover, the accuracy and loss graphs for the proposed model during training for this experiment are also plotted and shown in Fig. 8.

The results from these experiments also reveal that the proposed framework performs excellently in diagnosing heart disease from ECG signals. The summary of predictions for this experiment in the form of confusion matrices for both with and without oversampling are shown in Fig. 9, respectively. Furthermore, we have also plotted the Receiver operating curves (ROC) for both of our experiments which are shown in Fig. 10. At the various thresholds, it is a probability curve that plots the True positive rate (TPR) against the false positive rate (FPR). Usually, the ROC curves are generally used for binary class problems, but they can also be extended to multi-class problems. To plot ROC curves for the MIT-BIH database which consists of multiple classes we have used the one-vs.-Rest technique. This technique turns the multi-class problem into a binary class. As in the MIT-BIH dataset, there are five classes, so we have plotted the ROC curves for every class label as “N”, “S”,” V”,” F”, and “Q” vs. rest.
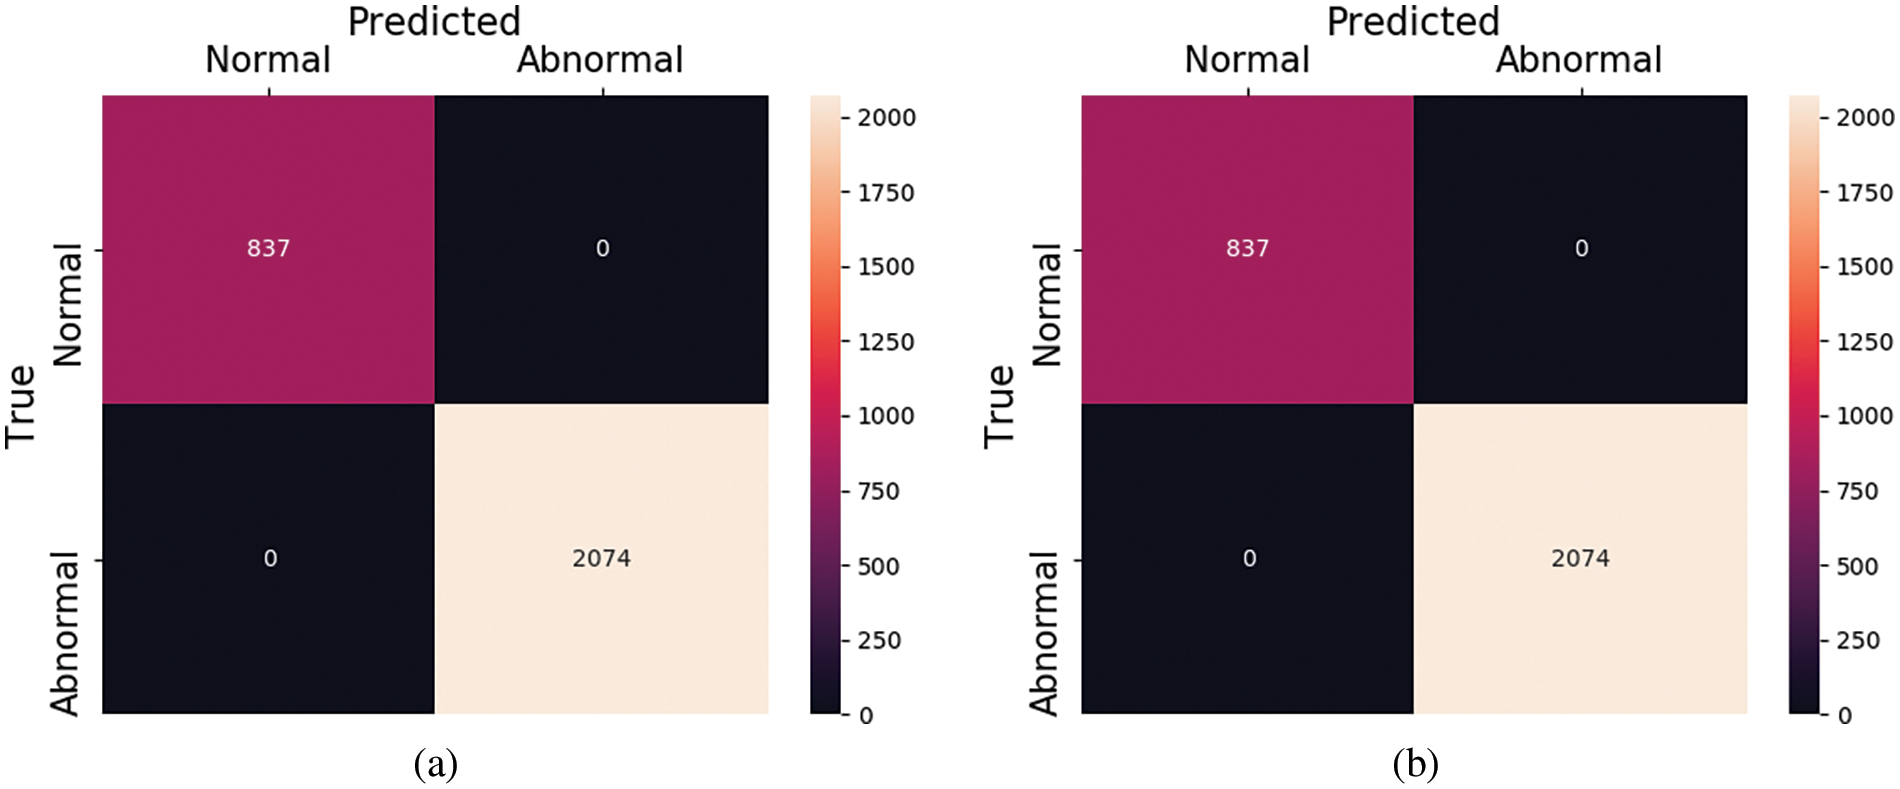
Figure 9: Confusion matrix for PTB dataset (a) with and (b) without SMOTE

Figure 10: ROC curves for (a) PTB and (b) MIT_BIH dataset
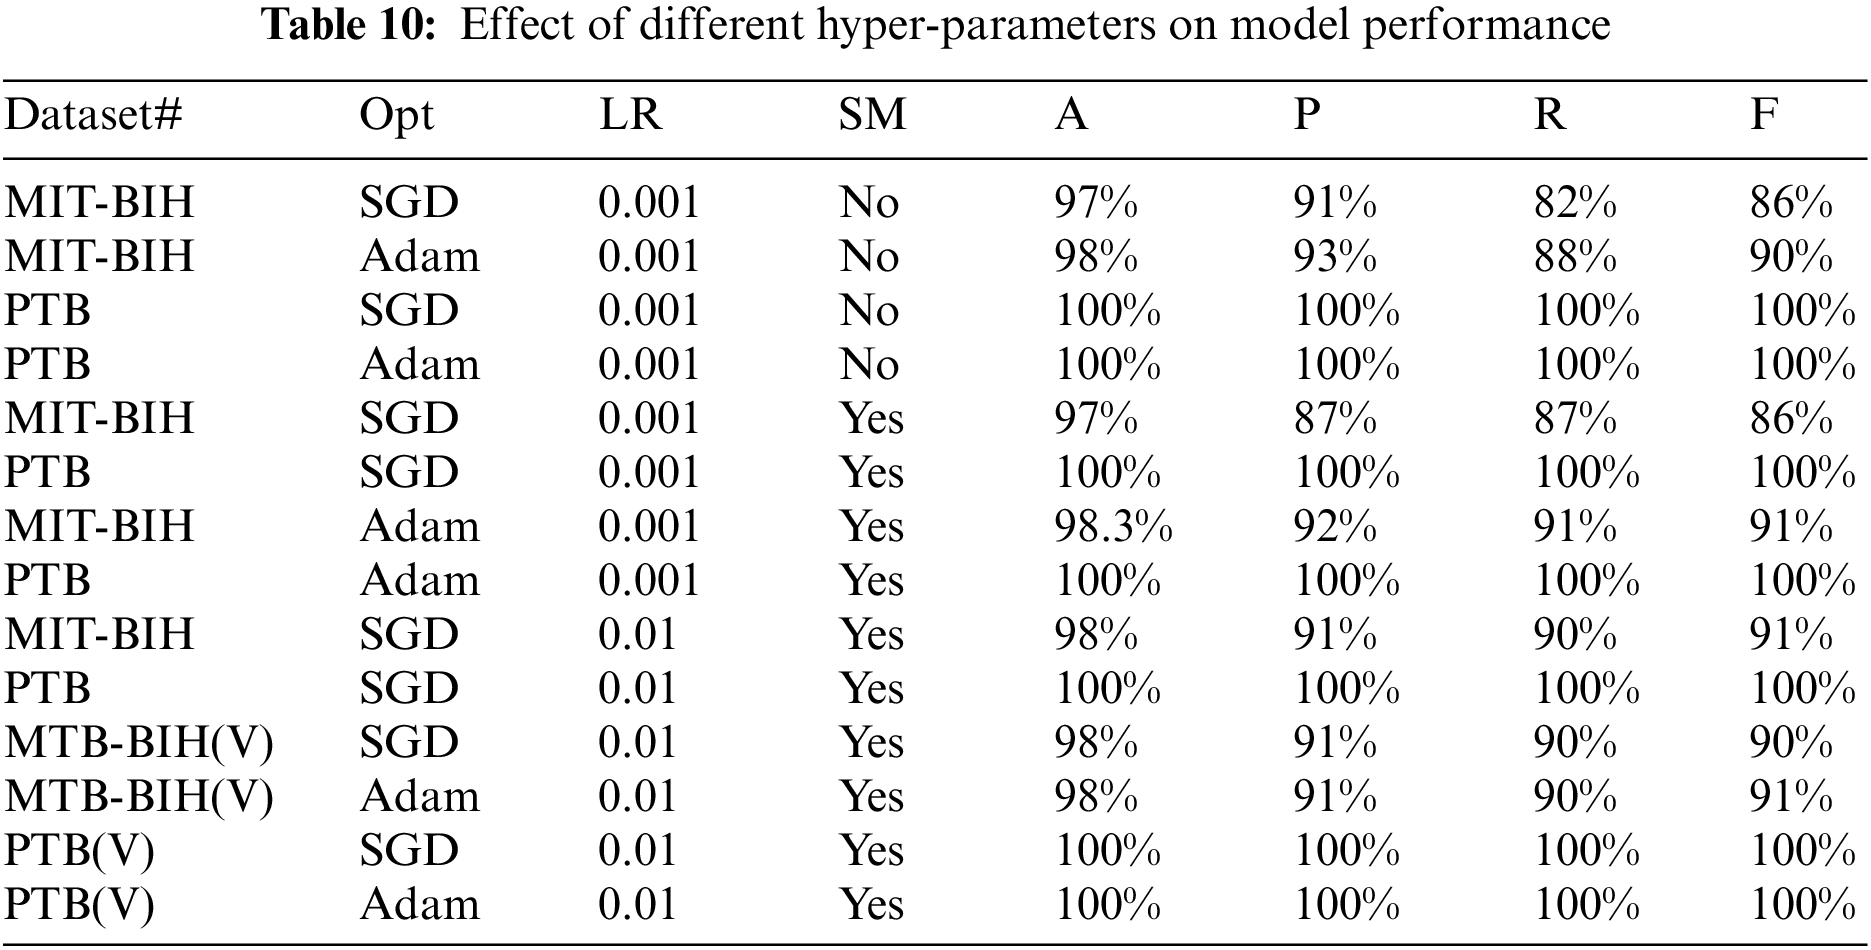
Moreover, for both datasets, we have also performed a different set of experiments with different hyper-parameters which includes the weight optimizers, oversampling and learning rates, etc. The effect of the validation set on both datasets is also taken into account and experiments are performed against them. These hyper-parameters play a very important role in the performance results of deep learning models. Table 10 shows the results in terms of precision, recall, and accuracy for both databases. The symbols ‘Opt” represents the optimizer used, ‘LR’ represent the learning rate, MIT-BIH (V) represents the experiment on the MIT-BIH database with the validation set, PTB(V) represents the experiment on the PTB database with the validation set, ‘SM’ represents the oversampling, and accuracy, recall, precision, and F-1 score are denoted by A, P, R, and F, respectively.
4.5 Comparison with Existing Studies
In the previous section, we have described our detailed results for both of our datasets. Here we compare our results with existing methods. The existing approaches follow several techniques and methods to perform the classification of heart disease. Table 11 shows the comparison with existing methods in terms of accuracy. In Table 11, Kallas et al. used traditional machine learning methods to classify the ECG signal [96]. For feature extraction, they use the Kernel Principal Component Analysis (KPCA) followed by an SVM algorithm to classify the abnormalities present in the ECG signals. They achieved an accuracy of 97.34%. The authors, however, do not disclose the other metric, which includes sensitivity, specificity, and F-1 score. Dutta et al. used the cross-correlation approach along with SVM to classify the ECG signals [97]. In this approach, the information about cross-spectral density in the frequency domain is more useful for feature extraction. Their method achieves an accuracy of 95.82% along with average sensitivity of 89.81%. Melgani et al. also used the traditional approach for the classification of ECG beats [98]. In their work, the SVM generalization is achieved with the help of the optimization algorithm namely Particle swarm optimization (PSO).
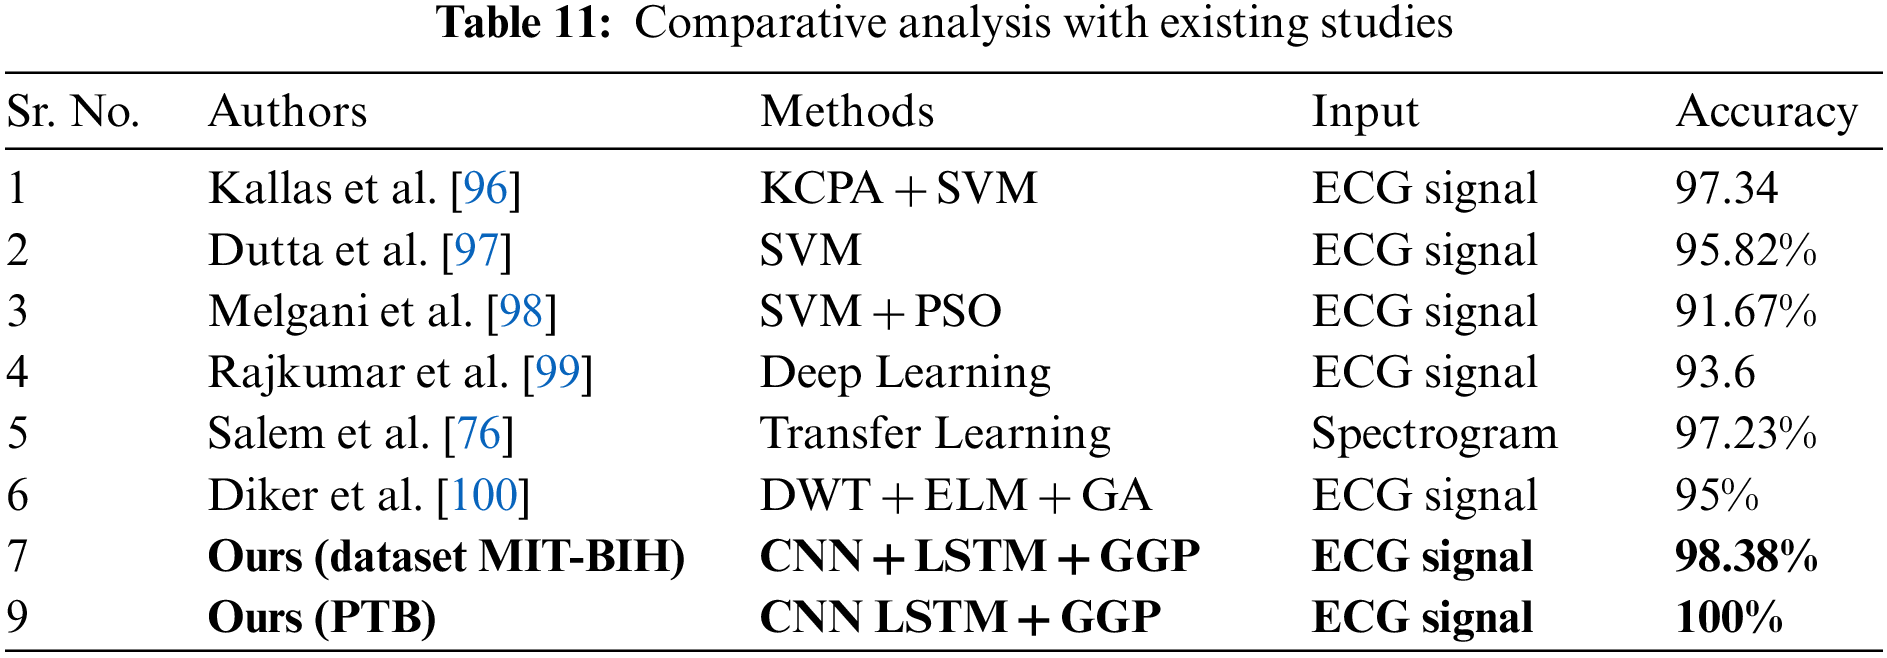
The PSO searches for the best set of parameters for the SVM. They also classify the signals into five different classes and achieve an accuracy of 91.67%. Rajkumar et al. used deep learning techniques to classify the ECG signals [99].
They performed the experiments with various activation functions in their model and achieved 93.6% accuracy. Salem et al. used the 2D dimensional CNN to classify the ECG signals [76]. They turned the ECG signals into spectrogram representations and later by using transfer learning with DenseNet all the spectrograms representation of ECG signals are classified. Diker et al. used the Pan-Tompkins algorithm along with discrete wavelet transform to extract the features of ECG beats [100]. For the classification, an Extreme learning machine along with a Genetic algorithm for hyper-parameter optimization is used. In their work, a performance accuracy of 95% is attained. All the previous researchers achieved the best scores in classifying ECG signals using different algorithms and techniques, here we also classify the ECG signal and achieved improvement over existing methods in terms of scores. Moreover, it is crucial to discuss the limitations to assist in paving the way for future research. Hence, one possible limitation of this work is that it deals with few abnormalities of heart disease including Myocardial infarction, Dysrhythmia, Myocardial hypertrophy, Valvular heart disease, Bundle branch block, Cardiomyopathy/Heart failure, Myocarditis, and Miscellaneous. However, what if the underlying patient is suffering from another condition? To further extend this work, one possible future direction is to consider more classes or abnormalities. Secondly, the proposed work deals with only ECG features; nevertheless, other clinical features such as patient blood pressure, cholesterol level, etc. can be included to diagnose the disease more accurately. As a future work, segmentation of coronary arteries in the computer vision domain using deep learning models can also be integrated with ECG-based diagnosis modules to further improve and increase the system’s confidence in diagnosing the disease at remote locations.
For all types of chronic diseases, IoT-based systems work efficiently in the healthcare industry. The instant intervention of these healthcare monitoring systems can save many lives, especially for those people who live in remote areas and are unable to avail of medical facilities. It is very challenging to predict the survivability of heart disease. Several researchers proposed different techniques to diagnose heart disease. In this paper, we present the automated IoT-based healthcare system for the diagnosis of heart disease. The proposed framework is given with the input of ECG signals to diagnose the disease. The framework fuses both linear and time series characteristics concurrently. During linear learning of ECG signals, the dimension reduction is performed with a more advanced form of pooling called generalized gated pooling. This pooling selects more responsive features from beats feature vectors that are being pooled with the help of a mixing operation. Moreover, to elevate the performance GeLu is deployed to achieve non-linearity. Besides this, the oversampling of training samples is also performed with the help of SMOTE technique to avoid class misbalancing. We have evaluated the proposed framework on two different ECG databases and attained a good performance with an average accuracy of 99.14% along with a 95% recall value, respectively. In the future, we will examine the performance of the proposed framework on a wider range of ECG datasets.
Acknowledgement: This research was supported by the MSIT (Ministry of Science and ICT), Korea, under the ITRC (Information Technology Research Center) Support Program (IITP-2023-2018-0-01799) supervised by the IITP (Institute for Information & Communications Technology Planning & Evaluation) and also the National Research Foundation of Korea (NRF) grant funded by the Korea government (MSIT) (No. 2022R1F1A1063134).
Funding Statement: This research was supported by the MSIT (Ministry of Science and ICT), Korea, under the ITRC (Information Technology Research Center) Support Program (IITP-2023-2018-0-01799) supervised by the IITP (Institute for Information & Communications Technology Planning & Evaluation) and also the National Research Foundation of Korea (NRF) grant funded by the Korea government (MSIT) (No. 2022R1F1A1063134).
Author Contributions: The authors confirm contribution to the paper as follows: study conception and design: M.B, S.Y; data collection: M.B; analysis and interpretation of results: S.N, M.Y.D, M.J; draft manuscript preparation: M.B, J.M, S.R. All authors reviewed the results and approved the final version of the manuscript.
Availability of Data and Materials: Data available on request from the authors. The data that support the findings of this study are available from the corresponding author [Seungmin Rho], upon reasonable request.
Conflicts of Interest: The authors declare that they have no conflicts of interest to report regarding the present study.
References
1. P. K. Gupta, B. T. Maharaj and R. Malekian, “A novel and secure IoT based cloud centric architecture to perform predictive analysis of users activities in sustainable health centres,” Multimedia Tools and Applications, vol. 76, pp. 18489–18512, 2017. [Google Scholar]
2. A. M. Rahmani, T. N. Gia, B. Negash, A. Anzanpour, I. Azimi et al., “Exploiting smart e-health gateways at the edge of healthcare Internet-of-Things: A fog computing approach,” Future Generation Computer Systems, vol. 78, no. 2, pp. 641–658, 2018. [Google Scholar]
3. L. M. Dang, M. Piran, D. Han, K. Min and H. Moon, “A survey on Internet of Things and cloud computing for healthcare,” Electronics, vol. 8, no. 7, pp. 768, 2019. [Google Scholar]
4. N. Scarpato, A. Pieroni, L. di Nunzio and F. Fallucchi, “E-health-IoT universe: A review,” Management, vol. 21, no. 6, pp. 46, 2017. [Google Scholar]
5. M. Momin, N. S. Bhagwat, S. Chavhate, A. V. Dhiwar and N. Devekar, “Smart body monitoring system using IoT and machine learning,” International Journal of Advanced Research in Electrical, Electronics and Instrumentation Engineering, vol. 8, no. 5, pp. 1501–1506, 2019. [Google Scholar]
6. B. Aieshwarya, C. ChavanPatil and S. Sonawane, “To predict heart disease risk and medications using data mining techniques with an IoT based monitoring system for post operative heart disease patients,” International Journal on Emerging Trends in Technology, vol. 1, no. 2, pp. 8274–8281, 2017. [Google Scholar]
7. A. B. C. Patil, “An IoT based health care and patient monitoring system to predict medical treatment using data mining techniques: Survey,” International Journal of Advanced Research in Computer and Communication Engineering, vol. 6, no. 3, pp. 24–26, 2017. [Google Scholar]
8. Z. Nayeemuddin, K. Reddy and P. Prasad, “IoT based real time health care monitoring system using LabVIEW,” International Journal of Recent Technology and Engineering (IJRTE), vol. 8, no. IS4, pp. 1–5, 2019. [Google Scholar]
9. M. A. Malik, “Internet of Things healthcare market, allied market research,” 2016. [Online]. Available: https://www.alliedmarketresearch.com/iot-healthcare-marketLast [Google Scholar]
10. A. Sidheeque, A. Kumar, R. Balamurugan, K. Deepak and K. Sathish, “Heartbeat sensing and heart attack detection using Internet of Things: IoT,” International Research Journal of Engineering and Technology (IRJET), vol. 7, no. 3, pp. 6662–6666, 2017. [Google Scholar]
11. S. Chandurkar, S. Arote, S. Chaudhari and V. Kakade, “The system for early detection of heart-attack,” International Journal of Computer Applications, vol. 182, no. 27, pp. 30–33, 2018. [Google Scholar]
12. P. Kalyan and G. S. Sharma, “IOT based heart function monitoring and heart disease prediction system,” International Journal for Science and Advance Research in Technology (IJSART), vol. 3, no. 12, pp. 12, 2017. [Google Scholar]
13. A. Rosiek and K. Leksowski, “The risk factors and prevention of cardiovascular disease: The importance of electrocardiogram in the diagnosis and treatment of acute coronary syndrome,” Therapeutics and Clinical Risk Management, vol. 12, pp. 1223–1229, 2016. [Google Scholar] [PubMed]
14. K. Saini and S. Sharma, “Review on the heart disease detection using IoT framework,” International Journal of Computer Sciences and Engineering, vol. 7, no. 3, pp. 669–674, 2019. [Google Scholar]
15. F. P. Akbulut and A. Akan, “A smart wearable system for short-term cardiovascular risk assessment with emotional dynamics,” Measurement, vol. 128, pp. 237–246, 2018. [Google Scholar]
16. S. S. Xu, M. W. Mak and C. C. Cheung, “Towards end-to-end ECG classification with raw signal extraction and deep neural networks,” IEEE Journal of Biomedical and Health Informatics, vol. 23, no. 4, pp. 1574–1584, 2018. [Google Scholar] [PubMed]
17. A. B. de Luna, P. Coumel and J. F. Leclercq, “Ambulatory sudden cardiac death: Mechanisms of production of fatal arrhythmia on the basis of data from 157 cases,” American Heart Journal, vol. 117, no. 1, pp. 151–159, 1989. [Google Scholar]
18. R. B. Shouldice, C. Heneghan and P. D. Chaza, “Automatic detection of paroxysmal atrial fibrillation,” in Atrial Fibrillation-Basic Research and Clinical Applications, Chapter 7, Section 2, pp. 125–146, Shanghai, China: InTech, 2012. [Google Scholar]
19. P. Kirchhof, J. Bax, C. Blomstrom-Lundquist, H. Calkins, A. J. Camm et al., “Early and comprehensive management of atrial fibrillation: Proceedings from the 2nd AFNET/EHRA consensus conference on atrial fibrillation entitled ‘research perspectives in atrial fibrillation’,” Europace, vol. 11, no. 7, pp. 860–885, 2009. [Google Scholar] [PubMed]
20. R. Mehra, “Global public health problem of sudden cardiac death,” Journal of Electrocardiology, vol. 40, no. 6, pp. S118–S122, 2007. [Google Scholar] [PubMed]
21. R. Ani, S. Krishna, N. Anju, M. S. Aslam and O. Deepa, “IoT based patient monitoring and diagnostic prediction tool using ensemble classifier,” in 2017 Int. Conf. on Advances in Computing, Communications and Informatics (ICACCI), Udupi, India, pp. 1588–1593, 2017. [Google Scholar]
22. A. Fayoumi and K. BinSalman, “Effective remote monitoring system for heart disease patients,” in 2018 IEEE 20th Conf. on Business Informatics (CBI), Vienna, Austria, pp. 114–121, 2018. [Google Scholar]
23. B. Omarov, O. Akhmetova, M. Sakypbekova, Z. Alimzhanova, N. Saparkhojayev et al., “Artificial intelligence in medicine: Real time electronic stethoscope for heart diseases detection,” Computers, Materials & Continua, vol. 70, no. 2, pp. 2815–2833, 2022. [Google Scholar]
24. M. Zhang, W. Wang, G. Xia, L. Wang and K. Wang, “Self-powered electronic skin for remote human–machine synchronization,” ACS Applied Electronic Materials, vol. 5, no. 1, pp. 498–508, 2023. [Google Scholar]
25. G. Sannino and G. De Pietro, “A deep learning approach for ECG-based heartbeat classification for arrhythmia detection,” Future Generation Computer Systems, vol. 86, pp. 446–455, 2018. [Google Scholar]
26. U. R. Acharya, H. Fujita, O. S. Lih, Y. Hagiwara, J. H. Tan et al., “Automated detection of arrhythmias using different intervals of tachycardia ECG segments with convolutional neural network,” Information Sciences, vol. 405, pp. 81–90, 2017. [Google Scholar]
27. A. Rath, D. Mishra, G. Panda, S. C. Satapathy and K. Xia, “Improved heart disease detection from ECG signal using deep learning based ensemble model,” Sustainable Computing: Informatics and Systems, vol. 35, pp. 100732, 2022. [Google Scholar]
28. D. Shah, S. Patel and S. K. Bharti, “Heart disease prediction using machine learning techniques,” SN Computer Science, vol. 1, pp. 1–6, 2020. [Google Scholar]
29. D. Bertsimas, L. Mingardi and B. Stellato, “Machine learning for real-time heart disease prediction,” IEEE Journal of Biomedical and Health Informatics, vol. 25, no. 9, pp. 3627–3637, 2021. [Google Scholar] [PubMed]
30. R. Buettner and M. Schunter, “Efficient machine learning based detection of heart disease,” in 2019 IEEE Int. Conf. on e-Health Networking, Application & Services (HealthCom), Bogotá, Colombia, pp. 1–6, 2019. [Google Scholar]
31. F. Ali, S. El-Sappagh, S. R. Islam, D. Kwak, A. Ali et al., “A smart healthcare monitoring system for heart disease prediction based on ensemble deep learning and feature fusion,” Information Fusion, vol. 63, pp. 208–222, 2020. [Google Scholar]
32. M. M. Ahsan and Z. Siddique, “Machine learning-based heart disease diagnosis: A systematic literature review,” Artificial Intelligence in Medicine, vol. 128, pp. 102289, 2022. [Google Scholar] [PubMed]
33. R. Gharleghi, D. Adikari, K. Ellenberger, S. Y. Ooi, C. Ellis et al., “Automated segmentation of normal and diseased coronary arteries–the ASOCA challenge,” Computerized Medical Imaging and Graphics, vol. 97, pp. 102049, 2022. [Google Scholar] [PubMed]
34. A. S. Sushmit, G. Wang, O. Mariani, H. Yu, Y. Xu et al., “A data generation pipeline for cardiac vessel segmentation and motion artifact grading,” Developments in X-Ray Tomography XIV, vol. 12242, pp. 1–11, 2022. [Google Scholar]
35. F. Khozeimeh, D. Sharifrazi, N. H. Izadi, J. H. Joloudari, A. Shoeibi et al., “RF-CNN-F: Random forest with convolutional neural network features for coronary artery disease diagnosis based on cardiac magnetic resonance,” Scientific Reports, vol. 12, pp. 11178, 2022. [Google Scholar] [PubMed]
36. A. Baccouche, B. Garcia-Zapirain, C. Castillo Olea and A. Elmaghraby, “Ensemble deep learning models for heart disease classification: A case study from Mexico,” Information, vol. 11, no. 4, pp. 207, 2020. [Google Scholar]
37. J. Wankhede, P. Sambandam and M. Kumar, “Effective prediction of heart disease using hybrid ensemble deep learning and tunicate swarm algorithm,” Journal of Biomolecular Structure and Dynamics, vol. 40, no. 13, pp. 1–12, 2021. [Google Scholar]
38. S. S. Sarmah, “An efficient IoT-based patient monitoring and heart disease prediction system using deep learning modified neural network,” IEEE Access, vol. 8, pp. 135784–135797, 2020. [Google Scholar]
39. M. A. Khan, “An IoT framework for heart disease prediction based on MDCNN classifier,” IEEE Access, vol. 8, pp. 34717–34727, 2020. [Google Scholar]
40. M. A. Haq, I. Khan, A. Ahmed, S. M. Eldin, A. Alshehri et al., “DCNNBT: A novel deep convolution neural network-based brain tumor classification model,” Fractals, pp. 1–34, 2023. https://doi.org/10.1142/S0218348X23401023 [Google Scholar] [CrossRef]
41. A. Rehman, S. Naz, M. I. Razzak, F. Akram and M. Imran, “A deep learning-based framework for automatic brain tumors classification using transfer learning,” Circuits, Systems, and Signal Processing, vol. 39, pp. 757–775, 2020. [Google Scholar]
42. M. A. Haq, A. K. Jilani and P. Prabu, “Deep learning based modeling of groundwater storage change,” Computers, Materials & Continua, vol. 70, no. 3, pp. 4599–4617, 2021. [Google Scholar]
43. M. A. Haq, “CDLSTM: A novel model for climate change forecasting,” Computers, Materials & Continua, vol. 71, no. 2, pp. 2363–2381, 2022. [Google Scholar]
44. M. A. Haq, “Planetscope nanosatellites image classification using machine learning,” Computer Systems Science and Engineering, vol. 42, no. 3, pp. 1031–1046, 2022. [Google Scholar]
45. M. A. Haq, G. Rahaman, P. Baral and A. Ghosh, “Deep learning based supervised image classification using UAV images for forest areas classification,” Journal of the Indian Society of Remote Sensing, vol. 49, pp. 601–606, 2021. [Google Scholar]
46. X. Liu, X. Wang, Q. Su, M. Zhang, Y. Zhu et al., “A hybrid classification system for heart disease diagnosis based on the RFRS method,” Computational and Mathematical Methods in Medicine, vol. 2017, pp. 1–11, 2017. [Google Scholar]
47. L. El Bouny, M. Khalil and A. Adib, “ECG heartbeat classification based on multi-scale wavelet convolutional neural networks,” in 2020 IEEE Int. Conf. on Acoustics, Speech and Signal Processing (ICASSP), Barcelona, Spain, pp. 3212–3216, 2020. [Google Scholar]
48. D. Hendrycks and K. Gimpel, “Gaussian error linear units (gelus),” arXiv preprint arXiv:1606.08415, 2016. [Google Scholar]
49. M. Abdel-Basset, A. Gamal, G. Manogaran and H. V. Long, “A novel group decision making model based on neutrosophic sets for heart disease diagnosis,” Multimedia Tools and Applications, vol. 79, pp. 1–26, 2019. [Google Scholar]
50. P. M. Kumar and U. D. Gandhi, “A novel three-tier internet of things architecture with machine learning algorithm for early detection of heart diseases,” Computers & Electrical Engineering, vol. 65, pp. 222–235, 2018. [Google Scholar]
51. P. M. Kumar, S. Lokesh, R. Varatharajan, G. C. Babu and P. Parthasarathy, “Cloud and IoT based disease prediction and diagnosis system for healthcare using fuzzy neural classifier,” Future Generation Computer Systems, vol. 86, pp. 527–534, 2018. [Google Scholar]
52. L. Ali, A. Rahman, A. Khan, M. Zhou, A. Javeed et al., “An automated diagnostic system for heart disease prediction based on x² statistical model and optimally configured deep neural network,” IEEE Access, vol. 7, pp. 34938–34945, 2019. [Google Scholar]
53. Z. Al-Makhadmeh and A. Tolba, “Utilizing IoT wearable medical device for heart disease prediction using higher order Boltzmann model: A classification approach,” Measurement, vol. 147, pp. 106815, 2019. [Google Scholar]
54. J. Vijayashree and H. P. Sultana, “A machine learning framework for feature selection in heart disease classification using improved particle swarm optimization with support vector machine classifier,” Programming and Computer Software, vol. 44, pp. 388–397, 2018. [Google Scholar]
55. A. U. Haq, J. P. Li, M. H. Memon, S. Nazir and R. Sun, “A hybrid intelligent system framework for the prediction of heart disease using machine learning algorithms,” Mobile Information Systems, vol. 2018, pp. 1–21, 2018. [Google Scholar]
56. S. Mohan, C. Thirumalai and G. Srivastava, “Effective heart disease prediction using hybrid machine learning techniques,” IEEE Access, vol. 7, pp. 81542–81554, 2019. [Google Scholar]
57. C. C. Lin and C. M. Yang, “Heartbeat classification using normalized RR intervals and morphological features,” Mathematical Problems in Engineering, vol. 2014, pp. 1–11, 2014. [Google Scholar]
58. S. Choi, M. Adnane, G. J. Lee, H. Jang, Z. Jiang et al., “Development of ECG beat segmentation method by combining lowpass filter and irregular R–R interval checkup strategy,” Expert Systems with Applications, vol. 37, no. 7, pp. 5208–5218, 2010. [Google Scholar]
59. G. d. Lannoy, D. François, J. Delbeke and M. Verleysen, “Weighted SVMs and feature relevance assessment in supervised heart beat classification,” in Int. Joint Conf. on Biomedical Engineering Systems and Technologies, Valencia, Spain, pp. 212–223, 2010. [Google Scholar]
60. U. R. Acharya, H. Fujita, M. Adam, O. S. Lih, T. J. Hong et al., “Automated characterization of arrhythmias using nonlinear features from tachycardia ECG beats,” in 2016 IEEE Int. Conf. on Systems, Man, and Cybernetics (SMC), Budapest, Hungary, pp. 533–538, 2016. [Google Scholar]
61. F. Sufi and I. Khalil, “Diagnosis of cardiovascular abnormalities from compressed ECG: A data mining-based approach,” IEEE Transactions on Information Technology in Biomedicine, vol. 15, no. 1, pp. 33–39, 2010. [Google Scholar] [PubMed]
62. R. J. Martis, U. R. Acharya, H. Prasad, C. K. Chua, C. M. Lim et al., “Application of higher order statistics for atrial arrhythmia classification,” Biomedical Signal Processing and Control, vol. 8, no. 6, pp. 888–900, 2013. [Google Scholar]
63. R. Varatharajan, G. Manogaran and M. Priyan, “A big data classification approach using LDA with an enhanced SVM method for ECG signals in cloud computing,” Multimedia Tools and Applications, vol. 77, pp. 10195–10215, 2018. [Google Scholar]
64. Y. C. Yeh, C. W. Chiou and H. J. Lin, “Analyzing ECG for cardiac arrhythmia using cluster analysis,” Expert Systems with Applications, vol. 39, no. 1, pp. 1000–1010, 2012. [Google Scholar]
65. T. Li and M. Zhou, “ECG classification using wavelet packet entropy and random forests,” Entropy, vol. 18, no. 8, pp. 285, 2016. [Google Scholar]
66. V. H. C. de Albuquerque, T. M. Nunes, D. R. Pereira, E. J. d. S. Luz, D. Menotti et al., “Robust automated cardiac arrhythmia detection in ECG beat signals,” Neural Computing and Applications, vol. 29, pp. 679–693, 2018. [Google Scholar]
67. P. Pławiak, “Novel methodology of cardiac health recognition based on ECG signals and evolutionary-neural system,” Expert Systems with Applications, vol. 92, pp. 334–349, 2018. [Google Scholar]
68. Y. Qian, M. Bi, T. Tan and K. Yu, “Very deep convolutional neural networks for noise robust speech recognition,” IEEE/ACM Transactions on Audio, Speech, and Language Processing, vol. 24, no. 12, pp. 2263–2276, 2016. [Google Scholar]
69. Ö. Yildirim, “A novel wavelet sequence based on deep bidirectional LSTM network model for ECG signal classification,” Computers in Biology and Medicine, vol. 96, pp. 189–202, 2018. [Google Scholar] [PubMed]
70. A. Mostayed, J. Luo, X. Shu and W. Wee, “Classification of 12-lead ECG signals with Bi-directional LSTM network,” arXiv preprint arXiv:1811.02090, 2018. [Google Scholar]
71. C. Zhang, G. Wang, J. Zhao, P. Gao, J. Lin et al., “Patient-specific ECG classification based on recurrent neural networks and clustering technique,” in 2017 13th IASTED Int. Conf. on Biomedical Engineering (BioMed), Innsbruck, Austria, pp. 63–67, 2017. [Google Scholar]
72. S. Kiranyaz, T. Ince and M. Gabbouj, “Real-time patient-specific ECG classification by 1-D convolutional neural networks,” IEEE Transactions on Biomedical Engineering, vol. 63, no. 3, pp. 664–675, 2015. [Google Scholar] [PubMed]
73. D. Li, J. Zhang, Q. Zhang and X. Wei, “Classification of ECG signals based on 1D convolution neural network,” in 2017 IEEE 19th Int. Conf. on e-Health Networking, Applications and Services (Healthcom), Dalian, China, pp. 1–6, 2017. [Google Scholar]
74. W. Yin, X. Yang, L. Zhang and E. Oki, “ECG monitoring system integrated with IR-UWB radar based on CNN,” IEEE Access, vol. 4, pp. 6344–6351, 2016. [Google Scholar]
75. T. J. Jun, H. M. Nguyen, D. Kang, D. Kim, D. Kim et al., “ECG arrhythmia classification using a 2-D convolutional neural network,” arXiv preprint arXiv:1804.06812, 2018. [Google Scholar]
76. M. Salem, S. Taheri and J. S. Yuan, “ECG arrhythmia classification using transfer learning from 2-dimensional deep CNN features,” in 2018 IEEE Biomedical Circuits and Systems Conf. (BioCAS), Cleveland, OH, USA, pp. 1–4, 2018. [Google Scholar]
77. F. Jabeen, M. Maqsood, M. A. Ghazanfar, F. Aadil, S. Khan et al., “An IoT based efficient hybrid recommender system for cardiovascular disease,” Peer-to-Peer Networking and Applications, vol. 12, pp. 1263–1276, 2019. [Google Scholar]
78. A. Çınar and S. A. Tuncer, “Classification of normal sinus rhythm, abnormal arrhythmia and congestive heart failure ECG signals using LSTM and hybrid CNN-SVM deep neural networks,” Computer Methods in Biomechanics and Biomedical Engineering, vol. 24, no. 2, pp. 203–214, 2021. [Google Scholar] [PubMed]
79. Z. Li, D. Zhou, L. Wan, J. Li and W. Mou, “Heartbeat classification using deep residual convolutional neural network from 2-lead electrocardiogram,” Journal of Electrocardiology, vol. 58, pp. 105–112, 2020. [Google Scholar] [PubMed]
80. T. Radhakrishnan, J. Karhade, S. Ghosh, P. Muduli, R. Tripathy et al., “AFCNNet: Automated detection of AF using chirplet transform and deep convolutional bidirectional long short term memory network with ECG signals,” Computers in Biology and Medicine, vol. 137, pp. 104783, 2021. [Google Scholar] [PubMed]
81. S. H. Wang, Y. Zhang, X. Cheng, X. Zhang and Y. D. Zhang, “PSSPNN: PatchShuffle stochastic pooling neural network for an explainable diagnosis of COVID-19 with multiple-way data augmentation,” Computational and Mathematical Methods in Medicine, vol. 2021, pp. 1–18, 2021. [Google Scholar]
82. M. Kachuee, S. Fazeli and M. Sarrafzadeh, “ECG heartbeat classification: A deep transferable representation,” in 2018 IEEE Int. Conf. on Healthcare Informatics (ICHI), New York City, NY, USA, pp. 443–444, 2018. [Google Scholar]
83. S. K. Pandey and R. R. Janghel, “Automatic detection of arrhythmia from imbalanced ECG database using CNN model with SMOTE,” Australasian Physical & Engineering Sciences in Medicine, vol. 42, pp. 1129–1139, 2019. [Google Scholar]
84. B. Kameswara Rao, U. Prasan, M. Jagannadha Rao, R. Pedada and P. S. Kumar, “Identification of heart failure in early stages using SMOTE-integrated AdaBoost framework,” in Computational Intelligence in Data Mining: Proc. of ICCIDM 2021, Tekkali, India, pp. 537–552, 2022. [Google Scholar]
85. M. Waqar, H. Dawood, H. Dawood, N. Majeed, A. Banjar et al., “An efficient SMOTE-based deep learning model for heart attack prediction,” Scientific Programming, vol. 2021, pp. 1–12, 2021. [Google Scholar]
86. J. Yang and J. Guan, “A heart disease prediction model based on feature optimization and smote-Xgboost algorithm,” Information, vol. 13, no. 10, pp. 475, 2022. [Google Scholar]
87. T. Wang, P. Chen, T. Bao, J. Li and X. Yu, “Arrhythmia classification algorithm based on SMOTE and feature selection,” International Journal of Performability Engineering, vol. 17, no. 3, pp. 263–275, 2021. [Google Scholar]
88. M. Bukhari, K. B. Bajwa, S. Gillani, M. Maqsood, M. Y. Durrani et al., “An efficient gait recognition method for known and unknown covariate conditions,” IEEE Access, vol. 9, pp. 6465–6477, 2020. [Google Scholar]
89. Y. LeCun, B. Boser, J. S. Denker, D. Henderson, R. E. Howard et al., “Backpropagation applied to handwritten zip code recognition,” Neural Computation, vol. 1, no. 4, pp. 541–551, 1989. [Google Scholar]
90. C. Y. Lee, P. Gallagher and Z. Tu, “Generalizing pooling functions in cnns: Mixed, gated, and tree,” IEEE Transactions on Pattern Analysis and Machine Intelligence, vol. 40, pp. 863–875, 2017. [Google Scholar] [PubMed]
91. S. Hochreiter and J. Schmidhuber, “Long short-term memory,” Neural Computation, vol. 9, no. 8, pp. 1735–1780, 1997. [Google Scholar] [PubMed]
92. A. Graves and J. Schmidhuber, “Framewise phoneme classification with bidirectional LSTM and other neural network architectures,” Neural Networks, vol. 18, no. 5–6, pp. 602–610, 2005. [Google Scholar] [PubMed]
93. X. H. Cheng, Y. M. Gong and X. Z. Wang, “Study of embedded operating system memory management,” in 2009 First Int. Workshop on Education Technology and Computer Science, Wuhan, China, pp. 962–965, 2009. [Google Scholar]
94. R. Ashraf, S. Afzal, A. U. Rehman, S. Gul, J. Baber et al., “Region-of-interest based transfer learning assisted framework for skin cancer detection,” IEEE Access, vol. 8, pp. 147858–147871, 2020. [Google Scholar]
95. M. Maqsood, S. Yasmin, I. Mehmood, M. Bukhari and M. Kim, “An efficient DA-Net srchitecture for lung nodule segmentation,” Mathematics, vol. 9, no. 3, pp. 1457, 2021. [Google Scholar]
96. M. Kallas, C. Francis, L. Kanaan, D. Merheb, P. Honeine et al., “Multi-class SVM classification combined with kernel PCA feature extraction of ECG signals,” in 2012 19th Int. Conf. on Telecommunications (ICT), Jounieh, Lebanon, pp. 1–5, 2012. [Google Scholar]
97. S. Dutta, A. Chatterjee and S. Munshi, “Correlation technique and least square support vector machine combine for frequency domain based ECG beat classification,” Medical Engineering & Physics, vol. 32, no. 10, pp. 1161–1169, 2010. [Google Scholar]
98. F. Melgani and Y. Bazi, “Classification of electrocardiogram signals with support vector machines and particle swarm optimization,” IEEE Transactions on Information Technology in Biomedicine, vol. 12, no. 5, pp. 667–677, 2008. [Google Scholar] [PubMed]
99. A. Rajkumar, M. Ganesan and R. Lavanya, “Arrhythmia classification on ECG using deep learning,” in 2019 5th Int. Conf. on Advanced Computing & Communication Systems (ICACCS), Coimbatore, India, pp. 365–369, 2019. [Google Scholar]
100. A. Diker, D. Avci, E. Avci and M. Gedikpinar, “A new technique for ECG signal classification genetic algorithm wavelet kernel extreme learning machine,” Optik, vol. 180, pp. 46–55, 2019. [Google Scholar]
Cite This Article
 Copyright © 2023 The Author(s). Published by Tech Science Press.
This work is licensed under a Creative Commons Attribution 4.0 International License , which permits unrestricted use, distribution, and reproduction in any medium, provided the original work is properly cited.
 Downloads
 Citation Tools