
 Submit a Paper
 Propose a Special lssue
 Open Access
ARTICLE
Intelligent Service Search Model Using Emerging Technologies
Department of Information and Communication Engineering, Yeungnam University, Gyeongsan, 38541, Korea
* Corresponding Author: Gyu Sang Choi. Email:
(This article belongs to the Special Issue: The Next Generation of Artificial Intelligence and the Intelligent Internet of Things)
Computers, Materials & Continua 2023, 77(1), 1165-1181. https://doi.org/10.32604/cmc.2023.040693
Received 28 March 2023; Accepted 07 June 2023; Issue published 31 October 2023
 View Full Text
 Download PDF
Abstract
In recent years, the Internet of Things (IoT) has played a vital role in providing various services to users in a smart city. However, searching for services, objects, data, and frameworks remains a concern. The technological advancements in Cyber-Physical Systems (CPSs) and the Social Internet of Things (SIoT) open a new era of research. Thus, we propose a Cyber-Physical-Social Systems (CPSs) for service search. Herein, service search and object discovery operation carries with the suitable selection of friends in the network. Our proposed model constructs a graph and performs social network analysis (SNA). We suggest degree centrality, clustering, and scale-free emergence and show that a rational selection of friends per service exploration increases the overall network navigability. The efficiency of our proposed system is verified using real-world datasets based on service processing time, path length, giant component, and network diameter. The simulation results proved that our proposed system is efficient, robust, and scalable.Keywords
The traditional networks and services are efficiently utilized under the umbrella of a smart city [1].The key services are smart traffic management, smart healthcare, waste management, urban transport, etc. The Internet of Things (IoT) is a leading technology that connects a huge number of homogeneous and heterogeneous objects. These objects can communicate and provide various services in these application scenarios. According to a recent research survey [2], the number of IoT devices will be in billions by 2025. Therefore, searching for a service in IoT devices acts as a challenging task [3–5]. In addition, since a device can have several connections, therefore requires a large search space. The IoT is based on centralized systems and hence has limited the service selection and also has scalability issues. To address the scalability issue, a new technology is introduced, named the Social Internet of Things (SIoT). SIoT works as a cluster between the IoT and social networks [6]. Moreover, the social networking feature is not only limited to the online social networking for instance; Facebook and Twitter, but it could applied to the natural sciences. The communication among these devices is improved by using smart objects, especially when they were connected to others. These smart objects can communicate directly or indirectly by utilizing their neighbors. The power of establishing social relationships enables the SIoT objects to establish relationships and also behave socially [7]. Therefore, smart objects can request and also provide various services. One of the promising features of the SIoT is that every object can look for a desired service by using neighborhood relations, such as querying neighbors in a distributed manner. Hence, the overall network navigability is increased. The Cyber-Physical Systems (CPS) are popular nowadays and becoming the fundamental conceptual approaches of Industry 4.0 [8]. These intelligent systems comprised controllers, sensors, actuators, etc. All these devices work together and provide support for the physical and cyber worlds [9]. A necessity in the modern world is to provide the cyber-physical infrastructure combined with new software platforms that combine emerging technologies [10]. Presently, the global world is evolving into a hybrid world with the integration of cyber, physical, and social aspects. These are referred to as Cyber-Physical-Social Systems (CPSs) [11,12]. The objectives of CPSS to provide efficient, convenient, and personalized services to the humans [13,14]. The general structure of a CPSS is shown in Fig. 1. In this figure, we can see those cyber, physical, and social systems were connected. The social system (networks) interact with each other and are hence composed of virtual and physical spaces. The social system is comprised of people having relations among them. The relation is formed based on the social interaction and measurement of performance based on personal experience, perception, and observation. The physical systems were divided into sensors and actuators. The sensing devices comprised of sensors, temperature sensors, and actuators as shown in the figure. These smart objects were connected using different technologies using wired and wireless techniques to process the valuable data and shown in the virtual space. CPSS has been an active research topic for more than a decade and plays a very important role as an interface between several objects to send and receive data and carry out actions. The integration of CPSs and emerging technologies helps to improve the user services especially in smart cities. Many researchers have worked in this direction. For instance, Zhou et al. [15] presented a survey on the development of CPSs. For evaluation, they identified five diverse aspects and listed are as follows. The development of CPS to CPSSs, architecture design, applications, and standards, the enabling techniques, and networks. A technical study conducted by Amin et al. [16] proposed CPSs for the analysis of high communication traffic areas in a smart city. It is a two-step procedure, in the first step; the high communication areas named hotspots were extracted in the network. In the second step; to quantify the importance of each hotspot a deep analysis has been performed based on certain network metrics, for example, degree, and Eigenvector centrality etc. The authors concluded that these metrics help to identify the importance of each hotspot in the network. In addition, this study is helpful for the researchers who were working in the telecom domain. A similar research carried by Ahmad et al. [17] proposed a Socio-cyber network based on the human behaviors. In this study, they have performed a big data analysis. The proposed model integrates the social network with the technical network. The friendship is established based on the trust index and geolocation information of the user. The proposed model provides a better understanding of extracting knowledge. Similarly, Dautovic et al. [18] proposed a collaborative data processing platform using stream processing technology. The key objective of this platform is to distribute the workload among all devices. Yetis et al. [19] proposed a cyber-physical-social system for a smart city. The proposed system regularly reports smart city problems that people face in their environment by solving cyber, physical, and social factors. Li et al. [20] focused on multi-objective optimization based on power load stability. From this literature, we found that although the research on this topic is recent and ongoing; however, there is limited literature reported on the SIoT, especially in the development of CPSS. Therefore, there is a need to find alternative services and data retrieval methods [21] using CPss and emerging technologies.

Figure 1: General structure of CPSS
1.1 Motivation and Problem Statement
The potential service selection and the framework for achieving a greater connection is a key problem in IoT and remains the same in the development of smart cities [7]. The primary motivation of our research study is to find the desired service for objects in the IoT. Therefore, we propose to develop an innovative solution for the service search using emerging intelligence, i.e., SIoT, and CPSS. Our proposed model is expected to boost the selection and composition of services provided by objects and networks that have access to the physical world. The key objective of this research is to provide a model for object discovery and potential services selection using intelligent friend selection. In particular, the recent CPSs systems were developed without considering SIoT. Therefore, our research aims to fully exploit the emerging technologies combined with the advantages in the existing systems. We proposed a system for the potential service selection and showed how required service discovery has been performed with the proper selection of potential friends in the network and will impact in terms of achieving higher network navigability. We perform a detailed analysis using service processing time, average path length, degrees, network diameter, etc.
Our research is beneficial for researchers who have the intention to learn the structural properties of a large-scale network and wants to learn the interactions among devices in a distributed manner, as well as low-cost routing and service search methods.
1.3 Contribution of This Study
• The current state-of-the-art models are purely based on global network navigability and thus lack existing short paths. Thus, a large time is required for service search in the network. We solve this problem by employing local network navigability. In our proposed system, we suggested network-based properties for instance; neighborhood degree, local clustering, and scale-free emergence to increase the overall network navigability.
• The distributed nature of our proposed system can discover the desired services very quickly and hence it requires less service execution time and also is scalable.
• We analyzed how the proposed system behaves when the routing is performed by each object only exploiting local information for instance; friends, namely their degrees. Hence, it guarantees lows cost routing.
• The proposed system is evaluated using four real data sets and compared with current state of art models. The efficiency is measured by considering the giant component, network diameter, path length, and service processing time.
The rest of the study is organized as follows. Section 2 presents the relevant background and the core concepts of emerging technologies. Section 3 explains our proposed multilevel system design model. Section 4 explains the experimentation and finally, Section 5 concludes the conclusion of our study.
Herein, we review the most recent literature. Herein we briefly discuss the current state of the art along with suitable supporting literature.
2.1 The Current State of ART in CPSs
The IoT is a leading technology and is widely used to develop the infrastructure in smart cities. The objects in the IoT were connected and passed data to the others. Millions of objects were connected and transferred data at the same time therefore, it leads to the generation of large data and hence the scalability issue arises. The service search is the key challenge that remains for the growth of IoT [16]. In order, to overcome this issue, the Social Internet of Things (SIoT) has been developed. The SIoT works as a cluster between the IoT and social networks. The power of utilizing social relationships is helpful to overcome the issue of scalability. In addition, generally, social networks have large data and the power of SIoT is also helpful to solve problems in handling large-scale data. For example; Sivrikaya et al. [14] proposed a framework for service selection in a smart city using IoT. The research is excellent, however, they did not consider the centrality metrics. Another study conducted by Keung et al. [22] proposed a framework for robotic and facility control using edge intelligence for the industrial Internet of Things (IIoT). They suggested Artificial Intelligence (AI) and IIoT-based agnostic robotic architecture for resource synchronization. Another research conducted by Keung et al. [23] addressed the issue of value utilization and creation in IIoT. For this, they proposed a graph theory-based solution named multi-deep Robotic Mobile Fulfillment System (RMFS). It is used for identifying the short paths using fast computing. For this purpose, they proposed three-tier IIoT architecture including RMFS, a supplier, and a disposal center. The proposed model comprised different storage locations. The assignment rules and strategies were implemented under the particular parties to reduce the operation cost. For performance evaluation, they compared with a genetic heuristic algorithm, A-star, and the Dijkstra algorithm. Zheng et al. [24] presented a manufacturing network based on graph knowledge and the multi-agent re-enforcement learning for the IIoT. They suggested self-X cognitive manufacturing which is the combination of self-configuration, self-optimization, and self-adjust. Similarly, Xia et al. [25] proposed a novel convolutional network-based approach for predicting the material removal rate in a chemical plantation. The Knowledge Graphs (KG) were used for unorganized maintenance. Xia et al. [26] researched maintenance planning and recommendation using knowledge and neural network graphs. In this research, at first, a KG is formed. The maintenance is established based on a well-defined domain-specific ontology schema. Then, a compressed relational graph convolutional network is proposed to predict the faults in maintenance. Finally, a maintenance test case using oil drilling equipment is carried out to check the efficiency. One more study conducted by Xia et al. [27] proposed an approach for fault diagnosis in complex networks. Presently, fault diagnosis in graphs is performed using Graph Neural Networks (GNN) is performed based on data similarity. Therefore, they cannot guarantee the quality. Therefore, a proposed hybrid approach is combined with the hypergraph construction method. Zhou et al. [28] developed a deep learning-based personalized recommender system. This system predicts the click-through rate for a given item and is suitable for online advertising. Zhang et al. [29] proposed a model for wind power operation and maintenancebased on social and physical information. They suggested cognitive measurement and intelligent guide using simulation. Tan et al. [30] proposed a block-chain-based access control framework to increase the privacy preservation. The access control is ensured and the transactions issued and the encryption is performed by using a domain management server. Two problems were associated; first, it takes plenty of time to protect the security and privacy and secondly occupied a large space, therefore, not suitable for the mobile devices. Secondly, the operation function does not provide a standard permission mechanism to access the chain of records in the network. Keung et al. [31] presented a study on the development of a cloud-based Robotic Mobile Fulfillment System (RMFS). They first presented a critical analysis of cloud-based services for IoT development. Secondly, theoretical research was conducted from the most recent literature. In addition, they proposed a cloud-based architecture using a conflict avoidance strategy in the multi-layer multi-deep warehouse. One more similar research was conducted by Kung et al. [23] and addressed value creation by utilizing the IIoT. In this research, a graph-based heuristic is used for computing the short paths in the network. They suggested Diikstra, A-star, and genetic algorithm for the comparison. The unique feature of this model is that it integrates the physical and cyber layers using cloud. From literature, we concluded that SIoT is useful in the development of CPSs. But, there is a limited research has been reported on this topic. Therefore, we proposed a service discovery model using SIoT and CPSs. The proposed model is explained given in Section 3.
3 Proposed Multilevel System Design Model
The proposed conceptual multilevel system model is shown in Fig. 2. It is a four-layered model consisting of data collection, communication, processing, and application layers. In this section, we explain the functionality of each layer in detail.

Figure 2: Proposed multilevel system design model
The first layer (the top layer shown in the figure) is used for data generation. The main function of our proposed system is to generate and efficiently process large graphs from Facebook, Slashdot, Bright kite, and IoT real objects. The IoT data set for a smart city is comprised of sensors and actuators etc. The data generation layer integrates all the features necessary to gather sensor information on a real-time basis. The preprocessing is performed and the data set size is reduced. In this way, unnecessary information will be discarded efficiently.
In this layer, all devices were equipped with a communication medium, for instance; Wireless Fidelity (WIFI) and Worldwide Interoperability for Microwave Access (WiMax), etc. This layer handles the data collected from various objects for instance; Bright kite, Facebook, Real IoT, and other social networks. The purpose is to collect the data from the source to the design system. Herein, we suggest, high-speed communication technologies such as; Long-Term Evolution (LTE), WIFI, WiMax, and Ethernet technologies. These technologies are helpful to transfer the data from the source to the designed server. It is possible if the devices and systems are kept near each other. At first, a graph is created. When the incoming data is received the graph is modified by adding new nodes and edges.
This layer receives the data from the above layer with the key function to normalize the data into a meaningful form. In this way, the useful information is extracted. Usually, the processing of a large amount of data requires more power and resources. The traditional methods of data processing are not feasible to analyze large amounts of data. Therefore, there is a need to develop a system that can efficiently pre-process the incoming stream of data. For this purpose, the incoming data is first stored in the database and then handled by using Python Data analysis (Pandas) as shown in Fig. 2. The key functions of Pandas are to perform cleansing, transforming, and the manipulation of the data. Network X [32] generates a graph from the dataset, and then, network centrality metrics were applied. The data storage initially creates ‘filtered big data’ and Herein, the errors and the redundant data were removed. The servers process an equal amount of data and generate the output at the same time. Finally, the error-free data is converted into a graph. The graph database extracts the potential friendship metrics for instance; degree centrality, and clustering coefficient, and the scale-free emergence structure has been applied to the graph. After following these steps, the processed data is forwarded to the next layer.
Graph Building
The graph-building process has been performed in this layer. Herein, the social network data is denoted by an undirected and unweighted Graph

Figure 3: Reference graph deployment
The key parts in this layer are a data center using the cloud, data storage, and prediction as shown in Fig. 2. The upper layer graph database sends the partial and complete results to this layer. At first, these results were stored in the data center using the cloud. As the functionality of both servers same. Therefore, It depends upon the user if he wants to choose two separate servers is feasible. The decision is depending upon the keeping because of systems cost. In addition, the application layer handles the database management and storage. Moreover, several essential activities for instance; data storage and analysis were performed by the objects that were stored. Finally, our proposed system first stores secondly analyze, and third presents the results to users.
4 Results Analysis and Discussion
Herein, we discuss the details of the experimental results. For the readers, we have divided it into two parts. In the first part, we discuss the basic network indicators and then we discuss the dataset and the achieved experimental results based on the proposed network indicators.
These metrics capture the connectivity and the centrality of objects in the network and are known as network indicators [33]. The basic network properties are clustering coefficient, degree of connectivity, network diameter and path length, etc. The explanation details were given below.
A network is a collection of nodes and edges altogether. The network degree distribution
where
The average number of edges per node in a graph is known as the average degree. It is increased by increasing the number of edges in the network.
This measure is introduced by Watts et al. in [36]. It is a measure of the closeness of nodes to form a clique [7]. Its range is from (0, 1). It is measured based on the below equation:
where
4.1.4 Degree of Connectivity (Giant Component)
A portion or group of nodes is directly or indirectly connected and the nodes in a graph. It is increased by increasing the number of links in the network. In many cases, it is observed as high and known as a higher giant component. If the network is fully connected it means that it has a
The path length in a graph is the average number of edges that must be traversed to go from one vertex to another. To assess the size of the network, the average path length is suggested. It is simply the average distance between two vertices and averaged over possible pairs of vertices. It is measured by adding all the minimum distances between
where
4.2 Dataset Description and Preparation
In this research, we take a real large-size IoT-generated dataset. The datasets include 1) the Real IoT dataset [37] including all the details of the points of various places in a smart city. In this dataset, a variety of real IoT objects were collected. 2) Social network datasets, such as Facebook [38], Brightkite [38], and Slashdot [39]. The Facebook and Brightkite dataset was developed by the SNAP library at Stanford University.
4.3 Potential Service Search and Object Discovery
Fig. 4 illustrates the reference model for potential service discovery in a social network and is derived from Fig. 3. In this figure,

Figure 4: Social network reference model
In this example; we examine that
We have divided this section into two subsections. We first, explain the graph visualization and in the second subsection, we explain the results based on the service processing time, giant component, network diameter, and path length. The overall framework is implemented using Network X to generate and process the graphs (which abstracts the relation among the data) in near real-time [32]. Network X [32] is a package for the Python programming language and is used to create and study the structure, manipulation, dynamics, and functions. The network information is received based on the objects profile and movement. it is noteable that until now the SIoT is not completely deployed. Therfore, the most experimention is performed by using IoT simulation tools. For instance, in this research, we have used ‘Network X’. The experiments parameters were listed in Table 1. In this table, one could examine that the nodes and edges were given for the Facebook, Brig kite for proposed model and the BA model.
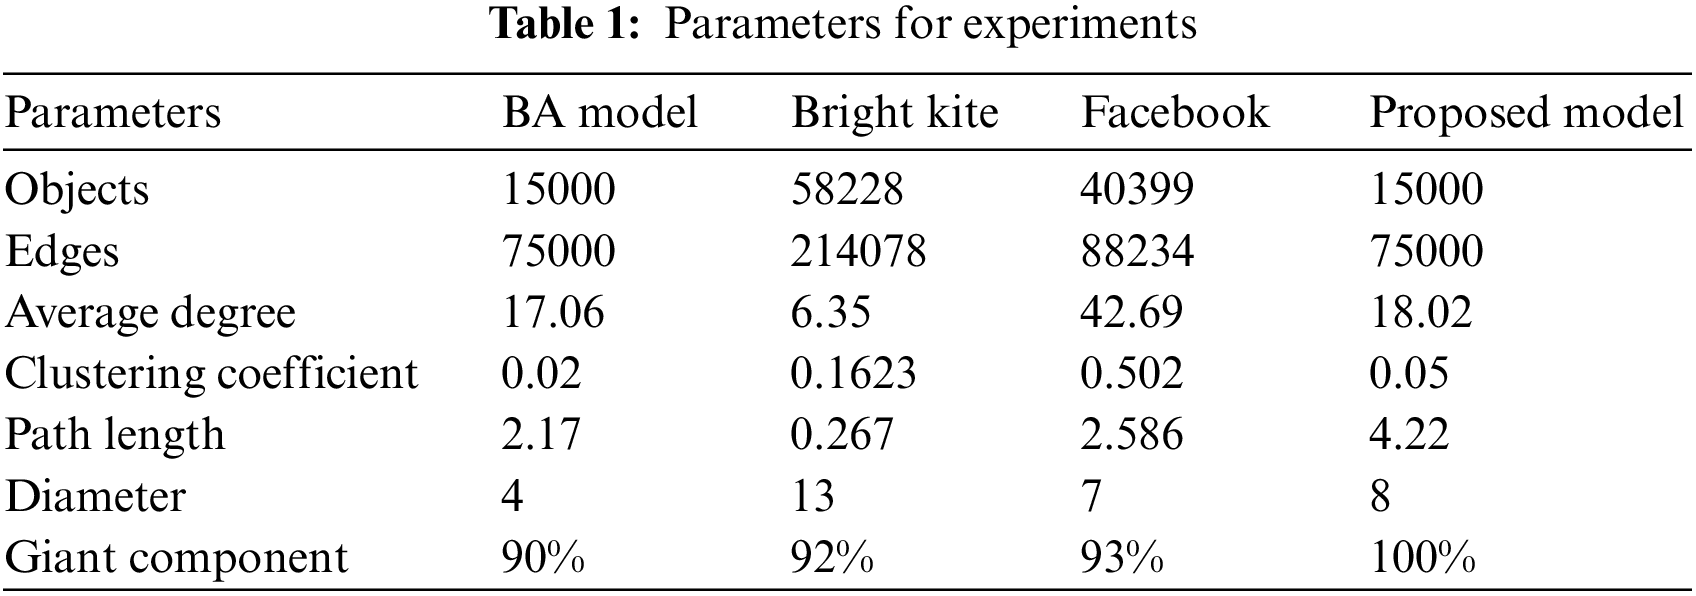
Fig. 5 illustrates the graph visualization of our proposed system using small nodes and edges. Initially, we deploy our few objects and later we increased them. It is noted that If the number of objects were large it is difficult to visualize. Therefore, for better visualization, we prefer to deploy a few nods or objects in the network for the easiness of readers.

Figure 5: Graph visualization
4.4.2 Giant Component Experiment
Fig. 6 shows the giant component experiment. The Giant component presents a large fraction of objects in the network. It is a measure that represents whether a graph is fully or completely connected or not. In this experiment, we check whether proposed the graph of our proposed system is completely connected or not. Generally, the access of the objects to others using short paths. It means the giant component completely depends upon the number of objects. If we have many objects it means that we have a larger giant component. If a graph shows 100%, It means that the proposed model is efficient and most of the objects can be accessed by using small paths. In this experiment, we presented the probability of connected objects as a percentage. From Fig. 6, one could observe that we were achieving the 100% giant component. We examine that the giant component is increased slightly by increasing the number of connections. In this figure, the graph initially starts from 0 and slightly increased with many connections and finally reaches 100%. As mentioned earlier that if the giant component is 100% it means that the proposed system is highly efficient and objects were fully connected. Hence the objects can easily access others by using these short paths. In this step, we achieved efficient results. Therefore, we proceed to other experiments to measure the efficiency of our proposed system.

Figure 6: Giant component experiment
4.4.3 Degree Distribution Experiment
The objective of this experiment is to verify whether the proposed system follows power law or not. For readers of this study, the algorithm is considered highly efficient if the system follows a power law. We have used three datasets, for instance, Facebook, SIoT, and Bright kite. Fig. 7 illustrates the degree distribution using Facebook and Bright kite datasets. In the Facebook and bright kite datasets, the vertical red line indicates the occurrence of power law [41]. On the other hand, the blue line indicates the deployment of objects using our system. In this figure, one could easily examine that the blue line is very close to the red line and hence it makes a

Figure 7: Degree distribution using different datasets

Figure 8: SIoT datasets
In Fig. 9, we have experimented with the network diameter. If we look carefully at this figure, we could examine that except for the beginning period, the diameter of the proposed system is lower. The network diameter decreases significantly. In the connected graph, all objects are connected directly or indirectly. By using analysis we derived a conclusion that by reducing the network diameter, the network users contact more tightly. Hence, the service search process becomes efficient especially when it is initiated between the friends in the network. We derived a conclusion from this experiment that our proposed system is highly efficient.

Figure 9: Network diameter
Fig. 10 illustrates the average path length experiment. In this figure, a reader can see that we have compared our proposed system (red color) with the BA (green color) and the Random Network model (blue color). The X-axis is the hop distance and the Y-axis is the computed averaged path length. If the objects are located around

Figure 10: Average path length
Fig. 11 presents the processing time of our proposed system. The X-axis presents the Dataset size and the Y-axis is the processing time. The efficiency is measured by using datasets (mentioned previously) and the processing time is measured in milliseconds. We can see in this figure that the increase in data size results in a decrease in the processing time. Initially, it starts slowly, and later it grows quickly. For the large dataset, the processing time is decussated. It means that our proposed system is highly efficient. We analyze the overall throughput to correspond to the data size. The throughput is directly proportional to data size it is due to the nature of our proposed system. Hence, it means that our proposed system is highly efficient.

Figure 11: Service processing time
In Table 1, we compare our proposed model and the state-of-the-art model. We examine that the Giant component of our proposed model archives 100%. The path length and the diameter also demonstrate efficacy as compared to the others and based on this compassion we could say that our proposed system is efficient as compared to the others. The clustering coefficient and the network diameter results are also satisfactory. Based on these results we could say that our proposed system is highly efficient as compared to the art of the state model.
We herein proposed a method for building a combined CPSS and SIoT-based model for efficient service search and object discovery. Our proposed system first converts the large-scale social network data into a graph and then applies the degree centrality, clustering, and scale-free emergence structure. These metrics are helpful to find the central or most influential objects in the network. In addition, the potential service search and the object discovery are performed using the right selection of friends in the network. The key objective of the right friend selection is to achieve higher network navigability. The efficiency of our proposed system is verified using real-world datasets based on service processing time, path length, giant component, and also network diameter. From experimental results, it is proved that the proposed system is highly efficient, robust, and scalable. In addition, we prove that the degree distribution follows the power law, the average distance and network diameter shrink and also the network density is greater and has a large giant component in our proposed system. But some issues such as the number of friends and trust are not discussed therefore, they will be addressed in future studies.
Acknowledgement: We thank our families and colleagues who provided us with moral support.
Funding Statement: This work was supported in part by Basic Science Research Program through the National Research Foundation of Korea (NRF) funded by the Ministry of Education (NRF-2019R1A2C1006159) and (NRF-2021R1A6A1A03039493).
Author Contributions: The authors’ contributions to this work are as follows: conceptualization, F. Amin; methodology, F. Amin; software, F. Amin; validation, G. S. Choi; draft preparation, F. Amin and G. S. Choi; review and editing, G. S. Choi; visualization, F. Amin; supervision, G. S. Choi; funding acquisition, G. S. Choi. All authors have read and agreed to the published version of the manuscript.
Availability of Data and Materials: The authors confirm that the data supporting the findings of this study are available within the paper.
Conflicts of Interest: The authors declare that they have no conflicts of interest regarding the present study.
References
1. X. Wu, J. Wang, P. Li, X. Luo and Y. Yang, “Internet of Things as complex networks,” IEEE Network,vol. 35, pp. 238–245, 2021. [Google Scholar]
2. J. Cook, S. U. Rehman and M. A. Khan, “Security and privacy for low power IoT devices on 5G and beyond networks: Challenges and future directions,” IEEE Access, vol. 11, pp. 39295–39317, 2023. [Google Scholar]
3. C. Lim, K. J. Kim and P. P. Maglio, “Smart cities with big data: Reference models, challenges, and considerations,” Cities, vol. 82, pp. 86–99, 2018. [Google Scholar]
4. N. Anwar, G. Xiong, W. Lu, P. Ye and H. Zhao, “Cyber-physical -social systems for smart cities: An overview,” in Proc. of 1st Int. Conf. on Digital Twins and Parallel Intelligence (DTPI), Berlin, Germany, pp. 348–353, 2021. [Google Scholar]
5. F. Amin, A. Majeed, A. Mateen, R. Abbasi and S. O. Hwang, “A systematic survey on the recent advancements in the social Internet of Things,” IEEE Access, vol. 10, no. 9, pp. 63867–63884, 2022. [Google Scholar]
6. Z. Dong, “Research of big data information mining and analysis: Technology based on hadoop technology,” in Proc. of Int. Conf. on Big Data, Information and Computer Network (BDICN), Sanya, China, pp. 173–176, 2022. [Google Scholar]
7. F. Amin, R. Abbasi, A. Rehman and G. S. Choi, “An advanced algorithm for higher network navigation in Social Internet of Things using small-world networks,” Sensors, vol. 19, no. 2, pp. 2007, 2019. [Google Scholar] [PubMed]
8. S. Kim, K. J. Park and C. Lu, “A survey on network security for cyber-physical systems: From threats to resilient design,” IEEE Communications Surveys & Tutorials, vol. 24, pp. 1534–1573, 2022. [Google Scholar]
9. C. Xu, X. Huang, J. Zhu and K. Zhang, “Research on the construction of Sanya smart tourism city based on Internet and Big data,” in Proc. of Int. Conf. on Intelligent Transportation, Big Data & Smart City (ICITBS), Xiamen, China, pp. 125–128, 2018. [Google Scholar]
10. L. Kuang, L. T. Yang and Y. Liao, “An integration framework on cloud for cyber-physical-social systems big data,” IEEE Transactions on Cloud Computing, vol. 8, pp. 363–374, 2020. [Google Scholar]
11. S. Pasandideh, P. Pereira and L. Gomes, “Cyber-physical-social systems: Taxonomy, challenges, and opportunities,” IEEE Access, vol. 10, pp. 42404–42419, 2022. [Google Scholar]
12. G. G. Wang, X. Cai, Z. Cui, G. Min and J. Chen, “High performance computing for cyber physical social systems by using evolutionary multi-objective optimization algorithm,” IEEE Transactions on Emerging Topics in Computing, vol. 8, pp. 20–30, 2020. [Google Scholar]
13. H. Liu, L. T. Yang, Y. Guo and J. Ma, “An incremental tensor-train decomposition for cyber-physical-social big data,” IEEE Transactions on Big Data, vol. 7, pp. 341–354, 2021. [Google Scholar]
14. F. Sivrikaya, N. Ben-Sassi, X. T. Dang and C. Kuster, “Internet of smart city objects: A distributed framework for service discovery and composition,” IEEE Access, vol. 7, pp. 14434–14454, 2019. [Google Scholar]
15. Y. Zhou, F. R. Yu, J. Chen and Y. Kuo, “Cyber-physical-social systems: A state-of-the-art survey, challenges and opportunities,” IEEE Communications Surveys & Tutorials, vol. 22, pp. 389–425, 2020. [Google Scholar]
16. F. Amin and G. S. Choi, “Hotspots analysis using cyber-physical-social system for a smart city,” IEEE Access, vol. 8, pp. 122197–122209, 2020. [Google Scholar]
17. A. Ahmad, M. Babar, S. Din, M. M. Ullah and A. Paul, “Socio-cyber network: The potential of cyber-physical system to define human behaviors using big data analytics,” Future Generation Computer Systems, vol. 92, pp. 868–878, 2019. [Google Scholar]
18. R. Dautov, S. Distefano, D. Bruneo, F. Longo and A. Puliafito, “Data processing in cyber-physical-social systems through edge computing,” IEEE Access, vol. 6, pp. 29822–29835, 2018. [Google Scholar]
19. H. Yetis and M. Karakose, “A cyber-physical-social system based method for smart citizens in smart cities,” in Proc. of 24th Int. Conf. on Information Technology (IT), Kanpur, India, pp. 1–4, 2020. [Google Scholar]
20. W. Li, Z. Lin, H. Zhou and G. Yan, “Multi-objective optimization for cyber-physical-social systems: A case study of electric vehicles charging and discharging,” IEEE Access, vol. 7, pp. 76754–76767, 2019. [Google Scholar]
21. L. Li, K. R. Lai and S. Zhu, “Data-driven behavior-based negotiation model for cyber-physical-social systems,” IEEE Access, vol. 7, pp. 83319–83331, 2019. [Google Scholar]
22. K. L. Keung, Y. Y. Chan, K. K. H. Ng and S. L. Mak, “Edge intelligence and agnostic robotic paradigm in resource synchronisation and sharing in flexible robotic and facility control system,” Advanced Engineering Informatics, vol. 52, pp. 101530, 2022. [Google Scholar]
23. K. L. Keung, C. K. M. Lee and P. Ji, “Industrial Internet of Things-driven storage location assignment and order picking in a resource synchronization and sharing-based robotic mobile fulfillment system,” Advanced Engineering Informatics, vol. 52, pp. 101540, 2022. [Google Scholar]
24. P. Zheng, L. Xia, C. Li, X. Li and B. Liu, “Towards self-x cognitive manufacturing network: An industrial knowledge graph-based multi-agent reinforcement learning approach,” Journal of Manufacturing Systems, vol. 61, pp. 16–26, 2021. [Google Scholar]
25. L. Xia, P. Zheng, X. Huang and C. Liu, “A novel hypergraph convolution network-based approach for predicting the material removal rate in chemical mechanical planarization,” Journal of Intelligent Manufacturing, vol. 33, pp. 2295–2306, 2022. [Google Scholar]
26. L. Xia, Y. Liang, J. Leng and P. Zheng, “Maintenance planning recommendation of complex industrial equipment based on knowledge graph and graph neural network,” Reliability Engineering & System Safety, vol. 232, pp. 109068, 2023. [Google Scholar]
27. L. Xia, Y. Liang, P. Zheng and X. Huang, “Residual-hypergraph convolution network: A model-based and data-driven integrated approach for fault diagnosis in complex equipment,” IEEE Transactions on Instrumentation and Measurement, vol. 72, pp. 1–11, 2023. [Google Scholar]
28. R. Zhou, H. Qian, J. Zhang, C. Liu and Y. Ren, “Self-attention mechanism enhanced user interests modeling for personalized recommendation services in cyber-physical-social systems,” IEEE Transactions on Network Science and Engineering, vol. 9, pp. 3835–3846, 2022. [Google Scholar]
29. X. Zhang, B. Duan and T. Li, “Cyber-physical-social systems for wind power operation and maintenance,” in Proc. of IEEE 3rd Conf. on Energy Internet and Energy System Integration (EI2), Changsha, China, pp. 419–423, 2019. [Google Scholar]
30. L. Tan, N. Shi, C. Yang and K. Yu, “A blockchain-based access control framework for cyber-physical-social system big data,” IEEE Access, vol. 8, pp. 77215–77226, 2020. [Google Scholar]
31. K. L. Keung, C. K. M. Lee and K. K. H. Ng, “Cloud-based cyber-physical robotic mobile fulfillment systems: A case study of collision avoidance,” IEEE Access, vol. 8, pp. 89318–89336, 2020. [Google Scholar]
32. A. Hagberg, P. Swart and D. S. Chult, “Exploring network structure, dynamics, and function using networkx,” in Proc. of the 7th Python in Science Conf. (SciPy2008), Pasadena, Canada, pp. 11–16, 2008. [Google Scholar]
33. J. Hong, R. Tamakloe, S. Lee and D. Park, “Exploring the topological characteristics of complex public transportation networks: Focus on variations in both single and integrated systems in the seoul metropolitan area,” Sustainability, vol. 11, pp. 5404, 2019. [Google Scholar]
34. C. Fu, C. Peng, X. Y. Liu, L. T. Yang, J. Yang et al., “Search engine: The social relationship driving power of Internet of Things,” Future Generation Computer Systems, vol. 92, pp. 972–986, 2019. [Google Scholar]
35. R. Albert and A. L. Barabási, “Statistical mechanics of complex networks,” Reviews of Modern Physics, vol. 74, pp. 47–97, 2002. [Google Scholar]
36. D. J. Watts and S. H. Strogatz, “Collective dynamics of ‘small-world’ networks,” Nature, vol. 393, pp. 440–442, 1998. [Google Scholar] [PubMed]
37. C. Marche, L. Atzori, V. Pilloni and M. Nitti, “How to exploit the social Internet of Things: Query generation model and device profiles’ dataset,” Computer Networks, vol. 174, pp. 107–248, 2020. [Google Scholar]
38. J. Leskovec and A. Krevl, SNAP Datasets: Stanford Large Network Dataset Collection. Ann Arbor, MI, USA: Stanford University Press, 2014. [Google Scholar]
39. J. Leskovec, K. J. Lang, A. Dasgupta and M. W. Mahoney, “Community structure in large networks: Natural cluster sizes and the absence of large well-defined clusters,” Internet Mathematics, vol. 6, pp. 29–123, 2009. [Google Scholar]
40. F. Amin, A. Ahmad and G. Sang Choi, “Towards trust and friendliness approaches in the social Internet of Things,” Applied Sciences, vol. 9, pp. 1–16, 2019. [Google Scholar]
41. A. L. Barabási and R. Albert, “Emergence of scaling in random networks,” Science, vol. 286, pp. 509–512, 1999. [Google Scholar]
42. F. Amin and G. S. Choi, “Model for generating scale-free artificial social networks using small-world networks,” Computers, Materials & Continua, vol. 73, no. 2, pp. 6367–6391, 2022. [Google Scholar]
Cite This Article
 Copyright © 2023 The Author(s). Published by Tech Science Press.
This work is licensed under a Creative Commons Attribution 4.0 International License , which permits unrestricted use, distribution, and reproduction in any medium, provided the original work is properly cited.
 Downloads
 Citation Tools