
 Submit a Paper
 Propose a Special lssue
 Open Access
ARTICLE

A Deep Learning Based Sentiment Analytic Model for the Prediction of Traffic Accidents
1
University Institute of Information Technology, PMAS Arid Agriculture University, Rawalpindi, 46000, Pakistan
2
Department of Marketing, Operations, and Information System, Abu Dhabi University, Abu Dhabi, 6844, United Arab Emirates
3
College of Computer and Information Sciences, Prince Sultan University, Riyadh, 11442, Saudi Arabia
4
Robotics and Internet of Things Lab, Prince Sultan University, Riyadh, 11442, Saudi Arabia
* Corresponding Author: Nadeem Malik. Email:
(This article belongs to the Special Issue: The Next Generation of Artificial Intelligence and the Intelligent Internet of Things)
Computers, Materials & Continua 2023, 77(2), 1599-1615. https://doi.org/10.32604/cmc.2023.040455
Received 19 March 2023; Accepted 02 August 2023; Issue published 29 November 2023
 View Full Text
 Download PDF
Abstract
The severity of traffic accidents is a serious global concern, particularly in developing nations. Knowing the main causes and contributing circumstances may reduce the severity of traffic accidents. There exist many machine learning models and decision support systems to predict road accidents by using datasets from different social media forums such as Twitter, blogs and Facebook. Although such approaches are popular, there exists an issue of data management and low prediction accuracy. This article presented a deep learning-based sentiment analytic model known as Extra-large Network Bi-directional long short term memory (XLNet-Bi-LSTM) to predict traffic collisions based on data collected from social media. Initially, a Tweet dataset has been formed by using an exhaustive keyword-based searching strategy. In the next phase, two different types of features named as individual tokens and pair tokens have been obtained by using POS tagging and association rule mining. The output of this phase has been forwarded to a three-layer deep learning model for final prediction. Numerous experiment has been performed to test the efficiency of the proposed XLNet-Bi-LSTM model. It has been shown that the proposed model achieved 94.2% prediction accuracy.Keywords
Accidents on the road interfere with regular traffic operations, impede traffic flow, and dramatically worsen urban problems around the world [1]. Large-scale auto accidents frequently cause fatalities, severe injuries and even deaths. According to the National Highway Traffic Safety Administration (NHTSA), which generates annual reports on the statistics surrounding traffic safety, more than 5,000,000 car accidents have occurred in the United States each year since 1998, and approximately 30% of these accidents result in fatalities and injuries [2]. From past studies, it is now generally believed that considerable reductions in the effect of accidents may be obtained by the introduction of computer-based efficient detection systems and reaction tactics [3]. Accurate and prompt identification of traffic accidents is vital to the operation of contemporary transportation management systems as traffic incident management is an essential component. Traditional approaches that rely on detectors often provide correct information about the position and timing of a traffic collision and be valid in a variety of applications [4]. Conventional detection systems focus on solely traffic data and still face some obstacles. Whereas, the use of field data to identify the occurrences of traffic accidents has shown the implicit premise that data could be trusted [5]. Nevertheless, there is a persistent issue with detector malfunctions and communication mistakes in the operations of traffic.
As far as the traditional prediction systems are concerned, the issue of malfunctioning sensors that are used for detection might generate even greater difficulties in the identification of accidents over wide territories. Second, the unpredictability of traffic patterns and the occurrence of one-off incidents may make it difficult to use traffic measurements to explain the number of people killed or injured in automobile accidents. In addition to collisions, regular traffic operations may be disrupted by a variety of other events and activities. Because of this, the metrics, which include the traffic flow and occupancy, primarily serve the purpose of providing indirect support rather than direct proof for the occurrence of traffic accidents. Instead of such methods, computer-based strategies such as data mining approaches and decision support systems that analyze massive datasets may produce better detection and prediction [6]. The issues of correct perdition on the bases of gathered data may be addressed by using these methodologies.
Traffic accidents are diverse case-by-case events, thus a lot of pertinent data is recorded in free-flow text fields rather than confined value fields [7]. Also, this leads to numerous accident features that are indescribable. Social media platforms have become an integral part of people’s lives and the primary repository of human language due to their importance as a means of communication, particularly in the Internet era. Every day, major social network sites publish hundreds of millions of pieces of unstructured text data. The information on these social network platforms on traffic accidents is far more in-depth and thorough than the information gathered about accident status in the conventional physical space [8] and includes both objective description and subjective analysis.
In recent years, the field of accident research has experienced the potential of data crowdsourcing as a supplement to existing methodologies and as a source of fresh information. In this research project, we investigate whether or if it is possible to monitor traffic incidents using Twitter. The microblogging site Twitter has attracted a growing amount of attention over the last several years [9,10]. Because of this, each tweet serves as a data source for the “We Media” platform, and it is perfectly feasible to extract the broad spectrum of information from large groups of people in a timely way. This research investigate the potential of utilizing tweets on Twitter as an additional data source for accident prediction. The information that is available on Twitter is both loud and unstructured. It is vital to utilize a text mining approach that is both efficient and effective to extract valuable information linked to accidents from tweets. In this investigation, we train and categorize accident-related tweets using two different forms of deep learning: deep neural networks (DNN) and long short-term memories (LSTM). We then compare these two approaches to deep learning. Deep learning, in contrast to other types of classifiers, does not look for direct functional relationships between the features that are fed into the system and the classifications that are produced by the system.
The rest of the paper is divided into the following sub-sections: Section 2 provides Literature Review, Section 3 describes the Proposed Methodology. The Result and Discussion is portrayed in Section 4. Finally, Section 5 provides the Conclusion and Future Work.
The rate of accidents is directly related to the pace of population growth, and few strategies have been developed to handle this issue. According to earlier studies, traffic accidents can be avoided if the motorist is familiar with the regions where the majority of accidents occur [11]. With conventional sensors, only traffic control centers can see the state of the traffic network at any one time. But, automated and automatic monitoring of traffic is required to provide real-time clarification of traffic situation. Many researchers have presented a plethora of approaches for analyzing traffic events. These systems relied mostly on information from a single data source whose data was formatted in a single language, but the proposed system has certain flaws: it may fail to automatically identify the cause of accidents or it may not improve traffic conditions concurrently. To design a perfect automatic system, researchers are continuously trying to overcome many challenging issues such as combining many data sources, validating the precise location of the post and detecting and anticipating traffic congestion [12,13]. This section discusses some of the state-of-the-art techniques that have been published in the past few decades. Whereas, Table 1 shows the additional techniques along with its description.

Historical data analysis will be valuable for finding accident hotspots. Rabbani et al. [3] created a conceptual framework for the construction of a model to identify accident-prone regions. Similarly to that Kaur et al. [14] have used correlation analysis and visualization approach with the R tool to analyse road accident and traffic collision data. They also develop an accident prediction model for state highways and typical district roads. Yannis et al. [15] have also presented a comparative study to discuss the accident findings. In their study, they discussed the existing procedures employed in the international development of accident prediction models. With the aid of surveys, detailed information on numerous models has been gathered and this data has been used by many researchers to determine which model is the best applicable for accident prediction.
Chen et al. [16] proposed a unified investigative substructure that united two predefined models, namely language-based modeling and the community deduction model, which were the sub-models of pivot misfortune Markov irregular fields (HLMRFs). By analyzing Twitter’s traffic obstruction architecture and connecting the generated data with genuine traffic speed data, the authors constructed a novel factual system that includes point models and pivots misfortune Markov arbitrary fields. According to the analysts, proposed model enable collaboratively deducing blocked street connections over the whole street network based on relevant tweet information [15]. They assessed the proposed model using real Twitter and INRIX traffic speed information to undertake thorough tests.
Williams et al. [17] found that the age of a driver as well as their amount of experience have a major role in determining the risk of them being involved in an accident. They evaluated the effectiveness of several different categorization algorithms to provide a comparative study of the factors that cause accidents. In their work, they highlight the work of Suganya et al. [18], who analyzed the road accidents in India and compared the accuracy, mistake rate, and execution time as performance metrics. Suganya et al. [18] findings may be found here. They discovered that K-Nearest Neighbors Algorithm (KNN) performed better than the other algorithms. A comparative study on the types of roadways that are frequently involved in accidents was conducted by Sarkar et al. [19]. They discovered that the frequency of accidents on highways is higher than that of accidents on a typical road comparable to [20] while investigating the other factors linked to accidents. To create a neural network model to predict accidents. In their work, they used original data. They discovered that this model could produce findings more quickly than the ones based on Indian roads.
The research article of Gutierrez-Osorio et al. [21] discussed the application of cutting-edge techniques and algorithms to evaluate and predict traffic accidents. They claim that research on accident prediction is a vital area of research since it has a considerable influence on people’s safety, health, and well-being. Accidents that occur in traffic are a major cause for concern all around the world. They assert that data made available by traffic organizations and road police forces have always been the primary source of information used in studies of traffic accidents. However, because social media platforms are so pervasive and easily accessible, it is now possible to have detailed and up-to-date information about road accidents in a particular region. This makes it possible for detailed studies to be conducted that take into account road accidents that have not been recorded. Their primary purpose was to provide a model that could anticipate traffic accidents by making use of data. This was the major objective of their study. They came up with an ensemble deep learning model that consisted of convolutional neural networks and gated recurrent units. The outcomes were contrasted with benchmark algorithms as well as outcomes reported by other researchers. Their results were encouraging and suggested that the proposed ensemble deep learning model performs better.
Due to labor-intensive incident reporting and limited sensor coverage, classic incident detection methods frequently have poor performance. The work of Yao et al. [22] used a Twitter text mining method to extract incident data. In their research, they used crawling, processing and filtering for publicly available tweets. In addition to this they also used an adaptive data capture, a dictionary of significant terms and their combinations to indicate traffic events. The deployed their methodology in the metropolitan areas of Pittsburgh and Philadelphia. They claimed that mining Tweets has enormous potential to cheaply supplement already-existing traffic incident data. They also concluded that majority of the occurrences recorded in the existing dataset are covered by a limited sample of tweets obtained from the Twitter application programming interface (API), and new instances can be found by reading and analyzing Tweets. The majority (60%–70%) of those geo codable Tweets are published by influential users (IU), i.e., public Twitter accounts that are typically run by news organizations and public agencies, while the remaining tweets come from individual users.
Support Vector Machine, natural language processing and other approaches that investigate the semantic aspects of the keywords are among the most frequent techniques for recognizing traffic-related events. However, since a tweet may only be up to 140 characters long and its content is intended to be brief, keyword recognition alone is not often sufficient for good natural language processing. For instance, the phrases “internet traffic is sluggish” and “internet indicates traffic is slow” may provide completely distinct pieces of information. Third, also owing to the word constraint, some tweet contents do not include adequate explanations of the occurrence kinds, even though some of the incidents may arise from their suppositions. This is a problem since some tweets have been shared by people who have been misinformed. Previous research had shown that utilizing Twitter keywords to gauge the mood of rider displeasure along specified routes (metro lines) was fruitful. When compared, the use of natural language for reporting traffic events might be more variable and challenging to record. These three issues will be statistically proven and thoroughly explored in the following portions of this article, which will focus on the key topics of this work.
The previous debate led to the conclusion that, even though the studies cited above have obtained good forecast results, the prediction models frequently rely on certain accident features. This was reached as a result of the previous discussion. They are far more susceptible to error as a result of the source, amount, and quality of the accident data, making their limits significantly more severe. In light of this, doing research on accident duration prediction using a method of prediction that is founded on principles of natural language processing offers a novel way of thinking about the problem.
This research presents an efficient method for converting tweets into information that may be used to anticipate future accidents. The key steps of the proposed model are data collection, data preprocessing and normalization, feature extraction including feature pairing and tokenization and finally traffic accident prediction using an innovative deep learning model. The schematic diagram of the proposed methodology is shown in Fig. 1.

Figure 1: Proposed conceptual framework
3.1 Data Collection and Normalization
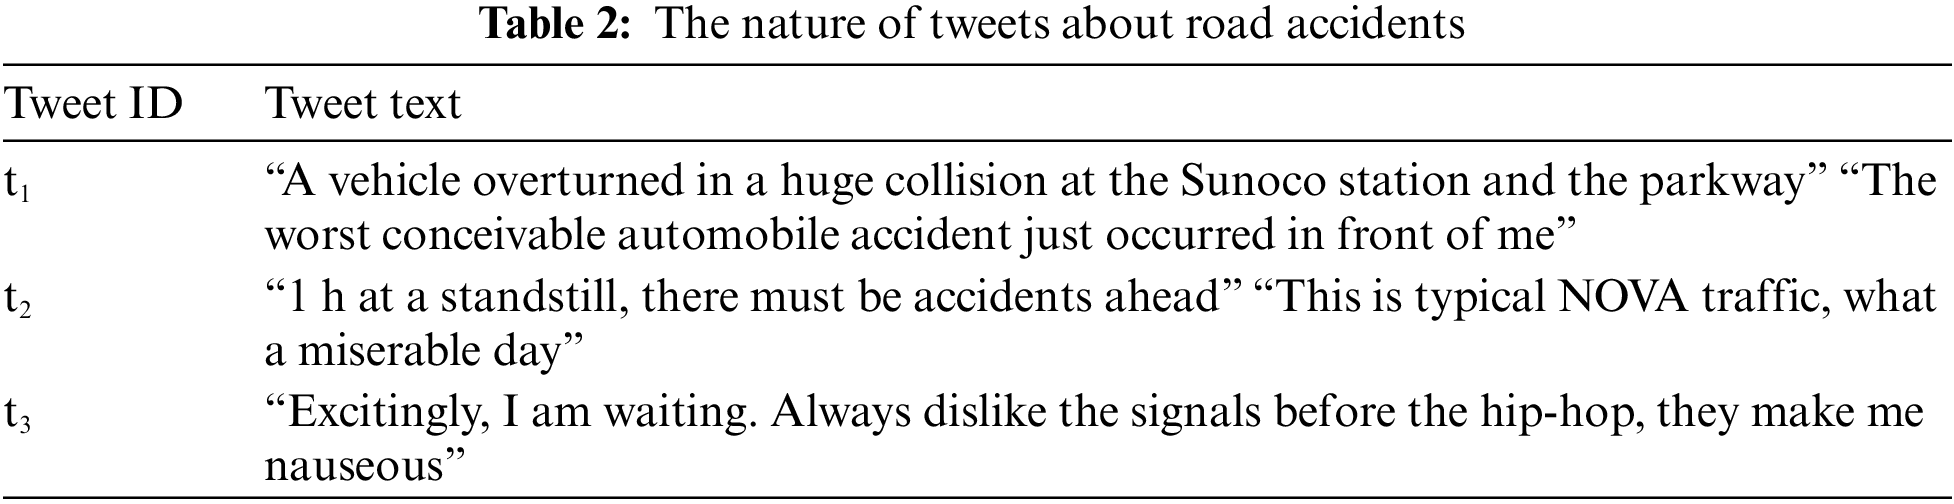
This research used information on accidents that was posted on Twitter in the form of a message, sometimes known as a “Tweet”. Twitter is a social networking service that allows users to immediately share and engage with information in the form of text, photos, and other forms of multimedia. This service is built on the foundation of social connections. These data include information content that satisfies the standards of the experimental data for this study, such as a description of the accident state, the time of the accident, and the location of the accident. In Table 2, you can see an example of a Tweet.
Twitter’s Streaming API was used to gather tweet data, and a geolocation filter was applied. We set study area boundary boxes using a coordinate filter, resulting in the collection of more than 584,000 geotagged tweets over an entire year, from January 2022 to December 2022. Every tweet that is posted comes with its date, time, and geographical information. The location information consists of a pair of latitude and longitude coordinates that indicate where the tweets were posted. Finally, 1073 valid accident data with complete time tags were obtained.
Algorithm 1 shows the preprocessing and normalization process of the dataset. Only tweets that include clear evidence of a traffic accident are taken into consideration for this research. Tweets about traffic congestion, construction work, and other similar topics are not taken into consideration since these topics may not always imply traffic accidents. These prospective tweets should, in most cases, include one or more terms such as “accident” or “crash” that are connected in some way to the accident. Select tweets at random from the list of tweets that have been filtered and manually classified on whether or not they are linked to an accident. Later on, it has been determining which terms appear most often in tweets relating to accidents. Whereas, in the normalization procedure, the text data from Tweets are first tokenized and then vectored. The primary purpose of the preprocessing is to carry out the tasks of word separation from the text data and deactivation. In addition to this, the text vector representation is intended to transform unstructured text data into structured data that can be understood by computers.

In this section, features from the structured Tweet database are selected for presentation. The primary objective of feature selection is to choose a subset of characteristics based on the source documents. This process retains the words that have the greatest score on a predefined assessment of the value of the word [23]. In this work, two distinct types of features (individual features and paired features) have been obtained. The phi coefficient [24], which may assess the degree to which a manual label is associated with a token, is the standard that we have decided to use for each particular token characteristic.

The individual features are obtained by using a standard part-of-speech (POS) tagging procedure [25]. The identification of individual features is significantly aided by the use of POS terminology. At this point, using Stanford Core Natural Language Processing (NLP), POS tagging is carried out on each Tweet that is being reviewed. The point-of-sale tag shown in. In this particular piece of work, the POS tag is utilized to determine which words in the review sentence are nouns, adjectives, and verbs respectively. In most cases, the nouns or noun phrases that resulted from the POS tag were represented as a feature. Pseudocode for the POS tagging process has been described in Pesudo code 1, while some of its obtained results have been depicted in Table 3.

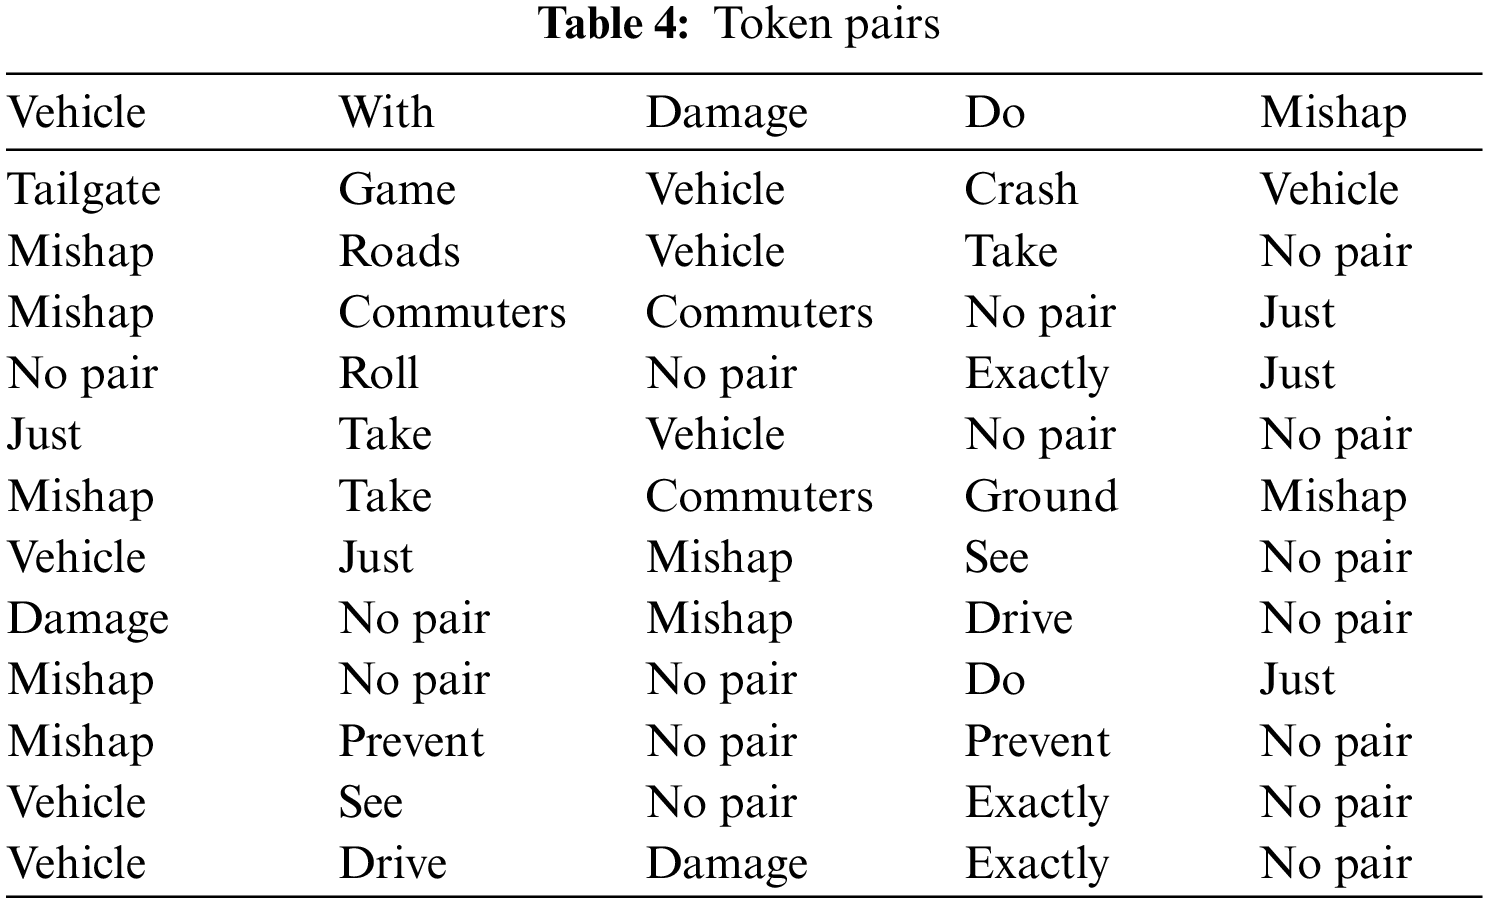
Features derived from individual tokens are not always sufficient because they have the potential to ignore the linkages that exist within the tokens themselves. Sometimes, the signs provided by such relationships might be far more important than those provided by solitary ones. For instance, the inclusion of the term “vehicle” in a Twitter post that also contains the phrase “accident” would make the likelihood of an accident-related event more likely. On the other hand, the likelihood may go down if there was an occurrence of a token “vehicle” that was conditioned by “maintenance” or “repair”. Therefore, in this work, the paired token features have also been obtained by using the association rules. The Apriori algorithm has the capability of revealing the association rules [18]. The Apriori algorithm searches for patterns in vast amounts of binary data based on support and confidence probabilities, the two most important kinds of probabilities.
If we start with a stemmed token tj and look at all stemmed tokens, the support of
where
In the vast majority of the earlier research, providing support and confidence in the environment was occasionally required. The support option may be a very low amount, and it can include any number of paired tokens for the Feature Selection process. When compared, the level of confidence typically has a significant influence on the findings, and various values should be further studied in the classification for the implications they have on the classification. An empirical investigation is carried out to investigate how the token characteristics may indicate the language used by custom soft tweets in narrating traffic incidents. 38 token pairings may be found in Table 4 when the support value is equal to 0.01 and the confidence value is equal to 0.1. Table 4 shows the majority of the association rules.
When the level of confidence is more than 0.6, the number of unique tokens that are connected virtually does not vary at all. The paired token features in the database have the same meaning as the individual token features; they have a value 1 if the tweet includes the appropriately paired tokens, and they have a value of 0 otherwise. To carry out the study, we will include paired token characteristics in the regression model.
The section discusses the Proposed eXtreme Language understanding Network-Bidirectional Long Short-Term Memory (XLNet-Bi-LSTM) based prediction model. The input of traditional Bidirectional Encoder Representations from Transformers (BERT) was given as an input to the neural network. In this work, the traditional BERT model is replaced with XLNet and BI-LSTM to the neural network.
In 2019, Google AI announced the introduction of a new permutation language model under the name XLNet which is formed by the combined properties of auto-regressive and auto-encoder language models [19]. This model is quite comparable to BERT and the auto-regressive strategy automatically predicts the subsequent output. Fig. 2 explains the working of XLNet model. For example the Tweet “The worst conceivable automobile accident just occurred in front of me”. Due to the method of TransFormer-XL that XLNet proposes, it may enhance the information of the extracted context and thus demonstrate numerous benefits in the NLP of long document input type. Because of the aforementioned features of XLNet, each token can be fully represented following the sentence’s semantics.

Figure 2: XLNet model architecture
In this study, we leverage Google’s XLNet model to improve the accuracy of the findings. We structure the tokens into the XLNet-specific format and input this information into XLNet. XLNet takes use of bigger mini-batches, learning rates, and step sizes, in addition to adjustments in the masking approach, so that it can train for a longer length of time. This allows it to train for a longer amount of time. Yet, there is no guarantee that the model’s performance will be outstanding, even if it is pre-trained on a much larger quantity of data. In addition, it might be challenging to choose the pre-trained model that would provide the best results for a certain task from among the models that have been trained on a range of datasets.
The XLNet sentence representation is fed into the Bi-directional long short term memory (Bi-LSTM). Bi-LSTM, is a neural network that is capable of having sequence information in both ways, either backward (from the future to the past), or forwards (past to future) [26]. Fig. 3 shows the working of Bi-LSTM. The input of a Bi-LSTM moves in both directions during a bidirectional operation, which sets it apart from a conventional LSTM in a significant manner. Bi-directional semantic dependencies are more effectively captured by the Bi-LSTM. For the Tweet “The worst conceivable automobile accident just occurred in front of me”. The forward LSTM will generate 11 vectors {Vf0, Vf1, Vf2, Vf3, Vf4, Vf5, Vf6, Vf7, Vf8, Vf9, Vf10, Vf11} and backward LSTM will generate 11 vectors {Vl0, Vl1, Vl2, Vl3, Vl4, Vl5, Vl6, Vl7, Vl8, Vl9, Vl10, Vl11}. At the end, the vector is formed by splicing the forward and backward vectors {Vf0, Vl11}, {Vf1, Vl10}, {Vf2, Vl9}, {Vf3, Vl8}, {Vf4, Vl7}, {Vf5, Vl6}, {Vf6, Vl5}, {Vf7, Vl4}, {Vf8, Vl3}, {Vf9, Vl2}, {Vf10, Vl1}, {Vf11, Vl0}. The XLNet vector output is passed into the Bi-LSTM for final prediction. Bi-LSTM can estimate the likelihood of each word matching each tag. The values with the highest likelihood are highlighted. The context information can be learned by the Bi-LSTM. Nevertheless, feature analysis at the sentence level is not possible.

Figure 3: A typical Bi-LSTM model adopted from baeldung.com [27]
3.3.3 XLNet-Bi-LSTM Prediction
The working mechanism of the proposed XLNet-Bi-LSTM is shown in Fig. 4. The word embedding layer created by XLNet is the top layer of the model. The dropout rate is designed to reduce overfitting prior to moving on to the next layer. The Bi-LSTM layer, which is the second layer of the model, can automatically extract key features from the Tweet. The Bi-LSTM output is created by combining the forward and backward concealed results. The third layer realizes sequence annotation at the sentence level. The whole process of prediction is explained with the following example of a Tweet. “This was a horrible accident”. Initially, the Tweet is divided into a token by applying the feature extraction process of Section 3.2 to obtain [this, was, a, horrible, accident]. Following that, the tokens are transferred to XLNet. The arrangement of tokens is shuffled around in XLNet so that word embeddings may be represented more precisely.

Figure 4: Proposed XLNet-BI-LSTM prediction model
The label with the highest likelihood is the one that ultimately provides the inadvertent prediction of the entire Tweet. The last layer receives the probability output from the BiLSTM at this point. The correlation of all tags predicted in the full sentence is taken into account in the final layer. To obtain the final prediction, the aforementioned scenario must take place. To eventually determine the likelihood of the tag sequence, the final layer again re-adjusts the sequence.
The results of the classification performed by the XLNet-Bi-LSTM on the dataset are displayed in this section. An artificial neural network, a support vector machine, and a method for topic modeling called supervised latent Dirichlet allocation are used for comparisons (sLDA).
The experiment has been carried out with the help of three different types of Tweet dataset that has been obtained by using Twitter API from the prescribed link. A keywords-based search strategy has been applied to search the accident-related Tweets. The description of each dataset has been presented in Table 5.

To evaluate the effectiveness of the prediction model, it is necessary to assess the accuracy of the prediction model. Using the metrics precision, recall and F-measure are also used as a model to evaluate the proposed work.
The performance of an individual section of the proposed prediction model has also been analyzed by a 2 × 2 categorical confusion matrix as depicted in Table 6. True Positives (TP) and True Negatives (TN) represent the number that represents the accurately predicted records, while False Negatives (FN) and False Positives (FP) represent the number of incorrectly predicted pathogenic and neutral cases, respectively.

In this section, we discuss the experimental evaluation and performance of the proposed work with multiple deep-learning models. From the experiment, it has been shown that the proposed XLNet-Bi-LSTM model achieved 94.2% prediction accuracy. In the very first experiment, the predicted outcome of the intended work is depicted in the Tweet as either an accident or not. We ran an experiment on IDS1, IDS2, and IDS3 separately to gauge the effectiveness of our architecture. Confusion matrices for each dataset are displayed in Fig. 5 and include True Positives, True Negatives, False Positives, and False Negatives.

Figure 5: Confusion matrix pertaining the results on TDS1, TDS2 and TDS3
Table 7 shows the statistics of the accuracy, precision, recall and F-score of each dataset. From it, it has been shown that the proposed model predicts the accident and non-accident gadgets more bitterly.

For the test dataset, Fig. 6 shows the performance indicators of the proposed work with those of the DNN [25], Gene Expression Programming (GEP) [26], and Random Effect Negative Binomial (RENB) [27] models. The findings indicate that, when compared to the DNN, GEP, and RENB models, the proposed model had the greatest accuracy rate. The suggested work outperforms the DNN model, GEP, and RENB model, as shown in Fig. 6.

Figure 6: Performance comparison of the proposed model with existing models
Traffic accident severity is a major global issue, particularly in developing countries. Understanding the primary causes and mitigating factors may help to know the severity of traffic accidents. By utilizing the datasets from various social media platforms like Twitter, blogs and Facebook, there are numerous machine learning models and decision support systems to anticipate traffic accidents. Although these methods are very popular, there are still data management and forecast accuracy problems. To anticipate traffic collisions based on data gathered from social media, this paper introduced the XLNet-Bi-LSTM sentiment analytic model, which is based on deep learning. A Tweet dataset was initially created by employing a thorough keyword-based search method. The use of POS tagging and association rule mining has yielded two distinct sorts of features in the next phase, referred to as individual tokens and pair tokens. A three-layer deep learning model was used to finalize the prediction with the output from this step. The effectiveness of the suggested XLNet-Bi-LSTM model has been tested in several experiments. The proposed model has demonstrated a prediction accuracy of 94.2%. Future theoretical studies are encouraged to include more influencing factors and surveillance it on different types of roads and regions.
Acknowledgement: The authors would like to acknowledge the support of Prince Sultan University for paying the Article Processing Charges (APC) of this publication.
Funding Statement: The authors received no specific funding for this study.
Author Contributions: N. Malik: Methodolgy, Writing—Original Draft, Writing, S. Altaf: Conceptualization, Writing—Review & Editing, M. U. Tariq: Validation, A. Ahmed: Formal Analysis, M. Babar: Review and Editing, Formal Analysis. All authors reviewed the results and approved the final version of the manuscript.
Availability of Data and Materials: Not applicable.
Conflicts of Interest: The authors declare that they have no conflicts of interest to report regarding the present study.
References
1. P. Gorzelanczyk, “Application of neural networks to forecast the number of road accidents in provinces in Poland,” Heliyon, vol. 12, no. 1, pp. e12767, 2023. [Google Scholar]
2. F. Hafeez, U. U. Sheikh, S. Al-Shammari, M. Hamid, A. B. K. Khakwani et al., “Comparative analysis of influencing factors on pedestrian road accidents,” Bulletin of Electrical Engineering and Informatics, vol. 12, no. 1, pp. 257–267, 2023. [Google Scholar]
3. M. B. A. Rabbani, M. A. Musarat, W. S. Alaloul, S. Ayub, H. Bukhari et al., “Road accident data collection systems in developing and developed countries: A review,” International Journal of Integrated Engineering, vol. 14, no. 1, pp. 336–352, 2022. [Google Scholar]
4. A. Azhar, S. Rubab, M. M. Khan and Y. A. Bangash, “Detection and prediction of traffic accidents using deep learning techniques,” Cluster Computing, vol. 26, no. 1, pp. 1–17, 2022. [Google Scholar]
5. A. Khan, “Improved multi-lingual sentiment analysis and recognition using deep learning,” Journal of Information Science, vol. 1, no. 1, pp. 1–16, 2023. [Google Scholar]
6. M. A. El-Affendi, K. Alrajhi and A. Hussain, “A novel deep learning-based multilevel parallel attention neural (MPAN) model for multidomain arabic sentiment analysis,” IEEE Access, vol. 9, no. 1, pp. 7508–7518, 2021. [Google Scholar]
7. K. V. Dudekula, H. Syed, M. I. M. Basha, S. I. Swamykan, P. P. Kasaraneni et al., “Convolutional neural network-based personalized program recommendation system for smart television users,” Sustainability, vol. 15, no. 3, pp. 2206, 2023. [Google Scholar]
8. I. Sindhu, S. M. Daudpota, K. Badar, M. Bakhtyar, J. Baber et al., “Aspect-based opinion mining on student’s feedback for faculty teaching performance evaluation,” IEEE Access, vol. 7, no. 1, pp. 108729–108741, 2019. [Google Scholar]
9. L. Zhou, Z. Zhang, L. Zhao and P. Yang, “Microblog sentiment analysis based on deep memory network with structural attention,” Complex & Intelligent Systems, vol. 9, no. 1, pp. 3071–3083, 2023. [Google Scholar]
10. H. N. Chaudhry, Y. Javed, F. Kulsoom, Z. Mehmood, Z. I. Khan et al., “Sentiment analysis of before and after elections: Twitter data of US election 2020,” Electronics, vol. 10, no. 17, pp. 2082, 2021. [Google Scholar]
11. T. Yigitcanlar and N. Kankanamge, “Social media analytics platforms,” in Urban Analytics with Social Media Data, 1st ed., vol. 1. Boca Raton, Florida, USA: CRC Press, pp. 1–48, 2020. [Google Scholar]
12. A. Chand, S. Jayesh and A. B. Bhasi, “Road traffic accidents: An overview of data sources, analysis techniques and contributing factors,” Materials Today: Proceedings, vol. 47, no. 1, pp. 5135–5141, 2021. [Google Scholar]
13. B. Alkouz and Z. Al Aghbari, “SNSJam: Road traffic analysis and prediction by fusing data from multiple social networks,” Information Processing & Management, vol. 57, no. 1, pp. 102139, 2020. [Google Scholar]
14. G. Kaur and E. Kaur, “Prediction of the cause of accident and accident prone location on roads using data mining techniques,” in 8th Int. Conf. on Computing, Communication and Networking Technologies, Delhi, India, pp. 1–7, 2017. [Google Scholar]
15. A. G. Yannis, A. Dragomanovits, A. Laiou and T. Richter, “Use of accident prediction models in road safety management—An international inquiry,” Transportation Research Procedia, vol. 14, pp. 4257–4266, 2016. [Google Scholar]
16. P. Chen, F. Chen and Z. Qian, “Road traffic congestion monitoring in social media with hinge-loss Markov random fields,” in 2014 IEEE Int. Conf. on Data Mining, Shenzhen, China, pp. 80–89, 2014. [Google Scholar]
17. T. Williams, J. Betak and B. Findley, “Text mining analysis of railroad accident investigation reports,” in 2016 Joint Rail Conf., Columbia, USA, pp. 1–5, 2016. [Google Scholar]
18. E. Suganya and S. Vijayarani, “Analysis of road accidents in India using data mining classification algorithms,” in 2017 Int. Conf. on Inventive Computing and Informatics, Coimbatore, India, pp. 1122–1126, 2017. [Google Scholar]
19. S. Sarkar, V. Pateshwari and J. Maiti, “Predictive model for incident occurrences in steel plant in India,” in Int. Conf. on Computing, Communication and Networking Technologies, Delhi, India, pp. 1–5, 2017. [Google Scholar]
20. Z. Y. Chen and C. C. Chen, “Identifying the stances of topic persons using a model-based expectation maximization method,” Journal of Information Science and Engineering, vol. 31, no. 2, pp. 573–595, 2015. [Google Scholar]
21. C. Gutierrez-Osorio, F. A. González and C. A. Pedraza, “Deep learning ensemble model for the prediction of traffic accidents using social media data,” Computers, vol. 11, no. 9, pp. 126, 2022. [Google Scholar]
22. F. Yao and Y. Wang, “Towards resilient and smart cities: A real-time urban analytical and geo-visual system for social media streaming data,” Sustainable Cities and Society, vol. 63, no. 1, pp. 102448, 2020. [Google Scholar]
23. M. Haghani and A. Behnood, “Structural anatomy and temporal trends of road accident research: Full-scope analyses of the field,” Journal of Safety Research, vol. 79, no. 1, pp. 173–198, 2021. [Google Scholar] [PubMed]
24. R. Yan, X. Jiang and D. Dang, “Named entity recognition by using XLNet-BiLSTM-CRF,” Neural Processing Letters, vol. 53, no. 5, pp. 3339–3356, 2021. [Google Scholar]
25. F. Ali, S. El-Sappagh and D. Kwak, “Fuzzy ontology and LSTM-based text mining: A transportation network monitoring system for assisting travel,” Sensors, vol. 19, no. 2, pp. 234, 2019. [Google Scholar] [PubMed]
26. I. Ashraf, S. Hur, M. Shafiq and Y. Park, “Catastrophic factors involved in road accidents: Underlying causes and descriptive analysis,” PLoS One, vol. 14, no. 10, pp. e0223473, 2019. [Google Scholar] [PubMed]
27. J. Tang, S. Yang and W. Wang, “Social media-based disaster research: Development, trends, and obstacles,” International Journal of Disaster Risk Reduction, vol. 55, no. 1, pp. 102095, 2021. [Google Scholar]
Cite This Article
 Copyright © 2023 The Author(s). Published by Tech Science Press.
This work is licensed under a Creative Commons Attribution 4.0 International License , which permits unrestricted use, distribution, and reproduction in any medium, provided the original work is properly cited.
 Downloads
 Citation Tools