
 Submit a Paper
 Propose a Special lssue
 Open Access
ARTICLE

Optimizing Fully Convolutional Encoder-Decoder Network for Segmentation of Diabetic Eye Disease
1
Faculty of Information Technology, Beijing University of Technology, Beijing, 100124, China
2
College of Information Science Technology, Hainan Normal University, Haikou, 571158, China
* Corresponding Author: Guangmin Sun. Email:
(This article belongs to the Special Issue: Recent Advances in Ophthalmic Diseases Diagnosis using AI)
Computers, Materials & Continua 2023, 77(2), 2481-2504. https://doi.org/10.32604/cmc.2023.043239
Received 26 June 2023; Accepted 30 September 2023; Issue published 29 November 2023
 View Full Text
 Download PDF
Abstract
In the emerging field of image segmentation, Fully Convolutional Networks (FCNs) have recently become prominent. However, their effectiveness is intimately linked with the correct selection and fine-tuning of hyperparameters, which can often be a cumbersome manual task. The main aim of this study is to propose a more efficient, less labour-intensive approach to hyperparameter optimization in FCNs for segmenting fundus images. To this end, our research introduces a hyperparameter-optimized Fully Convolutional Encoder-Decoder Network (FCEDN). The optimization is handled by a novel Genetic Grey Wolf Optimization (G-GWO) algorithm. This algorithm employs the Genetic Algorithm (GA) to generate a diverse set of initial positions. It leverages Grey Wolf Optimization (GWO) to fine-tune these positions within the discrete search space. Testing on the Indian Diabetic Retinopathy Image Dataset (IDRiD), Diabetic Retinopathy, Hypertension, Age-related macular degeneration and Glacuoma ImageS (DR-HAGIS), and Ocular Disease Intelligent Recognition (ODIR) datasets showed that the G-GWO method outperformed four other variants of GWO, GA, and PSO-based hyperparameter optimization techniques. The proposed model achieved impressive segmentation results, with accuracy rates of 98.5% for IDRiD, 98.7% for DR-HAGIS, and 98.4%, 98.8%, and 98.5% for different sub-datasets within ODIR. These results suggest that the proposed hyperparameter-optimized FCEDN model, driven by the G-GWO algorithm, is more efficient than recent deep-learning models for image segmentation tasks. It thereby presents the potential for increased automation and accuracy in the segmentation of fundus images, mitigating the need for extensive manual hyperparameter adjustments.Keywords
Diabetes mellitus, more often referred to simply as diabetes, is a condition characterized by excessive blood sugar levels owing to inadequate insulin synthesis or an inappropriate insulin reaction by the body. It is a significant worldwide health complication primarily caused by a sedentary lifestyle, obesity, aging, as well as poor eating habits. The number of people diagnosed with diabetes is rising alarmingly, with an estimated 116 million individuals who have diabetes, according to the international diabetes federation (IDF) [1]. According to projections, around 700 million individuals throughout the globe will have diabetes by 2045 [2]. Diabetes can lead to various medical complications, including nerve damage, cardiovascular disease, kidney failure, and diabetic eye disease (DED). DED, which comprises diabetic macular edema (DME), diabetic retinopathy (DR), cataracts (CA), and glaucoma (GA), is the most common reason for blindness and visual impairment among people of working age. DED symptoms, such as abnormal blood vessel growth, lens degradation, optic nerve damage, and macular swelling, can appear in the retina [3]. Effective treatments for DED, including corticosteroids, laser photocoagulation, as well as anti-vascular endothelial growth factor injections, exist. However, early diagnosis is crucial for preventing vision loss, as DED often shows no symptoms in the preliminary stage. As a result, international and regional recommendations stress the need for monitoring for DED in diabetes patients [4].
The growing population of diabetes patients exceeds the number of retinal specialists worldwide, leading to prolonged waiting times for screening and diagnosis. Automated DED screening systems can address this issue by providing a cost-effective and rapid point-of-care solution. Traditional manual examination of colour retinal fundus images by ophthalmologists is difficult, expensive, time-consuming, and not immediately responsive to patients. On the other hand, automated DED screening systems can quickly analyze retinal images captured during regular screenings, saving time and cost. Early detection of DED through automated systems can prevent complete vision loss; with early diagnosis and treatment, 90% of cases can be prevented. Implementing automated DED detection systems would significantly benefit early screening, treatment, and prevention of vision loss caused by DED. According to the World Health Organization (WHO), DME and diabetic retinopathy may increase by 47% by 2024% and 71% by 2034 if not addressed. Glaucoma is also rising, particularly in older age groups and those with diabetes. Automated DED detection systems can be crucial in early screening, treatment, and preventing vision loss [5].
Deep learning (DL) methods, in particular Convolutional Neural Networks (CNNs), have become important tools in computer vision [6–9]. However, standard CNN architectures designed for image classification may not effectively handle segmentation problems, such as pixel-level classification in semantic segmentation [10,11]. To address this, Fully Convolutional Networks (FCNs) were developed, substituting the fully connected (FC) layer with convolution (Conv) along with de-Conv layers to improve pixel-level segmentation [12–15]. FCNs eliminate dense layers, reducing network parameters and enabling faster training. Typically, FCN structural design includes convolution (Conv), ReLU, pooling, and an un-pooling (UP) layer. Conv and pooling layers downsample image features, while the UP layer upsamples the output to match the input size. On the other hand, the fact that FCN only utilizes a non-trainable and up-sampling (US) layer can restrict performance [13]. In order to improve pixel-level segmentation, a variation known as a fully convolutional encoder-decoder network (FCEDN) is presented. This network incorporates a trainable encoder along with decoder components in its architecture [16,17]. The encoder consists of max-pooling (MP), Convolution (Conv), and dropout layers (DO) for feature extraction. At the same time, the decoder comprises transpose Conv (TC), dropout, UP, and US layer-by-layer output encoding. The output layer’s measurements match the input image’s ground-truth to complete decoding. It is more productive than the FCN, which only has a non-trainable US layer since the encoder and the decoder in Fully Convolutional Encoder-Decoder Network (FCEDN) are trainable.
Deep learning methods, predominantly CNNs, have garnered interest in improving segmentation performance in computer vision. FCNs replace the FC layer of CNNs with both Conv and de-Conv layers; their performance is limited by a single non-trainable US layer [13]. To address this, we propose an FCEDN variant comprising both encoders, decoder components, and fewer layers, resulting in improved pixel-level segmentation performance. Determining the optimal hyperparameters for FCEDN, such as layer numbers, kernel sizes, dropout rates, and learning rate, can significantly enhance its performance. However, optimizing these hyperparameters manually is time-consuming. Optimization techniques like Particle Swarm Optimization (PSO), Quantum PSO, unevolutional encoding, and Grey Wolf Optimization (GWO) have been applied to CNN hyperparameter optimization. Still, no evidence exists for FCEDN hyperparameter optimization [18–21].
In this research, an FCEDN model is developed to carry out pixel-level image segmentation. The FCEDN hyperparameters are tuned using a novel Genetic Grey Wolf Optimization (G-GWO) method rather than being manually specified. GWO has developed as a potential way out to many optimization issues in recent years by simulating leadership hierarchy as well as group hunting behaviour in GW’s [22–25]. Since the inception of GWO, several versions of methods for accelerating convergence while minimizing local optimums have been developed [26–28]. This paper suggested a novel form of GWO called G-GWO that uses GA to construct a significantly more suitable beginning population. Results have been compared to alternative nature-based approaches, and the technique is evaluated on five conventional unimodal as well as five common multimodal benchmarking functions. When G-GWO is compared to the conventional benchmark functions, it outperforms four different variations of the GA, GWO, as well as PSO algorithms. This approach was formerly utilized to optimize the hyperparameters of an FCEDN model, resulting in an efficient model. The major focus is on finding good approximations for the hyperparameters of the FCEDN’s Conv, pooling, TC, UP, and dropout layers. The last stage is to build an FCEDN system using these adjusted hyperparameters and validate its segmentation results on picture datasets. The model applies to any form of classification job as well as any other image segmentation challenge. The DME, DR, and GA image datasets IDRiD [29], DR-HAGIS [30], and ODIR [31] are utilized in this work to assess the model’s successiveness. Extensive quantitative results performed on DED image datasets demonstrated the effectiveness of the G-GWO approach in terms of the Jaccard coefficient along with Jaccard loss, Sensitivity, accuracy, Specificity, and Precision when compared to the GA [32], PSO, GWO [21], Modified GWO (mGWO) [26], Enhanced [27] and incremental [28] GWO. We evaluate the segmentation performance of the hyperparameter-optimized FCEDN model based on G-GWO on the same dataset as other recently created segmentation networks, including Link-Net, U-Net, Seg-Net, as well as FCN.
The following are some of the most significant contributions of this study:
• The study introduces a novel combination of Genetic and Grey Wolf Optimization algorithms to optimize FCEDN.
• G-GWO addresses the limitations of the typical GWO algorithm by incorporating genetic crossover in addition to mutation operators for faster exploration to improve solution quality.
• The effectiveness of G-GWO is demonstrated through comparisons with other nature-inspired optimization algorithms on benchmark functions.
• In addition, G-GWO is implemented in order to fine-tune the FCEDN hyperparameters for pixel-level segmentation.
• Simulations conducted on DED show that G-GWO outperforms other optimization algorithms with high accuracy.
The remaining sections of the paper are as follows: Section 2 covers some of the most recent developments in FCN with hyperparameter tuning based on nature-inspired algorithms. The methodology is discussed in detail in Section 3. Section 4 describes the suggested model, whereas Section 5 presents and discusses the findings in depth. Section 6 provides a concise summary of the study’s findings.
Semantic image segmentation, particularly in retinal disease, is important for effective diagnosis and treatment in ophthalmology. It involves identifying and delineating object boundaries within an image. One popular approach for image segmentation is the use of FCNs, which have gained prominence and continue to advance rapidly.
Numerous image segmentation networks based on FCNs have been reported in the literature. In [12], semantic segmentation using the FCN model incorporates skip architecture to combine semantic and appearance information. Another U-Net network [14] employs a U-shaped architecture with contracting and expanding paths to propagate context information and enable precise localization. In [11], a pixel-level image classification FCN model using the VGG-16 network was introduced, where the last layers were randomly initialized. SegNet [13], a deep FCN architecture, demonstrated superior performance associated with DeepLab-LargeFOV, FCN, as well as DeconvNet. A combination of FCN, SegNet, and U-Net was proposed in [15] for pleural cell nuclei segmentation, outperforming individual models and majority voting. For hepatocellular carcinoma diagnosis, a computer-aided diagnosis (CAD) system integrating CNN and FCN was proposed [16], incorporating skip structures’ to aid with liver along with tumour segmentation. Additionally, by combining FCN-8 and SegNet was developed for plantar pressure image segmentation [17].
DL techniques have proven effective for retinal image segmentation in the context of cancer disease. Reference [33] introduced a DL framework based on the U-Net model for optic disc recognition in DR. The author employed CNNs to process retinal fundus images and employed a U-Net framework to identify local images for further segmentation. The (Optic Disc) OD and (Optic Cup) OC identification were performed in [34] using watershed transformation and morphological filtering techniques. The exudate detection technique proposed by Prentašić et al. [35] utilized a deep convolutional neural network for feature extraction and a Support Vector Machine (SVM) classifier for classification, along with morphological procedures and curve modelling. Glaucoma optic neuropathy screening was addressed in [36] using Inception-v3 in conjunction with mini-batch gradient descent and the Adam optimizer. A disc-aware ensemble network combining global and local image levels was developed for automated glaucoma screening, incorporating a residual network (ResNet) and a U-shaped convolutional network [14].
Several other studies have proposed image segmentation and classification techniques for different applications. Santos Ferreira et al. [37] trained an OD segmentation U-Net convolutional network and utilized texture-based features for classification. Zhang et al. [38] investigated a deep convolutional neural network (DCNN) for cataract detection and grading. At the same time, Ran et al. [39] proposed a deeper network combining DCNN and an RF classifier for cataract grading. Xu et al. [40] presented a local-global feature representation using an ensemble of CNNs and deconvolution networks (DN) for cataract classification. Li et al. [41] developed an 18-layer deep neural network for cataract diagnosis and localization, and Dong et al. [42] used the Caffe framework with a softmax classifier for cataract classification. GoogLeNet-CAM and AlexNet-CAM models were introduced by Li et al. [43] for automatic cataract detection, leveraging class activation maps (CAM) with pertained GoogLeNet and AlexNet models.
The selection of hyperparameters is crucial in optimizing the performance of deep learning networks [21]. However, manual tuning of hyperparameters can be time-consuming and challenging, especially with complex FCN architectures. Researchers have offered many methods, such as those based on nature-inspired algorithms, as potential solutions to overcome this problem. A variant of PSO [18] and Quantum Behaved PSO [19] to tune CNN hyperparameters. Univariate dynamic encoding was utilized in [20] to optimize CNN hyperparameters, while multiscale and multilevel evolutionary optimization (MSMLEO) multiscale and multilevel evolutionary optimization (MSMLEO) with Gaussian process-based Bayesian optimization (GPEI) was proposed in [11]. In a recent study [21], the GWO algorithm was employed to optimize the hyperparameters of CNNs for classification, achieving improved performance. The optimized hyperparameters were used to build and train the CNN model using the backpropagation algorithm for multiclass DED detection. While nature-inspired algorithms have been used for CNN hyperparameter selection, no studies have focused on the hyperparameter optimization of FCN. This study introduces a novel algorithm based on GWO [22], which simulates the social and hunting behaviour of GWs. Several GWO variants have been proposed, including MGWO [44], EGWO [27], RL-GWO [45], Ex-GWO, and Incremental Grey Wolf Optimizer [25].
Additionally, I-GWO [26] incorporates a dimension learning-based hunting strategy. It is important to keep in consideration, nevertheless, that the original GWO population starts entirely randomly. It might lead to a lack of diversity among the wolf packs as they scour the landscape for prey. It has been shown in several studies that an initial population with adequate diversity is extremely beneficial for enhancing the effectiveness of optimization algorithms and that this diversity can have a significant effect on the global convergence speed and the quality of the final solution. Based on this central concept, we attempted for the first time to utilize GA to produce a much more suitable starting population; after that, GWO was built to carry out using the diverse population. The G-GWO algorithm is applied to optimize hyperparameters for an effective FCEDN model used to segment DED fundus images.
The following section covers the fundamentals of the G-GWO optimization algorithm and how it relates to FCEDN’s architecture and hyperparameters.
3.1 Fully Convolution Encoder-Decoder Network (FCEDN)
CNNs have gained popularity in computer vision due to their effective feature extraction, prediction, and classification competencies [11]. However, when directly applied to image segmentation, standard CNN architectures designed for image classification yield poor results. This is because fully connected layers in CNNs ignore spatial data and provide a single class likelihood value, but pixel-level classification is necessary for semantic segmentation. To improve segmentation performance at the pixel level, FCNs were developed and used to replace the fully linked layer with Conv and de-Conv layers. FCNs offer portability and time-saving advantages by eliminating fully-connected layers [12]. There are two approaches to implementing semantic segmentation in FCNs. The first approach involves constructing the FCN architecture with Conv, ReLU, pooling, and UP layers [12]. Convolution and pooling layers downsample image features, while the UP layer performs final upsampling. However, this approach may result in limited performance due to a lack of a trainable UP layer, potentially losing spatial information. The second approach employs an encoder-decoder architecture, where the encoder consists of CNN-like layers, and the decoder uses TC and UP to upsample feature maps [13]. The trainable parameters in the up-sampling layers significantly improve semantic segmentation. In this study, we propose an FCN with an encoder with decoder mechanisms (FCEDN) to enhance the effectiveness of pixel-level segmentation. The encoder comprises Conv, dropout, and MP layers for feature extraction through down-sampling. The trainable decoder employs TC, UP, and dropout layers to progressively US the encoded output layer. The decoding process concludes through an output layer that matches the ground-truth dimensions of the input image. Compared to FCNs with a non-trainable layer for US, the dual trainable encoder/decoder architecture of FCEDN achieves superior performance. Fig. 1 illustrates an evaluation of the FCEDN, CNN, and FCN architectures.
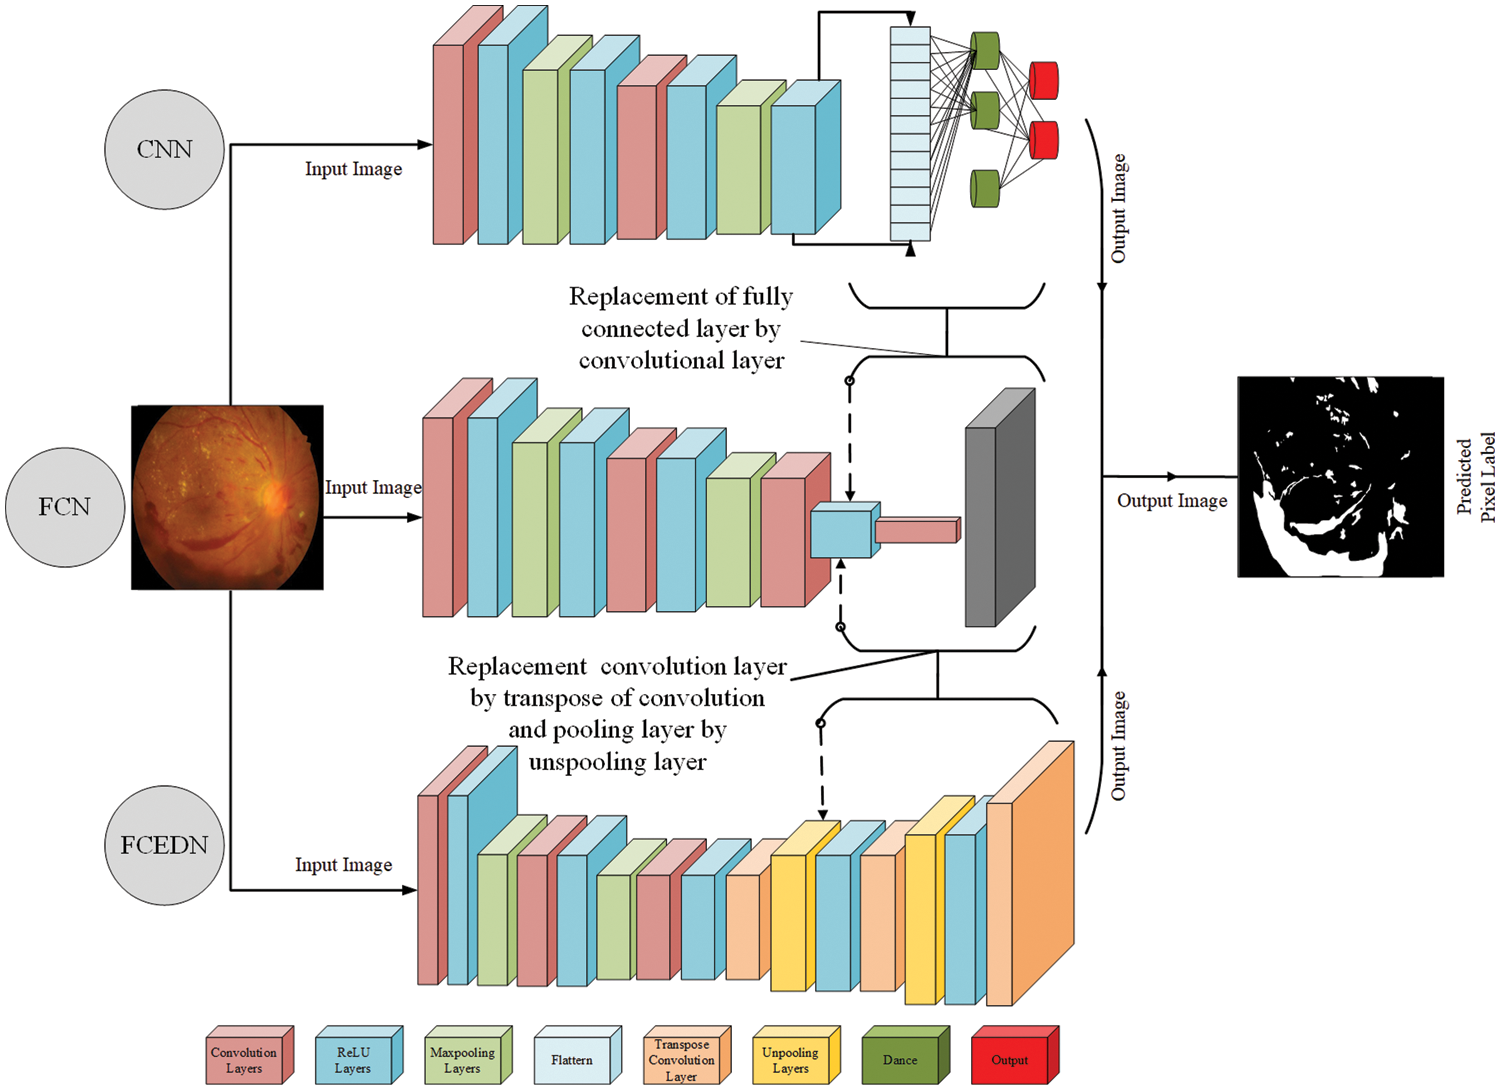
Figure 1: CNN, FCN, and FCEDN architecture
The FCEDN model involves numerous hyperparameters accompanying each layer, including the kernel size, number of layers in Conv, de-Conv, MP, and UP layers, number of layer-wise kernels, learning rate, batch size, activation function, dropout rate, number of epochs, optimizer, and more [9]. The kernel size determines the features that comprise the following layer, whereas the total number of kernels determines the total number of features. MP and UP layers use pooling sizes to downsample and upsample features. The dropout rate aids in model regularization. The architecture of FCEDN is decided according to the total number of Conv, TC, pooling, and UP layers. As the depth of FCEDN increases, the number of hyperparameters escalates significantly. The performance of FCEDN heavily relies on these parameters. However, manually reaching the near-optimal setup of hyperparameters of FCEDN by an extensive examination of all potential combinations is not only unfeasible but also costly. Therefore, in this study, we formulate the appropriate selection of FCEDN’s hyperparameters as an optimization problem to enhance the overall model performance.
The concept of GA, initially proposed by Holland [32], draws inspiration from the principles of Darwinian natural selection and genetics in biological systems. GA is a search methodology based on adaptive optimization. It operates with a population of candidate solutions known as chromosomes, each comprising multiple genes with binary values of 0 and 1. In this study, the initial positions for GWO are generated using GA. The following steps outline the process of generating initial population positions using GA:
• Chromosomes are randomly generated as the initial population.
• A roulette wheel selection technique is employed to choose parental chromosomes.
• A single-point crossover technique is applied to generate offspring chromosomes.
• The uniform mutation is adopted to introduce genetic diversity.
• The mutated chromosomes are decoded to obtain the preliminary positions of the population.
• By leveraging GA, the study establishes the preliminary positions for GWO, facilitating the subsequent optimization process.
3.3 Genetic-Grey Wolf Optimization (G-GWO) Algorithm
A metaheuristic algorithm, the GWO [22], was inspired by the pack behaviour and hunting techniques of GWs. Encircling, hunting, and attacking the prey are the three primary phases of the algorithm. The mathematical representation of a wolf pack’s social hierarchy has the optimal solution as
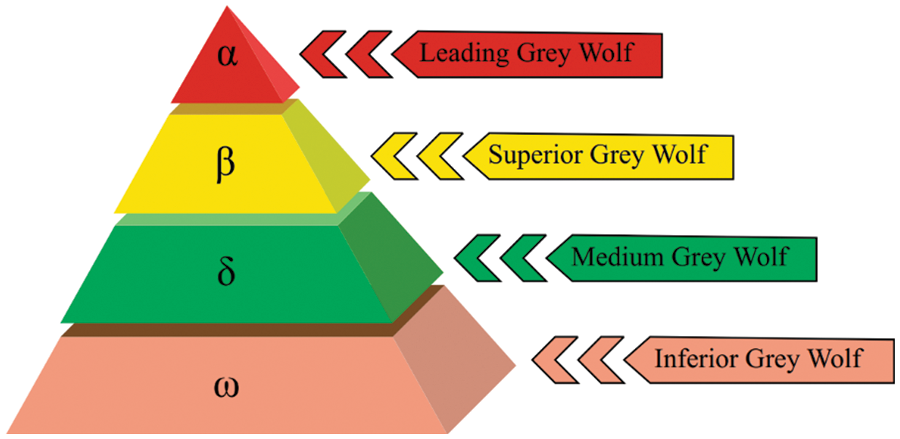
Figure 2: Grey wolves’ hierarchy [22]
The following Eq. (1) offered a mathematical description of the encircling behaviour seen in GWs during the hunting process:
The symbols and vectors have specific meanings in the context of the equations used in GWO. Let us denote the current iteration as t, the prey as p, and a GW as w. The coefficient vectors are represented by
The vector
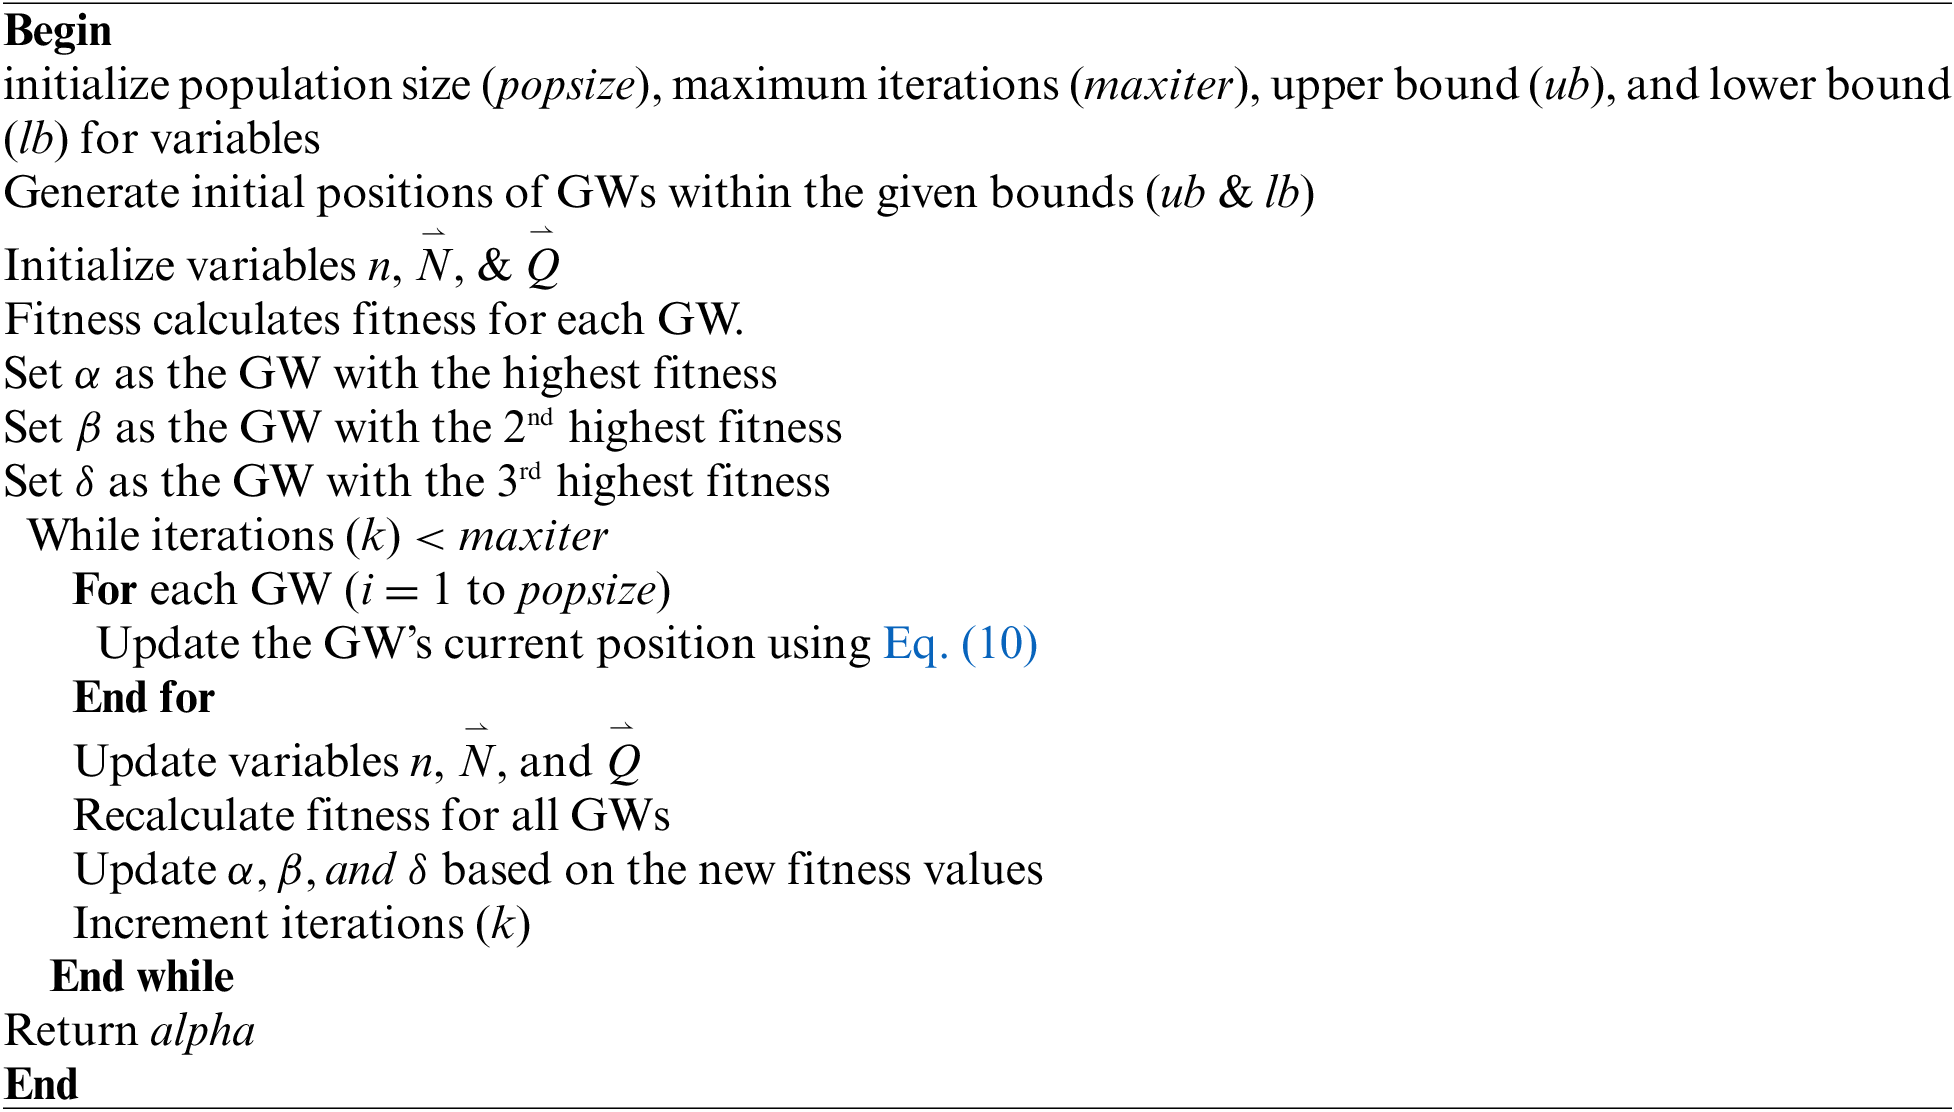
Pseudocode 1 provides the implementation of the GWO algorithm.
The random generation of the initial population in the original GWO algorithm may lead to a deficiency of diversity among the wolf swarms exploring the exploration space. Extensive research shows that the initial population quality is crucial for global convergence and solution quality in swarm intelligence optimization algorithms, and to improve the GWO algorithm’s performance, a novel approach called G-GWO utilizes a GA for generating a more suitable initial population.
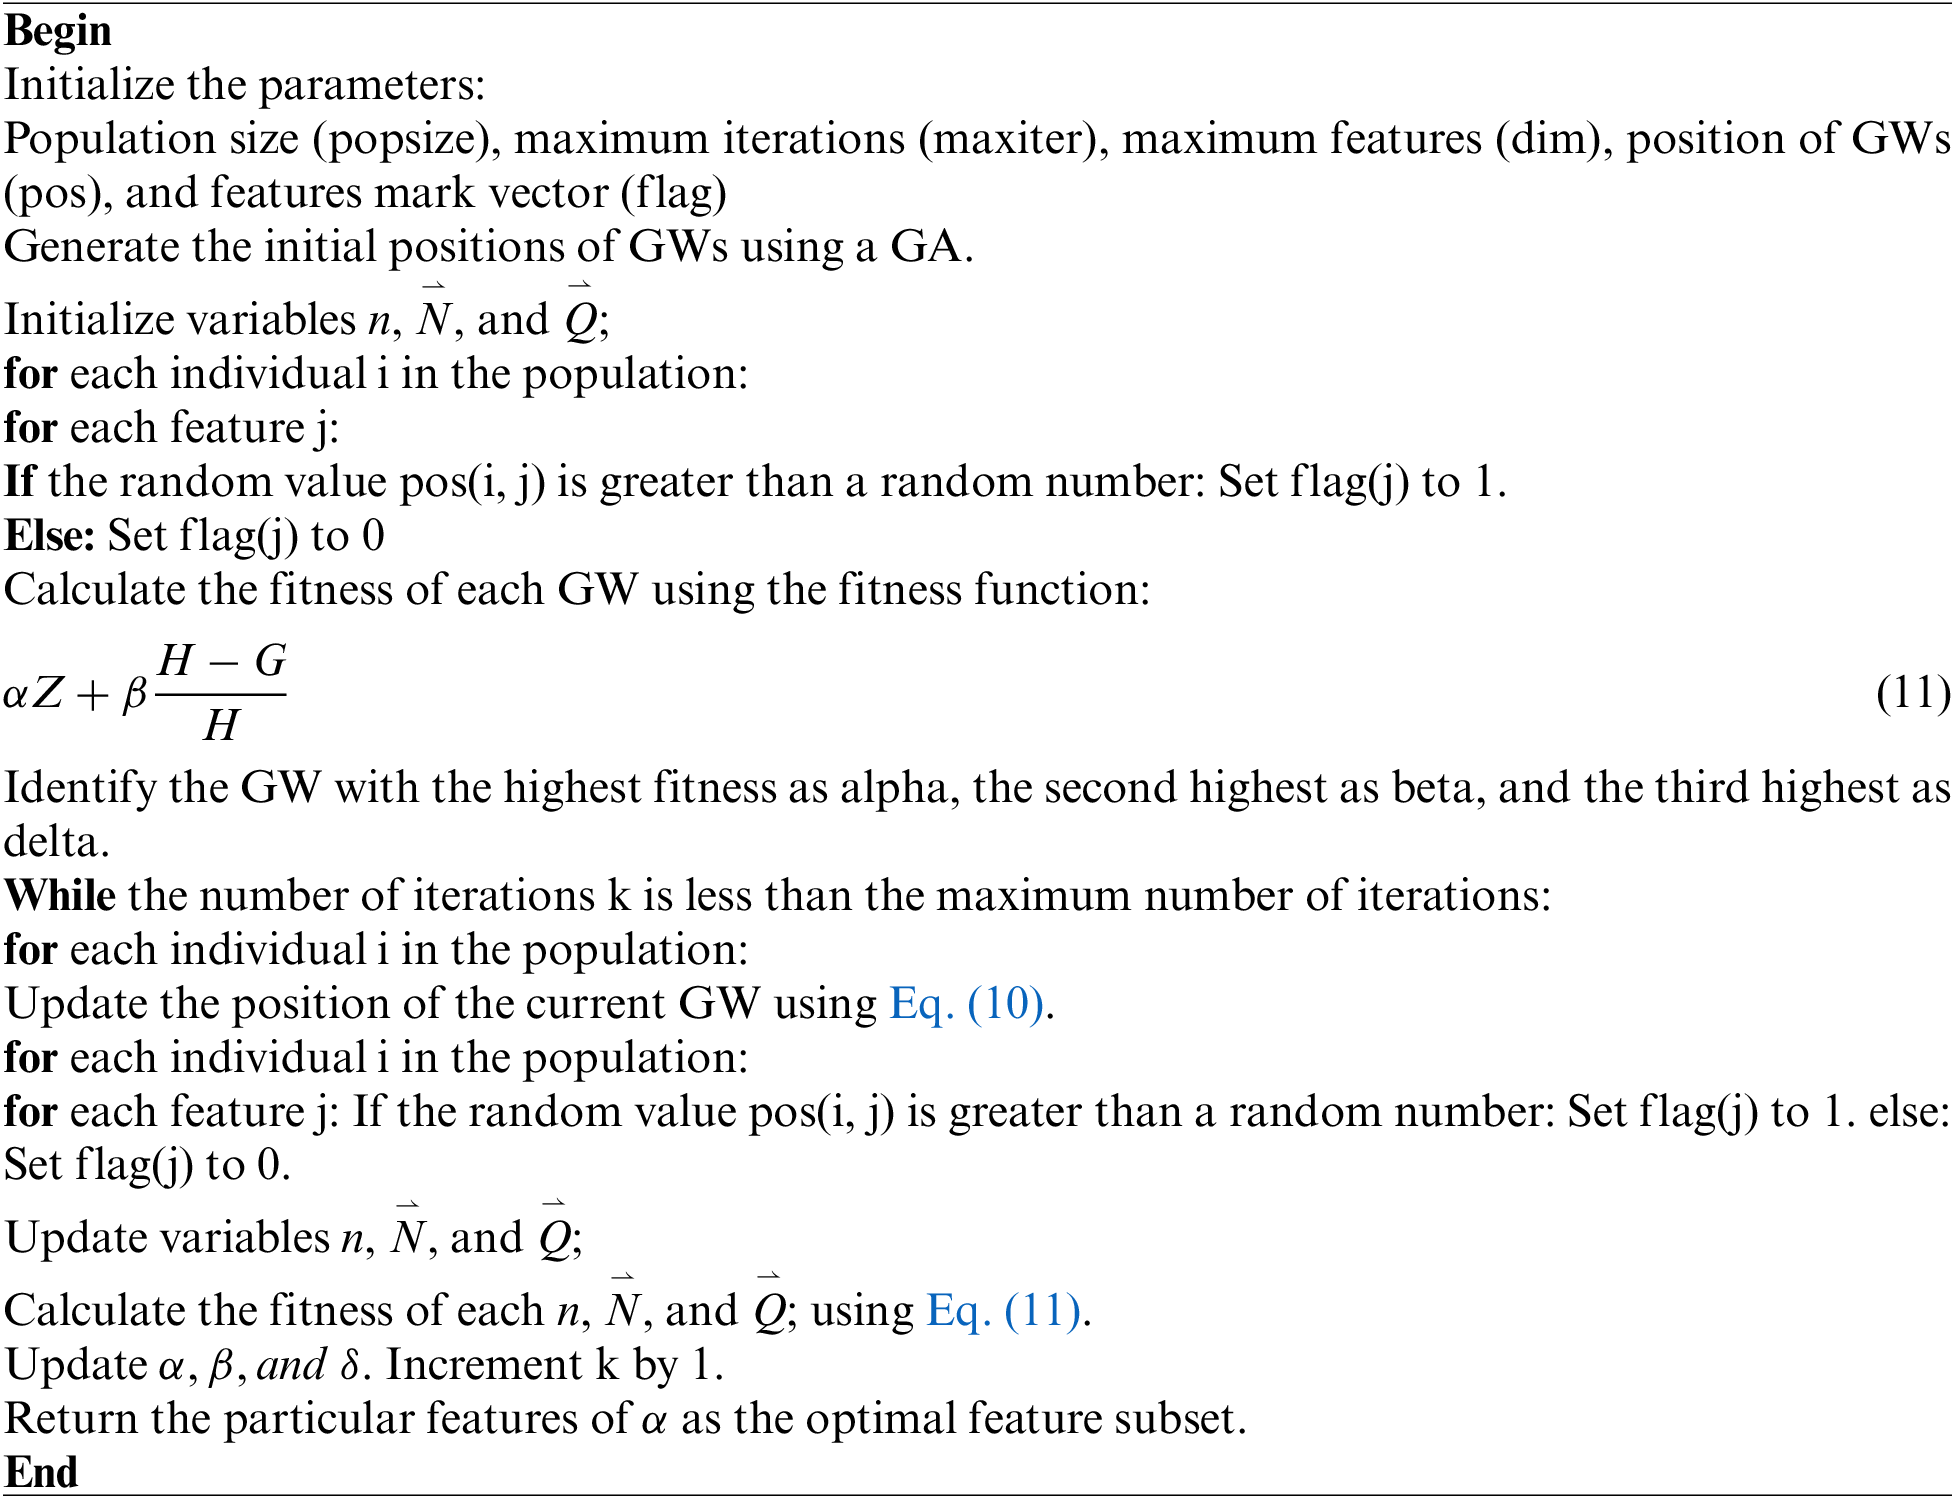
Pseudocode 2 contains the G-GWO algorithm’s pseudocode.
4 FCEDN HyperParameter Optimization Using G-GWO
The proposed model consists of four fundamental steps, as illustrated in Fig. 3. These steps include image pre-processing, G-GWO algorithm utilization for optimal selection of hyperparameters, creation as well as FCEDN training using the selected hyperparameters, and finally, assessing the performance of the model.
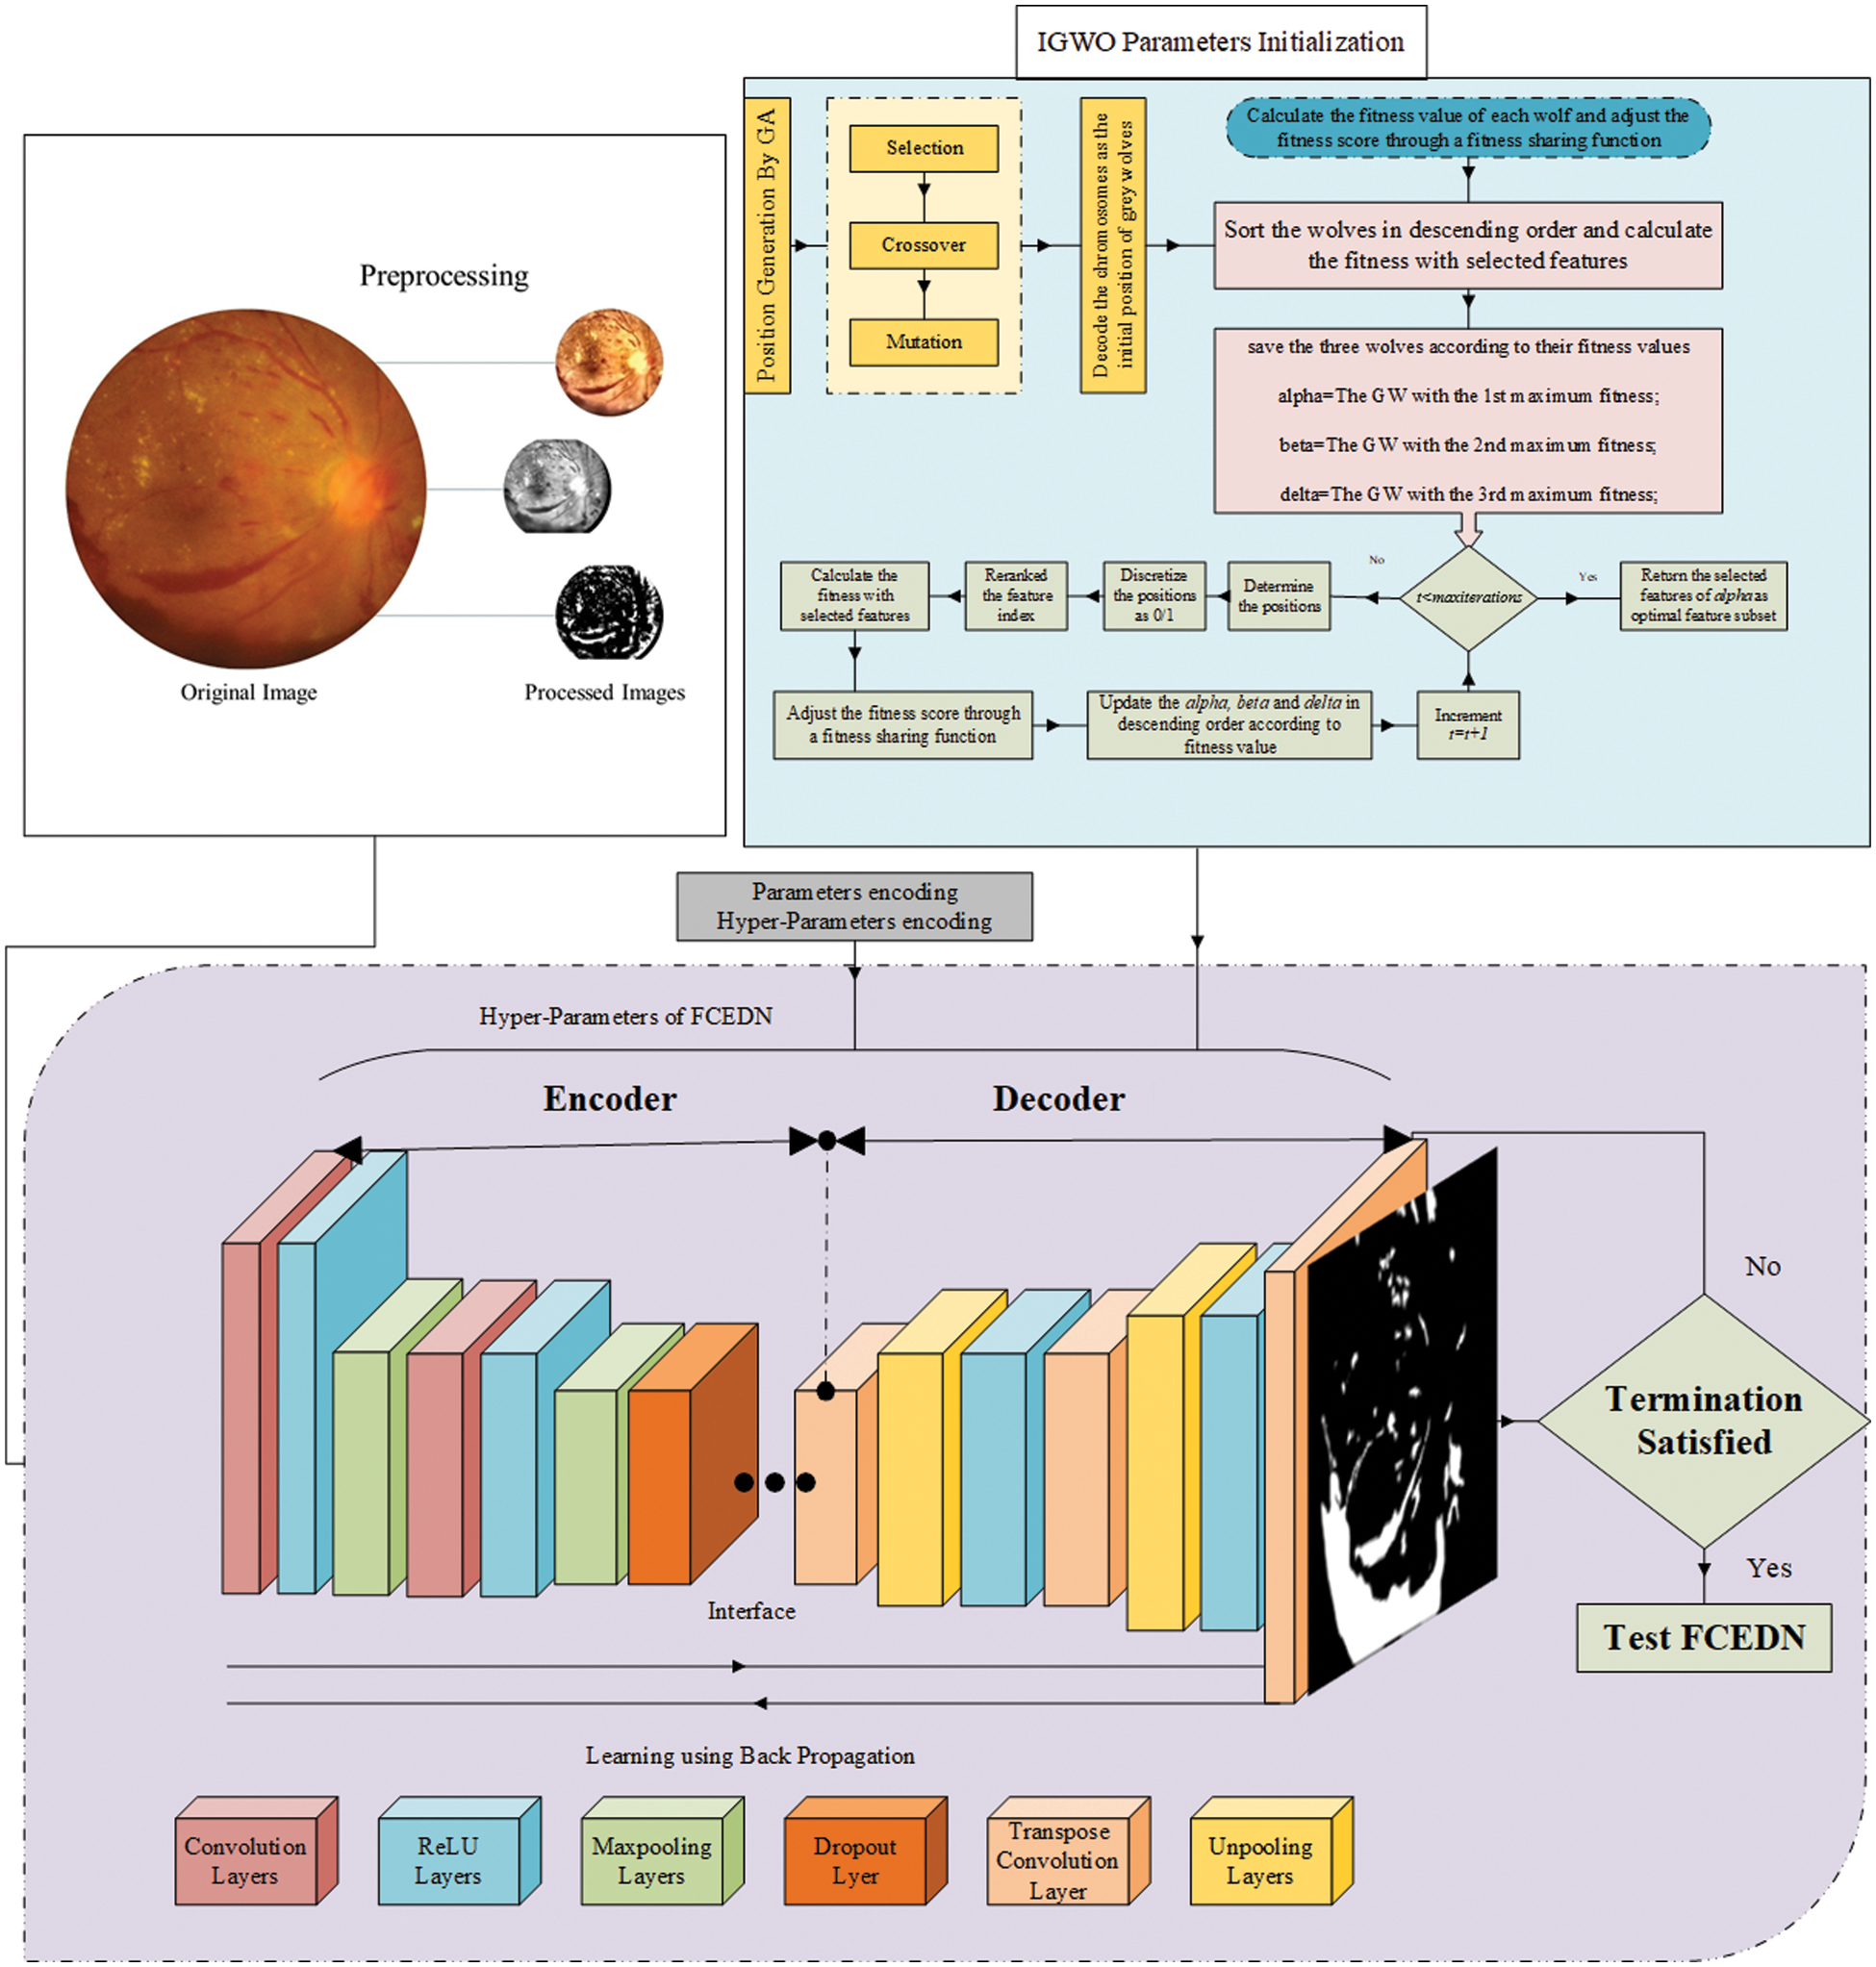
Figure 3: Proposed methodology
Several pre-processing steps address the challenges posed by the varying resolutions and large sizes of DED images. These images come in different resolutions, such as 4288 × 2848, 4752 × 3168, 3456 × 2304, 3126 × 2136, 2896 × 1944, and 2816 × 1880, among others. The presence of many input images, coupled with their large sizes, can potentially lead to suboptimal segmentation performance and increased training time for the FCEDN model. Therefore, before inputting the images into the model, the training and testing images undergo resizing by the bilinear interpolation method [21]. This resizing ensures that the images are adjusted to a suitable size while preserving their aspect ratio. A median filter is also applied to eliminate noise, and contrast-limited adaptive histogram equalization (CLAHE) is utilized to enhance the image quality. These pre-processing steps collectively contribute to improved segmentation performance and reduce the training time for the FCEDN model.
The FCEDN (Fully Convolutional Encoder-Decoder Network) is a deep learning architecture consisting of trainable encoder and decoder components, each comprising different layers. The down-sampling part, or encoder, includes Conv, ReLU, dropout, and MP layers. On the other hand, the decoder, or up-sampling part, consists of TC, UP, ReLU, and DO layers. Each layer plays a crucial role in the overall network. Designing an optimal FCEDN framework tailored to a specific application is challenging, as it often involves a trial-and-error process or is influenced by previous works. In this study, the initial structure of the FCEDN is built based on related works [15–17]. The encoder includes four Conv, one dropout, four ReLU, and two pooling layers. The decoder has four TC, two UP, four ReLU, and one DO layer. The kernel sizes of the convolution, TC, pooling, and UP layers are selected between 3 × 3 and 5 × 5. The number of kernels in the initial layers is lower than in the later layers, ranging from 20–200. The model is regularized by establishing a dropout layer with a dropout rate of 0.2–0.4. The overall architecture of FCEDN is controlled by the number of Conv’s, TC, pooling, and UP layers. Increasing the number of convolutions can lead to overfitting, while reducing them can result in underfitting. Furthermore, specific features can be excluded from more pooling or repeated in fewer pooling layers. This work has a range of Conv, TC, pooling, and UP layers between 2 and 10. Multiple experiments have calculated the following values to establish a balance between efficacy and computational time.
4.3 G-GWO for HyperParameter Optimization of FCEDN
The progression of optimizing FCEDN’s hyperparameters using G-GWO involves four steps: encoding, population initialization, fitness evaluation, and population update. In the encoding phase, the hyperparameters of FCEDN, such as Conv Kernel Size (C-KS), Transpose Conv Kernel Size (TC-KS), Conv Number of Kernels (C-NK), Transpose Conv Number of Kernels (TC-K), Max Pooling Kernel Size (MP-KS), Unpooling Kernel Size (UP-KS), and Dropout Rate (DL-Dr) of the Dropout layer, are encoded into a k-dimensional vector. The encoded vector’s values are chosen at random from a certain interval. The ith parameter vector is represented by Eq. (12):
Considering the presence of four convolution layers, two dropout layers, two max-pooling layers, four T-Conv layers, and two UP layers, the vector size (k) would be 22, representing the hyperparameters of these layers. The specific hyperparameters corresponding to the vector elements are as follows: (C1-Nk&Ks, C2-Nk&Ks, MP1-Ps, DL1-Dr, C3-Nk&Ks, C4-Nk&Ks, MP2-Ps, DL2-Dr, UP1-ps, TC1-Nk&Ks, TC2-Nk&Ks, UP1-ps, TC3-Ks&Nk, TC4-Ks&Nk).
Next, n encoding vectors were generated for the preliminary wolf population, denoted as Xn. Each Xi represents the location of the ith GW and is a k-dimensional vector representing the hyperparameters of FCEDN. A lightweight model is trained on small random samples to reduce the computation time for fitness evaluation to determine whether the fitness value alteration is negligible. The
In the formulation,
Consequently, accuracy alone may not be the most suitable metric for evaluating automatic segmentation performance. Instead, a more reasonable measure of segmentation performance is the percentage correspondence among the ground truth in addition to predicted masks. Similarity between the predicted as well as ground truth masks is measured by determining how many pixels are shared between the two sets of data and then dividing that number by the overall amount of pixels in both sets of data. By considering this measure, we can better assess the model’s performance in accurately segmenting the desired areas of the image.
Typical segmentation valuation metrics, such as the Jaccard Coefficient (JC) and Jaccard loss (JL), are applied to determine the relationship between the segmented area and the ground truth. These metrics provide quantitative measures of the resemblance between the predicted segmentation and the actual ground truth. Furthermore, the overall accuracy (Acc), sensitivity (Sen), specificity (Spc), and precision (Pre) of the pixels by the pixels segmentation method are also examined. The metrics in question are derived using the confusion matrix and permit a thorough evaluation regarding the segmentation performance. Following are the formulas for calculating the following metrics from the confusion matrix:
TP represents the number of object-classified pixels, whereas TN is the number of background-classified pixels. FN indicates the total number of pixels that belong to the object but are categorized as background. In contrast, FP indicates the number of pixels that belong to the background but are classified as objects.
5 Experimental Result and Discussion
This section compares the proposed G-GWO to other nature-inspired techniques, including GWO [21], mGWO [26], eGWO [27], iGWO [28], PSO, and GA, using ten standard benchmark functions. These include five unimodal reference functions and five multimodal benchmark functions.
Unimodal Functions:
Sphere (F-1): A continuous, convex function that evaluates optimization algorithms’ converging ability.
Schwefel 2.22 (F-2): Often used to test an algorithm’s robustness to local minima.
Schwefel 1.2 (F-3): Used to assess convergence speed.
Schwefel 2.21 (F-4): This tests premature convergence and exploration capabilities.
Generalized Rosenbrock (F-5): Known for its narrow, flat valleys, it is useful for testing the precision of algorithms.
Multimodal Functions:
Generalized Schwefel (F-6): Contains multiple local minima, ideal for evaluating global search ability.
Rastrigin (F-7): Known for its large search space and many local minima.
Ackley (F-8): Combines characteristics of several functions, useful for a comprehensive evaluation.
Griewank (F-9): Often used to evaluate the ability of algorithms to escape local minima.
Generalized Penalized (F-10): Suitable for testing an algorithm’s efficiency in overcoming mathematical penalties.
All these benchmark functions are implemented with the same 10 * 30 population size and environment; the predetermined number of iterations is 500. Table 1 presents the mean as well as the standard deviation of fitness error derived from 50 liberated trials. While these metrics provide an overview of the performance, it should be noted that this evaluation lacks a deeper statistical analysis to determine the significance of the observed differences between the techniques. Without such analysis, conclusions about the superiority or inferiority of certain techniques may be tentative. In each experiment, the parameters of the relative algorithms are configured according to the specifications recommended in their original work. An examination of Table 1’s results reveals that eGWO provides superior outcomes for F-1 and F-2, while GA outperforms other techniques in the case of F6 [27]. EN-GWO demonstrates extremely competitive performance in all other functions compared to other methodologies. However, it should be stressed that these findings are presented without statistical significance testing, and further analysis would be required to confirm these observed differences.

Extensive experiments were performed to evaluate the efficacy of G-GWO for hyperparameter optimization of FCEDN utilizing IDRiD [29], DR-HAGIS [30], and ODIR [31] datasets. These experiments were carried out using MATLAB and Python, the Keras, Scikit-learn, and OpenCV libraries. Experiments were conducted on Google Colab Pro, outfitted with a GPU with an intel-core i7 8th generation processor with 32 GB RAM.IDRiD, DR-HAGIS, and ODIR are image datasets that serve as input for super pixel-based feature extraction, classification annotations, and ground truths. The resolutions of these datasets varied, including 4288 × 2848, 4752 × 3168, 3456 × 2304, 3126 × 2136, 2896 × 1944, and 2816 × 1880. The IDRiD dataset contains 516 RGB images for the segmentation assignment, while the DR-HAGIS and ODIR datasets contain 30 and 362 RGB images, respectively. The ODIR dataset is subdivided into 177 glaucoma images, 49 DR images, and 136 DME images. Refer to Table 2 for more information about the simulated dataset and Fig. 4 for sample images from the datasets.
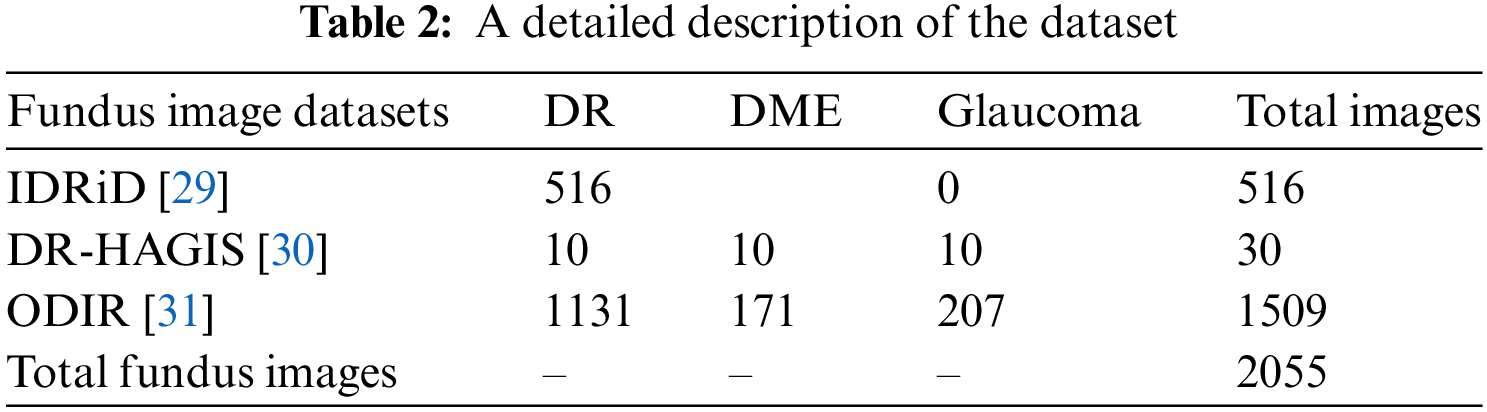
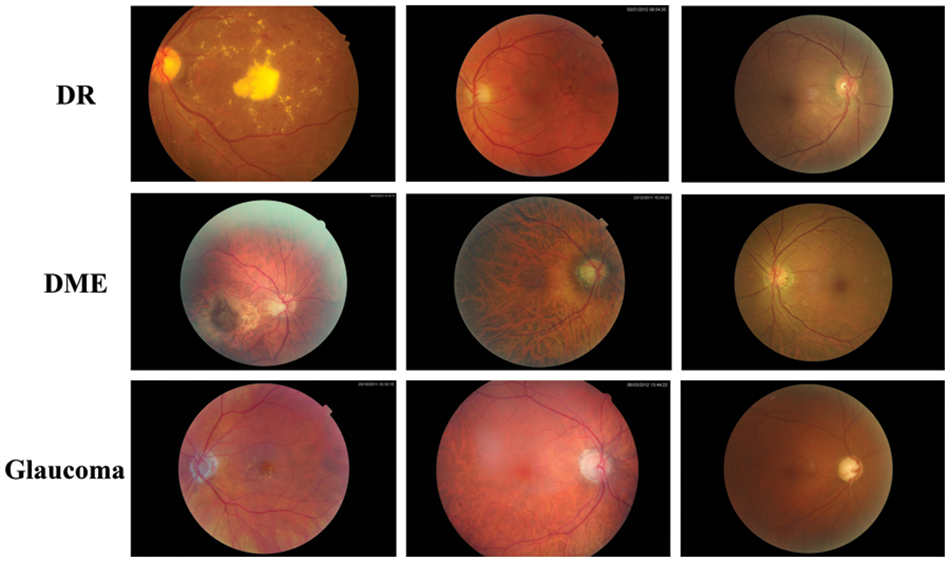
Figure 4: Sample images from datasets
The IDRiD [29] is a groundbreaking dataset specifically curated for India, consisting of 516 retinal fundus images captured at the Nanded (M.S.) eye clinic using a Kowa VX-10α fundus camera. With a focus on the macula and a field of view of 50 degrees, the images provide comprehensive coverage of diabetic retinopathy and normal retinal structures, meticulously annotated up to the pixel level. The dataset includes well-defined grading scores from 0 to 4 for diabetic retinopathy and 0 to 3 for diabetic macular edema, reflecting varying levels of severity according to international clinical relevance standards. The IDRiD dataset is an invaluable resource for developing and evaluating advanced algorithms, facilitating early detection and analysis of diabetic retinopathy in the Indian population. The DR-HAGIS [30] database is a collection of retinal fundus images. This database contains 39 high-resolution, colour fundus images from the United Kingdom’s diabetic retinopathy screening program. The screening program utilizes different fundus and digital cameras provided by various service providers, leading to variations in image resolution and sizes.
Additionally, patients enrolled in these programs often exhibit other comorbidities alongside diabetes. To accurately represent the range of images assessed by experts during screening, the DR HAGIS database includes images of different sizes and resolutions, as well as four comorbidity subgroups: diabetic retinopathy, age-related macular degeneration, hypertension, as well as Glaucoma. The ODIR (Ocular Disease Recognition) [31] dataset is a publicly available collection of retinal images captured using fundus cameras. Its purpose is to facilitate research in ocular disease recognition by developing and evaluating algorithms for disease detection and classification. The dataset includes diverse images from patients with various ocular diseases, as well as healthy individuals for comparison. Annotations are provided for the presence or absence of ocular conditions such as diabetic retinopathy, glaucoma, AMD, and hypertensive retinopathy. The dataset is split into training, validation, and testing subsets, enabling algorithm optimization and evaluation. By leveraging the ODIR dataset, researchers can advance the field, developing automated tools for early disease detection and improved patient care in ophthalmology.
CAD systems are designed to detect lesions related to DED. However, current methods still face challenges with a high rate of false-positive detections for each image. Manual feature engineering and limited labelled data hinder accurate lesion recognition and deep learning model training. Fundus image databases suffer from privacy constraints and limited data, making training challenging. This study proposes a fundus image augmentation scheme using diverse techniques to address these issues. This study used data augmentation methods, including geometric transformations and patch extraction, to improve image instances, as explained in Table 3.
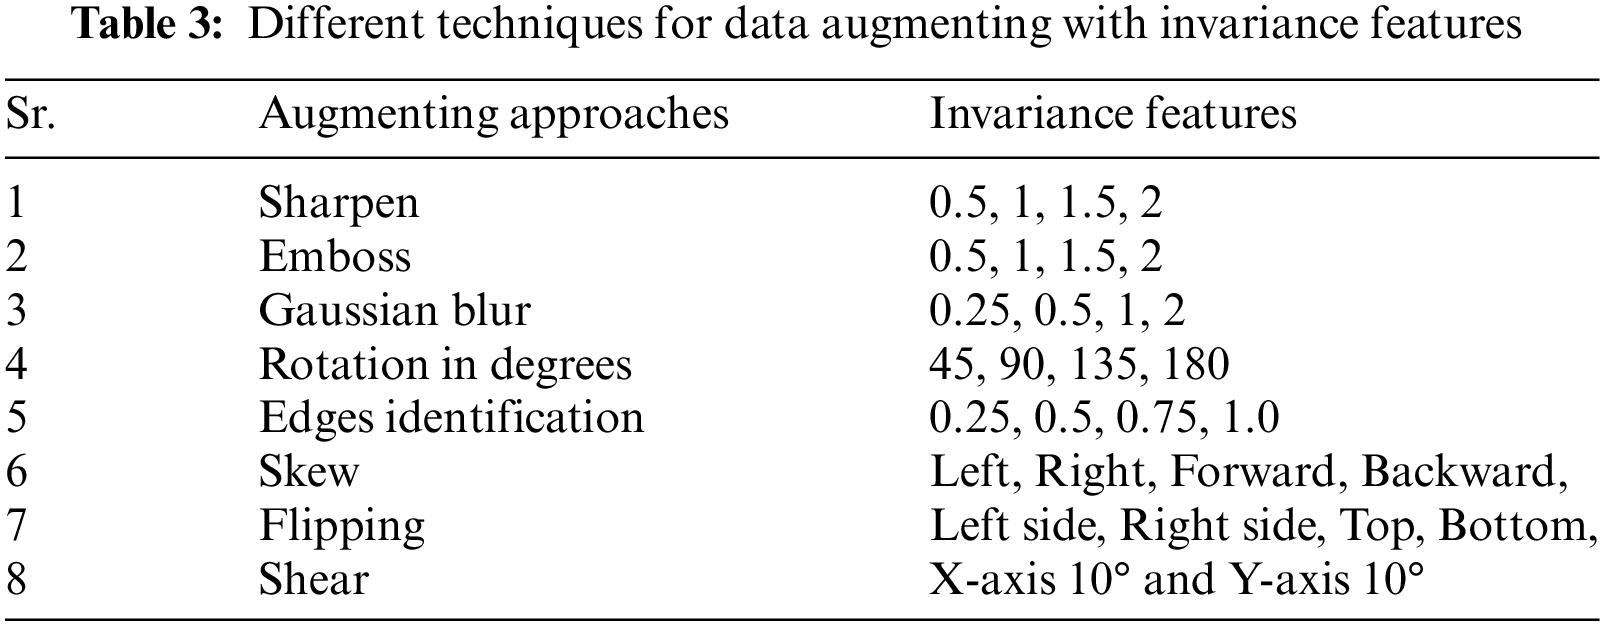
Images have artificially increased the images seven times by employing diverse data augmentation approaches, as represented in Table 4. The dataset consists of 14385 fundus images, with 10070 images for training (70%) and 4316 for evaluation (30%).
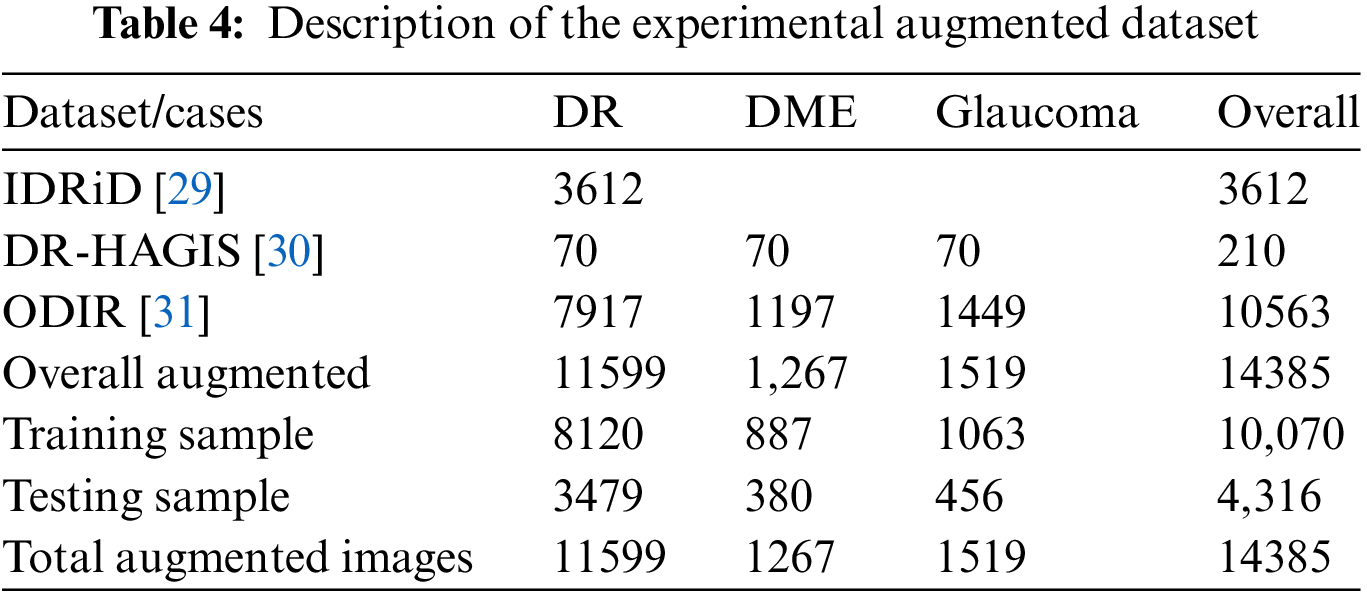
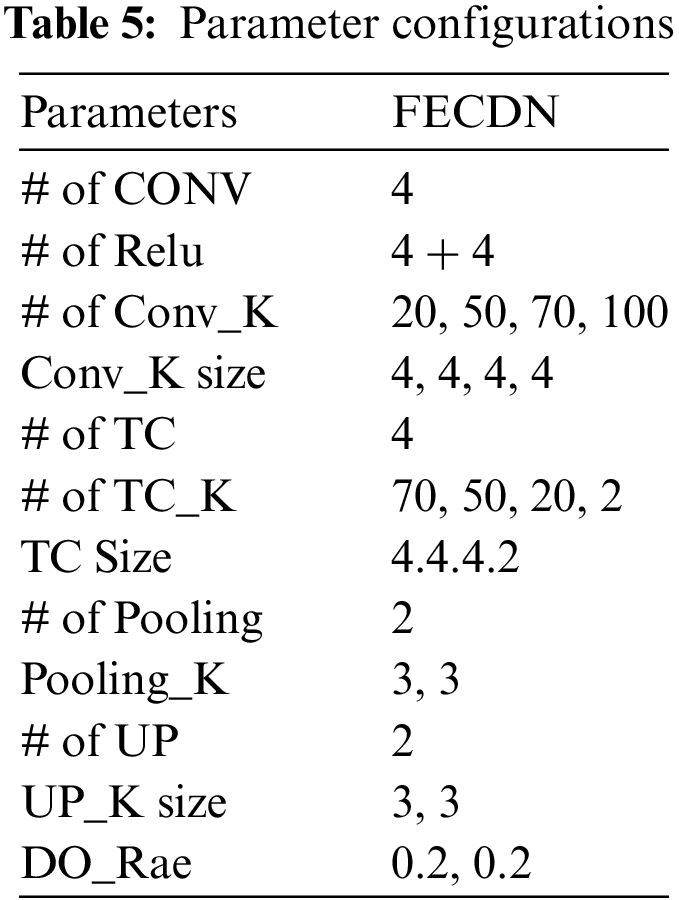
This study evaluates the viability of agents in G-GWO in order to identify optimal parameters for building the FCEDN model. The FCEDN model comprises four convlayers alongside ReLU activation, two MP layers, two DO layers, four TC layers, and two UP layers. The conv layers have 20, 50, 70, and 100 kernels, with a fixed kernel size 4. The TC layers contain 70, 50, 20, and 2 kernel diameters of 4, 4, 4, and 2, respectively. A particle size of 2 and a DO rate of 0.2 for both the MP and UP layers are implemented. The last layer of the FCEDN model is a TC layer with two kernels and a kernel size of two, which is used to match the image’s ground truth. The final output is generated using the softmax activation function. The FCEDN model is trained with the Adam optimizer, a constant learning rate of 0.001, and a batch size 20. A sample dataset of 200 randomly selected images from the ISIC2016 dataset is used for training. Although the FCEDN architecture is chosen based on a review of previous works [15–17], simulations are also performed with alternative architectures by altering the number of conv, ReLU, MP, TC, and UP layers, as well as the number of kernels in the conv and TC layers. Other network parameters remain unchanged across these architectures. The FCEDN architecture with 4 Conv, 8 ReLU, 2 DO, 2 MP, 4 TC, and 2 UP layers is shown in Table 5. Therefore, this architecture is maintained for future simulations that optimize the FCEDN’s hyperparameters.
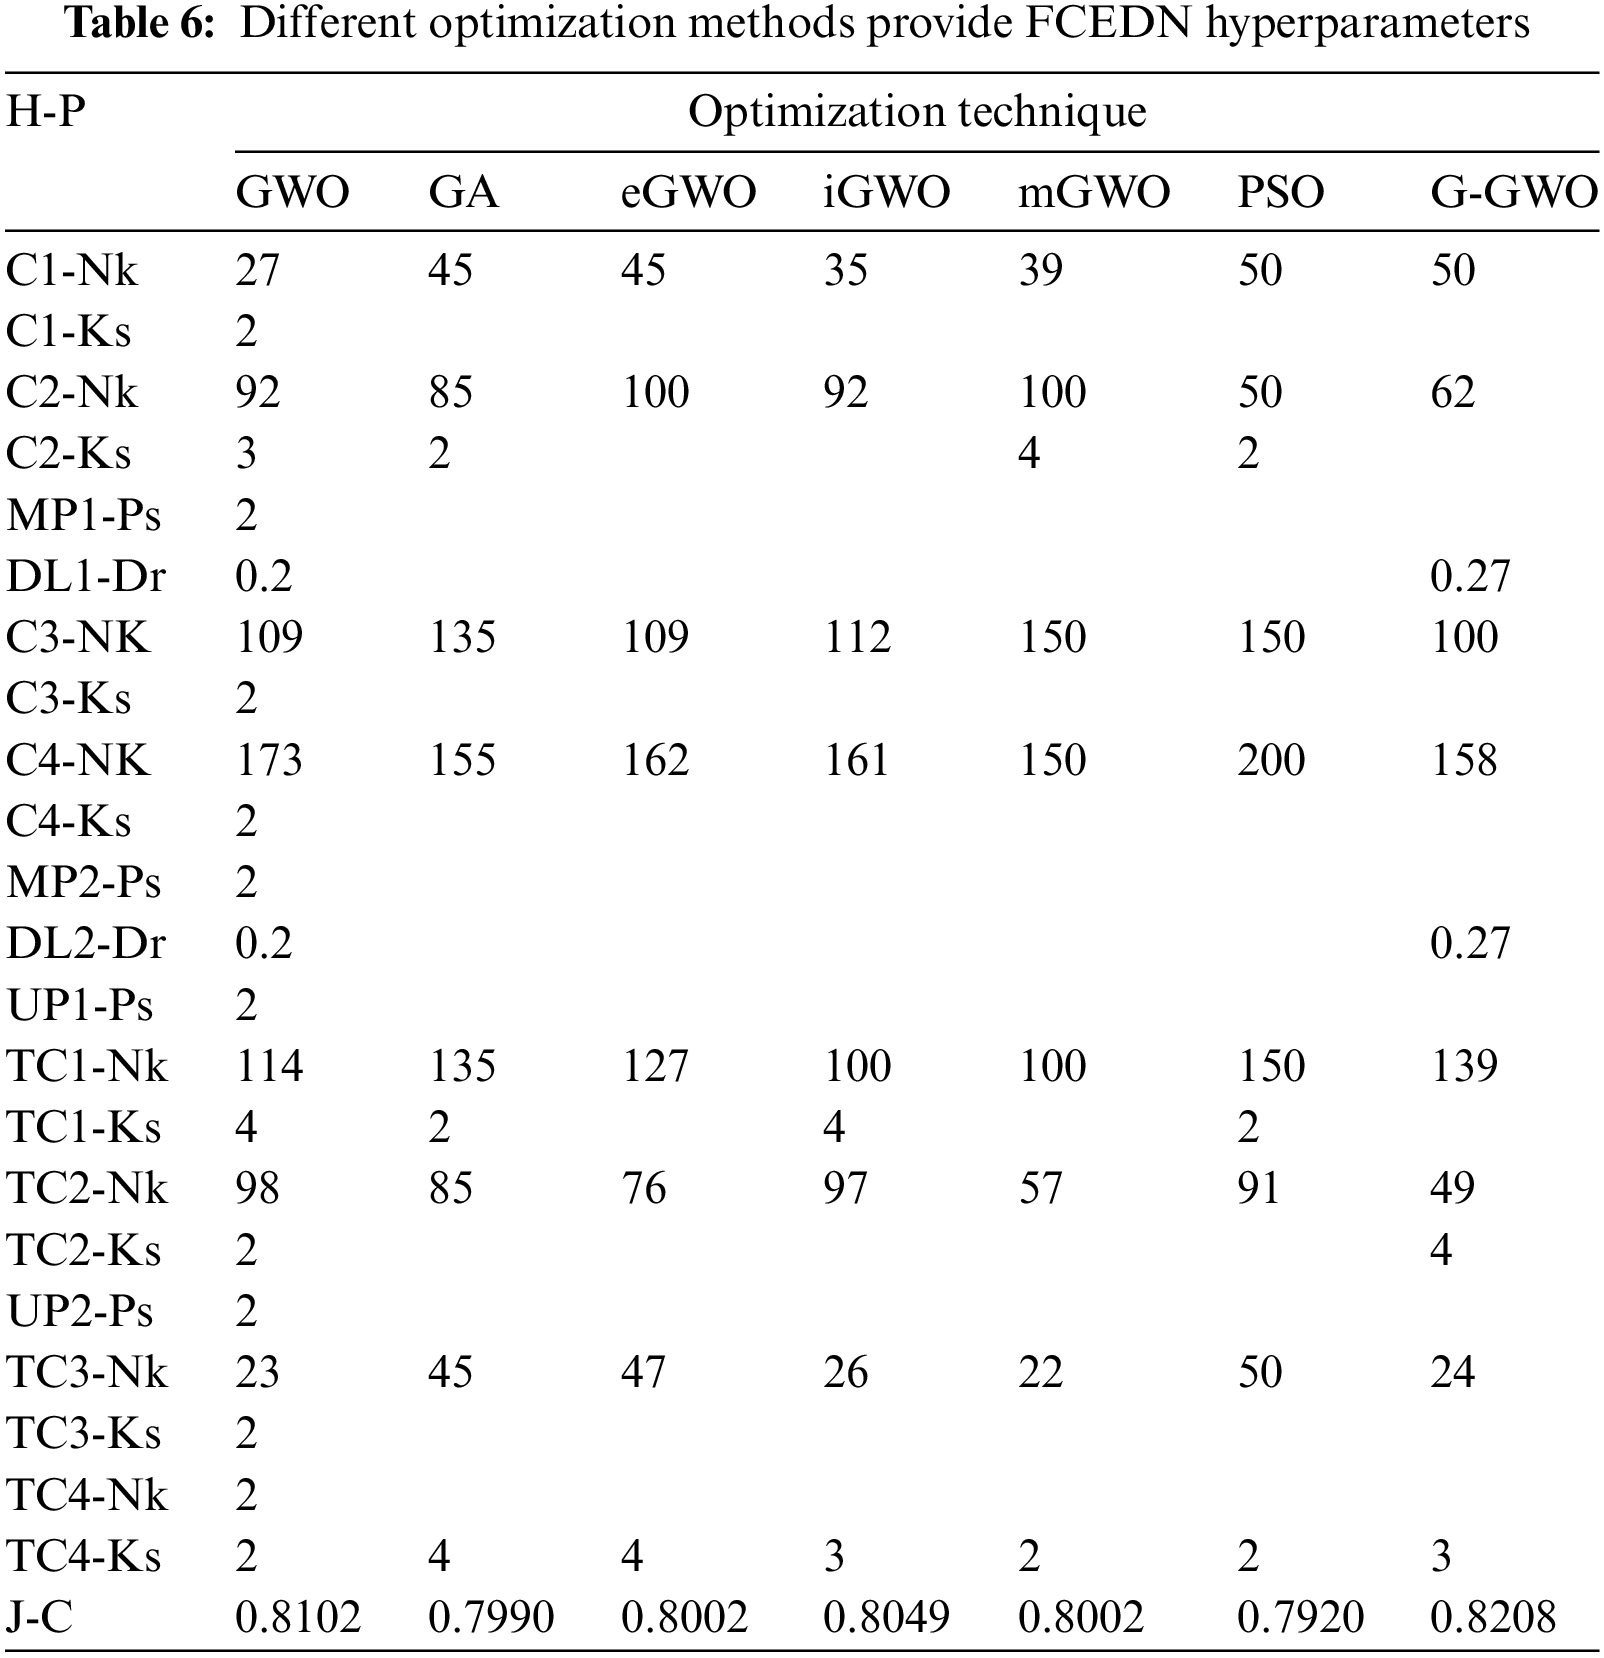
After determining the FCEDN architecture, its hyperparameters have been encoded to be compatible with the G-GWO population. In addition to G-GWO, GWO [21], mGWO [26], eGWO [27], iGWO [28], PSO, and GA are used to optimize the FCEDN hyperparameters. All optimization strategies utilize an identical population size. Table 5 provides a summary of the hyperparameters obtained through various optimization techniques, as well as the maximal Jaccard coefficient attained by the best-performing agent. G-GWO consistently outperforms GWO, iGWO, eGWO, mGWO, GA, and PSO when considering the value of the Jaccard Coefficient on the sample dataset, as shown by the table analysis. These results demonstrate that G-GWO provides superior hyperparameter optimization for FCEDN compared to other cutting-edge techniques.
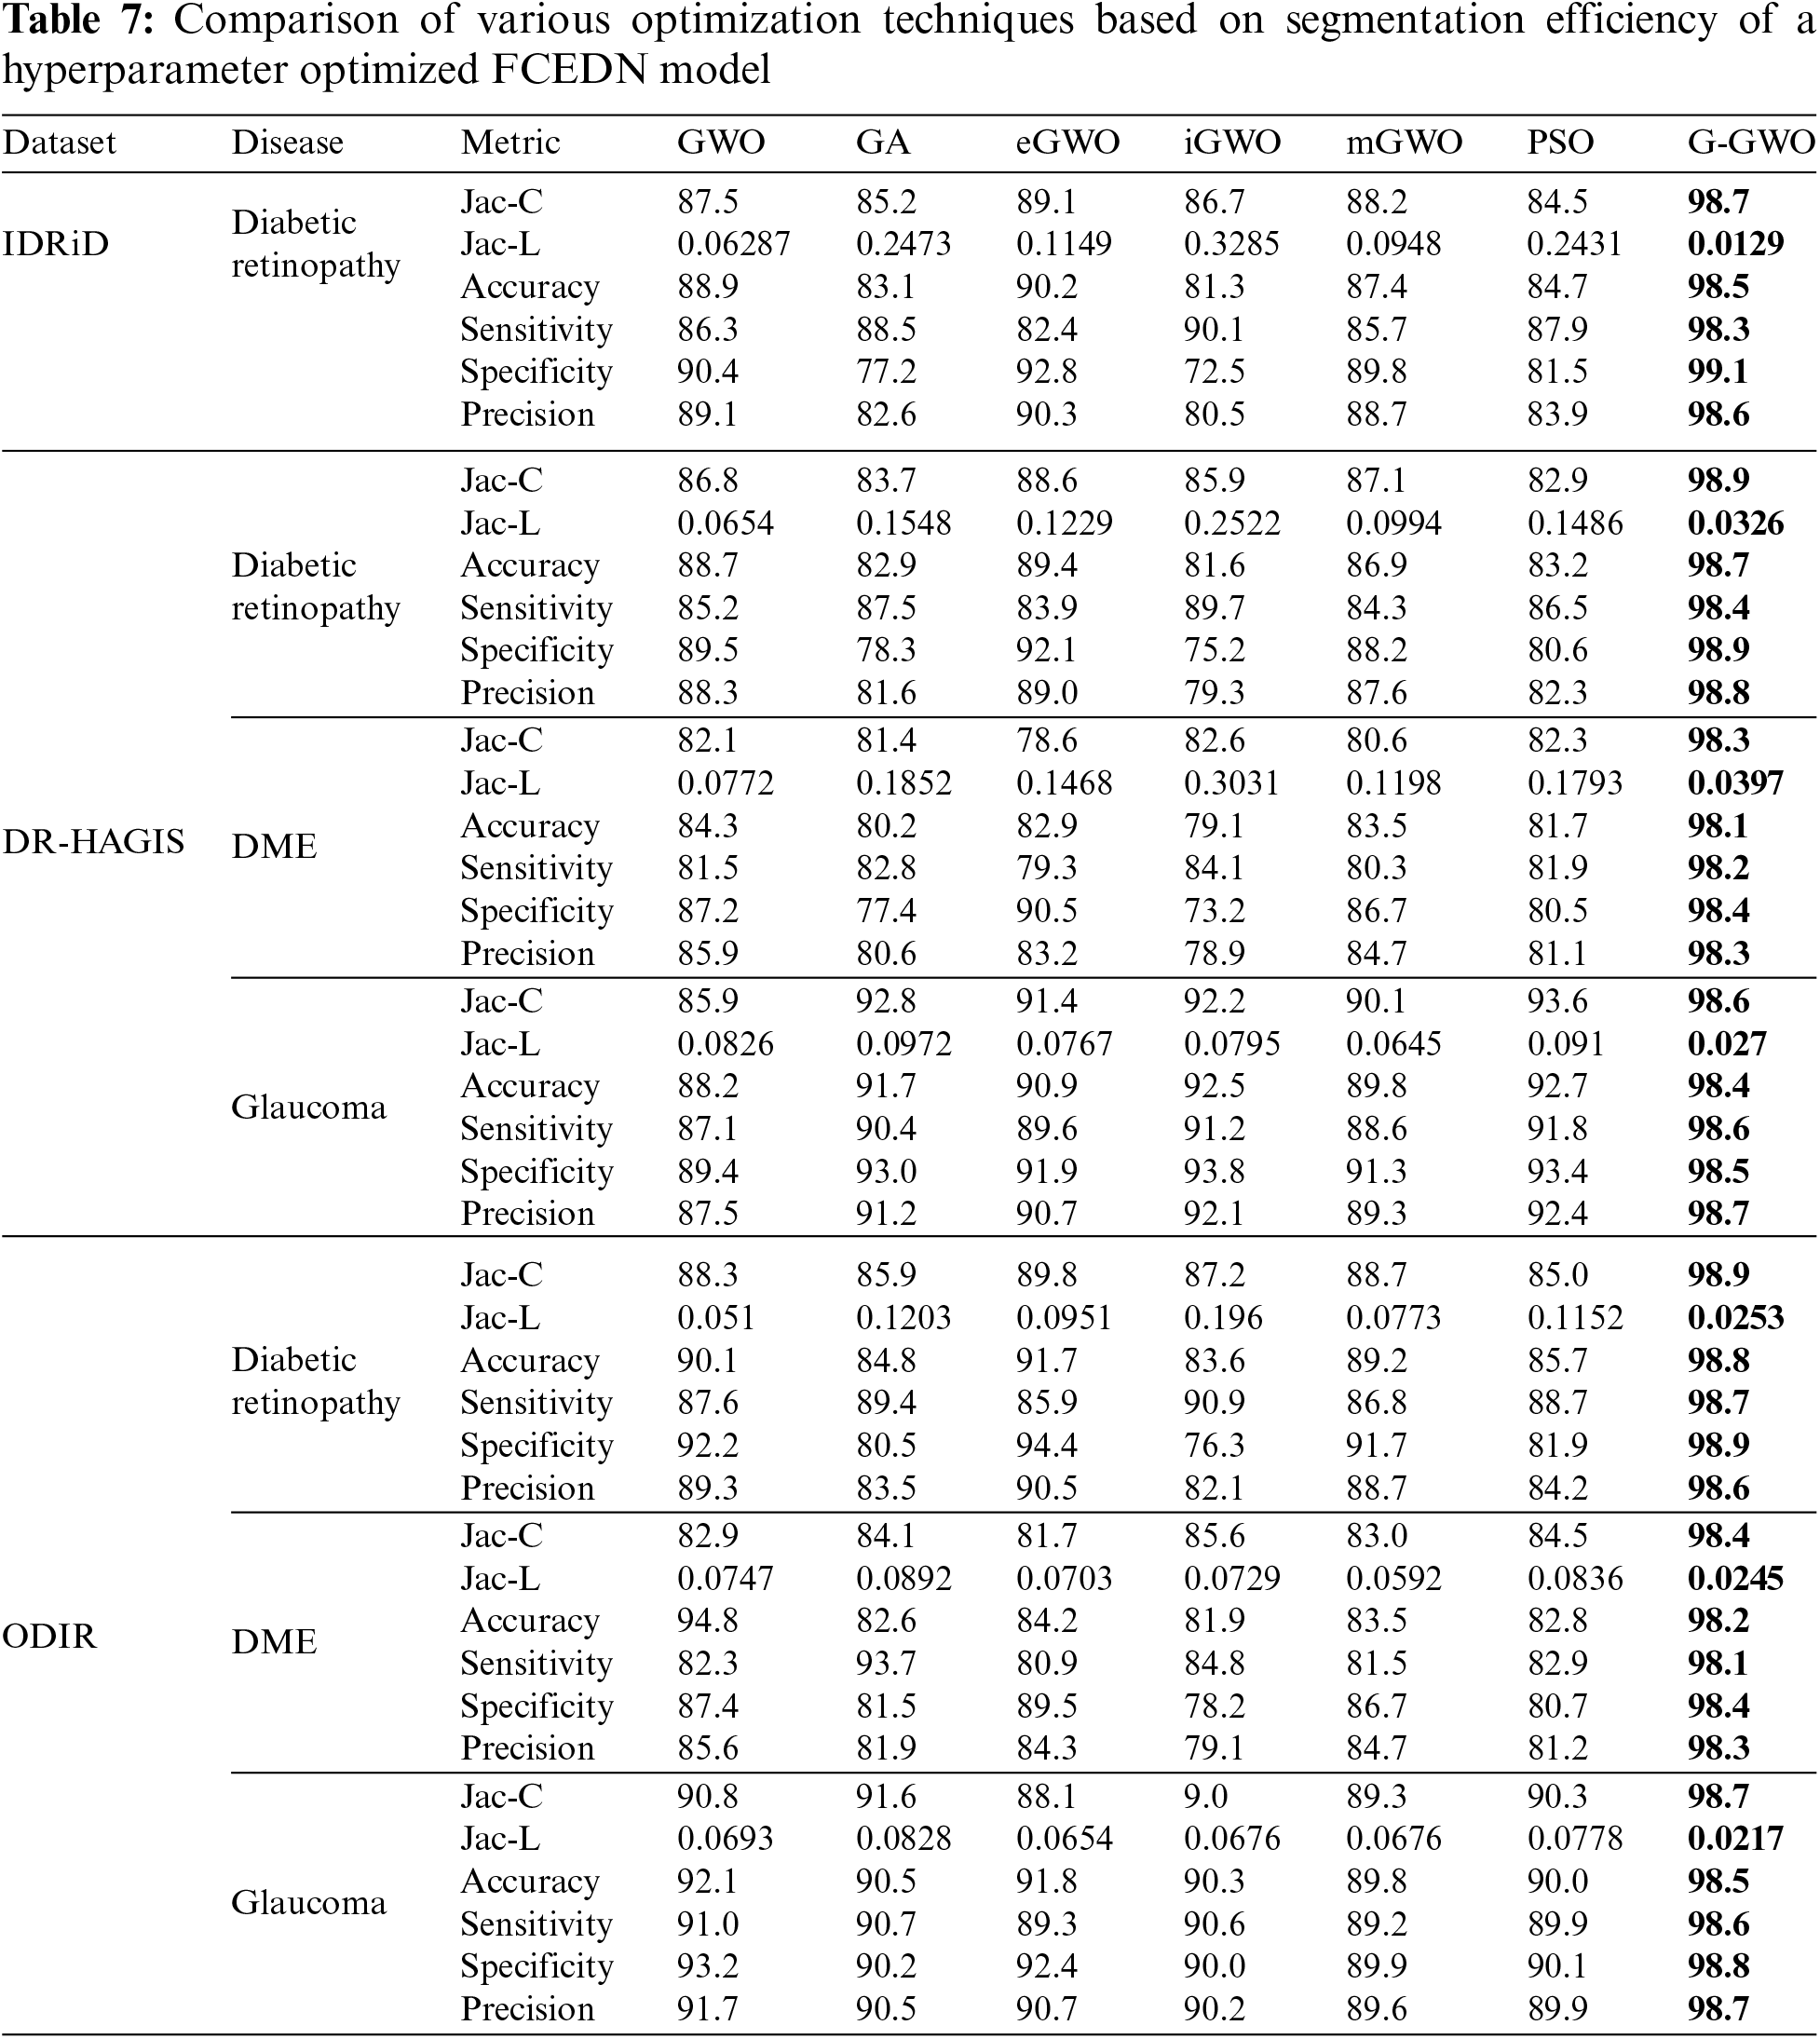
The control parameters for the numerous optimization techniques are listed in Table 6. These values have been determined through simulation and are tailored to the application in question. In order to incorporate the FCEDN model with the G-GWO population, its hyperparameters have been encoded while its architecture remains unchanged. The hyperparameters of FCEDN are optimized utilizing multiple optimization techniques, such as GWO [21], mGWO [26], eGWO [27], iGWO [28], PSO, and GA, in addition to EN-GWO. All of these methods use the same population size. The maximal Jaccard coefficient attained by the fittest agent is presented in Table 6 alongside the hyperparameters of the FCEDN model derived through various optimization techniques. G-GWO provides improved hyperparameter optimization for FCEDN relative to other state-of-the-art techniques, as shown in Table 6. The FCEDN models were trained for 500 iterations on the IDRiD, DR-HAGIS, and ODIR datasets using various hyperparameter methodologies. For each epoch, the Jaccard coefficient along with Jaccard loss were computed, and the results were evaluated. The segmentation effectiveness of the datasets utilizing different hyperparameter-optimized FCEDN models is presented in Table 7. The results show that the proposed EN-GWO-based model yielded exceptional results, with a Jaccard coefficient of 98.7%, 98.9%, 98.3%, 98.6%, 98.9%, 98.4%, and 98.7%, and a Jaccard loss of 0.0129, 0.0326, 0.0397, 0.027, 0.0253, 0.0245, and 0.0217, respectively. It can be observed from Table 7, the proposed model evaluated on IDRiD, DR-HAGIS, and ODIR datasets achieved an average DR accuracy of 98.5% on the IDRid dataset. The proposed model evaluated on the DR-HAGIS dataset achieved 98.7%, 98.1%, and 98.4 % for DR, DME, and Glaucoma, respectively. The accuracy results of ODIR for DR is 98.8% and the accuracy value of DME and glaucoma are 98.2%, and 98.5%, respectively.
In general, the results demonstrate the efficacy of G-GWO in optimizing the hyperparameters for various disease classification tasks, resulting in superior performance compared to other optimization techniques. The evaluation metrics further validate the enhanced accuracy, sensitivity, specificity, and precision attained by G-GWO across multiple datasets and disease scenarios. The graphical analysis representing accuracy, sensitivity, specificity, and precision are illustrated in Figs. 5a–5d.
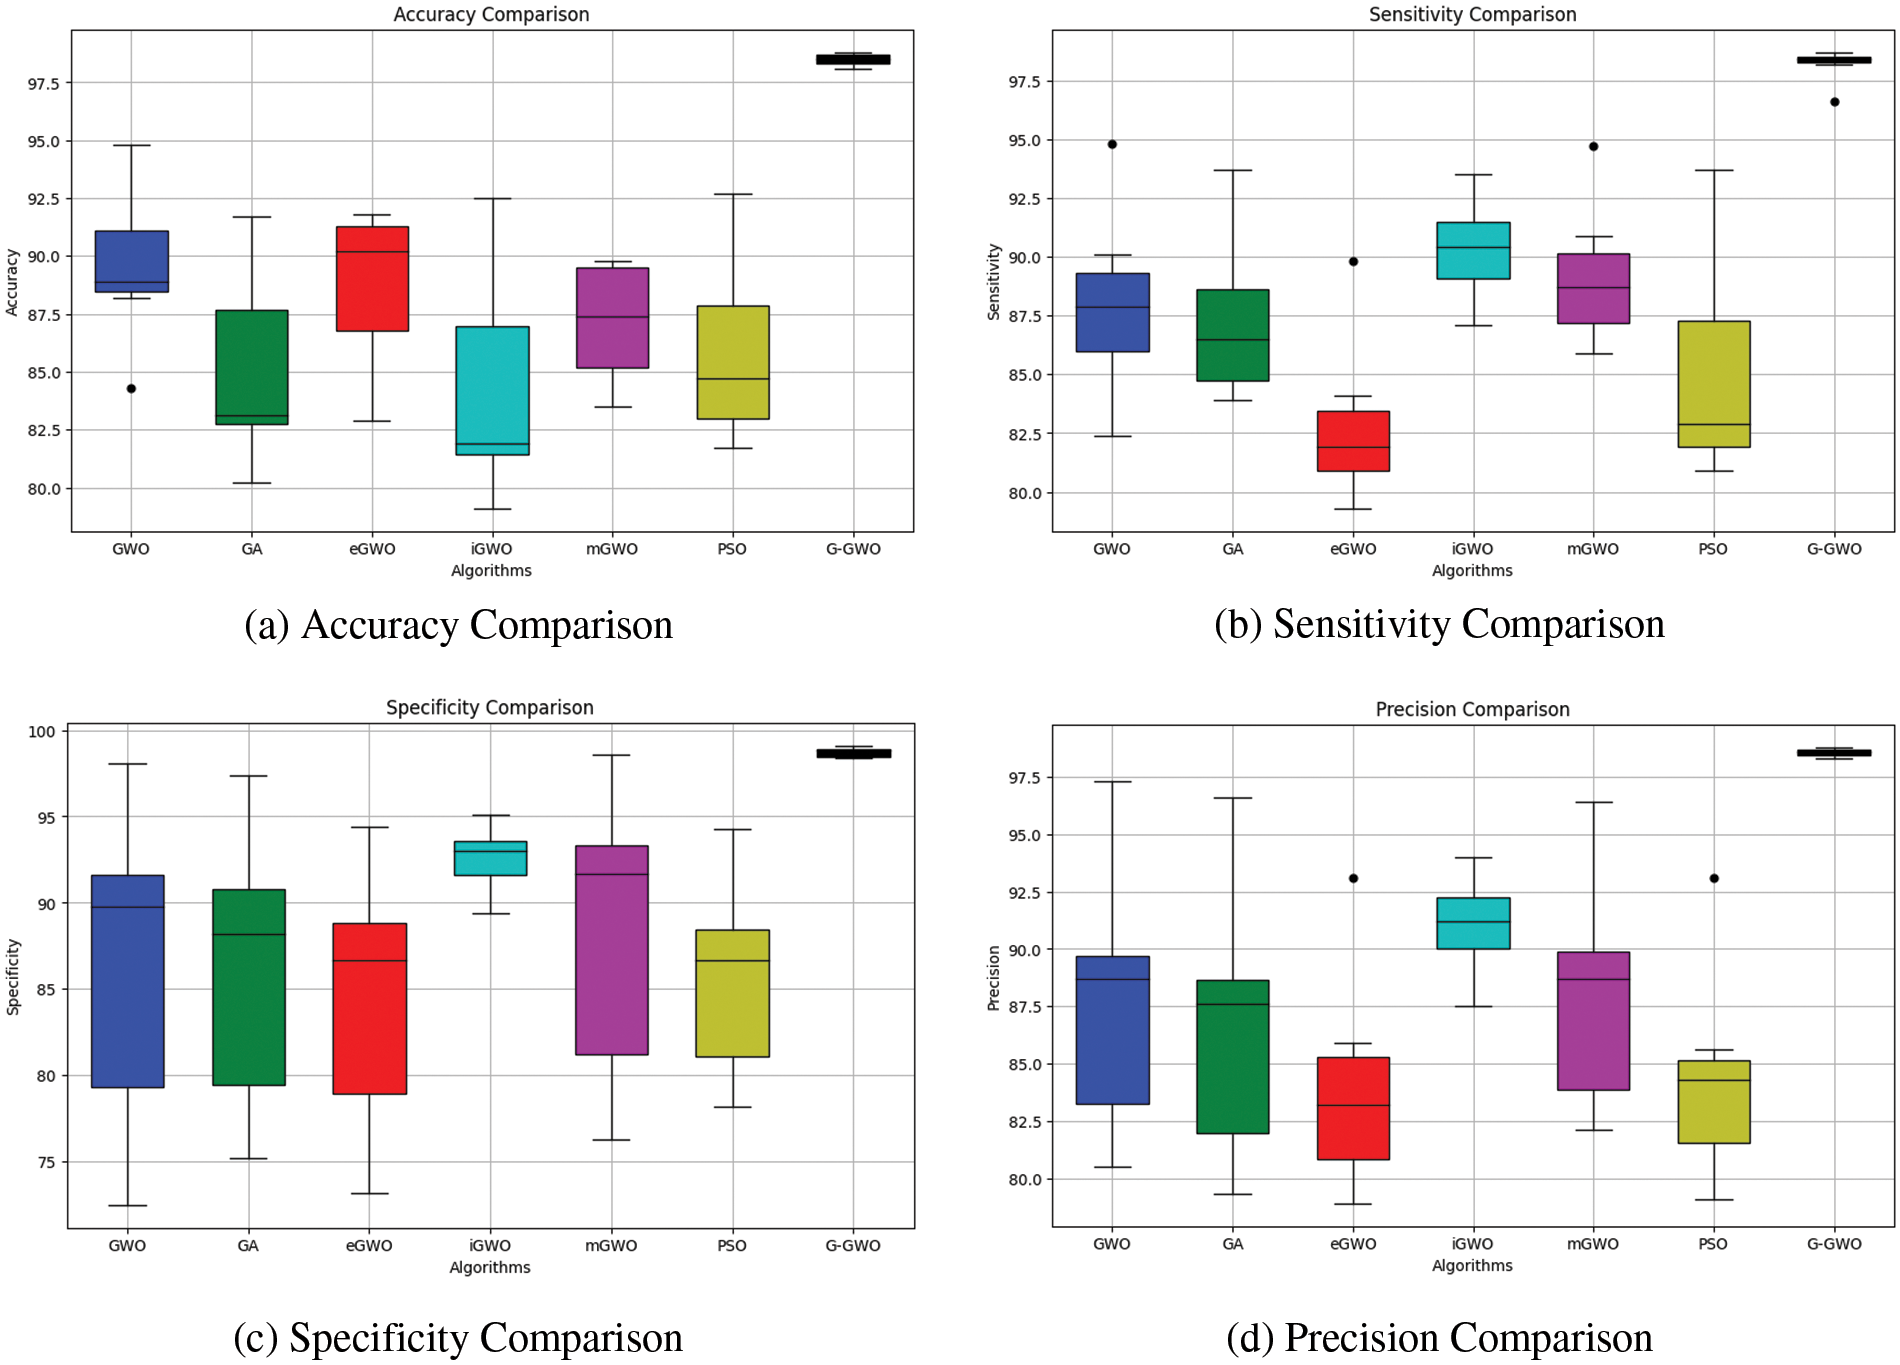
Figure 5: Performance matrices comparison
Fig. 6 depicts the input, pre-processing, ground truth, and corresponding predicted mask obtained by the G-GWO-based hyperparameter-optimized FCEDN model for some sample images. These results indicate that the area is properly segmented.
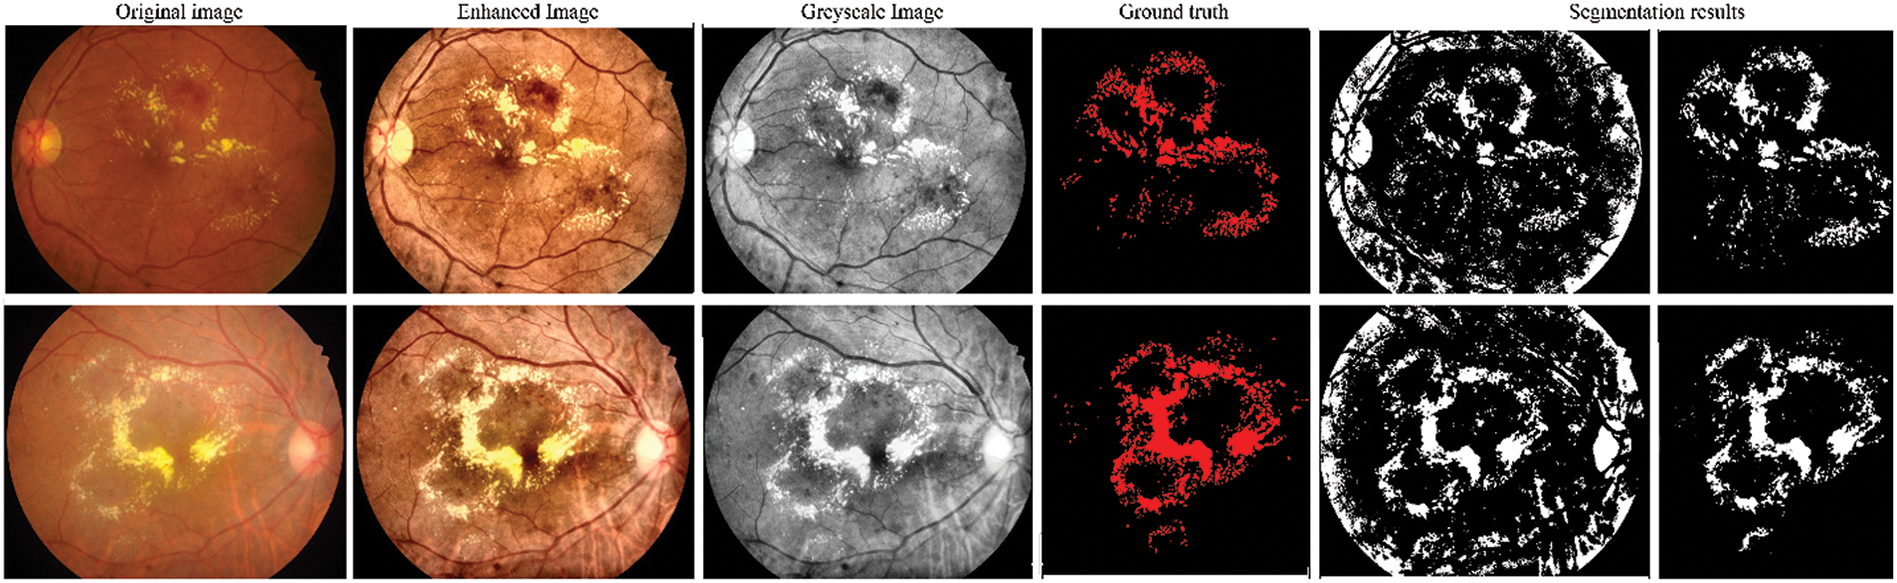
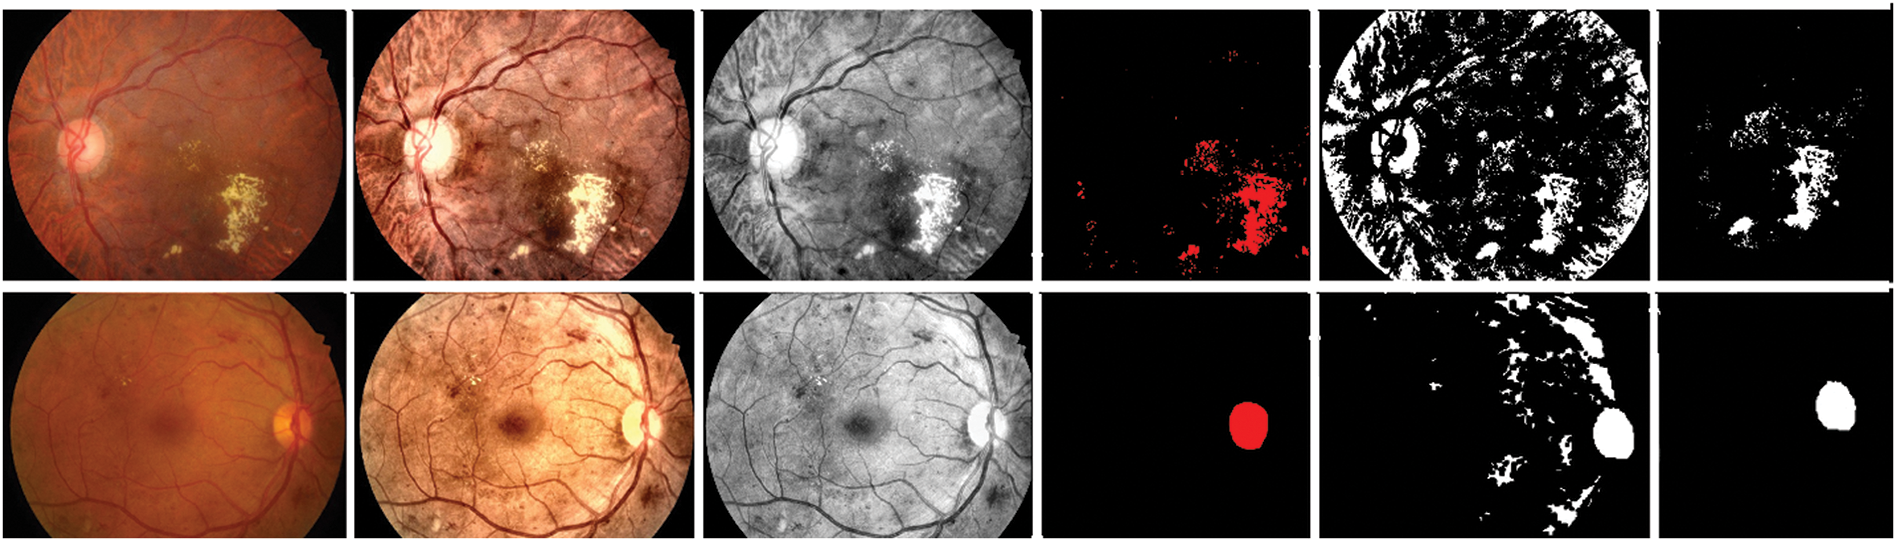
Figure 6: Input, pre-processing, ground truth, and the predicted segmentation results obtained by the proposed model for some sample images
Fundus images are valuable in detecting areas affected by diabetic eye disease. However, manually identifying these areas presents a significant challenge for ophthalmologists. In response to this challenge, we introduce an optimized method known as Genetic Grey Wolf Optimization for hyperparameter tuning the Fully Convolutional Encoder-Decoder Network. We aim to accurately identify the regions in fundus images associated with diabetic eye disease. The effectiveness of G-GWO is demonstrated through its comparison with four variants of the GWO algorithm, as well as the GA and PSO strategies for hyperparameter optimization. We conducted extensive experiments using the IDRiD, DR-HAGIS, and ODIR datasets. As a result of the proposed FCEDN model, several evaluation metrics—including the Jaccard coefficient, Jaccard loss, accuracy, sensitivity, specificity, and precision—have shown significant improvement. The proposed model outperforms other optimization techniques and the latest deep learning methods examined in this study. Despite our research covering several significant aspects, some areas warrant further exploration. For instance, the optimization process can be enhanced by introducing additional hyperparameters such as the regularization rate, activation functions, and training size and rate. Furthermore, we could examine the use of different optimization algorithms to increase the efficacy of the FCEDN model during the weight-updating phase. This study concludes by introducing a new method, G-GWO, for optimizing the hyperparameters of the FCEDN model in fundus image analysis. The experimental results validate its superiority over other optimization methods and show its potential in accurately identifying areas affected by diabetic eye disease.
The study encompasses potential limitations of the proposed approach, such as dataset generalization, computational complexity, sensitivity to hyperparameters, benchmarking against state-of-the-art, and interpretability of results. Addressing these aspects will provide a comprehensive understanding of the approach’s strengths and areas for improvement. Furthermore, suggesting future research directions will underscore the significance of the study in advancing image segmentation with genetic optimization techniques for Fully Convolutional Encoder-Decoder Network (FCEDN) models in medical imaging applications.
Acknowledgement: We would like to express our sincere gratitude to all those who have supported and contributed to the completion of this manuscript.
Funding Statement: This work was supported in part by the National Natural Science Foundation of China under Grant 11527801 and 41706201.
Author Contributions: The authors confirm their contribution to the paper as follows: Conceptualization, A.Q.K. and G.S.; Methodology, A.Q.K., Y.L., A.B.; Software, A.Q.K. and A.B.; Validation, Y.L. and M.A.M.; Formal analysis, G.S., M.A.M.; Writing–original draft, A.Q.K.; Writing–review & editing, A.B.; Visualization, G.S., Y.L.; Project administration, G.S.; Supervision, G.S.; Funding acquisition, G.S., Y.L.
Availability of Data and Materials: The data used to support the findings of this study are available from the first author upon request.
Conflicts of Interest: The authors declare that they have no conflicts of interest to report regarding the present study.
References
1. N. H. Cho, J. E. Shaw, S. Karuranga, Y. Huang, D. R. Fernandes et al., “IDF diabetes atlas: Global estimates of diabetes prevalence for 2017 and projections for 2045,” Diabetes Research and Clinical Practice, vol. 1, no. 138, pp. 271–281, 2018. [Google Scholar]
2. N. G. Forouhi and N. J. Wareham, “Epidemiology of diabetes,” Medicine, vol. 47, no. 1, pp. 22–27, 2019. [Google Scholar]
3. A. Bilal, G. Sun and S. Mazhar, “Survey on recent developments in automatic detection of diabetic retinopathy,” Journal Français d'Ophtalmologie, vol. 44, no. 3, pp. 420–440, 2021. [Google Scholar]
4. T. Y. Wong, J. Sun, R. Kawasaki, P. Ruamviboonsuk, N. Gupta et al., “Guidelines on diabetic eye care: The international council of ophthalmology recommendations for screening, follow-up, referral, and treatment based on resource settings,” Ophthalmology, vol. 125, no. 10, pp. 1608–1622, 2018. [Google Scholar] [PubMed]
5. A. Bilal, G. Sun, Y. Li, S. Mazhar and A. Q. Khan, “Diabetic retinopathy detection and classification using mixed models for a disease grading database,” IEEE Access, vol. 9, pp. 23544–23553, 2021. [Google Scholar]
6. A. Bilal, G. Sun, S. Mazhar, A. Imran and J. Latif, “A transfer learning and U-Net-based automatic detection of diabetic retinopathy from fundus images,” Computer Methods in Biomechanics and Biomedical Engineering: Imaging & Visualization, vol. 10, no. 6, pp. 663–674, 2022. [Google Scholar]
7. A. Bilal, L. Zhu, A. Deng, H. Lu and N. Wu, “AI-based automatic detection and classification of diabetic retinopathy using U-net and deep learning,” Symmetry, vol. 14, no. 7, pp. 1427–1446, 2022. [Google Scholar]
8. K. Simonyan and A. Zisserman, “Very deep convolutional networks for large-scale image recognition,” in Proc. of 3rd Int. Conf. on Learning Representations (ICLR), San Diego, Californai, USA, pp. 1–14, 2015. [Google Scholar]
9. C. Szegedy, W. Liu, Y. Jia, P. Sermanet, S. Reed et al., “Going deeper with convolutions,” in Proc. of IEEE Conf. on Computer Vision and Pattern Recognition, Boston, Massachusetts, USA, pp. 1–9, 2015. [Google Scholar]
10. A. Bilal, G. Sun, S. Mazhar and A. Imran, “Improved grey wolf optimization-based feature selection and classification using CNN for diabetic retinopathy detection,” in Evolutionary Computing and Mobile Sustainable Networks: Proc. of ICECMSN 2021, Singapore, Springer, pp. 1–14, 2022. [Google Scholar]
11. K. Bittner, S. Cui and P. Reinartz, “Building extraction from remote sensing data using fully convolutional networks,” The International Archives of the Photogrammetry, Remote Sensing and Spatial Information Sciences, vol. 42, pp. 481–486, 2017. [Google Scholar]
12. J. Ji, X. Lu, M. Luo, M. Yin, Q. Miao et al., “Parallel fully convolutional network for semantic segmentation,” IEEE Access, vol. 9, pp. 673–682, 2020. [Google Scholar]
13. V. Badrinarayanan, A. Kendall and R. Cipolla, “Segnet: A deep convolutional encoder-decoder architecture for image segmentation,” IEEE Transactions on Pattern Analysis and Machine Intelligence, vol. 39, no. 12, pp. 2481–2495, 2017. [Google Scholar] [PubMed]
14. O. Ronneberger, P. Fischer and T. Brox, “U-net: Convolutional networks for biomedical image segmentation,” in Proc. of 18th Int. Conf. on Medical Image Computing and Computer-Assisted Intervention-MICCAI 2015, Munich, Germany, pp. 234–241, 2015. [Google Scholar]
15. E. B. Kablan, H. Dogan, M. E. Ercin, S. Ersoz and M. Ekinci, “An ensemble of fine-tuned fully convolutional neural networks for pleural effusion cell nuclei segmentation,” Computers & Electrical Engineering, vol. 81, pp. 106533, 2020. [Google Scholar]
16. J. Li, Y. Wu, N. Shen, J. Zhang, E. Chen et al., “A fully automatic computer-aided diagnosis system for hepatocellular carcinoma using convolutional neural networks,” Biocybernetics and Biomedical Engineering, vol. 40, no. 1, pp. 238–248, 2020. [Google Scholar]
17. D. Wang, Z. Li, N. Dey, A. S. Ashour, L. Moraru et al., “Deep-segmentation of plantar pressure images incorporating fully convolutional neural networks,” Biocybernetics and Biomedical Engineering, vol. 40, no. 1, pp. 546–558, 2020. [Google Scholar]
18. Y. Wang, H. Zhang and G. Zhang, “cPSO-CNN: An efficient PSO-based algorithm for fine-tuning hyper-parameters of convolutional neural networks,” Swarm and Evolutionary Computation, vol. 49, pp. 114–123, 2019. [Google Scholar]
19. Y. Li, J. Xiao, Y. Chen and L. Jiao, “Evolving deep convolutional neural networks by quantum behaved particle swarm optimization with binary encoding for image classification,” Neurocomputing, vol. 362, pp. 156–165, 2019. [Google Scholar]
20. Y. Yoo, “Hyperparameter optimization of deep neural network using univariate dynamic encoding algorithm for searches,” Knowledge-Based Systems, vol. 178, pp. 74–83, 2019. [Google Scholar]
21. R. Mohakud and R. Dash, “Survey on hyperparameter optimization using nature-inspired algorithm of deep convolution neural network,” in Intelligent and Cloud Computing: Proc. of ICICC 2019, vol. 1, Singapore: Springer, pp. 737–744, 2020. [Google Scholar]
22. S. Mirjalili, S. M. Mirjalili and A. Lewis, “Grey wolf optimizer,” Advances in Engineering Software, vol. 69, no. 1, pp. 46–61, 2014. [Google Scholar]
23. A. K. M. Khairuzzaman and S. Chaudhury, “Multilevel thresholding using grey wolf optimizer for image segmentation,” Expert Systems with Applications, vol. 86, pp. 64–76, 2017. [Google Scholar]
24. M. Fahad, F. Aadil, S. Khan, P. A. Shah, K. Muhammad et al., “Grey wolf optimization based clustering algorithm for vehicular ad-hoc networks,” Computers & Electrical Engineering, vol. 70, pp. 853–870, 2018. [Google Scholar]
25. S. Ozturk and B. Akdemir, “Automatic leaf segmentation using grey wolf optimizer based neural network,” in 2017 Electronics, Palanga, Lithuania: IEEE, pp. 1–6, 2017. [Google Scholar]
26. N. Mittal, U. Singh and B. S. Sohi, “Modified grey wolf optimizer for global engineering optimization,” Applied Computational Intelligence and Soft Computing, vol. 2016, pp. 1–17, 2016. [Google Scholar]
27. H. Joshi and S. Arora, “Enhanced grey wolf optimization algorithm for global optimization,” Fundamenta Informaticae, vol. 153, no. 3, pp. 235–264, 2017. [Google Scholar]
28. M. H. Nadimi-Shahraki, S. Taghian and S. Mirjalili, “An improved grey wolf optimizer for solving engineering problems,” Expert Systems with Applications, vol. 166, pp. 113917, 2021. [Google Scholar]
29. P. Porwal, S. Pachade, R. Kamble, M. Kokare, G. Deshmukh et al., “Indian diabetic retinopathy image dataset (IDRiDA database for diabetic retinopathy screening research,” Data, vol. 3, no. 3, pp. 25, 2018. [Google Scholar]
30. S. Holm, G. Russell, V. Nourrit and N. McLoughlin, “DR HAGIS—A fundus image database for the automatic extraction of retinal surface vessels from diabetic patients,” Journal of Medical Imaging, vol. 4, no. 1, pp. 014503, 2017. [Google Scholar] [PubMed]
31. X. Deng, L. Tian, Z. Liu, Y. Zhou and Y. Jie, “A deep learning approach for the quantification of lower tear meniscus height,” Biomedical Signal Processing and Control, vol. 68, pp. 102655, 2021. [Google Scholar]
32. J. H. Holland, “Genetic algorithms,” Scientific American, vol. 267, no. 1, pp. 66–73, 1992. [Google Scholar]
33. L. Wang, H. Liu, Y. Lu, H. Chen, J. Zhang et al., “A coarse-to-fine deep learning framework for optic disc segmentation in fundus images,” Biomedical Signal Processing and Control, vol. 51, pp. 82–89, 2019. [Google Scholar] [PubMed]
34. A. Kwasigroch, B. Jarzembinski and M. Grochowski, “Deep CNN based decision support system for detection and assessing the stage of diabetic retinopathy,” in 2018 Int. Interdisciplinary PhD Workshop (IIPhDW), Swinoujscie, Poland, pp. 111–116, 2018. [Google Scholar]
35. P. Prentašić and S. Lončarić, “Detection of exudates in fundus photographs using convolutional neural networks,” in 2015 9th Int. Symp. on Image and Signal Processing and Analysis (ISPA), Zagreb, Croatia, pp. 188–192, 2015. [Google Scholar]
36. Z. Li, Y. He, S. Keel, W. Meng, R. T. Chang et al., “Efficacy of a deep learning system for detecting glaucomatous optic neuropathy based on color fundus photographs,” Ophthalmology, vol. 125, no. 8, pp. 1199–1206, 2018. [Google Scholar] [PubMed]
37. M. V. dos Santos Ferreira, A. O. de Carvalho Filho, A. D. de Sousa, A. C. Silva and M. Gattass, “Convolutional neural network and texture descriptor-based automatic detection and diagnosis of glaucoma,” Expert Systems with Applications, vol. 110, pp. 250–263, 2018. [Google Scholar]
38. L. Zhang, J. Li, H. Han, B. Liu, J. Yang et al., “Automatic cataract detection and grading using deep convolutional neural network,” in 14th Int. Conf. on Networking, Sensing and Control (ICNSC), Calabria, Italy, IEEE, pp. 60–65, 2017. [Google Scholar]
39. J. Ran, K. Niu, Z. He, H. Zhang and H. Song, “Cataract detection and grading based on a combination of deep convolutional neural network and random forests,” in 2018 Int. Conf. on Network Infrastructure and Digital Content (IC-NIDC),IEEE, Guiyang, China, pp. 155–159, 2018. [Google Scholar]
40. X. Xu, L. Zhang, J. Li, Y. Guan and L. Zhang, “A hybrid global-local representation CNN model for automatic cataract grading,” IEEE Journal of Biomedical and Health Informatics, vol. 24, no. 2, pp. 556–567, 2019. [Google Scholar] [PubMed]
41. J. Li, X. Xu, Y. Guan, A. Imran, B. Liu et al., “Automatic cataract diagnosis by image-based interpretability,” in 2018 IEEE Int. Conf. on Systems, Man, and Cybernetics (SMC), IEEE, Miyazaki, Japan, pp. 3964–3969, 2018. [Google Scholar]
42. Y. Dong, Q. Zhang, Z. Qiao and J. J. Yang, “Classification of cataract fundus image based on deep learning,” in 2017 IEEE Int. Conf. on Imaging Systems and Techniques (IST), IEEE, Beijing, China, pp. 1–5, 2017. [Google Scholar]
43. J. Li, L. Xie, L. Zhang, L. Liu, P. Li et al., “Interpretable learning: A result-oriented explanation for automatic cataract detection,” in Frontier Computing: Theory, Technologies and Applications (FC 2018), vol. 7, Singapore: Springer Singapore, pp. 296–306, 2019. [Google Scholar]
44. H. Faris, I. Aljarah, M. A. Al-Betar and S. Mirjalili, “Grey wolf optimizer: A review of recent variants and applications,” Neural Computing and Applications, vol. 30, pp. 413–435, 2018. [Google Scholar]
45. W. Long, T. Wu, S. Cai, X. Liang, J. Jiao et al., “A novel grey wolf optimizer algorithm with refraction learning,” IEEE Access, vol. 7, pp. 57805–57819, 2019. [Google Scholar]
Cite This Article
 Copyright © 2023 The Author(s). Published by Tech Science Press.
This work is licensed under a Creative Commons Attribution 4.0 International License , which permits unrestricted use, distribution, and reproduction in any medium, provided the original work is properly cited.
 Downloads
 Citation Tools