
 Submit a Paper
 Propose a Special lssue
 Open Access
ARTICLE

Fake News Detection Using Machine Learning and Deep Learning Methods
1 Department of Computer Science, Comsats University Islamabad, Wah Cantt, 47010, Pakistan
2 Department of Cybersecurity, College of Computer Science and Engineering, University of Jeddah, Jeddah, 21959, Saudi Arabia
* Corresponding Author: Ammar Saeed. Email:
Computers, Materials & Continua 2023, 77(2), 2079-2096. https://doi.org/10.32604/cmc.2023.030551
Received 29 March 2022; Accepted 13 June 2022; Issue published 29 November 2023
 View Full Text
 Download PDF
Abstract
The evolution of the internet and its accessibility in the twenty-first century has resulted in a tremendous increase in the use of social media platforms. Some social media sources contribute to the propagation of fake news that has no real validity, but they accumulate over time and begin to appear in the feed of every consumer producing even more ambiguity. To sustain the value of social media, such stories must be distinguished from the true ones. As a result, an automated system is required to save time and money. The classification of fake news and misinformation from social media data corpora is the subject of this research. Several preprocessing and data improvement procedures are used to gather and preprocess two fake news datasets. Deep text features are extracted using word embedding models Word2vec and Global Vectors for Word representation while textual features are extracted using n-gram approaches named Term Frequency-Inverse Document Frequency and Bag of Words from both datasets individually. Bidirectional Encoder Representations from Transformers (BERT) is also employed to derive embedded representations from the input data. Finally, three Machine Learning (ML) and two Deep Learning (DL) algorithms are utilized for fake news classification. BERT also carries out the classification of embedded outcomes generated by it in parallel with the ML and DL models. In terms of overall performance, the DL-based Convolutional Neural Network stands out in the case of the first while BERT performs better in the case of the second dataset.Keywords
The transformation of the world into a global village has aided in the widespread availability of the Internet to all. Furthermore, the widespread availability of low-cost, internet-enabled smartphones and other electronic devices has prompted people from a variety of educational, knowledge, cultural, and geographical backgrounds to log on to community platforms and express their views. Such easy access to cyberspace portals has numerous advantages, including the ability to investigate relevant news from around the world and share thoughts and articles about it, but it also has several drawbacks. Because only a tiny percentage of the community reads a newspaper or watches TV anymore, but practically everyone carries an internet-enabled device with them, news that is shared on the internet has a greater chance of being read by a wide number of people. Apart from that, sharing news, facts, and ideas on community platforms is simple, painless, low-cost, and quick, which is why everyone does it [1]. The issue develops when some sources propagate incorrect or misleading news or content on social media platforms due to a lack of understanding required for ethical and proper internet usage, a lack of academic background, or a desire to gain views and likes from the community. By changing the original or trustworthy substance of the original news, a person or a company can purposefully create misleading news. As previously said, such news reaches various parts of the world, where users of various backgrounds read them and, in turn, propagate them without any knowledge of their veracity. As a result, they continue to spread and accumulate, taking up the majority of trending news on community sites. This is due to the fact that these social media sites do not employ any sort of evaluation mechanism to distinguish between false and true headlines [2].
The dissemination of such messages has a deplorable impact on society, region, state, or country's political, economic, and educational activities. It has the potential to influence an individual's strategy and decision-making abilities, as well as impact how someone thinks about something in a certain place. Certain groups, such as PolitiFact, Snopes, and TruthOrFiction, have used the classic journalistic technique to deal with the ever-increasing volume of false news. The aforementioned methodology entails enlisting the help of several real-world reporters to verify the veracity of multiple news headlines, which is a reasonable but time-consuming and tiresome method. This fuels the desire to construct an automated system that can verify the legitimacy of news pieces on social media platforms and differentiate false news from true news. Researchers may now use Artificial Intelligence (AI) and Machine Learning (ML) applications in complicated and important classification problems, all hail to AI and ML [3]. ML-based models can be used to create small automated systems that can be trained on provided data and then perform real-time classification tasks with extreme accuracy and precision on their own. In this study, two fake news data instances gathered from diverse internet sources are evaluated and identified using three distinct ML models Support Vector Machine (SVM), Random Forest (RF), Naïve Bayes (NB), two Deep Learning (DL) frameworks Convolutional Neural Network (CNN), Long Short-Term Memory Network (LSTM) and a transformer-based method Bidirectional Encoder Representations for Transformers (BERT) for classification in the proposed work. The model's operation is divided into certain levels, with raw input data provided in the form of single and multiple combination sets to the model. The data is then preprocessed, and deep embedding features are extracted using Global Vectors for Word representation (GloVe), Word2vec, and n-grams based text features are extricated using Term Frequency–Inverse Document Frequency (TF-IDF), and Bag of Words (BoW) models. BERT is employed as a standalone transformation model that operates on preprocessed data and provides embedded feature outcomes. To carry out the fake news classification, the extricated textual features are then fed into the three ML models RF, SVM, and Logistic Regression (LR), and the deep features are provided to CNN and LSTM, while BERT itself classifies the feature sets generated by it. The results are derived for both the datasets individually which are compared and evaluated using various performance metrics. When overall performance is considered on all feature combinations, CNN seems to be the best model in the case of the first dataset while BERT performs well as far as the second dataset is concerned.
The rest of the paper is formatted as follows: Section 2 gives an overview of the strategies employed in prior publications for analyzing and classifying and analyzing fake news. The proposed methodology of this research work is discussed in Section 3. Section 4 lists all of the experiments done, together with their findings and performance evaluations. Section 5 discusses the findings, and Section 6 concludes with a summary of the presented tasks.
For the detection of fraudulent articles, Bahad et al. [4] used a hybrid LSTM network. The performance of the algorithms is evaluated using standardized datasets relating to fabricated news. Janze et al. [5] created a new misleading news analysis technique that can automatically detect bogus statements. Authors of news items published on Facebook during the 2016 US presidential election put the models to the test. Pérez-Rosas et al. [6] proposed a new forged news detecting method based on a combination of contextual and ML techniques as well as literal. A competitive model was introduced by Zhu et al. [7]. The model identifies the link between true and false news and refreshes its intelligence to mitigate the impact of false news. Pulido et al. [8] used textual content to determine if incoming information is accurate or not. We must determine whether the news article has any health-related evidence or is solely based on forceful phrasing. The nature of disinformation and the nature of interactions based on potential or real social impact are studied through data analysis. The data for this investigation was gathered through postings and comments on numerous social media platforms [9–11].
Anoop et al. [12] used common community platforms to detect fake health-related news. For detecting misinformation, many algorithms are employed. CNN provided a dataset of 500 real health and well-being stories with six features and two real and fake classes. The overall number of words in a real class is 362117, while the total number of words in a fictitious category is 289477. In actual and fake classrooms, the average number of words per document is 724 and 578, respectively. K-Means and Density-based Spatial Clustering of Applications with Noise (DBSCAN) methods based on different parameters are utilized to train the algorithms. Han et al. [13] proposed a classification system based on the dissemination of false and true news. Graph Neural Network (GNN) is reportedly used to discern between fake and true news for non-Euclidean data. The news can be replied to by several users. The goal of the article was to use GNN to validate news based on distribution patterns. Neighborhood and characteristic matrices were used to produce these graphs. News stories were tagged using the FakeNewsNet dataset. Because the entire dataset and incremental training cannot be taught accurately at the same time, only 75% of the dataset was trained. The dataset is then trained in its entirety using a continuous learning technique—training the dataset using GNN and continuing to train on additional datasets results in catastrophic forgetting. GEM, a technique for storing multiple samples of previous tasks when learning a new task, and elastic weight consolidation are thus used to avoid updating parameters that are important to older tasks to achieve the balanced performance of existing and new data to avoid retraining complete data, which can be very costly for larger data compilations. Khan et al. [14] used statistical analysis to examine the execution quality of established approaches incorporating convolutional-LSTM, character-level LSTM, and Hierarchical Attention Networks (HAN) by applying them to two publicly available datasets and a custom-generated dataset containing news articles. With an overall accuracy of 95%, the raw text of news items is preprocessed by removing superfluous Uniform Resource Locators (URLs), white spaces, stop words, correction of misspellings, removal of suffix, and lastly rejoining the word tokens by white spaces. Overfitting can be avoided using advanced models like Convolutional-LSTM, Continual Learning- LSTM, and Convolutional-HAN, which demand more attention. In addition, topic-based analysis is used to accurately recognize the type of news story connected to health, politics, or research-related depictive news. To analyze fraudulent or misleading news stories, Monti et al. [15] employed a new geometric model based on DL. The model was evaluated using reports from Twitter. Guo et al. also developed an emotion-based approach for analyzing bogus news. The model's development begins with a mix of the publisher's and social feelings [16].
Hakak et al. [17] made use of a Liar dataset based on manually labeled tagged brief remarks about various topics, the Information Security and Object Technology (ISOT) dataset comprised of 44,898 false and true news articles. A total of 26 data attributes are extracted for the formulated work which is then forwarded to an ensemble ML model consisting of RF, Decision Tree (DT), and Extra-tree (ET) algorithms. For training, 70% of data is utilized and the rest of 30% is maintained for testing purposes where the DT classifier outperforms its fellow ML models by achieving an accuracy of 99.29% while the performance of other ML models is also significantly improved when data is carefully engineered. The authors [18] developed a novel model based on the combination of data preparation and classification modules. Four datasets including the George McIntire dataset, a publicly available Kaggle dataset, Gossipcop, and Politifact datasets are gathered, all of which contain 6335, 26000, 21,641 and 948 truth-based and false news, respectively. BerConvoNet is proposed for the classification of forged news from the data pool that contains a News embedding block (NEB) where data cleansing, preprocessing and tokenization are performed along with deep feature extraction with GloVe and BERT models and Multiscale feature block (MSFB) which contains a custom CNN. The CNN is based on convolutional, fully connected, and pooling layers where Adam is used for optimization and varying kernel sizes are tested. BERT provides the best accuracy results when paired with the developed CNN and provides an average accuracy above 90% on all four datasets. Ahmad et al. [19] proposed an ensemble mechanism for the categorization of forged news. Three datasets are utilized where the first one is the ISOT dataset, and the rest are obtained from Kaggle and are also publicly available. The corpus is filtered by removing dates, URLs, and other unnecessary information before feeding it to the proposed model. The utilized ensemble model is based on a combination of ML models: LR, SVM, Multilayer perceptron, K-Nearest Neighbor, bagging classifiers as well as DL- based CNN and LSTM for classification. Based on performance standards, the RF classifier achieved the highest accuracy of 99% on ISOT, third and fourth datasets, bagging and boosting classifiers achieved the highest accuracies of 94% on the second dataset.
After going through some of the previous works and studying the behavior of various ML, DL, and other models, it has been deduced that each model performs best in a certain set of parameters. DL models work best on large datasets, require less or no human intervention, are much more complex and denser in their architectures, can be designed as in a multi-layer structure to deal with complex datasets, require high-end machines to operate as per their potential, engineer and extract high-level features from data on their own without having the need of an extractor and usually take longer execution times. On the contrary, ML models can work on smaller datasets, require more human guidance at different stages, are developed in both simpler and complex architectures but not as complex as DL models, require a feature extractor to derive features from the dataset, are faster in terms of execution but compromise accuracy in most of the cases. Meanwhile, BERT is trained on more than 2500 million-word instances, it performs extraordinarily in both small and large-scale datasets. This capability makes BERT unique and more powerful than ML and DL models. Moreover, BERT returns different vectors for the same word predicate depending upon its usage sentiment and meaning, unlike previous word embedding models. In all of the considered literature work, ML and DL models have been used both individually and in combination. Utilizing the briskness and flexibility of ML models with the depth and intricacy of DL models does yield the best results. Moreover, authors of previous works have made use of textual features and word embedding features while working with text sentiment data. Taking a lead from all this discussion, make we believe that in addition to data engineering, preprocessing, feature extraction carried out by employing N-gram methods such as TF-IDF and GloVe, word embedding methods including Word2vec and BoW, when paired with transformation encoded sequences generated by BERT, multiple ML and DL models, provides the best possible results as are required by an optimally best performing model.
The proposed model is based on certain building blocks where the initial building block is based on data preprocessing with steps such as null values removal, filtration of unnecessary expressions, stop words removal, lemmatization, tokenization, and contextual analysis. To derive meaningful insights from the engineered data, the feature extraction phase is performed in the block to follow using the word embedding methods Word2vec, GloVe and N-gram methods TF-IDF, BoW. The best textual feature sets are finally transferred to certain ML algorithms RF, SVM, LR, and the best deep feature sets are given to CNN and LSTM for classification. Furthermore, BERT is also utilized which takes preprocessed data as input, derives embedded representations from it based on its encoder information and performs the classification as well while doing all the mentioned tasks in parallel with the rest of the model. The evaluation of derived results is performed based on accuracy, recall, precision, and F1-score. Fig. 1 illustrates the working flow of the formulated model for fake news classification.
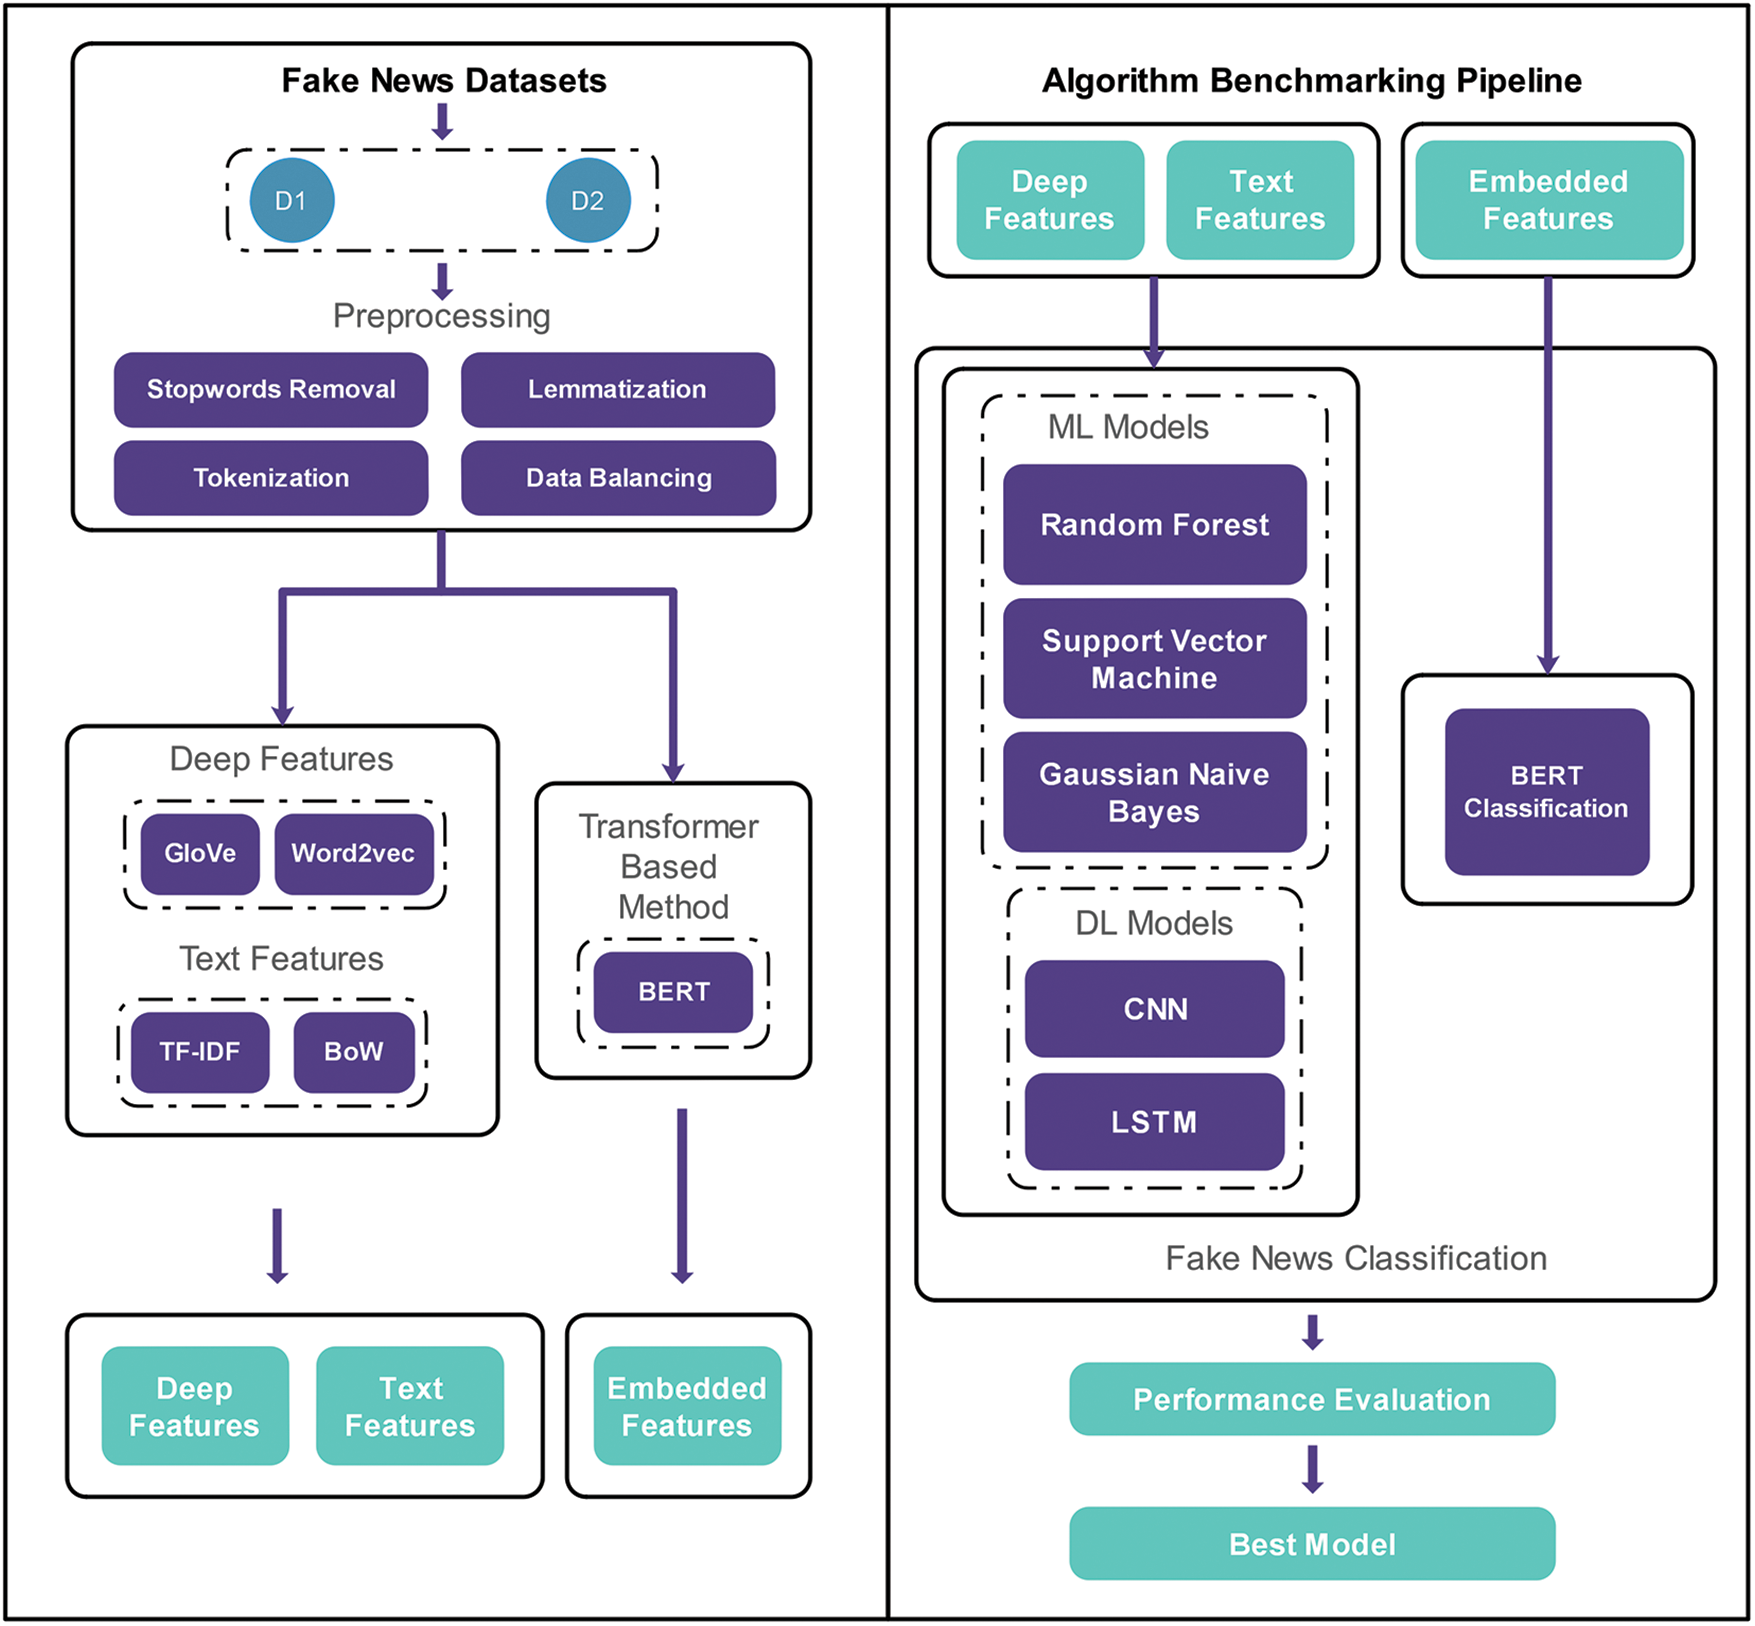
Figure 1: Framework diagram for the fake news detection model
3.1 Datasets Acquisition and Statistics
Two different datasets are used to analyze and assess the performance of the proposed model. Both datasets are obtained from various online sources and contain distinct data based on real and fake news.
3.1.1 Dataset 1-Fake News Detection
The dataset named Fake News Detection1 is made open source on the Kaggle platform. The description or the source of the collected dataset is not updated to date. As the dataset contains fake and real news articles, it can facilitate conducting experiments related to fake news classification. The dataset has four columns or attributes, named URL, headline, body text, and label. The total occurrences in the dataset are 4009, 2137 of which are marked as real news and 1872 as fake news. The dataset in its original form contains four columns where each column denotes a specific data attribute. The news headline column contains the headline text for news, the body column contains the descriptive body text for news, the URL column contains the URL for the original news source and the label column contains the label describing whether any included news is true or false. The data columns are analyzed and suitable columns including news body and their corresponding labels are selected for further processing. Other statistics found about the dataset during exploratory data analysis are also mentioned in Table 1.

3.1.2 Dataset 2-Real and Fake News Dataset
The dataset Real and Fake news2 comes with both fake or misleading and truth-based news. It was generated by a company named nop.ai. The dataset has 6335 instances and four columns or attributes named index, title, text, and label. The index column contains the incremental data-position indices, the title column contains the title headline for the concerning news, the text column contains the original concerned descriptive news body, and the label column contains the label denoting whether the news is true or false. The dataset is analyzed and the suitable columns including the news text along with their corresponding labels are selected for further procedure. The fake news in the dataset consists of 3164, and the real news in the dataset contains 3172 records along with other data as depicted in Table 2. The labels across each news represent whether it is fake or real.

Dataset state and condition play a critical role in an automated learning and differentiation schema. When data is used in its amorphous form, it creates uncertainty and reduces the accuracy of the results. Fake or inaccurate news material is spread in an amorphous manner by social media users. On unstructured data, the ML and DL algorithms do not perform well. As a result, preprocessing and text mining techniques must be used to clean and prepare the data before applying text analysis and classification operations to it. Data preparation is the first stage in any classification activity since it prepares, cleans, and eliminates ambiguities. Letter conversion to lowercase, stop words removal, hyperlinks removal, inappropriate full stop and half sentence removal, lemmatization, and tokenization are among the preprocessing techniques used in this study.
The model cannot work on or classify the data in its regular textual form after data preparation is achieved, which is why it must be translated into mathematical and vector format so that the ML and DL algorithms can interpret it. As explained in Section 3, the vector data derived from the text will be given to the ML and DL models as features. Therefore, a complete representation of the words in the corpus must be extracted, and there are several methods for doing so. Deep textual feature techniques such as word embedding, and n-gram methods are employed to derive features from the preprocessed data. As pre-trained word embeddings, the proposed approach uses GloVe from the Natural Language Processing (NLP) library named Stanford NLP3 and Word2vec from Google news vectors4. BoW and TF-IDF are used for n-gram-based feature extraction. These methods are addressed in the sections below about the proposed study.
Word embedding [20] is a technique for converting and representing textual data made up of words into a vector and mathematical form. There are several models available for this purpose, but we used the pre-trained GloVe from Stanford NLP and Word2vec from Google news vectors in this investigation. The GloVe is an unattended learning technique that uses the global word co-occurrence matrix to extract word embeddings from an input data corpus. When applied to any data, it directly obtains information about the words occurring frequently in that data and maps the words into vector spaces [21]. It is trained on global statistics of words included in a large corpus compiled from online sources and when applied to any data, it obtains Information about the words occurring frequently in that data and maps the words into vector spaces. It has been widely used to derive features and pass them on to classification models in text classification challenges. It is based on the Log Bilinear model, which uses the weighted least squares technique [22] as Eq. (1) represents.
where,
where,
where,
The preprocessed data is given to both the GloVe and Word2vec models in the proposed study, and the features created by them are then given to a customized CNN for results derivation and performance evaluation.
Any series of word tokens in a given data is referred to as an N-gram which is based on unigrams, bigrams, trigrams continuing so. An n-gram model can calculate and forecast the likelihood of specific word sequences in a data corpus. Such models are effective in text classification problems where the number of specific terms included in the vocabulary from the corpus must be counted [24]. The TF-IDF is a metric that assesses how closely a word in a catalogue corresponds to its meaning or mood. It works by taking the frequency of terms in a document and multiplying it by the inverse frequency of words that appear in several texts on a regular basis [25]. The frequency of documents in a corpus is calculated by TF-IDF [26] based on mathematical formulation represented in Eq. (4).
where,
where,
3.3.3 Transformer Based NLP Method
Transformer based DL models are now adays widely used in NLP. In the proposed work we utilized a transformer-based model BERT for the fake news classification. A transformer consists of two main components, Encoder, and Decoder. The encoder takes words as input to generate embedding that encapsulate the meaning of the word while the decoder takes the embedding generated by Encoder to generate the next word until the end of the sentence. We utilized BERT as a sentence encoder to properly extract the contextual representation of given sentences. Using Mask Language Modeling (MLM), BERT eliminates the unidirectional limitation [28]. It masks several tokens from the input at random and guesses the original vocabulary id of the masked word using only the input. When compared to prior embedding approaches, MLM has improved BERT's capacity to outperform. It is a deeply bidirectional system capable of processing unlabeled text in all levels by conditioning on both left and right context based on the Transformer backend and works based on the attention mechanism. When the input data is given to BERT, the attention mechanism maps input to a multidimensional space and computes the relevance of each data point. The inputs are then embedded into output transformations and the layer stacks present in both encoder and decoder generate output solutions. The general architecture of BERT [29] is shown in Fig. 2.

Figure 2: General architecture of BERT
The proposed framework takes two fake news datasets as input, employs appropriate preprocessing steps on both, extracts valuable features using deep and textual feature derivation techniques, and finally performs the classification of the datasets individually using three ML algorithms SVM, RF, GNB, and two DL models including a custom CNN and LSTM. BERT also operates on the preprocessed data by deriving embedded outcomes and performs classification on its own. The deep features derived from GloVe and Word2vec are classified using CNN and LSTM, and textual features derived from TF-IDF, and BoW are delivered to three ML-algorithms for classification in a series of experiments. Recall, F1-score, 10-fold accuracy, and precision are among the performance analysis standards used to evaluate the outcomes. Two experiments are performed on Dataset 1. In the first experiment, textual features are given to three ML classifiers SVM, RF and GNB. The results are shown in Table 3 where the four mentioned performance standards are maintained. The experiments were carried out in Python, and the sklearn ensemble package was used to integrate the model into our space. All of the models were trained and evaluated using 90% and 10% of the dataset, respectively.

SVM shows better accuracy on textual features extracted from both TF-IDF and BoW by achieving accuracies of 98.83% and 97.66% respectively which are far superior than RF and GNB. Apart from accuracy, rest of the performance measures are also better for SVM classifier when compared with the rest. Fig. 3 shows a performance comparison of all the three ML models over Dataset 1.

Figure 3: Results comparison of Dataset 1 textual features with ML models
In the second experiment on Dataset 1, the two DL models including CNN and LSTM were provided with the deep features extracted by both GloVe and Word2vec models. CNN was primarily utilized for the classification of vectoral data with high accuracy and speed and here, it was trained and tested on the same data split utilized in ML algorithms while the number of epochs was set to 32 epochs and a batch size of 10 was maintained for model training. Fig. 4 shows the accuracy and loss of CNN in a graphical visualization.

Figure 4: Accuracy and loss ratio visualization of CNN with deep features of Dataset 1
As evidently visible from Fig. 4, the accuracy of CNN for GloVe and Word2vec features lies in between 97% to 99.9% as the number of epochs are increased. The same scenario can be noticed in the loss ratio for both features where the CNN model shows minor fluctuations in the initial epochs and stabilizes in the final epochs for GloVe features while it performs fairly smoother in the case of Word2vec features. In the case of LSTM, the batch size is kept at 10, epochs are set to 20 epochs, while the main layers that constitute LSTM are embedding, dense and SoftMax layers. Fig. 5 shows the accuracy and loss ratio for the LSTM model when trained and evaluated on deep features.

Figure 5: Accuracy and loss ratio visualization of LSTM with deep features of Dataset 1
As demonstrated in Fig. 5, LSTM starts from low to high in terms of accuracy for both GloVe and Word2vec features. It also exhibits the decreasing loss ratio with the progression of epochs for both the feature sets. After the implementation of CNN and LSTM on Dataset 1, BERT was finally implemented that takes as input the preprocessed dataset, encodes it to embedding representation, performs transformations on it, decodes the representations back into vocabulary-based representations and provides the classification results using its deep layers. The same data split was maintained for BERT as well. Fig. 6 presents the performance ratio for BERT.

Figure 6: Accuracy and loss ratio visualization of BERT on Dataset 1
After the performance visualization of CNN, LSTM and BERT, Table 4 confirms the classification results of deep features derived from Word2vec and GloVe with the aforementioned DL models and that of the preprocessed dataset with BERT.
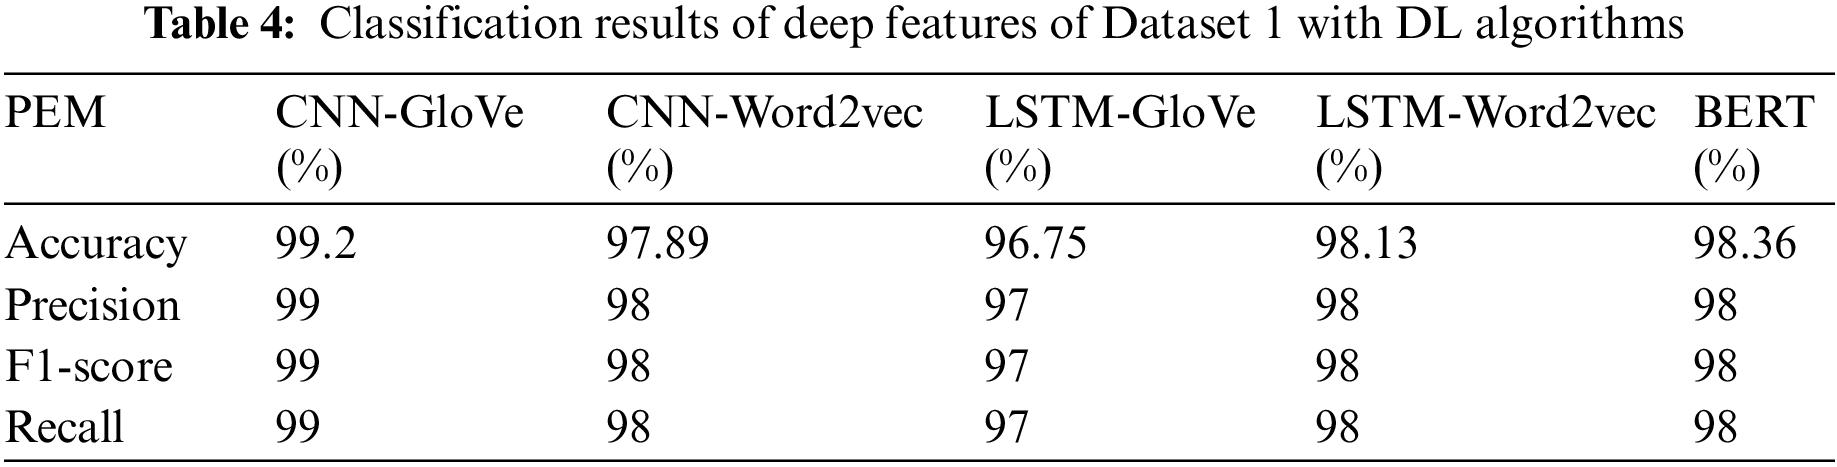
CNN performed best on the features derived by GloVe where it achieved an accuracy of 99.2% which precedes other models. On the other hand, LSTM showed better results when it comes to Word2vec features where the accuracy is noticed to be 98.13%. Since BERT takes both features in the form of a single feature vector, its performance is noted to be on par with CNN and LSTM. After concluding experiments on Dataset 1, the next phase is to repeat the same set of experiments for Dataset 2. In the next experiment, the textual features extracted from the Dataset 2 were given to the three previously used ML models SVM, RF and GNB. The same training testing ratio of 90% and 10%, respectively was maintained along with the same parameters and environment. Table 5 shows the experimental results along with respective evaluation standards.
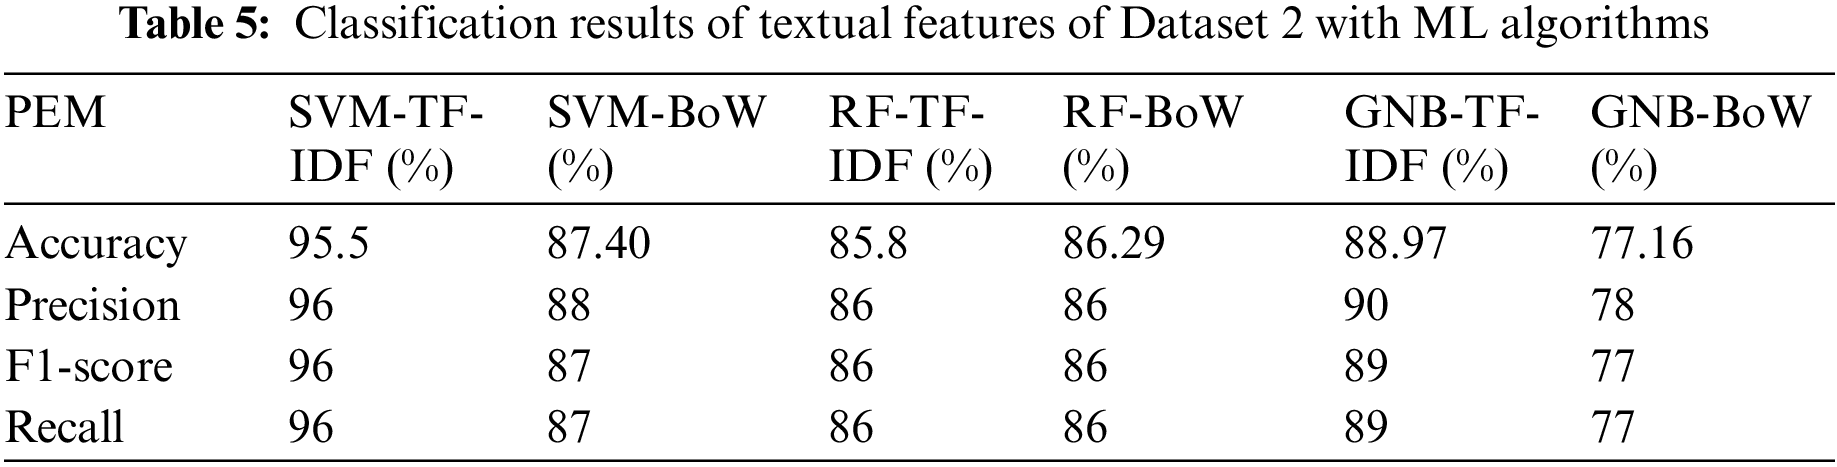
In the case of Dataset 2, SVM once again looks to be performing better as compared to its adversaries. The accuracy of SVM over TF-IDF features turns out to be 95.5% and 87.40 for BoW, both of which are considerably better when compared with the rest. Fig. 7 shows a graphical performance comparison of all three ML models over Dataset 2.

Figure 7: Results comparison of Dataset 2 textual features with ML models
In the next and final experiment conducted on Dataset 2, the same CNN and LSTM were provided with the deep features extracted by both the GloVe and Word2vec models. CNN was trained and tested on the same data splits as in previous experiments, 32 epochs and a batch size of 10. Fig. 8 shows the accuracy and loss of CNN in a graphical visualization in the case of Dataset 2.

Figure 8: Accuracy and loss ratio visualization of CNN with deep features of Dataset 2
As shown in Fig. 8, CNN shows better consistency for GloVe features as compared to Word2vec. Then latter initiates with low accuracy, increases and stabilizes it with the progression of epochs. The loss rate of CNN for both the features also imitates the accuracy behavior as it is extremely low in the case of GloVe features while fluctuates for Word2vec features along with accuracy behavior. In the case of LSTM, the same batch size of 10 and number of 20 epochs was maintained along with the same layer settings. Fig. 9 shows the accuracy and loss ratio for the LSTM model when trained and evaluated on deep features extracted from Dataset 2.

Figure 9: Accuracy and loss ratio visualization of LSTM with deep features of Dataset 2
Finally, the preprocessed Dataset 2 was given to BERT in the form of a single compact vector where the same experimental settings were maintained. Fig. 10 shows the training comparison for BERT on Dataset 2.

Figure 10: Accuracy and loss ratio visualization of BERT on Dataset 2
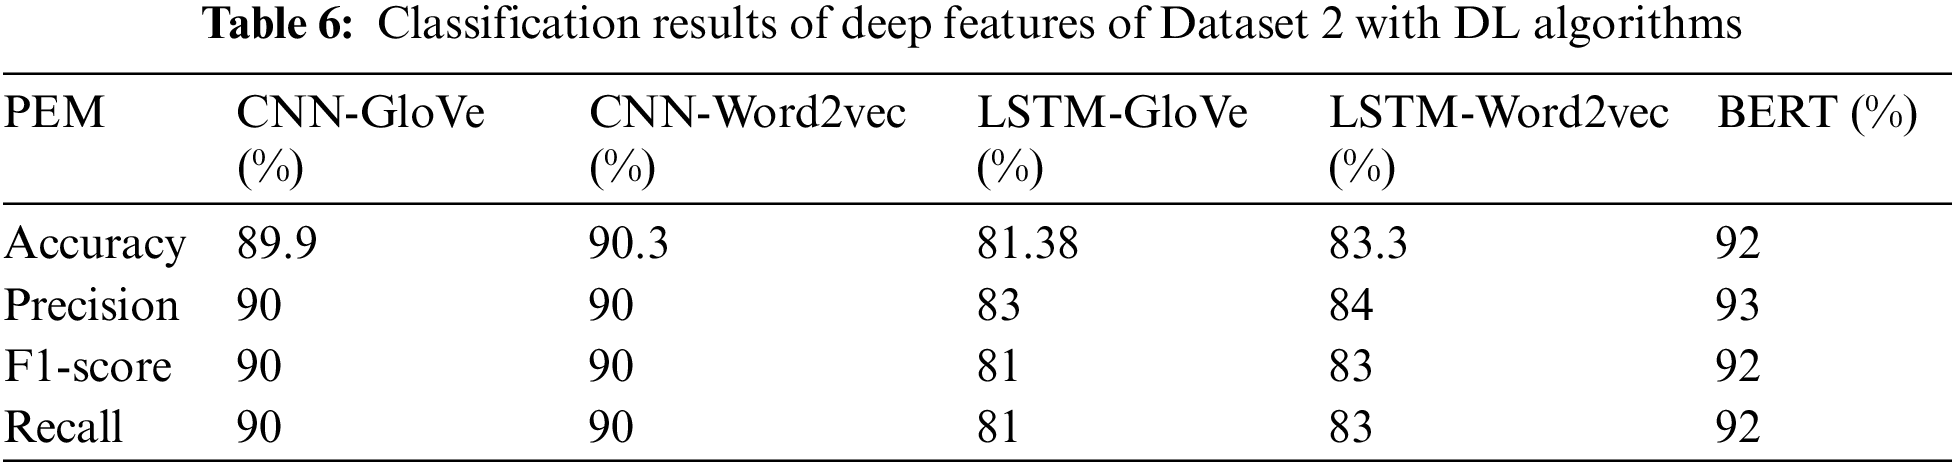
After the performance visualization of CNN, LSTM and BERT on derived deep features of Dataset 2 and Dataset 2 itself, respectively, Table 6 further confirms the classification results statistically based on performance standards.
All the experiments performed for the proposed work are discussed in detail in the preceding section along with the results. It is quite evident that the experiments done upon textual features of Dataset 1 through three ML-models have led to the observation that SVM performs better in terms of accuracy as well as other standards when compared to RF and GNB. SVM achieves an accuracy of 98.83% on TF-IDF based features and 97.66% on BoW based features both of which are superior as compared to the outcomes of other models. Moreover, the experiments performed upon deep features of Dataset 1 indicate that CNN achieves the better accuracy rate of 99.2% on GloVe based features while LSTM achieves the better accuracy rate of 98.13% on Word2vec features. BERT performs better on average and achieves an accuracy of 98.36% on Dataset 1 which lies somewhere in between the maximum accuracies yielded by ML and DL models. Furthermore, it is deduced that CNN performs well on deep features in the case of Dataset 1 as compared to the best ML model in this case, SVM as also demonstrated in Fig. 11a.

Figure 11: (a) Accuracy comparison of best performing ML, DL and BERT models on Dataset 1. (b) Accuracy comparison of best performing ML, DL and BERT models on Dataset
When the same sequence of experiments is repeated for Dataset 2, SVM again outperforms RF and GNB in terms of accuracy rates and other performance measures when the experiment is performed on textual features of Dataset 2. The accuracies achieved by SVM for TF-IDF and BoW based features are 95.5% and 87.40%, respectively. Similarly, when the experiments are carried out on deep features derived from Dataset 2, CNN outperforms LSTM with accuracies of 89.9% and 90.3% on GloVe and Word2vec features, respectively. In the case of Dataset 2, BERT performs considerably better with the accuracy of 92% which is far superior than its performance in the case of Dataset 1. BERT is also proved to be the best performing model in this case as represented in Fig. 11(b). Fig. 12(a) shows the accuracy comparison of ML models for both the employed datasets. It is quite evident that all the ML models generally perform better on Dataset 1 derivations as compared to that of Dataset 2.

Figure 12: (a) Accuracy comparison of ML models on Datasets 1 & 2. (b) Accuracy comparison of DL models and BERT on Datasets 1 & 2
Similarly, Fig. 12b shows the accuracy comparison of DL models including CNN, LSTM as well as that of BERT for both datasets. It is to be noticed that DL models operated on deep features extracted from both datasets while BERT operated on preprocessed datasets themselves and provided its outcome. It can be observed from the figure above that both DL models: CNN and LSTM performed better on average on the deep features extricated from Dataset 1 as compared to those of Dataset 2. BERT also seems to be providing the better accuracy rate on Dataset 1 as compared to Dataset 2.
In the proposed study, a novel framework has been proposed for fake news classification from social media platforms and other online forums. Two real world fake news datasets are obtained are cleansed, prepared, and processed using several preprocessing techniques. Once the datasets are ready for further processing, they are given to word embedding models GloVe, Word2vec and N-gram models TF-IDF, BoW for the extraction of deep and textual features respectively. At the same time, the same preprocessed datasets are also given to the BERT model for vectoral embedding representations extraction. The textual features from both datasets are given to three ML classifiers namely SVM, RF and GNB individually while the deep features of both datasets are given to DL based CNN and LSTM models. Experiments were performed for both the datasets separately and the classification results of ML, DL and BERT models were evaluated and compared using state-of-the-art performance standards. DL models were found to perform better on average when it comes to Dataset 1 while BERT was found to be the overall best model on Dataset 2. In the future, more data engineering techniques such as topic modeling could be focuses so that the same and less varying results can be obtained on any model combination. Nowadays transformer-based models are getting much appreciated results in NLP, so along with Bert, generative pre-training and its variants could also be utilized to explore the variance in results.
Acknowledgement: The authors would like to thank university of Jeddah for supporting this study.
Funding Statement: The authors received no specific funding for this study.
Author Contributions: All of the authors contributed equally while conducting this study.
Availability of Data and Materials: The datasets used in this study are publicly available.
Conflicts of Interest: The authors declare that they have no conflicts of interest to report regarding this study.
1https://www.kaggle.com/jruvika/fake-news-detection
2https://www.kaggle.com/datasets/nopdev/real-and-fake-news-dataset
3https://www.kaggle.com/datasets/rtatman/glove-global-vectors-for-word-representation
4https://www.kaggle.com/datasets/adarshsng/googlenewsvectors
References
1. D. Bossio and S. Bebawi, “Mapping the emergence of social media in everyday journalistic practices,” Media International Australia, vol. 161, no. 1, pp. 147–158, 2016. [Google Scholar]
2. G. Domenico, J. Sit, A. Ishizaka and D. Nunan, “Fake news, social media and marketing: A systematic review,” Journal of Business Research, vol. 124, pp. 329–341, 2021. [Google Scholar]
3. K. Nagi, “New social media and impact of fake news on society,” in Proc. of Int. Conf. on Social Science and Management, Chiang Mai, Thailand, pp. 77–96, 2018. [Google Scholar]
4. P. Bahad, P. Saxena and R. Kamal, “Fake news detection using bi-directional LSTM-recurrent neural network,” Procedia Computer Science, vol. 165, pp. 74–82, 2019. [Google Scholar]
5. C. Janze and M. J. P. Risius, “Automatic detection of fake news on social media platforms,” in Proc. of the 21st Pacific Asia Conf. on Information Systems: Societal Transformation Through IS/IT, PACIS, Langkawi, Malaysia, Association for Information Systems, 2017. [Google Scholar]
6. V. Pérez-Rosas, B. Kleinberg, A. Lefevre and R. Mihalcea, “Automatic detection of fake news,” in Proc. of the 27th Int. Conf. on Computational Linguistics, Santa Fe, New Mexico, USA, pp. 3391–3404, 2017. [Google Scholar]
7. H. Zhu, H. Wu, J. Cao, G. Fu and H. Li, “Information dissemination model for social media with constant updates,” Physica A: Statistical Mechanics and its Applications, vol. 502, pp. 469–482, 2018. [Google Scholar]
8. C. M. Pulido, L. Ruiz-Eugenio, G. Redondo-Sama and B. Villarejo-Carballido, “A new application of social impact in social media for overcoming fake news in health,” International Journal of Environmental Research and Public Health, vol. 17, no. 7, pp. 2430, 2020. [Google Scholar] [PubMed]
9. J. M. N. Aragão, F. D. A. Gubert, R. A. M. Torres, A. S. R. D. Silva and N. F. C. Vieira, “The use of Facebook in health education: Perceptions of adolescent students,” Revista Brasileira de Enfermagem, vol. 71, pp. 265–271, 2018. [Google Scholar]
10. S. Ndumbe-Eyoh and A. Mazzucco, “Social media, knowledge translation, and action on the social determinants of health and health equity: A survey of public health practices,” Journal of Public Health Policy, vol. 37, no. 2, pp. 249–259, 2016. [Google Scholar] [PubMed]
11. I. C. H. Fung, K. W. Fu, C. H. Chan, B. S. B. Chan, C. N. Cheung et al., “Social media’s initial reaction to information and misinformation on Ebola, August 2014: Facts and rumors,” Public Health Reports, vol. 131, no. 3, pp. 461–473, 2016. [Google Scholar] [PubMed]
12. K. Anoop, D. Padmanabhan and V. L. Lajish, “Emotion cognizance improves health fake news identification,” in Proc. of Int. Database Engineering & Applications Symp. Association for Computing Machinery, Incheon, Korea, vol. 2020, pp. 24, 2020. [Google Scholar]
13. Y. Han, S. Karunasekera and C. Leckie, “Continual learning for fake news detection from social media,” in Proc. of Int. Conf. on Artificial Neural Networks, Cham, Switzerland, pp. 372–384, 2021. [Google Scholar]
14. J. Y. Khan, M. T. I. Khondaker, S. Afroz, G. Uddin and A. Iqbal, “A benchmark study of machine learning models for online fake news detection,” Machine Learning with Applications, vol. 4, pp. 100032, 2021. [Google Scholar]
15. F. Monti, F. Frasca, D. Eynard, D. Mannion and M. M. Bronstein, “Fake news detection on social media using geometric deep learning,” arXiv preprint arXiv:1902.06673, 2019. [Google Scholar]
16. C. Guo, J. Cao, X. Zhang, K. Shu and H. Liu, “Dean: Learning dual emotion for fake news detection on social media,” arXiv preprint arXiv:1903, 2019. [Google Scholar]
17. S. Hakak, M. Alazab, S. Khan, T. R. Gadekallu, P. K. R. Maddikunta et al., “An ensemble machine learning approach through effective feature extraction to classify fake news,” Future Generation Computer Systems, vol. 117, pp. 47–58, 2021. [Google Scholar]
18. M. Choudhary, S. S. Chouhan, E. S. Pilli and S. K. Vipparthi, “BerConvoNet: A deep learning framework for fake news classification,” Applied Soft Computing, vol. 110, pp. 107614, 2021. [Google Scholar]
19. I. Ahmad, M. Yousaf, S. Yousaf and M. O. Ahmad, “Fake news detection using machine learning ensemble methods,” Complexity, vol. 2020, pp. 8885861, 2020. [Google Scholar]
20. S. M. Rezaeinia, R. Rahmani, A. Ghodsi and H. Veisi, “Sentiment analysis based on improved pre-trained word embeddings,” Expert Systems with Applications, vol. 117, pp. 139–147, 2019. [Google Scholar]
21. R. Niand and H. Cao, “Sentiment analysis based on GloVe and LSTM-GRU,” in Proc. of 39th Chinese Control Conf., Shenyang, China, IEEE, pp. 7492–7497, 2020. [Google Scholar]
22. D. Li, C. He and M. Chen, “Text sentiment analysis based on glove model and united network,” in Proc. of Journal of Physics: Conf. Series, Shenyang, China, IOP Publishing, vol. 1748, pp. 032046, 2021. [Google Scholar]
23. J. Acosta, N. Lamaute, M. Luo, E. Finkelstein and C. Andreea, “Sentiment analysis of Twitter messages using Word2vec,” in Proc. of Student-Faculty Research Day, Pace University, vol. 7, pp. 1–7, 2017. [Google Scholar]
24. F. Aisopos, D. Tzannetos, J. Violos and T. Varvarigou, “Using n-gram graphs for sentiment analysis: An extended study on Twitter,” in Proc. of IEEE Second Int. Conf. on Big Data Computing Service and Applications, Oxford, UK, IEEE, pp. 44–51, 2016. [Google Scholar]
25. H. X. Shi and X. J. Li, “A sentiment analysis model for hotel reviews based on supervised learning,” in Proc. of Int. Conf. on Machine Learning and Cybernetics, Guilin, China, IEEE, vol. 3, pp. 950–954, 2011. [Google Scholar]
26. A. Mee, E. Homapour, F. Chiclana and O. Engel, “Sentiment analysis using TF-IDF weighting of UK MPs’ tweets on Brexit,” Knowledge Based Systems, vol. 228, pp. 107238, 2021. [Google Scholar]
27. N. Cummins, S. Amiriparian, S. Ottl, M. Gerczuk, M. Schmitt et al., “Multimodal bag-of-words for cross domains sentiment analysis,” in Proc. of IEEE Int. Conf. on Acoustics, Speech and Signal Processing, Calgary, AB, Canada, IEEE, pp. 4954–4958, 2018. [Google Scholar]
28. R. K. Kaliyar, A. Goswami and P. Narang, “FakeBERT: Fake news detection in social media with a BERT-based deep learning approach,” Multimedia Tools and Applications, vol. 80, no. 8, pp. 11765–11788, 2021. [Google Scholar] [PubMed]
29. N. Q. K. Le, Q. T. Ho, T. T. T. Nguyen and Y. Y. Ou, “A transformer architecture based on BERT and 2D convolutional neural network to identify DNA enhancers from sequence information,” Briefings in Bioinformatics, vol. 22, no. 5, pp. bbab005, 2021. [Google Scholar] [PubMed]
Cite This Article
 Copyright © 2023 The Author(s). Published by Tech Science Press.
This work is licensed under a Creative Commons Attribution 4.0 International License , which permits unrestricted use, distribution, and reproduction in any medium, provided the original work is properly cited.
 Downloads
 Citation Tools