
 Submit a Paper
 Propose a Special lssue
 Open Access
ARTICLE

Mobile-Deep Based PCB Image Segmentation Algorithm Research
1 School of Electronic Electrical Engineering and Physics, Fujian University of Technology, Fuzhou, 350118, China
2 State Grid Fujian Power Supply Co., Ltd., Xiapu Power Supply Company, Ningde, 355100, China
* Corresponding Author: Chengyang Ke. Email:
Computers, Materials & Continua 2023, 77(2), 2443-2461. https://doi.org/10.32604/cmc.2023.042582
Received 05 June 2023; Accepted 29 August 2023; Issue published 29 November 2023
 View Full Text
 Download PDF
Abstract
Aiming at the problems of inaccurate edge segmentation, the hole phenomenon of segmenting large-scale targets, and the slow segmentation speed of printed circuit boards (PCB) in the image segmentation process, a PCB image segmentation model Mobile-Deep based on DeepLabv3+ semantic segmentation framework is proposed. Firstly, the DeepLabv3+ feature extraction network is replaced by the lightweight model MobileNetv2, which effectively reduces the number of model parameters; secondly, for the problem of positive and negative sample imbalance, a new loss function is composed of Focal Loss combined with Dice Loss to solve the category imbalance and improve the model discriminative ability; in addition, a more efficient atrous spatial pyramid pooling (E-ASPP) module is proposed. In addition, a more efficient E-ASPP module is proposed, and the Roberts crossover operator is chosen to sharpen the image edges to improve the model accuracy; finally, the network structure is redesigned to further improve the model accuracy by drawing on the multi-scale feature fusion approach. The experimental results show that the proposed segmentation algorithm achieves an average intersection ratio of 93.45%, a precision of 94.87%, a recall of 93.65%, and a balance score of 93.64% on the PCB test set, which is more accurate than the common segmentation algorithms Hrnetv2, UNet, PSPNet, and PCBSegClassNet, and the segmentation speed is faster.Keywords
PCB is a carrier used to connect various electronic components, provide line connections and hardware support, and its rational design and production specifications are essential for the stable and reliable operation of equipment. In recent years, with the rapid development of electrical equipment and products, the safety of printed circuit boards has become increasingly prominent [1,2].
Due to human damage, the working environment and other factors are very likely to cause PCB defects such as short circuits and open circuits in the actual production process [3,4], therefore, PCB defect detection is needed to ensure product quality. The traditional manual inspection method has the defects of low efficiency and high cost, and it is difficult to meet the quality requirements of the PCB production process with high precision [5,6]. Therefore, the industry has developed various types of automated optical inspection (AOI) systems based on machine vision to achieve online defect detection of PCB, and scholars have also conducted in-depth studies on PCB defect detection and proposed various algorithms to solve the problems of detection accuracy and efficiency.
PCB defect detection method can currently be divided into three categories: one is the manual detection method, its detection accuracy and efficiency depends on the experience of personnel judgment, with subjectivity and instability; the second is based on the electrical characteristics of the defect detection method, with high precision and rapid detection, but there is the possibility of damage to PCB equipment; third is based on the emerging computer vision detection method, the method uses image recognition technology, to avoid secondary damage caused by direct contact with PCB devices, and high efficiency of image detection. Therefore, this paper uses a deep learning-based image detection method to detect PCB defects.
At present, in the process of PCB image detection, there are still problems such as inaccurate image edge segmentation, hole phenomenon in segmenting large-scale targets, and slow segmentation speed. To solve the above problems, this paper proposes a lightweight semantic segmentation algorithm Mobile-Deep based on DeepLabv3+. The main features of this algorithm are: (1) To address the problems of a large number of model parameters and slow real-time algorithm, the fine-tuned MobileNetv2 lightweight network structure is used to replace the DeepLabv3+ feature extraction module, which can improve the speed and ensure the accuracy of image segmentation at the same time. (2) To address the problem of imbalance between positive and negative samples, a new loss function consisting of Focal Loss combined with Dice Loss is used instead of Cross Entropy to solve the problem of low accuracy of pixel classification due to the imbalance of sample categories. (3) To address the phenomenon of blurred segmentation edges and the existence of holes, the Roberts cross algorithm to sharpen the image edges to enhance the PCB edge information, and propose the E-ASPP module to improve the model accuracy. (4) To address the problem that DeepLabv3+ fails to fully utilize the multi-scale feature information, ignores the high-resolution shallow features, and loses important pixel information due to too many direct upsampling, the coordinate multi-scale feature fusion (C-MSFF) module is proposed, which draws on the feature pyramid network (FPN) multi-scale feature fusion approach and subtly reduce the number of upsampling to achieve model accuracy improvement.
Bare board detection in PCB defect detection mainly focuses on the determination of bare board alignment and pad defects. In early methods for bare board defect detection, traditional image segmentation algorithms dominate. Wang et al. [7] proposed a PCB solder joint detection algorithm based on adaptive threshold segmentation and morphology, which improved the segmentation accuracy, but there were still some errors during the study, which led to inaccurate detection results. Zhang et al. [8] proposed an algorithm based on iterative threshold selection and combined with image detection for the detection of effective edge information in PCB optoelectronic images, however, the algorithm can only detect one board at a time. Ma et al. [9] obtained the complete range of PCB real defect regions by an improved region-growing method, which improved the accuracy of detection, but it requires manual adjustment of model parameters, which may lead to poor detection results. In summary, although the traditional image segmentation method is less computationally intensive and has low hardware cost, it is highly susceptible to factors such as uneven illumination and low image resolution, which leads to the problem of poor segmentation accuracy.
In recent years, with the development of convolutional neural networks (CNNs) [10], various symmetric semantic segmentation algorithms based on full convolution have emerged to make up for the shortcomings of traditional semantic segmentation algorithms. Shelhamer et al. [11] proposed a fully connected neural network (FCNN), which fine-tunes the network by fine-tuning the learned feature representation to the segmentation task. Based on this, Ronneberger et al. [12] proposed a symmetric semantic segmentation model UNet, which consists of a contraction path that captures contextual information and a symmetric expansion path that can accurately locate the segmentation boundary. To solve the problem that the symmetric semantic segmentation algorithm based on full convolution ignores the pixel space consistency, DeepLab, a semantic segmentation model based on full convolution, emerged [13–16]. Based on the above conditions, Chen et al. [17] used convolutional neural networks to classify and identify electronic devices in circuit boards, but the algorithm is susceptible to noise interference, and the recognition accuracy for components of different scales still needs to be improved. Wang et al. [18] proposed a deep learning-based method to identify and classify 10 types of defects such as breaks, burrs, and residual copper for PCB pads and alignments, but the effective recognition of PCB images is too small in size. Hu et al. [19] proposed UF-Net by up-sampling and fusion of features, and the region proposal network (RPN) and region of interest (ROI) pooling modules are applied to effectively identify different defects such as board alignments and solder joints, but the identification speed is slow. Khan et al. [20] proposed a hybrid deep learning model that combines DenseNet and UNet for semantic segmentation. Although the algorithm performed well, it did not consider the information loss in the encoding and decoding stages. Qiao et al. [21] introduced deep learning techniques to the analysis of X-ray data from PCB and proposed an effective deep convolutional neural network-graph cut (DCNN-GC) framework, but the algorithm was only applicable to small data sets and the segmentation speed was slow.
In summary, the DeepLabv3+ model with a simple network structure and fast running speed is selected for defect detection of PCB in this paper. However, the shortcomings of the DeepLabv3+ model are poor real-time performance, blurred segmentation edges, and the existence of holes. The reason for this is that its feature extraction module uses the Xception model with a large number of parameters, and in addition, the atrous spatial pyramid pooling (ASPP) module fails to make full use of the feature information, and the number of samples on the decoding layer is too many and the multiplier is too large. To address the above problems, this paper proposes a new Mobile-Deep model based on DeepLabv3+ semantic segmentation framework.
The structure of the Mobile-Deep model is shown in Fig. 1, which is divided into a pre-processing layer, encoding layer, and decoding layer, and the specific model scheme is as follows. Firstly, the Roberts crossover operator is selected in the preprocessing layer for edge enhancement of PCB images; secondly, the fine-tuned MobileNetv2 is used as the backbone network in the encoding layer, and feature extraction is performed by E-ASPP module to increase the perceptual field range; finally, the extracted features are spliced and fused by C-MSFF module in the decoding layer to increase the information expression.
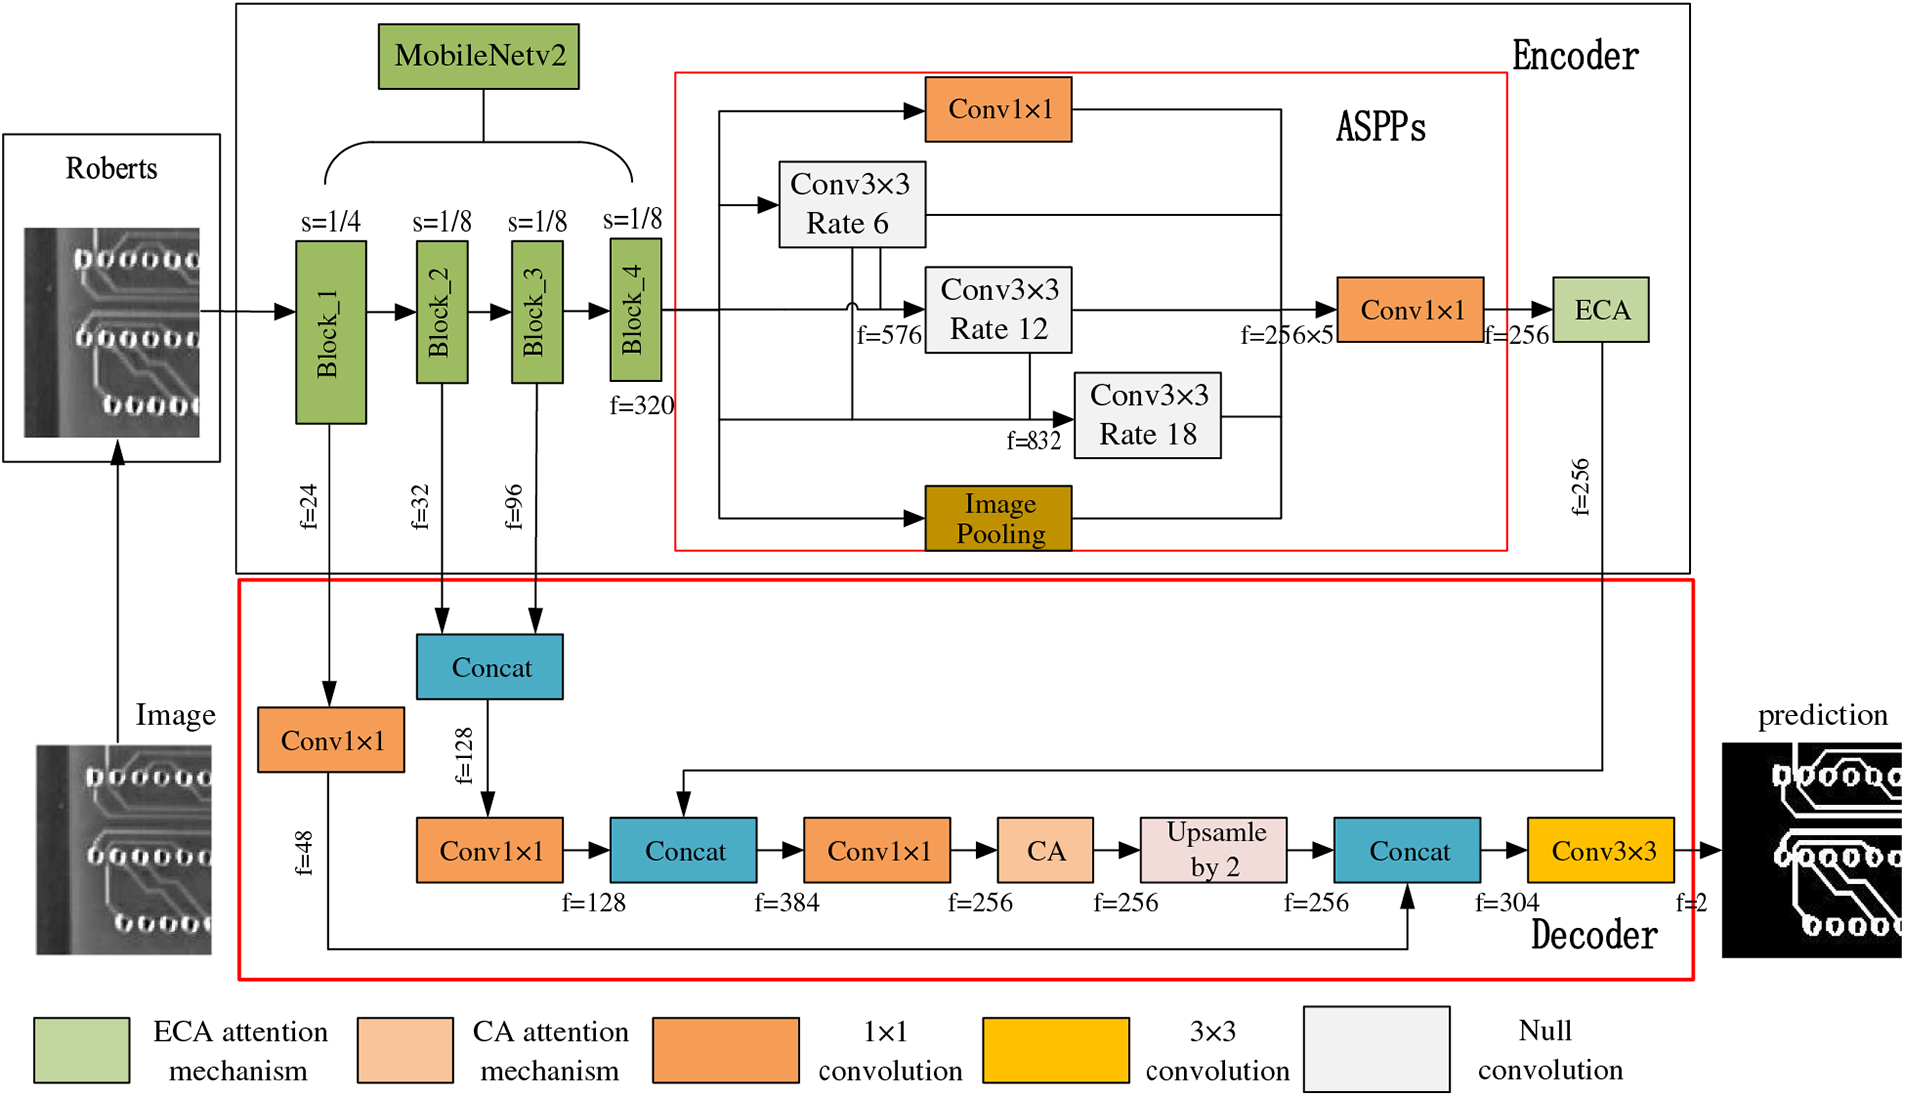
Figure 1: Mobile-Deep model structure. f stands for the number of filters. s stands for the dimensional change multiplier
Image sharpening is an image processing technique that aims to enhance the high-frequency details in an image to make it look sharper and more visually appealing. Generally, image sharpening techniques can be divided into two categories: Gradient-based methods and Laplace transform-based methods. Gradient-based methods enhance edges and contours by performing differential operations on the image. The commonly used methods include the Sobel operator [22], the Prewitt operator [23], and the Roberts crossover operator [24]. The Laplace transform-based method, on the other hand, uses a transform kernel to convolve the image to highlight sharp features that are blurred or obscured in the original image due to various factors. Compared with other operators, the Roberts crossover operator has the following advantages: (1) the algorithm is simple; (2) it is suitable for images with sharp edges; (3) the detection effect is obvious; (4) it can be used for real-time processing; (5) the convolution kernel is small.
Since Roberts crossover operator is very effective for edge detection of straight lines, angles, and other geometric shapes. Therefore, in this paper, the Roberts crossover operator is used in the image preprocessing part to enhance the PCB image edges, obtain the coarse segmentation result of PCB, and superimpose it with the original image to enhance the signal intensity of PCB edges, and its sharpening process is shown in Fig. 2. Compared with the original image, the sharpened image edges are clearer and the lines are more obvious, which is more conducive to the implementation of PCB edge detection.
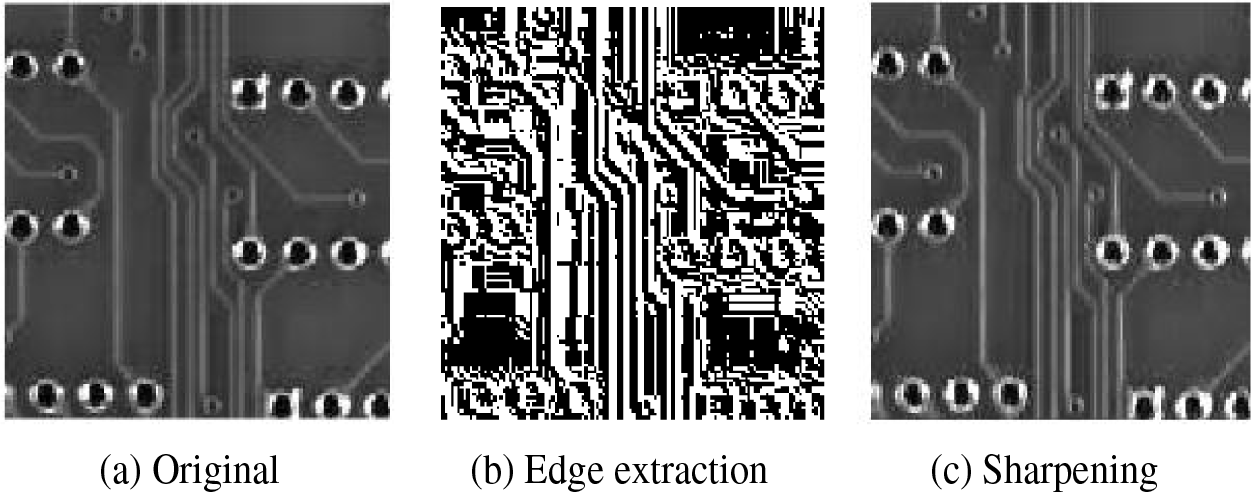
Figure 2: PCB image sharpening
3.2 MobileNetv2 Structure Parameter Adjustment
The growth of the number of layers in a deep network brings a series of problems, such as gradient disappearance, gradient explosion, model overfitting, and computational resource consumption, which can be solved by residual connectivity. Among them, the most common lightweight residual connectivity networks include the MobileNet family. Compared with MobileNetv1 [25], the biggest advantage of MobileNetv2 [26] is the use of residual connectivity to prevent the network from degradation. Therefore, in this paper, MobileNetv2, which has a stronger network feature extraction capability, is selected as the backbone feature extraction network of Mobile-Deep.
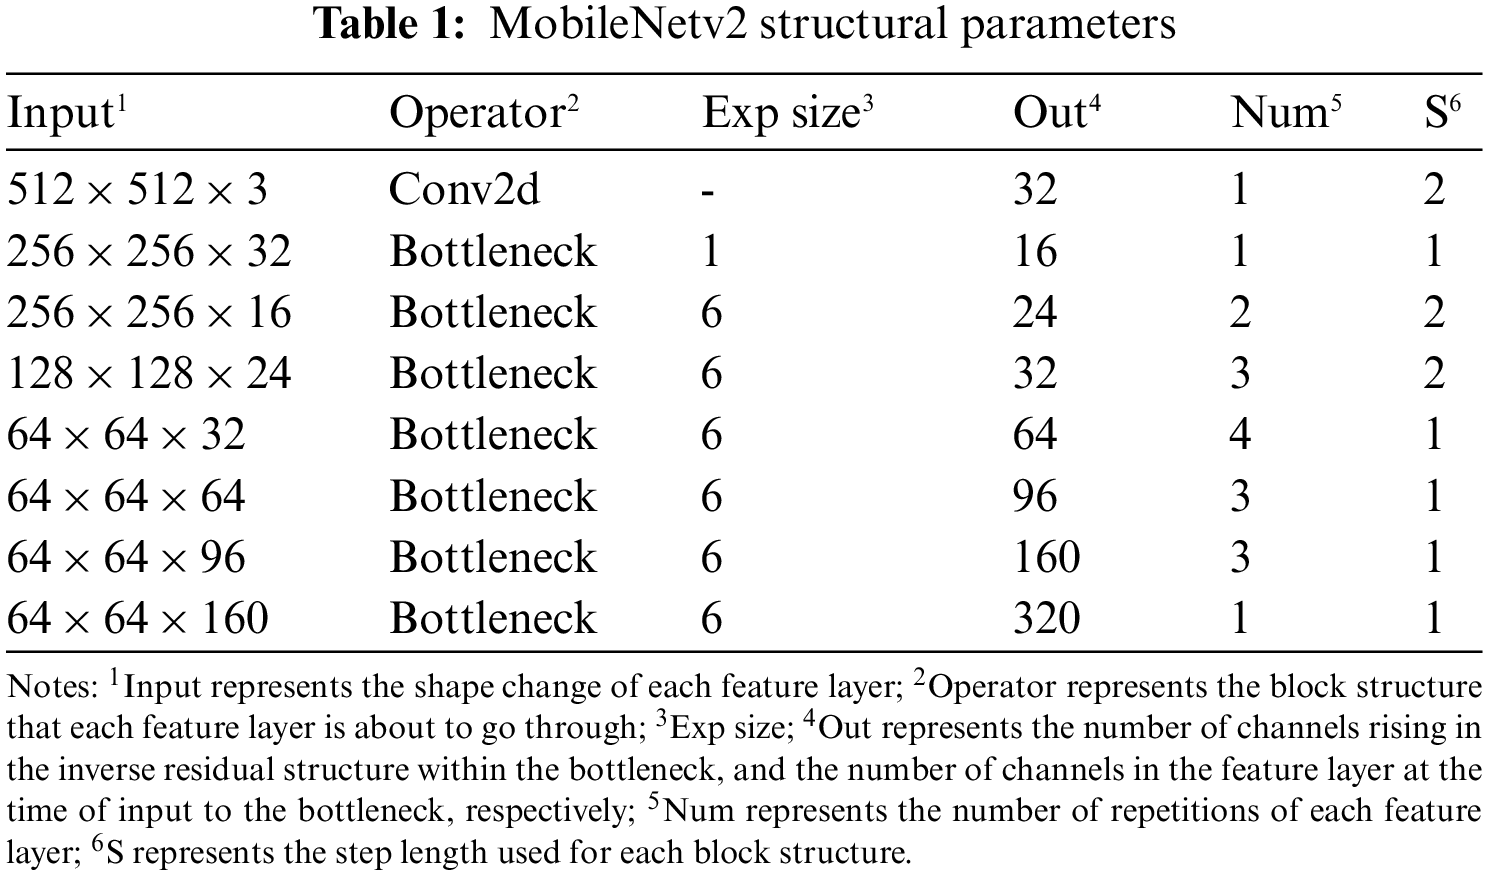
MobileNetv2 performs a total of 5 downsamplings in the first 18 layers, while for semantic segmentation networks, 5 downsamplings are generally not chosen, so too much pixel information is lost in pixel feature points. As the number of downsamplings decreases, the number of lost pixels also decreases. So this paper chooses 3 downsamplings and modifies the parameters of inverted residual with the penultimate two steps of 2 to make its step size 1. After completing MobileNetv2 feature extraction, layer 4, layer 7, layer 14, and layer 18 are used as outputs, where layer 4 is the result of compressing the height and width of the input image twice, and the other three layers are compressed in height, and width three times, corresponding to the output size and several channels of 128 × 128 × 24, 64 × 64 × 32, 64 × 64 × 96 and 64 × 64 × 320, respectively. The outcomes are displayed in Table 1.
The ASPP module has unique advantages in extracting multi-scale semantic features of images and is widely used for image semantic segmentation. The ASPP module consists of multiple convolutional operations in parallel and global average pooling operations. Except for the 1 × 1 convolution, each convolution kernel has a different void rate. Convolutional kernels with high void rates facilitate the segmentation of large targets; convolutional kernels with small void rate help segment small targets. However, the model uses only simple stacking for features with different void rate convolutions, failing to take full advantage of the perceptual wilderness brought about between dilated convolutions. Therefore, in this paper, we borrow the dense connectivity of Dense ASPP [27] and adopt the efficient channel attention (ECA) [28] to design a more efficient feature pyramid module, i.e., the E-ASPP module, as shown in Fig. 3.
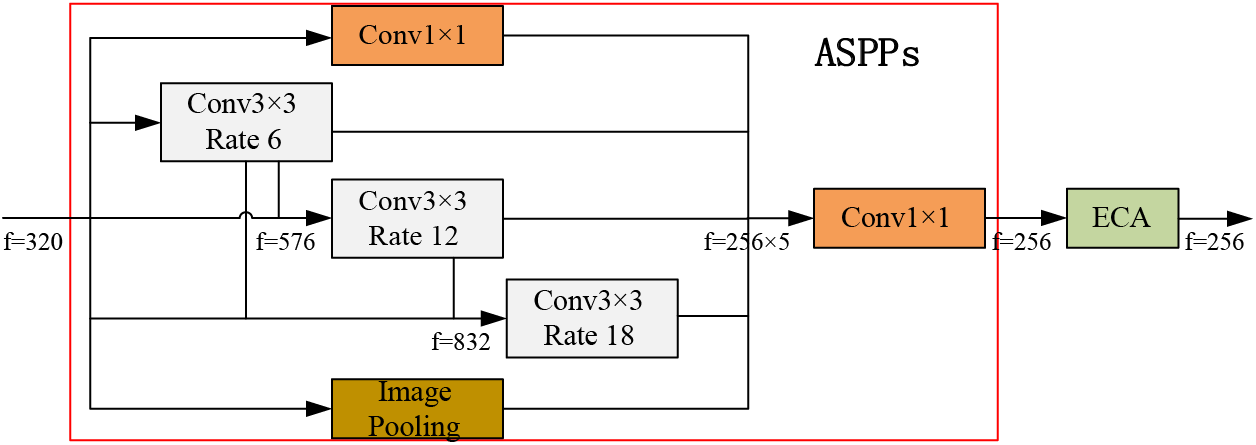
Figure 3: E-ASPP feature pyramid module. f stands for the number of filters
The input of the atrous spatial pyramid pooling chains (ASPPs) module is a 1/8 size feature map with 320 channels obtained via the backbone network MobileNetv2. In the E-ASPP module, the feature maps are convolved 1 × 1, globally averaged pooled, and null convolved with expansion rates of 6, 12, and 18, respectively, with the difference that the convolutions with different expansion rates are spliced. First, the results obtained from the expansion rate of 6 branches are added to the expansion rate of 12 branches and 18 branches, and second, the integrated 12 branches are added to the 18 branches to obtain five feature maps of 1/8 size and 256 channels with three different feature information of high, medium and low. The feature information produced by the E-ASPP module is obtained by stitching and fusing the resultant feature maps in the channel dimension, followed by the addition of the ECA attention mechanism. The output contains information about the features of each branch and between branches, which can increase the ability of the model to segment targets of different sizes.
3.4 Feature Fusion Improvement
The basic model of DeepLabv3+ recovers the image resolution by direct quadruple upsampling, which causes the loss of pixel information in the feature tensor, thus destroying the continuity between pixels in the image. On the other hand, it only fuses the 1/4 feature tensor stored in the encoder process, ignoring the semantic information contained in the deeper feature tensor and the spatial detail information contained in the shallower feature tensor, resulting in poor pixel recovery and serious loss of edge information in the final image segmentation results.
To gradually fuse the low-resolution deep features and high-resolution shallow features generated in the encoding stage, this paper proposes a C-MSFF feature fusion module by reducing the loss of pixel information in the feature tensor through twice up-sampling to make the segmentation boundary finer, and its structure is shown in Fig. 4.

Figure 4: C-MSFF feature fusion module. f stands for the number of filters. s stands for the dimensional change multiplier
For C-MSFF, the middle two layers of features from the deep convolutional neural network output are first spliced [29] to integrate the shallow channel information, then the feature layers that pass through the E-ASPP module are feature fused to receive more information from the deeper features for better feature representation, followed by the coordinate attention (CA) [30] after splicing to compensate for the lack of model accuracy, and then twice the upsampling is performed to achieve the docking with the first layer output to obtain the feature information generated by the C-MSFF module. Since only twice the upsampling is used, the C-MSFF module can obtain a more comprehensive and richer set of features.
In image semantic segmentation tasks, the commonly used loss function is cross-entropy loss [31], but this function does not solve the problem of sample class imbalance well. Focal Loss [32] solves the problem of severe imbalance between positive and negative samples by improving the cross-entropy loss function, whose binary classification is shown in Eq. (1).
where, p denotes the true label category,
Intersection over union (IoU) is often used to evaluate the segmentation effectiveness of a model, and Dice Loss [33] is a loss function that measures the intersection ratio metric, as shown in Eq. (2).
where, X denotes the set of target class predictions and Y denotes the set of true label classes. Since the Dice Loss training process is unstable, but its optimized IoU metric works well, this does not indicate the better performance of the model. Thus, this paper uses the sum of Dice Loss and Focal Loss as the loss function to improve the small target segmentation accuracy to compensate for the accuracy loss caused by the limited feature extraction capability of the lightweight backbone network. The loss function is calculated as shown in Eq. (3).
where, N is the total number of samples; C is the number of label categories;
where,
4 Experimental Results and Analysis
The experimental hardware configuration is Intel Core i5-2500 CPU, 16 GB RAM, NVIDIA GeForce RTX 3060 graphics card with 12 Gbyte video memory, Ubuntu 18.04 software environment, 64 bit, Pytorch 1.8.0 deep learning framework, and CUDA 11.1 parallel computing framework.
This paper uses a laboratory-built image acquisition platform for PCB image acquisition, as shown in Fig. 5. Among them, the hardware components of the platform mainly include industrial cameras, switches, light sources, industrial lenses, and motors.
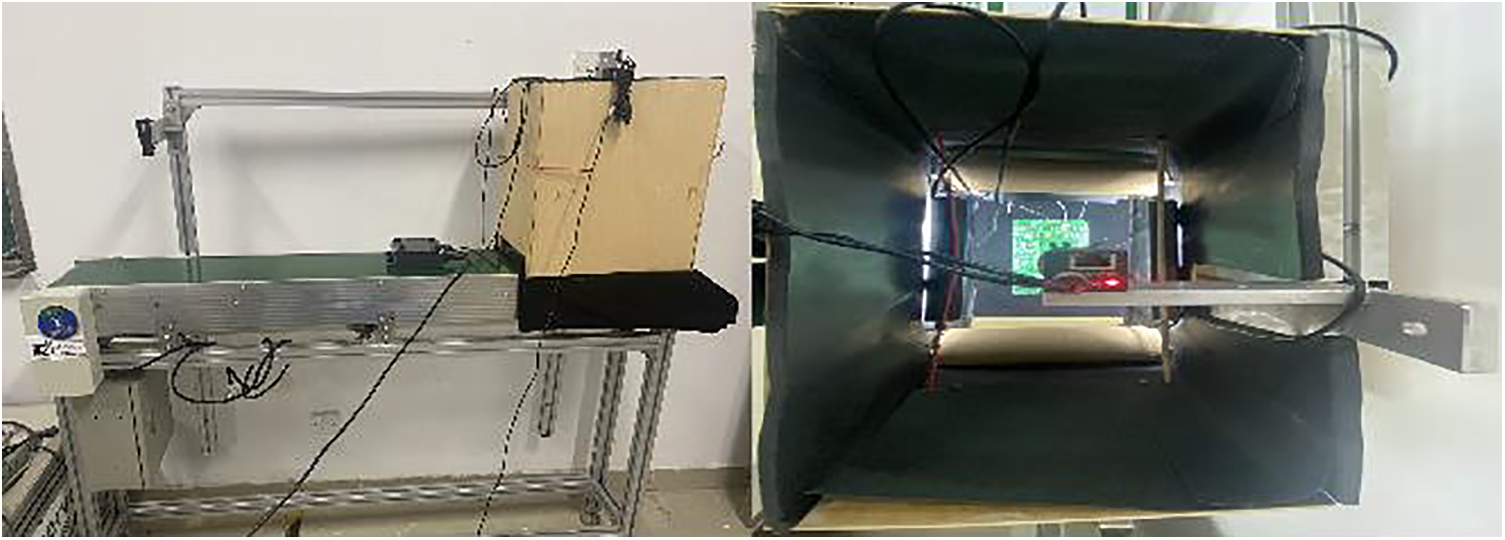
Figure 5: PCB surface defect detection platform
After completing the debugging of industrial cameras and light sources, this paper uses the platform for PCB bare board picture acquisition. Since the acquired image contains a large number of irrelevant background pixels, this paper performs image segmentation, open operation, and image cropping operations on the acquired PCB surface image to obtain the ROI region of the PCB surface to eliminate the interference of irrelevant factors on the subsequent defect detection.
After the data acquisition is completed, its production process is as follows: first, the original image is cropped to 128 × 128 sizes; second, the image is enhanced by mirroring and rotating the data; finally, the color image is converted into a grayscale map. The experiments use ITK-SNAP software to manually label the pads and alignments of PCB images to get the data labels. The dataset consists of 1458 sheets, and the approximate ratio of 8:1:1 is used to set the training set, test set, and validation set, of which 1180 sheets are used as the training set, 146 sheets as the test set, and 132 sheets as the validation set.
To verify the effectiveness of the proposed algorithm, the following six evaluation metrics are used in this experiment: Precision, Recall, F1-Score, mIoU, Speed, and Params. Among them, Speed and Params are used as evaluation metrics for segmentation speed and model size, respectively, and the rest of the metrics are used to analyze the segmentation accuracy of the model. Usually, mIoU is used to calculate the intersection and concatenation of two sets of true and predicted values, to calculate how well the predicted results match the true values in the original image, as shown in Eq. (5).
where, k denotes the category of label tagging,
Precision is a measure of the accuracy of a semantic segmentation model for a class of targets, i.e., the ratio of the number of real targets segmented by the model to the number of all segmented targets, which is shown in Eq. (6).
where,
The recall is a measure of a semantic segmentation model’s ability to segment all targets, i.e., the ratio of the number of targets correctly segmented by the model to the number of all true targets, which is shown in Eq. (7).
where,
The balance score, also known as the F1-Score, takes into account both the precision and recall of the classification model and is defined as the summed average of the precision and recall rates, which is shown in Eq. (8).
where, P is the precision rate, and R is the recall rate.
4.3 Mobile-Deep Ablation Experiment
To verify the effectiveness of the algorithm, this experiment uses the homemade PCB dataset and uses multi-stage migration learning [34] as an iterative training strategy. The experiments set the initialized learning rate to 0.007, the stochastic gradient descent (SGD) with a momentum of 0.9 and a weight decay of 0.0004, the learning rate descent method is chosen STEP, and the number of iteration steps is 300. The images are cropped to 256 × 256 sizes for training. Among them, the ablation experiments include the experimental comparison of the edge sharpening model, the adjustment of the downsampling number of MobileNetv2, the adjustment of the loss function, and the experimental verification of E-ASPP and C-MSFF.
The Gradient-based image sharpening techniques mainly include the Sobel operator, Prewitt operator, and Roberts crossover operator, and the above methods are compared and analyzed in this paper, and the experimental results are shown in Table 2 and Fig. 6. From Table 2 and Fig. 6, the use of Sobel and Prewitt degrades the image quality and introduces noise, resulting in a decrease in mIoU of 19.89% and 17.77%, respectively, compared to the original network. The use of the Roberts crossover operator, on the other hand, sharpens the image edges, highlights the edge information more, and improves the mIoU by 0.92%. Therefore, in this paper, the Roberts crossover operator is added to the DeepLabv3+ preprocessing module to sharpen the PCB image edges.
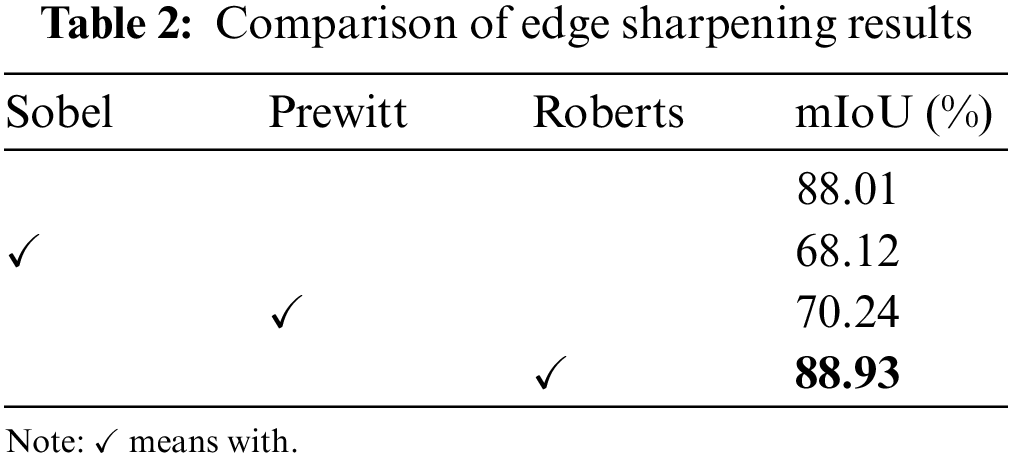

Figure 6: Comparison of PCB image sharpening results
4.3.2 MobileNetv2 Downsamplings Adjustment
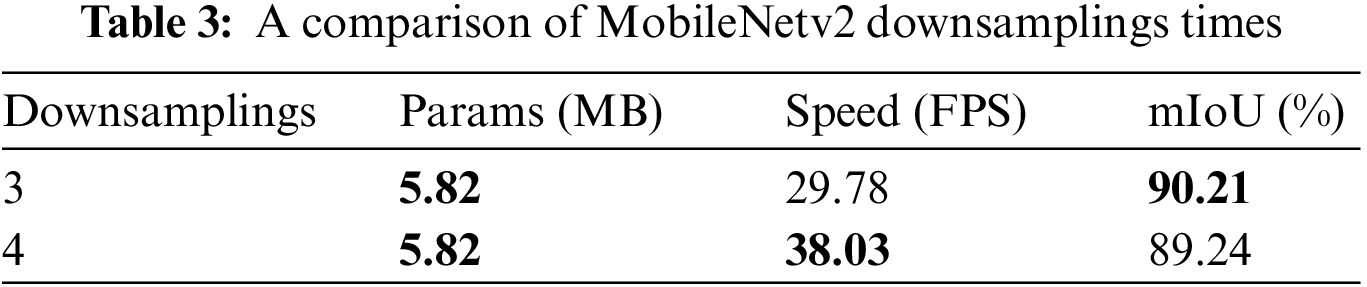
In this paper, we set different downsampling times in the MobileNetv2 network for comparative analysis, and the results are shown in Table 3. When the number of downsamplings is 3, the mIoU value is 90.21%; when the number of downsamplings is 4, more information is lost in the pixel feature points and the mIoU value is reduced by 0.97%. It can be seen that as the number of downsamplings increases, the pixel information lost from the pixel feature points increases. Therefore, this paper adopts the 3 downsamplings with fewer downsamplings and more effective information contained in MobileNetv2 as the feature extraction network of the model.
4.3.3 Loss Function Adjustment
The gap between the anticipated value and the model’s real value is measured using the loss function. The loss functions of different models are generally different, and the same model has different effects for different loss functions. Table 4 shows the experimental findings of the model for various loss functions when MobileNetv2 is downsampled by 3.
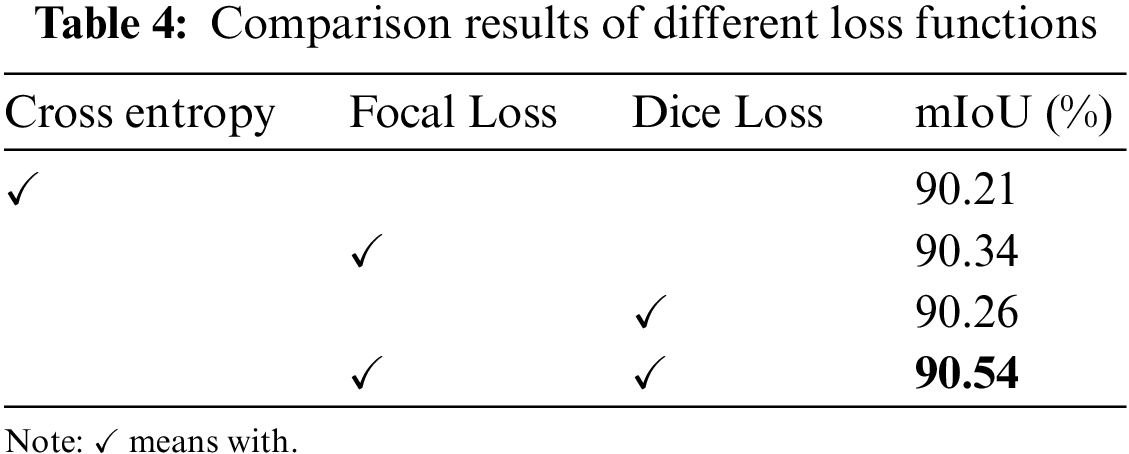
The experimental results show that the mIoU value of the original loss function Cross Entropy is 90.21%; when only Focal Loss is used, it solves the problem of severe imbalance between positive and negative samples, with mIoU reaching 90.34%; when only Dice Loss is used, it can alleviate the negative impact caused by the imbalance between the foreground and background areas in the samples, with mIoU reaching 90.26%, as it focuses more on mining the foreground areas; the mIoU of the loss function proposed in this paper improves by 0.33% relative to the original loss function. It shows that the loss function using the sum of Focal Loss and Dice Loss not only solves the problem of low accuracy of pixel classification due to unbalanced sample categories but also improves the performance of semantic segmentation of the model.
In the ASPP structure of the DeepLabv3+ model, different dilation rates can process the input feature maps in parallel to extract multi-scale target information, but the original dilation rates (6, 12, 18) do not fully utilize the perceptual field to extract effective information. To solve the problem of feature resolution reduction when the perceptual field is increased, the E-ASPP module is proposed in this paper as shown in Fig. 3, and the experimental results are shown in Table 5. From the table, it can be obtained that the segmentation accuracy of ASPPs is higher with a mIoU of 90.75% compared to 90.54% of the original ASPP, which is an improvement of 0.21%, indicating that ASPPs can perform feature extraction more effectively. Together with the ECA attention mechanism, which re-integrates feature information, the mIoU value is further improved by 0.27% to 91.02% compared to the ASPPs.

Experimental validation is performed with the feature fusion module C-MSFF designed in this paper, and the comparison results are shown in Table 6. Compared with MobileNetv2, the backbone feature extraction network only, C-MSFF improves mIoU by 0.42% due to the addition of multi-scale feature fusion (MSFF) branches; continuing to use the CA attention mechanism for channel integration, mIoU improves by 0.16% with only 0.02 MB increase in the number of model parameters. After the fusion of multi-layer feature information, the overall segmentation effect of C-MSFF is improved by 0.58%.

To verify the effectiveness of the improved Mobile-Deep algorithm proposed in this paper, Table 7 compares the segmentation results of DeepLabv3+ with the module proposed in this paper.

From the previous Sections 4.3.4 and 4.3.5, it is clear that the E-ASPP and C-MSFF modules can effectively improve the segmentation accuracy of the model. Since the Mobile-Deep model combines E-ASPP and C-MSFF, the mIoU value of Mobile-Deep is improved by 2.91% compared to the original model, at the cost of a slight decrease of 3.48 FPS in segmentation speed. In summary, the global average mIoU value of the improved algorithm compared to the original DeepLabv3+ network model. The large improvement in recognition accuracy indicates that the deep feature pyramid structure and the multi-scale fusion enhancement network help to improve the segmentation capability of the network model.
4.4 Comparison Experiments between Mobile-Deep and Other Algorithms
To further verify the superiority of the Mobile-Deep model proposed in this paper, it is also compared and analyzed with other classical algorithms, and the experimental results are shown in Table 8 and the visualization results are shown in Fig. 7.
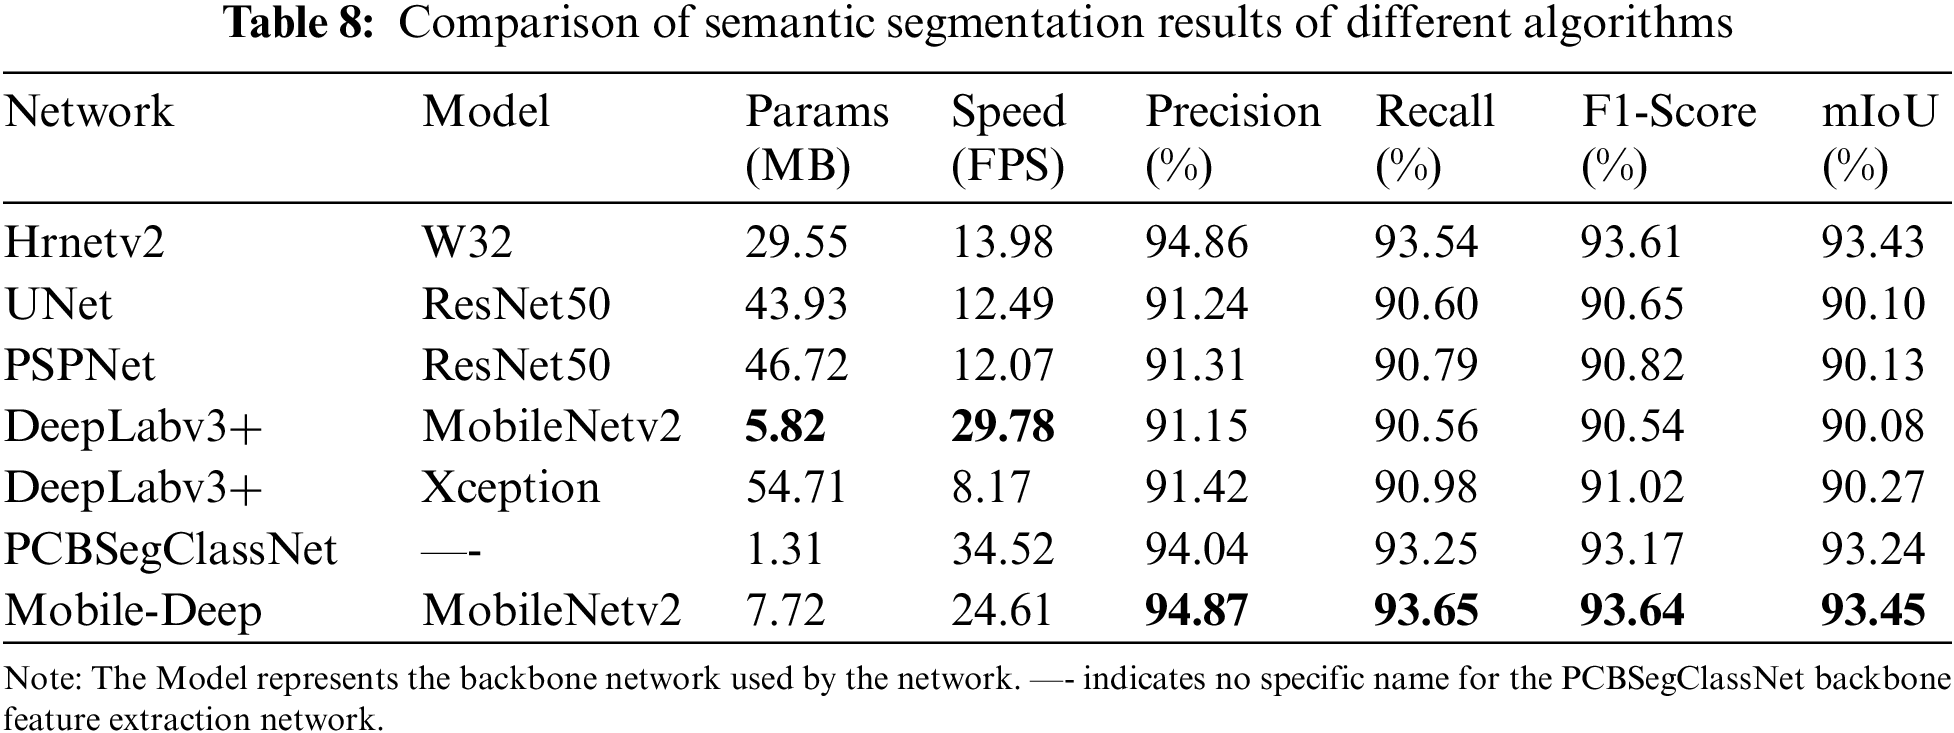

Figure 7: Prediction results of 7 algorithms on the PCB dataset
The UNet network is suitable for small datasets of medical images and performs poorly on this dataset, with mIoU achieving only 90.10%, a precision of 91.24%, a recall of 90.60%, and a balance score of 90.65%. Compared with the proposed algorithm in this paper, UNet is at a disadvantage in terms of model segmentation accuracy, speed, and number of parameters. And PSPNet also failed to achieve the desired results. Compared with the Hrnetv2 network, the proposed algorithm reduces the number of parameters by 21.83 MB and improves the segmentation speed by 10.63 FPS. For the PCBSegClassNet [35] network, it has the advantages of a small number of model parameters and fast segmentation, but in terms of segmentation accuracy, Mobile-Deep is 0.21%, 0.83%, 0.40%, and 0.47% higher than PCBSegClassNet in terms of average intersection ratio, precision, recall, and balance score, respectively. Therefore, the MobileNetv2 backbone network, which has great advantages in terms of several parameters and segmentation speed, is still chosen for such tasks. Considering the number of parameters, segmentation speed, and segmentation accuracy, the Mobile-Deep model proposed in this paper is still the optimal one.
As can be seen from Fig. 7, UNet, PSPNet, DeepLabv3+, and PCBSegClassNet all have the phenomenon that the segmentation of alignment edges is mutilated, the segmentation of pads and alignments is fused, and the overall segmentation of the target is incomplete, although the segmentation effect of Hrnetv2 is clearer, there are mis-segmentation errors. Consistent with the above findings, the proposed algorithm is more complete for the segmentation of pads and alignments in the PCB dataset, and the edge contours are smoother.
To check the generalization of Mobile-Deep, the different algorithms mentioned above were compared and analyzed on the PASCAL VOC 2012 dataset, and the segmentation results are shown in Table 9. Due to the large image size of the VOC dataset, the input size was adjusted to 512 × 512.

In the VOC dataset, PSPNet has the highest segmentation accuracy with a mIoU of 83.29%, precision of 83.78%, recall of 83.34%, and balance score of 83.39%, while the proposed algorithm in this paper has a mIoU of 75.74%, precision of 76.13%, recall of 75.98%, and balance score of 76.06%. Compared with UNet, the most representative algorithm for semantic segmentation, the mIoU, precision, recall, and balance scores are 6.58%, 5.62%, 6.71%, and 6.72% higher, respectively, and this shows the superiority of the proposed algorithm.
The visualization results of the algorithm on the PASCAL VOC 2012 dataset are shown in Fig. 8. The first row shows the original image, and the second row shows the labels corresponding to the original image, followed by a comparison of Hrnetv2, UNet, PSPNet, and DeepLabv3+ with different backbone models, and PCBSegClassNet.
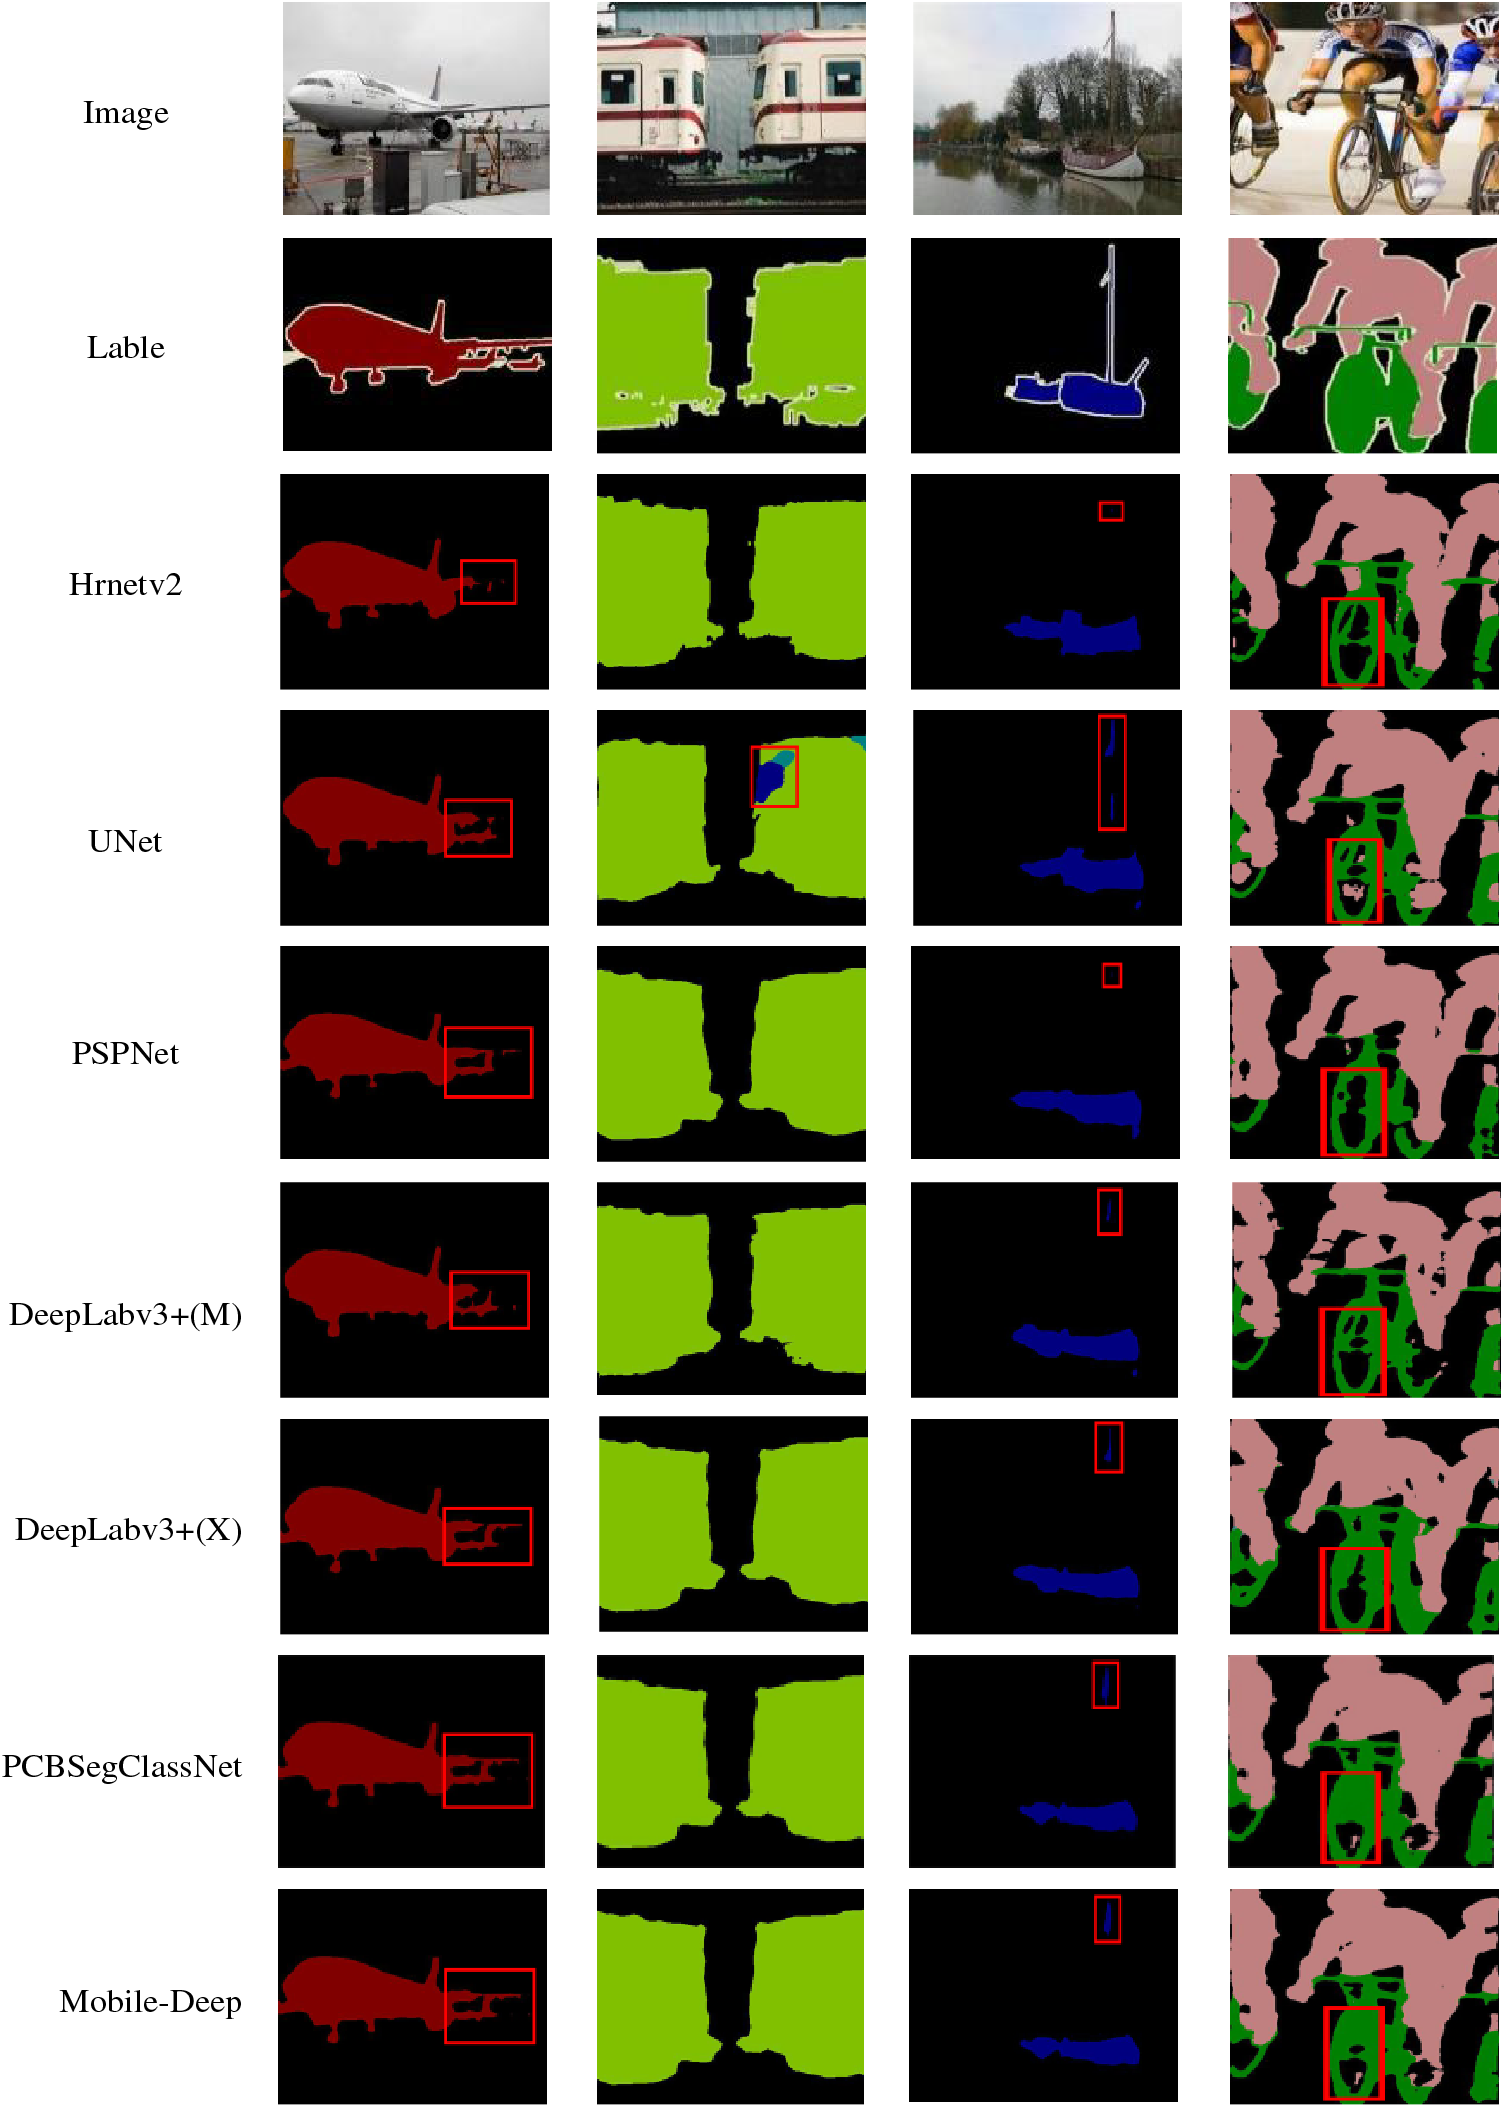
Figure 8: Prediction results of 7 algorithms on the PASCAL VOC 2012 dataset
As can be seen in the first column of Fig. 8, the algorithm in this paper identifies the pixel points that were lost in the tail section during the segmentation of the comparison model, and the predicted results are more accurate. In the second column of segmentation results, the UNet network model incorrectly identifies the train as other objects, and the improved algorithm avoids the misclassification error. The third column of segmentation results shows that the algorithm in this paper can segment small-scale targets such as flagpoles, and although the segmented pixels are not obvious, the model is better at segmenting and predicting small-scale targets. The fourth column of results shows that the improved algorithm is more accurate for segmenting bicycles and has better continuity of results, although there are still voids in segmenting riders. In summary, the improved network model not only improves the segmentation accuracy of small-scale targets compared with the comparison model but also has stronger classification recognition ability.
To test whether the model proposed in this paper applies to real scenarios, the model is deployed in Rockchip RK3588. The CPU model of the device is RK3588, octa-core; the GPU model is ARM MALI-G610, quad-core; the running memory is 8 GB; the operating system is Android 12. First, the model training weights are converted to the open neural network exchange (ONNX) framework, and then to RK3588’s runnable Rockchip neural net-Toolkit2 (RKNN-Toolkit2) framework; second, the connection between RK3588 and the monitor is built; finally, the running interface is written in C++ under OpenCV, Rockchip neural net (RKNN) and other frameworks. In practical applications, the inference speed of the model is also affected by the software version and physical environment, so this is only a qualitative experiment. To ensure the accuracy of the measured latency as much as possible, we averaged the inference speed for 1000 images, as shown in Table 10. As can be seen from Table 10, the mobile device RK3588 inference latency is between the server GPU and CPU, which indicates that Mobile-Deep can perform well even in the mobile model.

Although this paper improves the segmentation accuracy and speed of the model for PCB bare board images by adjusting the number of MobileNetv2 downsamplings, and loss function and introducing an edge sharpening model as well as proposing E-ASPP and C-MSFF modules, there are still some defects. Fig. 9 shows the results of poor segmentation of PCB bare board by the method in this paper. In Fig. 9(a2), the pads appear over-segmentation phenomenon, and in Fig. 9(b2), the edge segmentation of the alignment is discontinuous and there is a mutilation phenomenon. The main reasons for the above problems are as follows.

Figure 9: Mobile-Deep poorer segmentation result display
(1) Since this paper mainly constructs a lightweight segmentation model, MobileNetv2 is used as the backbone network of the model. Although the number of its downsamplings is adjusted, since MobileNetv2 is not a deep network, its extraction of feature information of the image is incomplete, which affects the segmentation accuracy of the model.
(2) The underlying features in the model lack the global feature information of the image due to the restricted perceptual field. Although this paper compensates for this by feature fusion through E-ASPP and C-MSFF modules, some information will still be missing.
In this paper, the Mobile-Deep model is proposed for the problems such as blurred segmentation edges and the existence of holes in the image segmentation process of PCB boards. First, the Roberts cross operator is chosen to sharpen the PCB image edges; second, the MobileNetv2 lightweight network structure is used to replace the DeepLabv3+ feature extraction module; then, the E-ASPP and C-MSFF modules are designed and validated; finally, a new loss function consisting of Focal Loss combined with Dice Loss is used instead of Cross Entropy. The experimental results show that with MobileNetv2 as the backbone, Mobile-Deep improves by 3.37% in mIoU, 3.72% in precision, 3.09% in recall, and 3.10% in balance score compared to DeepLabv3+, although the number of parameters increases by 1.90 MB and the segmentation speed decreases by 5.17 FPS, but it still achieves good applications for PCB image segmentation tasks. And from the segmentation visualization results, the Mobile-Deep segmentation algorithm is effective for segmenting boundaries and small-scale target segmentation. However, the current model can only detect PCB defects in the laboratory environment, and it is temporarily unavoidable for various degradations, noises, or variants that the data imaging process is affected by. The authors believe that image recovery methods in areas such as image denoising can be introduced to recover the original image information as much as possible and make the model more generalizable, which is the focus of the next step.
Acknowledgement: Thanks to Prof. Jian Chen of the Fujian University of Technology for data support.
Funding Statement: This research was funded by the University-Industry Cooperation Project “Research and Application of Intelligent Traveling Technology for Steel Logistics Based on Industrial Internet”, Grant Number 2022H6005, Natural Science Foundation of Fujian Provincial Science and Technology Department, Grant Number 2022J01952, and Research Start-Up Projects, Grant Number GY-Z12079.
Author Contributions: Conceptualization, K. C. Y., L. L. S. and L. H.; methodology, K. C. Y.; software, K. C. Y.; validation, K. C. Y., L. L. S. and L. H.; formal analysis, K. C. Y.; investigation, K. C. Y.; resources, K. C. Y.; data curation, K. C. Y.; writing—original draft, K. C. Y.; writing—review and editing, K. C. Y. and L. H.; visualization, K. C. Y.; supervision, K. C. Y.; project administration, K. C. Y.; funding acquisition, L. L. S. All authors have read and agreed to the published version of the manuscript.
Availability of Data and Materials: The data presented in this study are available on request from the corresponding authors.
Conflicts of Interest: The authors declare that they have no conflicts of interest to report regarding the present study.
References
1. X. Lu and Z. Liu, “A review of deep learning-based image semantic segmentation techniques,” Software Guide, vol. 20, no. 1, pp. 242–244, 2021. [Google Scholar]
2. A. Garcia-Garcia, S. Orts-Escolano, S. Oprea, V. Villena-Martinez and J. Garcia-Rodriguez, “A review on deep learning techniques applied to semantic segmentation,” Computer Vision and Pattern Recognition, 2017. https://doi.org/10.48550/arXiv.2303.04315 [Google Scholar] [CrossRef]
3. F. Jiang, Q. Gu, H. Z. Hao, N. Li, Y. W. Guo et al., “A review of content-based image segmentation methods,” Journal of Software, vol. 28, no. 1, pp. 160–183, 2017. [Google Scholar]
4. H. S. Zhao, X. J. Qi, X. Y. Shen, J. P. Shi and J. Y. Jia, “ICNet for real-time semantic segmentation on high-resolution images,” Computer Vision and Pattern Recognition, 2018. https://doi.org/10.48550/arXiv.1704.08545 [Google Scholar] [CrossRef]
5. Z. Y. Wang, X. Y. Ni and Z. D. Shang, “Semantic segmentation of autonomous driving scenes using convolutional neural networks,” Optical Precision Engineering, vol. 27, no. 11, pp. 2429–2438, 2019. [Google Scholar]
6. L. F. Wang and C. M. Yan, “A review of semantic segmentation of road scenes,” Advances in Lasers and Optoelectronics, vol. 58, no. 12, pp. 44–66, 2021. [Google Scholar]
7. S. Y. Wang, Y. Zhao and L. Y. Wen, “PCB welding spot detection with image processing method based on automatic threshold image segmentation algorithm and mathematical morphology,” Circuit World, vol. 42, no. 3, pp. 97–103, 2017. [Google Scholar]
8. F. Zhang, N. S. Qiao and J. F. Li, “A PCB photoelectric image edge information detection method,” Optik, vol. 144, pp. 642–646, 2017. https://doi.org/10.1016/j.ijleo.2017.07.002 [Google Scholar] [CrossRef]
9. J. J. Ma, “Defect detection and recognition of bare PCB based on computer vision,” in Proc. of CCC, Dalian, China, pp. 11023–11028, 2017. [Google Scholar]
10. J. Deng, W. Dong, R. Socher, L. Li, K. Li et al., “ImageNet: A large-scale hierarchical image database,” in 2009 IEEE Conf. on Computer Vision and Pattern Recognition, 2009. https://doi.org/10.1109/CVPR.2009.5206848 [Google Scholar] [CrossRef]
11. E. Shelhamer, J. Long and T. Darrell, “Fully convolutional networks for semantic segmentation,” IEEE Transactions on Pattern Analysis and Machine Intelligence, vol. 39, no. 4, pp. 640–651, 2017. [Google Scholar] [PubMed]
12. O. Ronneberger, P. Fischer and T. Brox, “U-Net: Convolutional networks for biomedical image segmentation,” Computer Vision and Pattern Recognition, 2015. https://doi.org/10.48550/arXiv.1505.04597 [Google Scholar] [CrossRef]
13. L. Chen, G. Papandreou, I. Kokkinos, K. Murphy and A. L. Yuille, “Semantic image segmentation with deep convolutional nets and fully connected CRFs,” Computer Vision and Pattern Recognition, 2016. https://doi.org/10.48550/arXiv.1412.7062 [Google Scholar] [CrossRef]
14. L. Chen, G. Papandreou, I. Kokkinos, K. Murphy and A. L. Yuille, “DeepLab: Semantic image segmentation with deep convolutional nets, atrous convolution, and fully connected CRFs,” IEEE Transactions on Pattern Analysis and Machine Intelligence, vol. 40, no. 4, pp. 834–848, 2018. [Google Scholar] [PubMed]
15. L. Chen, G. Papandreou, F. Schroff and H. Adam, “Rethinking atrous convolution for semantic image segmentation,” Computer Vision and Pattern Recognition, 2017. https://doi.org/10.48550/arXiv.1706.05587 [Google Scholar] [CrossRef]
16. L. Chen, Y. K. Zhu, G. Papandreou, F. Schroff and H. Adam, “Encoder-decoder with atrous separable convolution for semantic image segmentation,” Computer Vision and Pattern Recognition, 2018. https://doi.org/10.48550/arXiv.1802.02611 [Google Scholar] [CrossRef]
17. X. Chen, J. D. Yu, X. A. Chen and Y. Zhai, “Research on the classification of electronic components based on convolutional neural network,” Wireless Communication Technology, vol. 2, pp. 7–12, 2018. [Google Scholar]
18. Y. L. Wang, J. T. Cao and X. F. Ji, “Convolutional neural network-based algorithm for PCB defect detection and identification,” Journal of Electronic Measurement and Instrumentation, vol. 33, no. 8, pp. 78–84, 2019. [Google Scholar]
19. S. S. Hu, Y. Xiao, B. S. Wang and J. Y. Yin, “Research on PCB defect detection based on deep learning,” Electrical Measurement and Instrumentation, vol. 58, no. 3, pp. 139–145, 2021. [Google Scholar]
20. S. D. Khan, L. Alarabi and S. Basalamah, “An encoder-decoder deep learning framework for building footprints extraction from aerial imagery,” Arabian Journal for Science and Engineering, vol. 48, no. 2, pp. 1273–1284, 2023. [Google Scholar]
21. K. Qiao, L. Zeng, J. Chen, J. J. Hai and B. Yan, “Wire segmentation for printed circuit board using deep convolutional neural network and graph cut model,” IET Image Process, vol. 12, pp. 793–800, 2018. https://doi.org/10.1049/iet-ipr.2017.1208 [Google Scholar] [CrossRef]
22. J. Li, X. K. Tang and Y. J. Jiang, “A comparative study of several edge detection algorithms,” Information Technology, vol. 190, no. 9, pp. 106–108, 2007. [Google Scholar]
23. Y. Ma and Z. H. Zhang, “A comparison of several edge detection operators,” Industrial and Mining Automation, vol. 1, pp. 54–56, 2004. [Google Scholar]
24. M. Kang, Q. G. Xu and B. S. Wang, “A roberts adaptive edge detection method,” Journal of Xi’an Jiaotong University, vol. 10, pp. 1240–1244, 2008. [Google Scholar]
25. A. Howard, M. L. Zhu, B. Chen, D. Kalenichenko, W. J. Wang et al., “MobileNets: Efficient convolutional neural networks for mobile vision applications,” Computer Vision and Pattern Recognition, 2017. https://doi.org/10.48550/arXiv.1704.04861 [Google Scholar] [CrossRef]
26. F. L. Ren, X. He, Z. H. Wei, Y. Lv and M. Y. Li, “Semantic segmentation based on DeepLabV3+ with super pixel optimization,” Optics and Precision Engineering, vol. 27, no. 12, pp. 2722–2729, 2019. [Google Scholar]
27. M. K. Yang, K. Yu, C. Zhang, Z. W. Li and K. Y. Yang, “DenseASPP for semantic segmentation in street scenes,” in 2018 IEEE/CVF Conf. on Computer Vision and Pattern Recognition, 2018. https://doi.org/10.1109/CVPR.2018.00388 [Google Scholar] [CrossRef]
28. Q. L. Wang, B. G. Wu, P. F. Zhu, P. H. Li, W. M. Zuo et al., “ECA-Net: Efficient channel attention for deep convolutional neural networks,” in Proc. of CVPR, Seattle, WA, USA, pp. 11531–11539, 2020. [Google Scholar]
29. T. Lin, P. Dollar, R. Girshick, K. M. He, B. Hariharan et al., “Feature pyramid networks for object detection,” Computer Vision and Pattern Recognition, 2017. https://doi.org/10.48550/arXiv.1612.03144 [Google Scholar] [CrossRef]
30. Q. B. Hou, D. Q. Zhou and J. S. Feng, “Coordinate attention for efficient mobile network design,” Computer Vision and Pattern Recognition, 2021. https://doi.org/10.48550/arXiv.2103.02907 [Google Scholar] [CrossRef]
31. W. T. Zhu, Y. F. Huang, L. Zeng, X. M. Chen, Y. Liu et al., “AnatomyNet: Deep learning for fast and fully automated whole-volume segmentation of head and neck anatomy,” Medical Physics, vol. 46, no. 2, pp. 576–589, 2019. [Google Scholar] [PubMed]
32. T. Lin, P. Goyal, R. Girshick, K. M. He and P. Dollar, “Focal loss for dense object detection,” in Proc. of ICCV, Venice, Italy, pp. 2999–3007, 2017. [Google Scholar]
33. F. Milletari, N. Navab and S. Ahmadi, “V-Net: Fully convolutional neural networks for volumetric medical image segmentation,” Computer Vision and Pattern Recognition, 2016. https://doi.org/10.48550/arXiv.1606.04797 [Google Scholar] [CrossRef]
34. G. Y. Shi, J. Cao and Y. Z. Zhang, “Near infrared wood defects detection based on transfer learning,” Electric Machines and Control, vol. 24, no. 10, pp. 159–166, 2020. (In Chinese). [Google Scholar]
35. D. Makwana, S. C. Teja R and S. Mittal, “PCBSegClassNet–A light-weight network for segmentation and classification of PCB component,” Expert Systems with Applications, vol. 225, pp. 1–14, 2018. https://doi.org/10.1016/j.eswa.2023.120029 [Google Scholar] [CrossRef]
Cite This Article
 Copyright © 2023 The Author(s). Published by Tech Science Press.
This work is licensed under a Creative Commons Attribution 4.0 International License , which permits unrestricted use, distribution, and reproduction in any medium, provided the original work is properly cited.
 Downloads
 Citation Tools