
 Submit a Paper
 Propose a Special lssue
 Open Access
ARTICLE

Classification of Electrocardiogram Signals for Arrhythmia Detection Using Convolutional Neural Network
1 Department of Computer Science and IT, Lahore Lead University, Lahore, 54000, Pakistan
2 Department of Information Sciences, Division of Science and Technology, University of Education, Lahore, 54000, Pakistan
3 Faculty of Computing and Informatics, University Malaysia Sabah, Jalan UMS, Kota Kinabalu, Sabah, 88400, Malaysia
4 Computer Science Department UBIT, Karachi University, Karachi, 75270, Pakistan
5 Department of Basic Sciences, Deanship of Common First Year, Jouf University, Sakaka, Aljouf, 72341, Saudi Arabia
* Corresponding Author: Ag. Asri Ag. Ibrahim. Email:
Computers, Materials & Continua 2023, 77(3), 3817-3834. https://doi.org/10.32604/cmc.2023.032275
Received 12 May 2022; Accepted 30 January 2023; Issue published 26 December 2023
 View Full Text
 Download PDF
Abstract
With the help of computer-aided diagnostic systems, cardiovascular diseases can be identified timely manner to minimize the mortality rate of patients suffering from cardiac disease. However, the early diagnosis of cardiac arrhythmia is one of the most challenging tasks. The manual analysis of electrocardiogram (ECG) data with the help of the Holter monitor is challenging. Currently, the Convolutional Neural Network (CNN) is receiving considerable attention from researchers for automatically identifying ECG signals. This paper proposes a 9-layer-based CNN model to classify the ECG signals into five primary categories according to the American National Standards Institute (ANSI) standards and the Association for the Advancement of Medical Instruments (AAMI). The Massachusetts Institute of Technology-Beth Israel Hospital (MIT-BIH) arrhythmia dataset is used for the experiment. The proposed model outperformed the previous model in terms of accuracy and achieved a sensitivity of 99.0% and a positivity predictively 99.2% in the detection of a Ventricular Ectopic Beat (VEB). Moreover, it also gained a sensitivity of 99.0% and positivity predictively of 99.2% for the detection of a supraventricular ectopic beat (SVEB). The overall accuracy of the proposed model is 99.68%.Keywords
Cardiovascular disease affects millions of people throughout the world. The World Health Organization (WHO) annual report mentions that 30% of the world’s population dies from cardiovascular diseases. Arrhythmia is one of the leading causes of cardiac death. Cardiac arrhythmia is a condition in which the heart’s rhythm is irregular. Arrhythmia causes the heart to beat extremely fast, too slow, or irregularly compared to its normal rhythm [1]. Due to this situation, the heart cannot supply enough blood to the other body parts. In this condition, the blood cannot flow in the proper proportion, which also affects brain functionality.
The majority of arrhythmia types are dangerous to the heart. Arrhythmia is generally divided into two categories: non-life threatening and life-threatening. As a result, constant monitoring of heartbeat activity is inevitable. An electrocardiogram (ECG) is the best tool for detecting and monitoring arrhythmia. Doctors frequently ask patients with suspected arrhythmias to constantly use the Holter device to monitor ECG signals.
The ECG is a clinical method that uses a skin electrode to detect the heart’s electrical activity. A human heartbeat’s rhythm and heart rate indicate cardiac health level. It is a nonsurgical device that detects a signal on the human body’s surface and uses to identify heart issues. Any variations in heart rate or rhythm, as well as morphological pattern alterations, are indications of cardiac arrhythmia, which can be detected by an ECG signal analysis [2].
The amplitude and length of the P-QRS-T waves reveal important details regarding the nature of cardiac illness. Depolarization and repolarization of Na+ and kaons in the blood produce electrical waves [3]. The ECG does not provide information on heart contraction or pumping. Because the Holter device collects such a large amount of ECG data, it is necessary to use a computer to analyze the recordings and automatically identify the different types of heartbeats. The non-life-threatening arrhythmia signal, that signal can be further classified into five different classes; Normal beat (N), supraventricular ectopic beat (SVEB), ventricular ectopic beat (VEB), fusion (F), and unknown. The Association uses all these terms for the Advancement of Medical Instrumentation (AAMI) [4].
Arrhythmia has many types, every type has a pattern, making it easy to find its kind. Arrhythmias disease can be divided into two main categories. Morphological arrhythmia is the first category that is formed by a single irregular heartbeat. Rhythmic arrhythmias are the second category formed by the set of irregular heartbeats. Supraventricular tachycardia is another type of arrhythmia with the abnormality of the heartbeat. Bradycardia is another type of arrhythmia where the heartbeat is slower than normal. Ventricular fibrillation is another type of arrhythmia that is a rare, rapidly fast increase in the heartbeat, if not treated immediately, the sudden patents death [5,6].
This paper is based on a simple transfer-learning-based Convolutional Neural Network (CNN) classification model. To address the limitations of hardware resources and computing power, the lightweight CNN MobileNetV2 is used as the model’s foundation. A lightweight convolutional network with feature optimization (LWCNN-FO) is also proposed in this paper. Experimental results demonstrate that the proposed method successfully reduced model complexity while preserving accuracy compared to state-of-the-art approaches.
Motivated by the researches [7] and [8] on how to classify ECG signals for arrhythmia detection correctly, a novel CNN-based model is proposed for the classification of the ECG signals into five different groups for arrhythmia detection as well as to improve the efficiency and effectiveness of the classification of ECG signals. Our proposed model works in four-step; first, database pre-processing; second, database normalization; third, heartbeat segmentation; and finally, classification of the ECG signals. Furthermore, the model’s performance is improved by using augmentation techniques. Once the network has been trained, it can quickly diagnose the ECG signals. For the ECG signals that were recorded with the Holter device, the CNN is used to analyze them automatically, as described in [9].
The remaining paper is organized into the following section, and Section 2 describes the literature review as well as the material and datasets used in the experiments. In contrast, Section 3 describes the methodology used for classifying ECG signals for arrhythmia detection. Section 4 explains the result and discussion, and finally, Section 5 concludes the present paper.
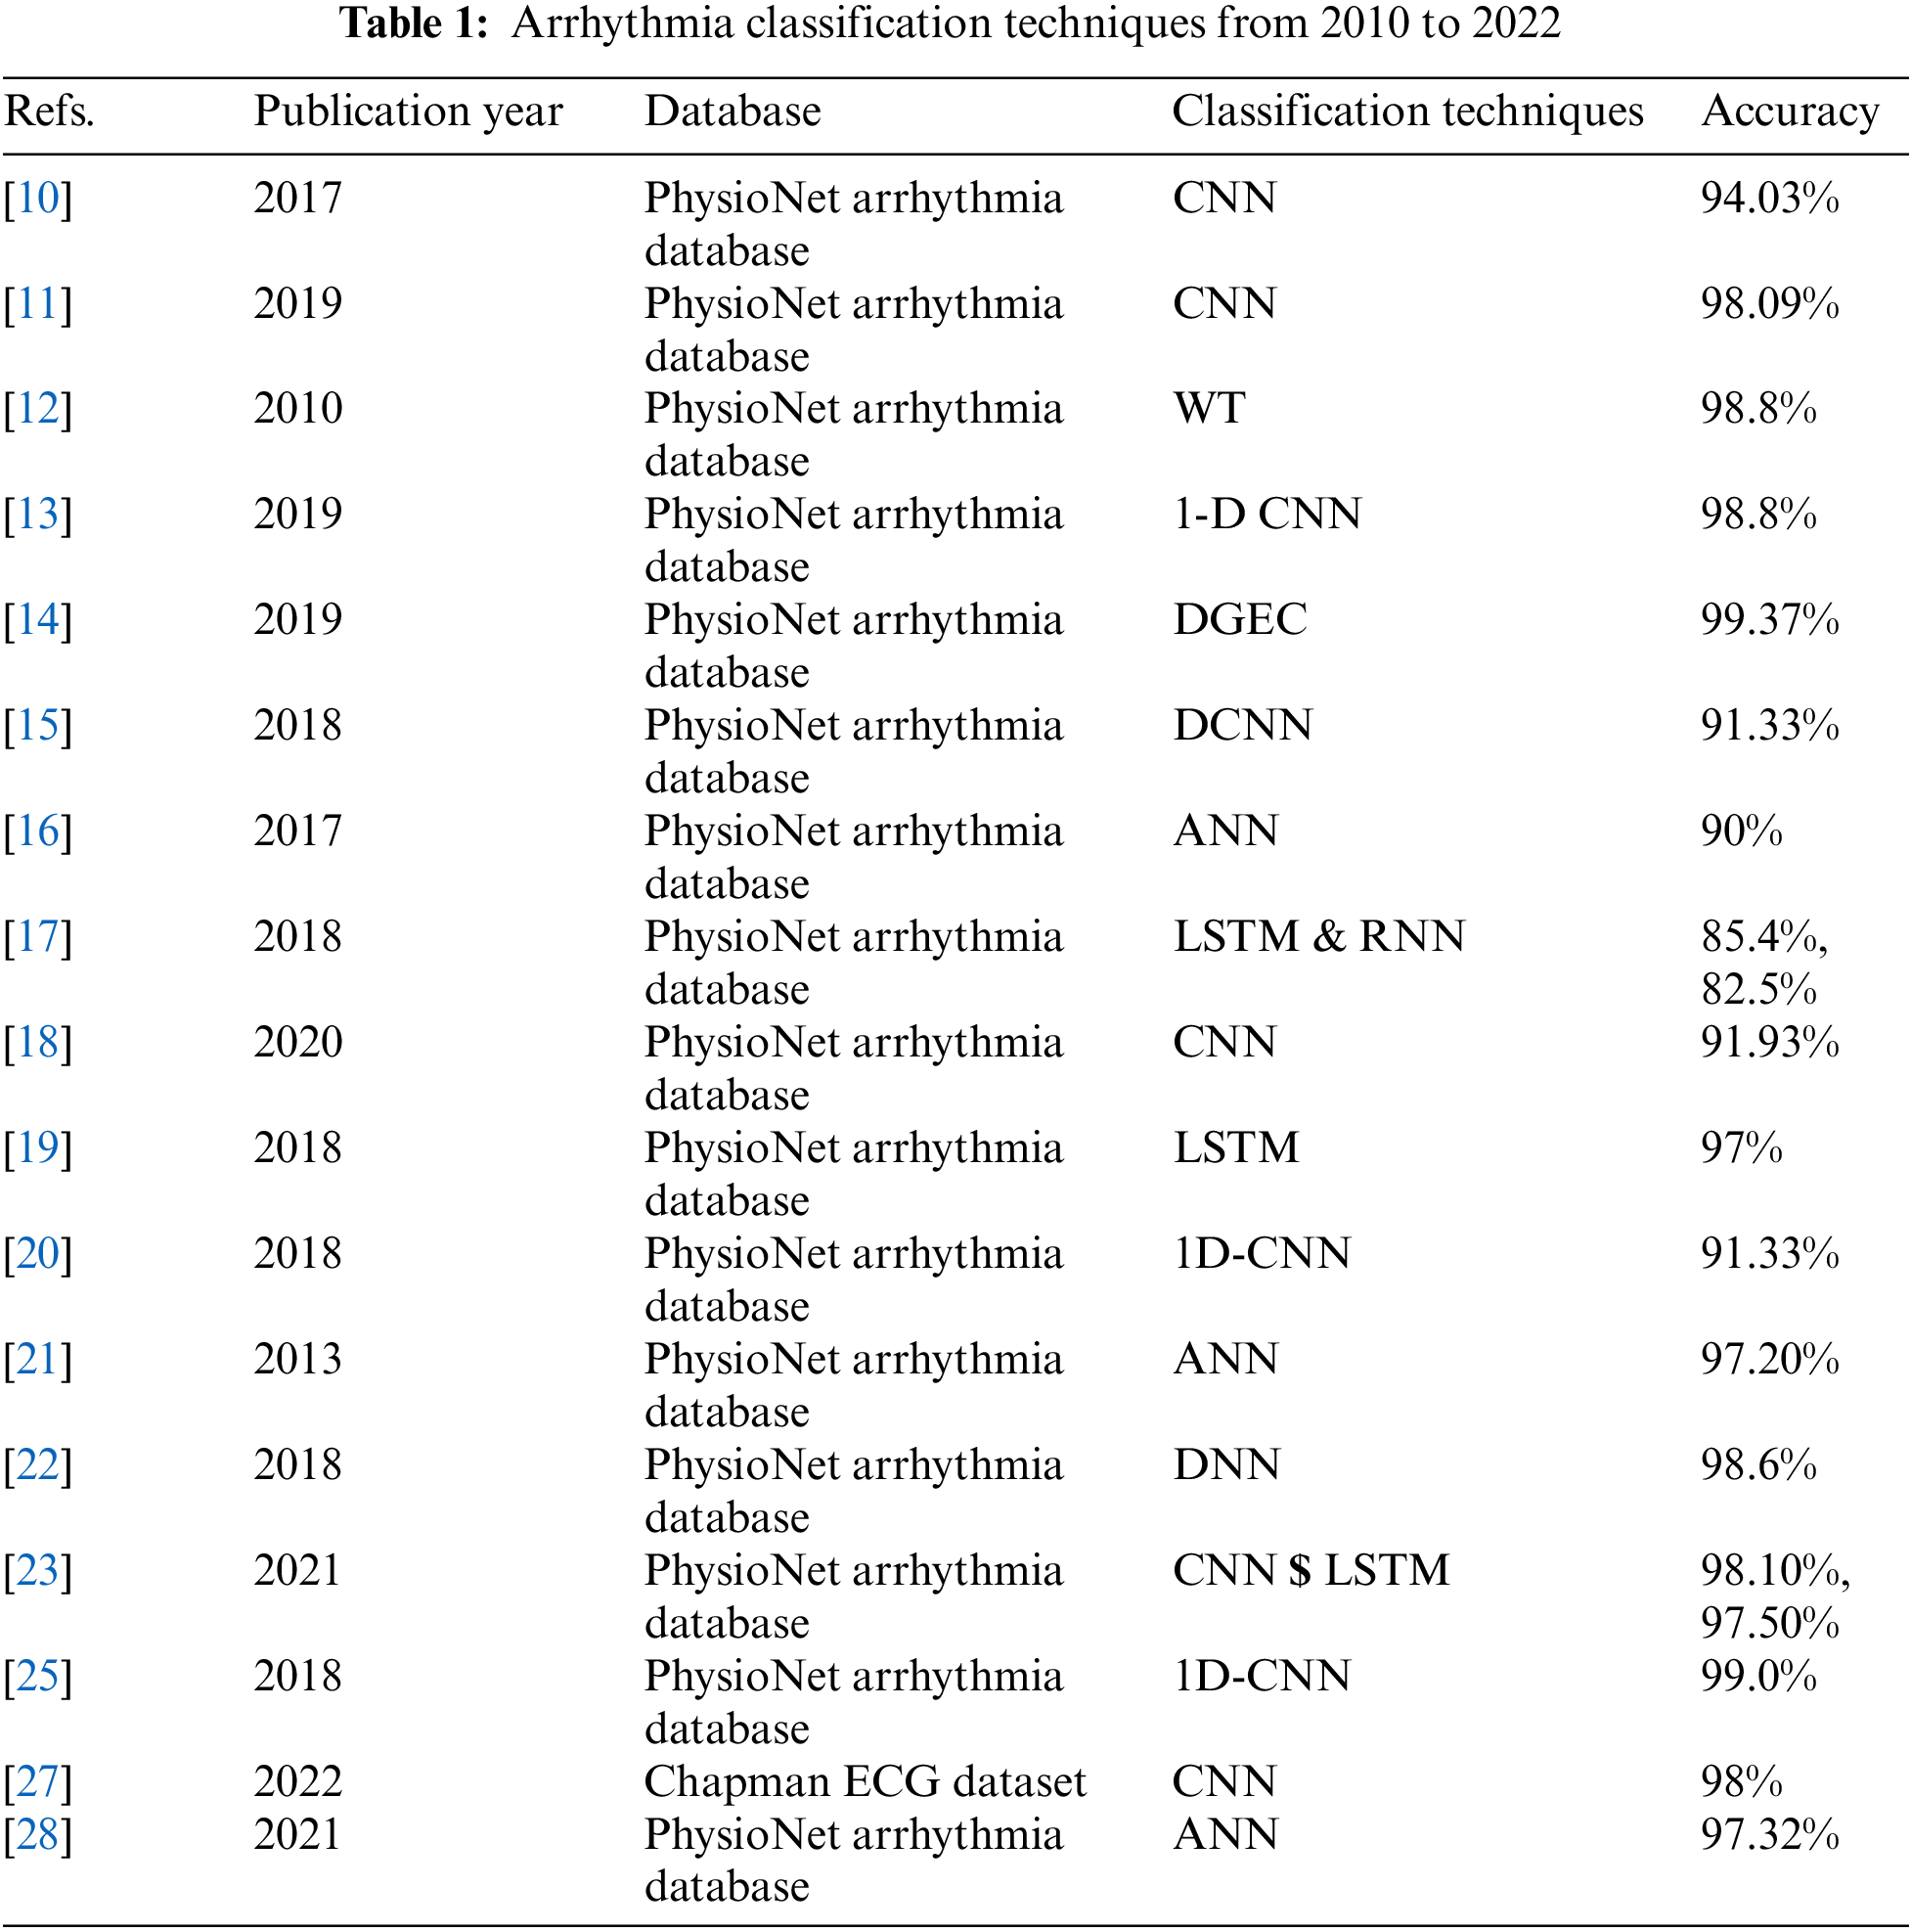
Acharya et al. [10] presented a 9-layer deep CNN that automated the identification of 5 types of heartbeats using ECG readings. This work mainly focused on diagnosing arrhythmia or abnormal heart conditions before being integrated into the CAD ECG system to identify arrhythmia fast. The five basic ECG heartbeat types can be classified using a CNN. The tests employed original sets of ECG signals from the MIT-BIH arrhythmia database, which are publicly available. In terms of diagnosing arrhythmias, the suggested model (CNN) has a 94.03 percent accuracy rate. The authors indicate that they want to train the CNN on the ECG in the future to improve the performance of the proposed model. Using 21,709 ECG data of type Net A and 8,683 ECG signals of type Net B in his work, U. R. Acharya suggested a Fully Convolutional Model for categorizing the four unique classes (AFL, NSR, V-FIB, and A-Fib) (2019). For the NET A, this model has a sensitivity of 99.13 percent, a specificity of 94.90 percent, an accuracy of 81.44 percent, and a specificity of 94.90 percent. The Net B’s accuracy, specificity, and specificity are all 94.90 percent, 99.13 percent, and 81.44 percent, respectively. The tests employed publicly accessible original sets of ECG signals from the MIT-BIH arrhythmia database. In future research, they want to employ a big arrhythmia database with more AFL, NSR, V-FIB, and A-Fib ECG segments to create a model that can cover a broader range of patients [11].
In [7], Pan proposed the Wavelet transform (WT) approach for detecting and categorizing arrhythmia. The diagnosed (QRS) complex improved, and the Wavelet transforms (WT) model can also analyze (P) and (T) waves. The suggested model Wavelet transformations (WT) detected the (QRS) complex, as well as the (P) and (T) waves, with 99.8% accuracy. The tests employed original sets of ECG signals from the MIT-BIH arrhythmia database, which are publicly available [12]. Anwar et al. [13] introduced a 1-D convolutional neural network (1-D, CNN) Model for the identification of (QRS), which shows how to operate successfully without using decision rules. A 1-D convolutional neural network classifier was employed as a decision rule. The result for QRS detection is positive when convolutional neural networks are pooled. The suggested model has a 99:93 percent accuracy rate. The tests employed original sets of ECG signals from the Massachusetts Institute of Technology-Beth Israel Hospital MIT-BIH arrhythmia database, which are publicly available. Cross-validation with new databases and enhancing and raising overall performance can be used to increase method hyper-parameters in the future [14].
Plawiak et al. [15] suggested a Deep Genetic Ensemble of Classifiers (DGEC). They develop a hybrid approach that combines the benefits of deep learning, ensemble learning, and evolutionary computing. They used ECG signal singles that lasted a long time (10 s). According to the researchers, the DGEC model has a classification accuracy of 99.37 percent and a specificity of 99.66 percent. The tests employed original sets of ECG signals from the MIT-BIH arrhythmia database, which are publicly available. In the feature, they functioned as follows: (1). a categorization system that distinguishes 17 different forms of heart disease. (2). The tenfold method of cv Submits a request for a validation scheme. (3). Power imbalanced data for a few essential classes.
Yıldırım et al. [16] introduced a 1D-convolutional neural network (1D-CNN) model for detecting cardiac arrhythmias from long-duration ECG data analysis in 2018 (10s). They built unique deep learning-based methods for quickly and effectively identifying cardiac arrhythmias. With a classification accuracy of 91.33 percent, the proposed model 1D-Convolutional Neural Networked (1D-CNN) has the best performance and accuracy among the 17 cardiac arrhythmias. The tests utilized original sets of ECG signals from the MIT-BIH arrhythmia database, which were made publicly available. They want to increase the overall performance of cardiac problem or disorder categorization in the future by using deep learning ensemble learning. Physiological signals were employed to help enhance the 1D-CNN model’s testing.
In 2017, Patil et al. [17] introduced an Artificial Neural Network (ANN) pattern recognition model that can learn even the most complicated and nonlinear surfaces. They developed a model ANN for detecting correct ECG heartbeat patterns, which may be employed in a patient-specific classification system. Over a bigger dataset, the proposed Artificial Neural Network (ANN) model attained an overall accuracy of 90%. Experiments were conducted utilizing publicly accessible original data sets of ECG signals from the (MIT-BIH) arrhythmia database. According to the researchers, doctors might use this model to assess patients’ heart issues in life-threatening scenarios.
The MIT-BIH arrhythmia database was utilized to classify the beat classification accuracy in this work [18]. Training and testing datasets may be created using ECG time-service data. This article feeds a large volume of ECG time-series data into a networked Long Short-Term Memory (LSTM). The model RNN and the LSTM both have an accuracy of 82.5 percent for the RNN and 85.4 percent for the LSTM, which is lower than the LSTM accuracy.
The Deep Learning model is used for ECG signal classification [19], and it improves the performance of the automatic ECG signal classification system. In this paper, a deep learning model is developed for ECG signal classification that employs the various layers of the traditional pooling operation and rectifier to enhance the performance of ECG signal feature extraction. Overall, the recommended strategies increased the classification system’s efficiency, and this technique achieved higher accuracy than the other system. The test result accuracy was 91.93 percent, and the training result accuracy was 99.7%; recall was 92.639, the F1 score was 91.992, and precision was 92.325 in this study. The arrhythmia was classified using LSTM methods in this research [20]. They used AdaDelta as an adaptive learning strategy to attain the best results. The proposed method got better results and proved great accuracy using the LSTM and AdaDelta. The training classification accuracy was 98 percent, while the test classification accuracy was 97 percent. The information came from the online arrhythmias database at MIT-BIH.
The new deep-learning algorithms for identifying arrhythmia based on the analysis of long-duration ECG signals were explained in this study [21]. The total accuracy of the 1D–CNN model for detecting arrhythmias is 91.33 percent, with a classification time of 0.015 s per signal and a10-s analysis time for each signal. The purpose technique, Wavelet and transform, and an ANN, are employed to classify the arrhythmia in this research [22]. This method is used to categorize the many forms of arrhythmia. The technique is used to connect the time-frequency and time-domain features. This method achieved a high level of accuracy of 97.20 percent. This technique of deep neural network is utilized to classify these five types of pulse in this research [23]. The proposed method attained a high accuracy of 98.6% using the deep neural network (DNN) model. For the classification of heartbeat segments, the ResNet model is used in this research. The best performance was achieved as a result of using this model, and the most essential choice for further describing this model to get high performance was picked [24].
The best performance was achieved from using this model, and the most important choice for further describing this model to get high performance was picked. The CNN model achieves 98.10 percent accuracy, whereas the LSTM model achieves 97.50 percent accuracy, demonstrating the effectiveness of this strategy [25]. The study [26] used 1D convolutional neural networks for reliable ECG signal categorization and monitoring in patients. Based on the training dataset, a 1D-CNN-trained model was employed for patient-specific categorization. The 1D-CNN Convolutional neural network attained an overall accuracy of 99.0. Table 1 shows the summary of Arrhythmia Classification Techniques from 2010 to 2021.
Meqdad et al. [27] developed an Interpretable Meta Structural Learning method in this article to solve the difficult task of classifying different arrhythmia of ECG signals recorded in multiple sessions for each individual. In the CNN models, they integrated a space label fault with GUMBEL-SOFTMAX distribution and a structural feature extraction fault into a compound loss function. To achieve the interpretability feature for CNN models, they encoded the models as evolutionary trees of the GP algorithm. As the GP algorithm develops, these trees acquire the characteristics of extracting deep structural features. On samples from the ChapmanECG dataset on 10646 patients, which were captured in various sessions, they developed the CNN classification model, which has an accuracy of 98% for the classification of 7 classes of arrhythmia.
Nisar et al. in [28] introduced personalized techniques for real-time cardiac arrhythmia detection and diagnosis based on Cloud Computing. They created a system that uses real-time ECG signal monitoring to effectively detect and diagnose arrhythmia occurrences in patients with cardiac arrhythmia disorder. They specifically suggest an online platform for individualized diagnosis and online detection of cardiac arrhythmia. To increase the accuracy of the arrhythmia classification, they use a genetic algorithm, an online backpropagation method, and a boosting technique.
ECG dataset from the MIT-BIH arrhythmia database is used in our study. The ECG heartbeat classifier for arrhythmia detection comprises six main steps: Database Pre-Processing, Database Normalization, Heartbeat Segmentation, Database Splitting, CNN Classifier, and Classification results. Fig. 1 shows the overall steps.
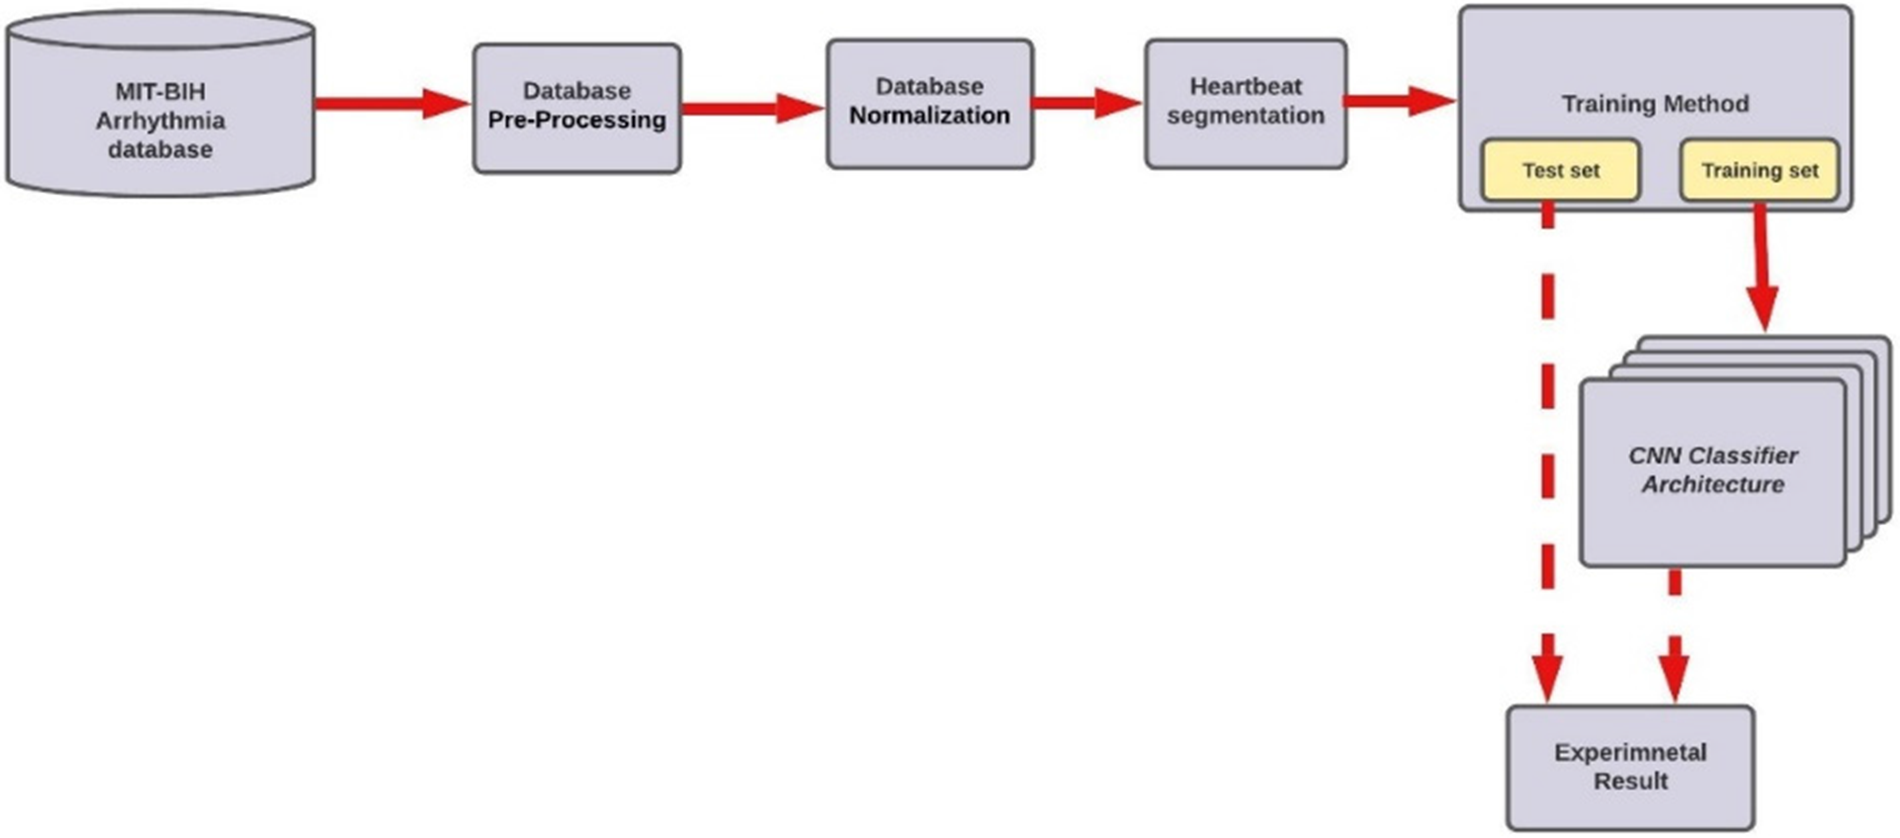
Figure 1: Methodology diagram of the proposed model
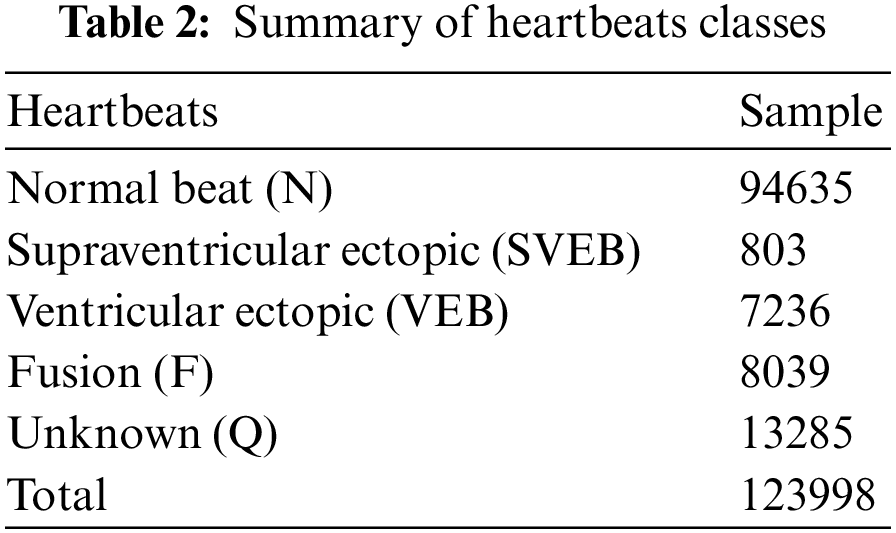
In this work, the MIT-BIH arrhythmia dataset is used. The MIT-BIH arrhythmia dataset consists of 48 parts of dual-channel ECG signal, and all ECG data was obtained from the 47 patients; each ECG data has a sampling rate 360 Hz. Each ECG signal is around 30 min long and consists of two leads: one lead is V1, V2, V4, or V5, and the second is the MLII. Two or more cardiovascular disease professionals manually identified the location of every R-peak and the corresponding category. The key classes in the MIT-BIH arrhythmia database are N, S, V, F, and Q, comprising multiple sub-classes. The second MLII lead signals were also used in this experiment because they were primarily used in the literature paper. There are 300 sample points in each heartbeat, 150 ECG samples before the R-peak, and 149 ECG samples after the R-peak. Approximately 1239998 ECG signal segments were retrieved from five main categories based on the AAMI recommendations: Non-Ectopic Beat (N), Supraventricular Ectopic Beat (SVEB), Ventricular Ectopic Beat (VEB), Fusion Ectopic Beat (F), and Unknown Beat are the different types of ectopic beats (U). Table 2 illustrates the classes, number of pulses, and waveform samples for each category in the arrhythmia data.
The number of ECG signal fragments gathered for each diagnostic category of cardiac arrhythmia, as well as their allocation into training, validation, and test sets. The typical ECG signals derived from the ECG dataset are shown in Fig. 2.
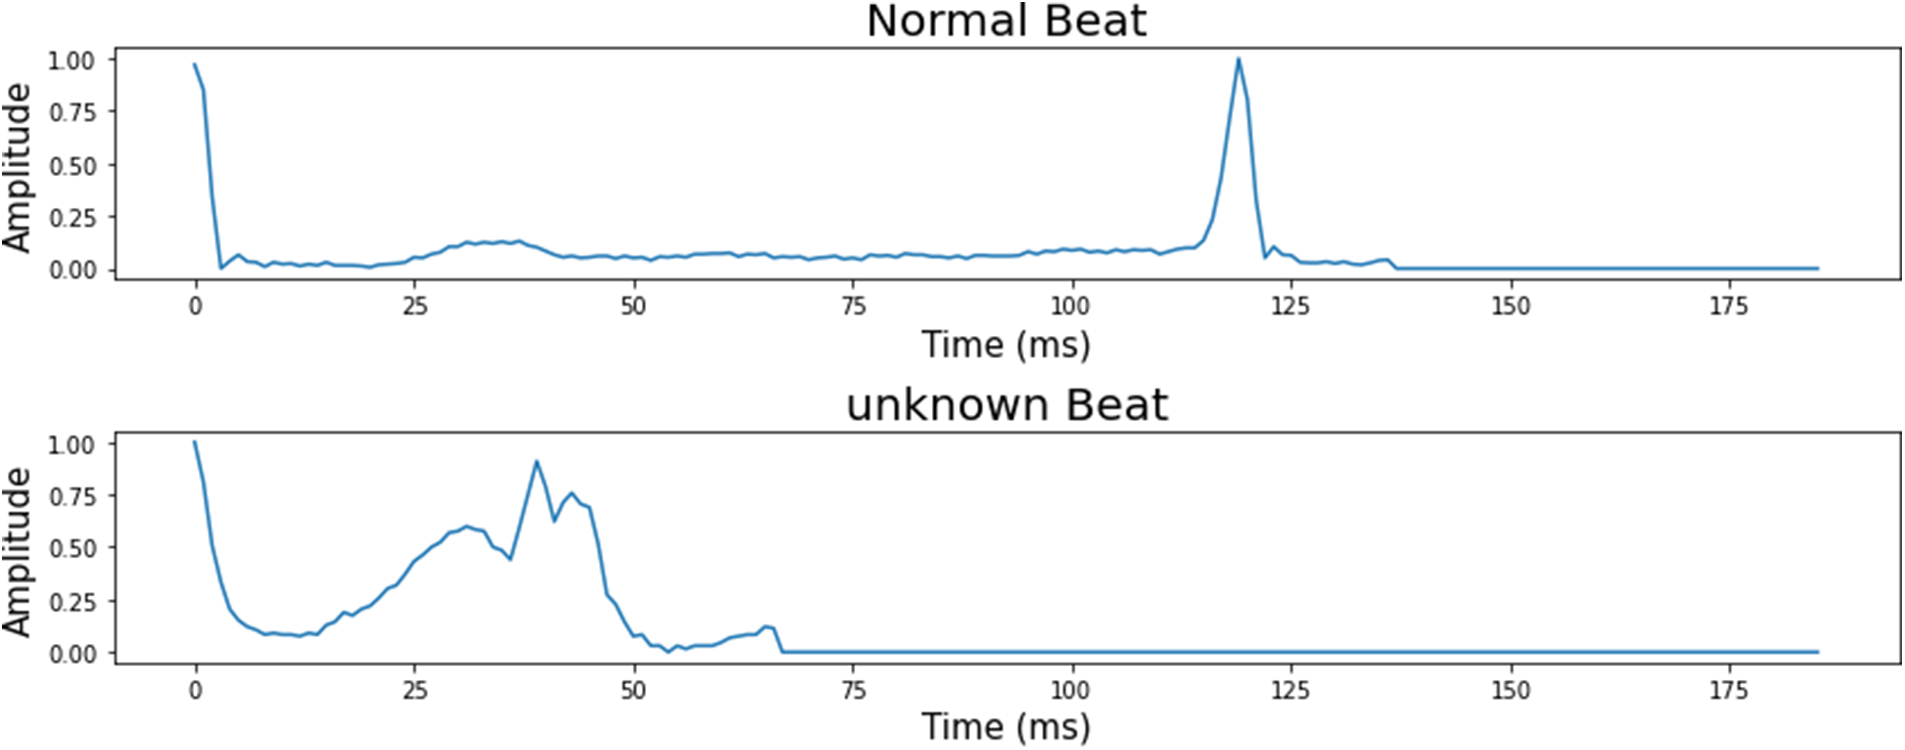
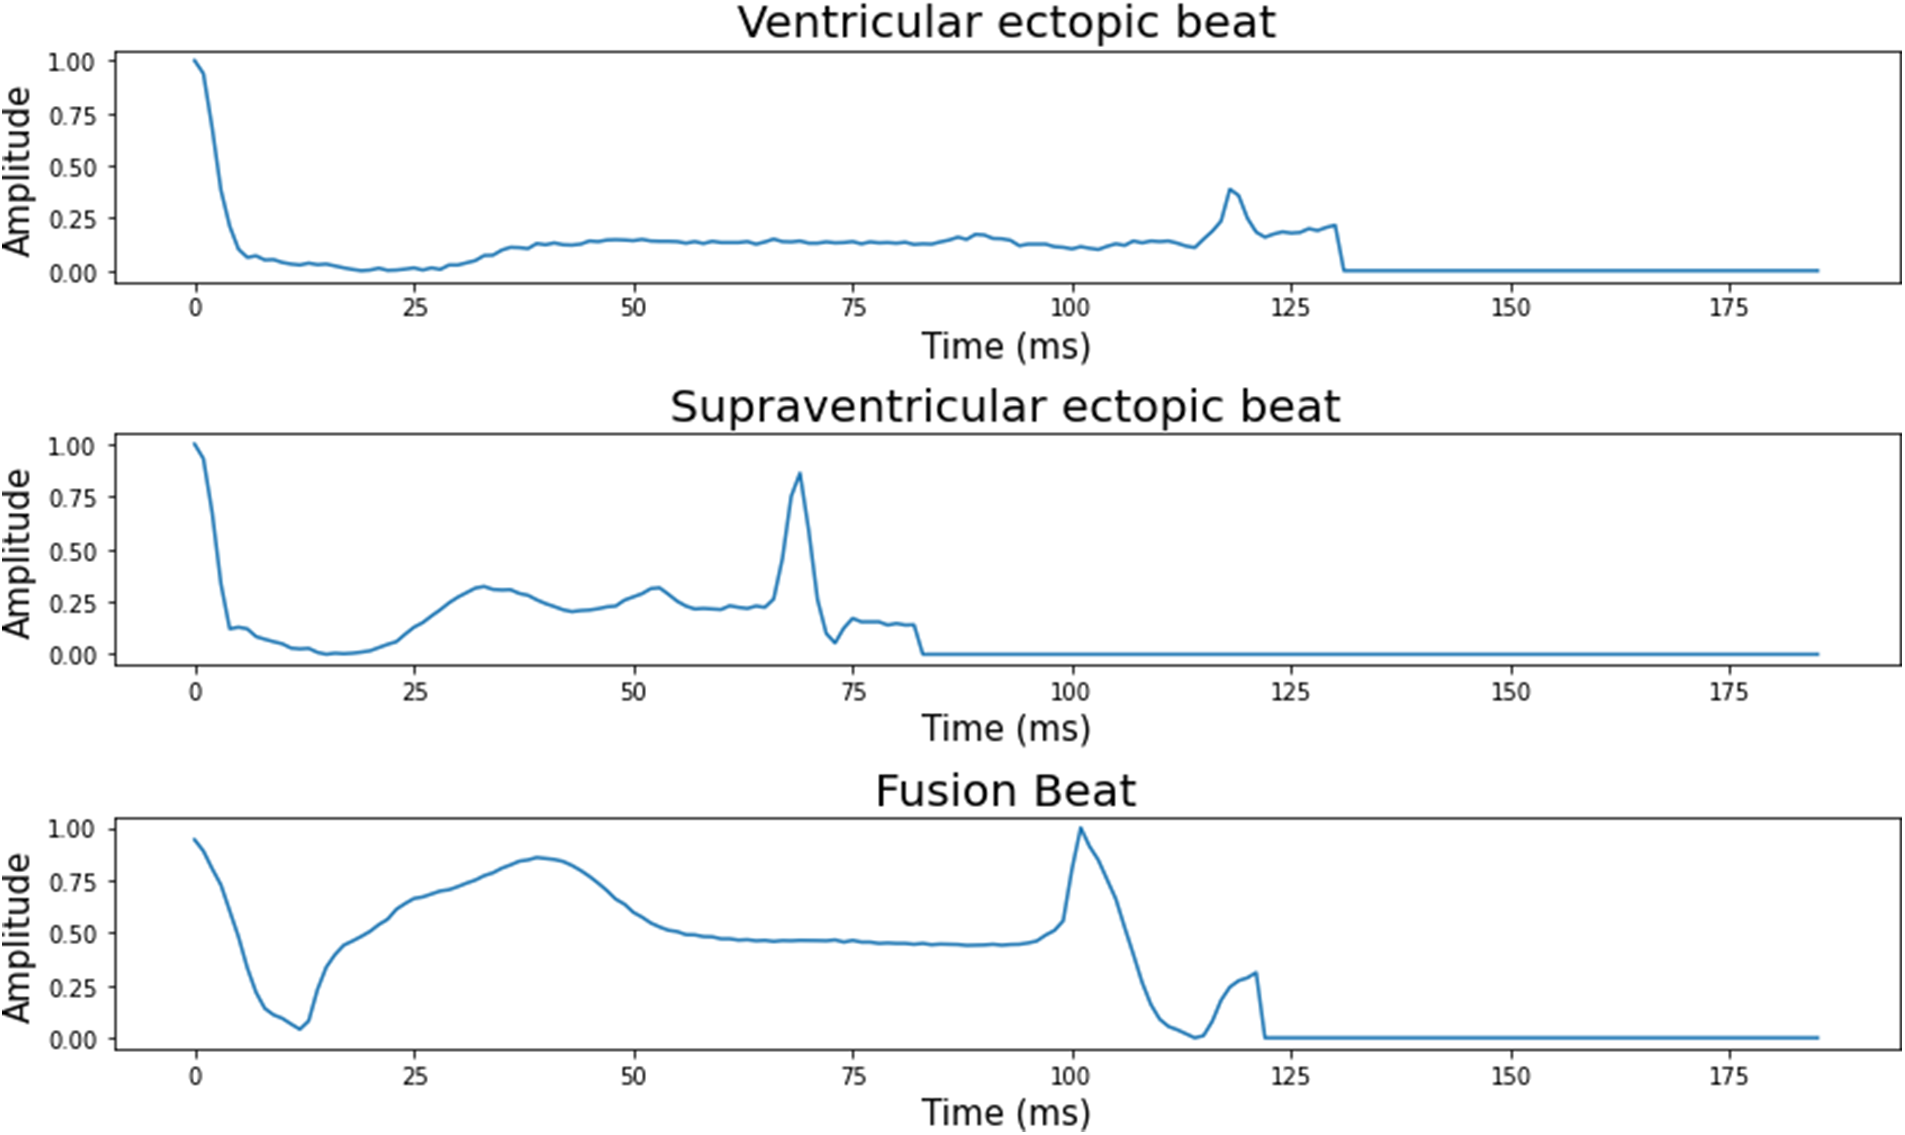
Figure 2: 5 classes of the heartbeat signal
Noise signals such as baseline drift and power line interfaced impact the ECG data in the MIT-BIH arrhythmia dataset. Wavelet filters are used to minimize the noise in the raw ECG data. The raw signal was broken down into six levels using Daubechies wavelet 6 (db6), with the wavelet coefficients from the third to sixth levels being saved and used for signal reconstruction, as shown in Fig. 3.
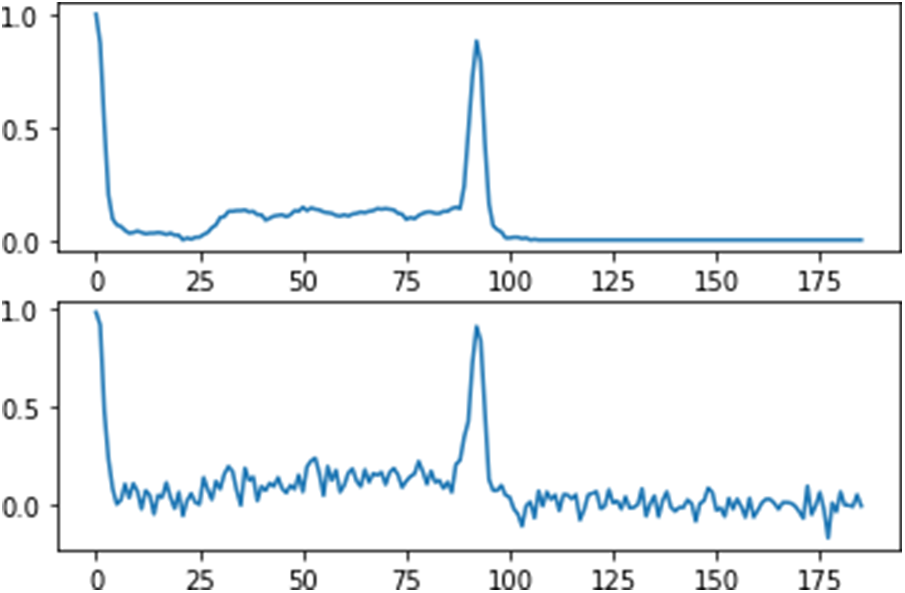
Figure 3: Diagram of the removing noise data
Normalization is the process of scaling a signal at an identical level. The Z-score normalization technique was used to standardize all ECG signal values. This approach solves the amplitude scaling problem while also eliminating offset effects. The procedure below is used to calculate the Z-score normalized signal values from the dataset [29]. The MIT-BIH arrhythmia database contains the records of 48 patients. The normalization of each ECG signal recording file is done independently.
ECG signals are segmented and saved to get individual heartbeats utilizing the cardiologists’ annotation file information. During the segmentation procedure, all peak values are first determined from the annotation file information, and then whole ECG signal sets are split into segments based on the peak values.
3.5 Convolutional Neural Networks
Level one headings for sections: should be in bold, flushed to the left, and numbered using Arabic CNN is one of the most widely used artificial neural networks. A Multilayer Perceptron was used to create CNN. The activation function of every single neuron in a multilayer perceptron (MLP) maps the weights inputs to the CNN outputs. When more than one hidden layer is added to a multilayer perceptron (MLP), it becomes a deep multilayer perceptron (DMLP). Traditional neural networks develop a link between the input and output through matrix multiplication, which means that every output layer is connected with previous input layers that create the fully connected neural network [30]. When the number of hidden neurons increases, more calculations can be done. The introduction of convolutional layers is a crucial feature of CNN. The convolutional layers can be divided based on the matrix multiplication method, and the input data can be convoluted with the help of the kernel. Fig. 4 explains the three connected convolutional layers.
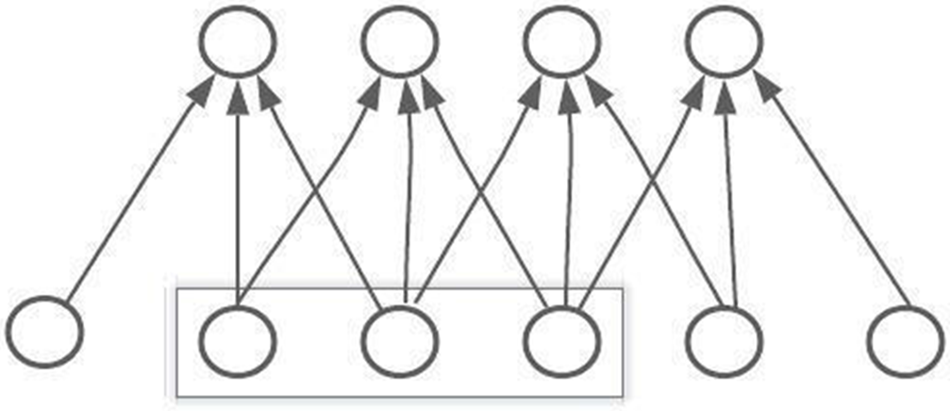
Figure 4: Diagram of a CNN convolutional layer connection
The convolutional neural network layers l, basically connected with the other three neurons layers
In contrast, the average pooling method uses the average value in the surrounding area as the output in the average pooling method. Fig. 5 shows a two-step maximum pooling pooled layer connection. All the adjacent unit feedback is combined by the pooling, and after the pooling, all the units are reduced, so computation performances have been increased.
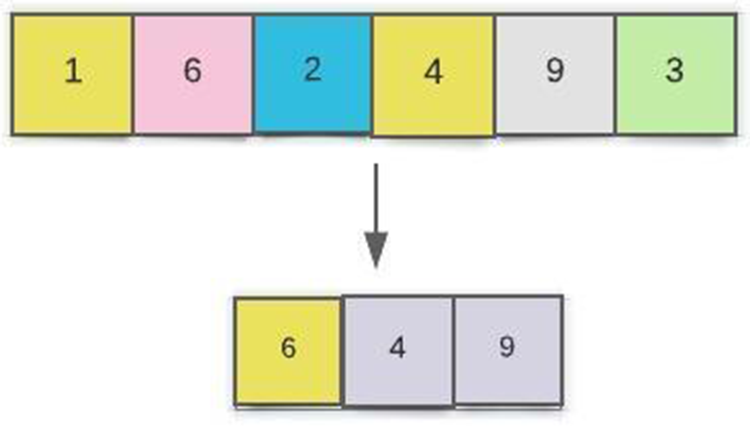
Figure 5: Diagram of a CNN pooling layers
Because the CNN was based on convolutional layers, it could automatically identify the most relevant feature Convolution layers are used to extract information from the input data. It emphasizes, among other things, local characteristics and places. On the convolutional neural network, the neurons’ weights on the same feature maps result from the network learning in parallel, which is essential to reduce the learning time. The proposed architecture of a CNN model for the Classification of ECG signals for arrhythmia detection is shown in Fig. 6.

Figure 6: Diagram of the proposed model CNN
In this paper, the proposed CNN model was developed with nine layers, four convolutional layers, two subsampling layers, two fully connected layers, and Softmax layers to round up the set. The working of our proposed convolutional neural network is shown in Fig. 6, which consists of four layers C1, C2, C3, and C4 that can be used to perform all the operations defined in Eq. (1), and a kernel size of convolutional layers 5, 5, 3 and 3, and that worked based on the previous layer.
In Eq. (1), the Mk is the efficient range value of the Convolutional layers,
Both S1 and S2 are subsampling layers that are used in the convolutional neural network to minimize the size of input of the following layers and also minimize the size of the ECG signal; due to this method, they reduced the amount of calculation that results in obtaining the essential and valuable feature. The max-pooling can be utilized in the adjacent location to get a high value. Eq. (2) is used to calculate both kth neuron and subsampling layers l.
In Eq. (2), the output of the kth neuron can be defined as
To enhance the number of nonlinear processes, in the CNN diagram, the F1, F2 and F3 are fully connected layers of the model, which found the kth neuron.
In Eq. (3), the
In our study, on both layers, fully-connected and convolutional layers, the rectified linear unit is used as the activation function. The Softmax activation function was also used in the output layers to obtain the result.
The primary purpose of training the neural network is to minimize the value of loss function L, and also, the biases and weights can be modified on the smallest value. Minimize the loss function by using the cross-entropy given in Eq. (4).
The total number of neurons in the output layers is indicated by N in Eq. (4), and
In equation mentioned above (5), g can be defined as m, where m is the gradient batch size, and network,
The first-moment estimate is skewed, and the second-moment estimate is biased. Both first and second-moment biases are explained in Eq. (9).
The 1st and 2nd moment estimates of the gradient are
In Eq. (10), the
On the fully connected layers F1 and F2, as well as the convolutional layers C2 and C4. Dropout was utilized to prevent overfitting. Dropout permits training the weights of the hidden layer neurons. These nodes may be invalidated if the value is changed to zero at random. A vast number of tests show that adding a dropout layer reduces.
Using stratified sampling, the MIH-BIT arrhythmia dataset can be divided into training and testing sets. 90% of the data was used from the training model, and 10% was used to check the validity of the trained model. However, both sets’ training and validation are mostly related. Fig. 7 shows the separation of the training and testing samples.

Figure 7: Splitting the ECG dataset used training and testing
In this paper, our proposed model was successfully developed in win-python 3.8.8 and using Keras libraries and backend tensor flow graphics processing unit (GPU). This test performs on the HP machine with Intel core i5 Elite Book 8460p with 2.5 GHz processor with 6 GB RAM. During the train system, the CPU consumes a minimum of 220 s and a maximum of 242 s per epoch to complete this experiment. When the training process was complete, all the network parameters were saved in the best model. Two curve lines, red and blue, represent the overall accuracy of the training and validation set, as shown in Fig. 8.

Figure 8: Proposed model accuracy curve
There are two curves, red and blue; the blue line defines the training loss, and the red line represents validation loss. The training and validation loss can show in Fig. 9.

Figure 9: Proposed model loss curve
The confusion matrix on the test data set is shown in Table 3, and that confusion matrix proved the stability of the model learning. Fig. 10 shows the confusion matrix with normalization that offers the proposed model’s overall accuracy.
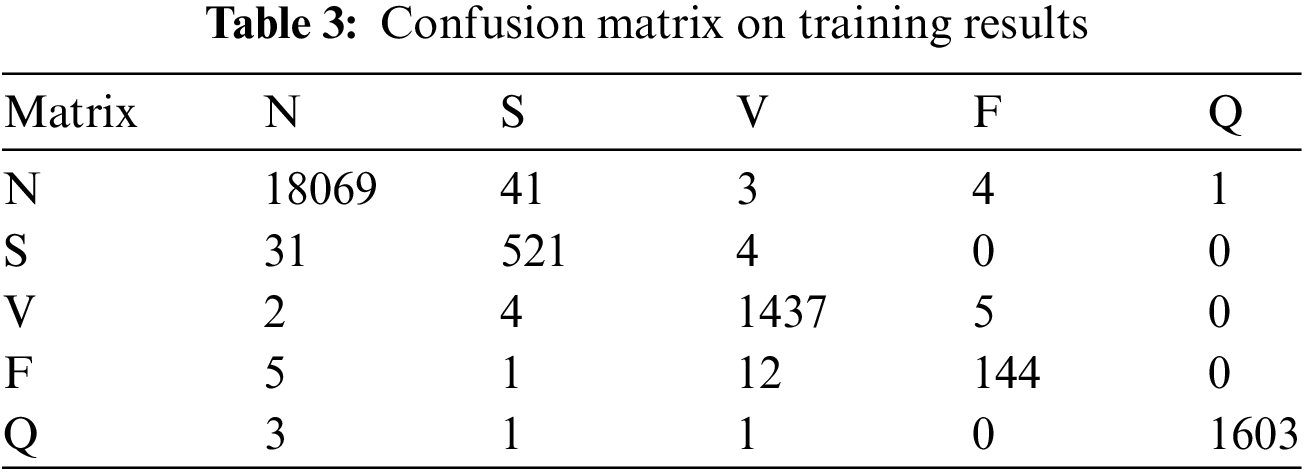
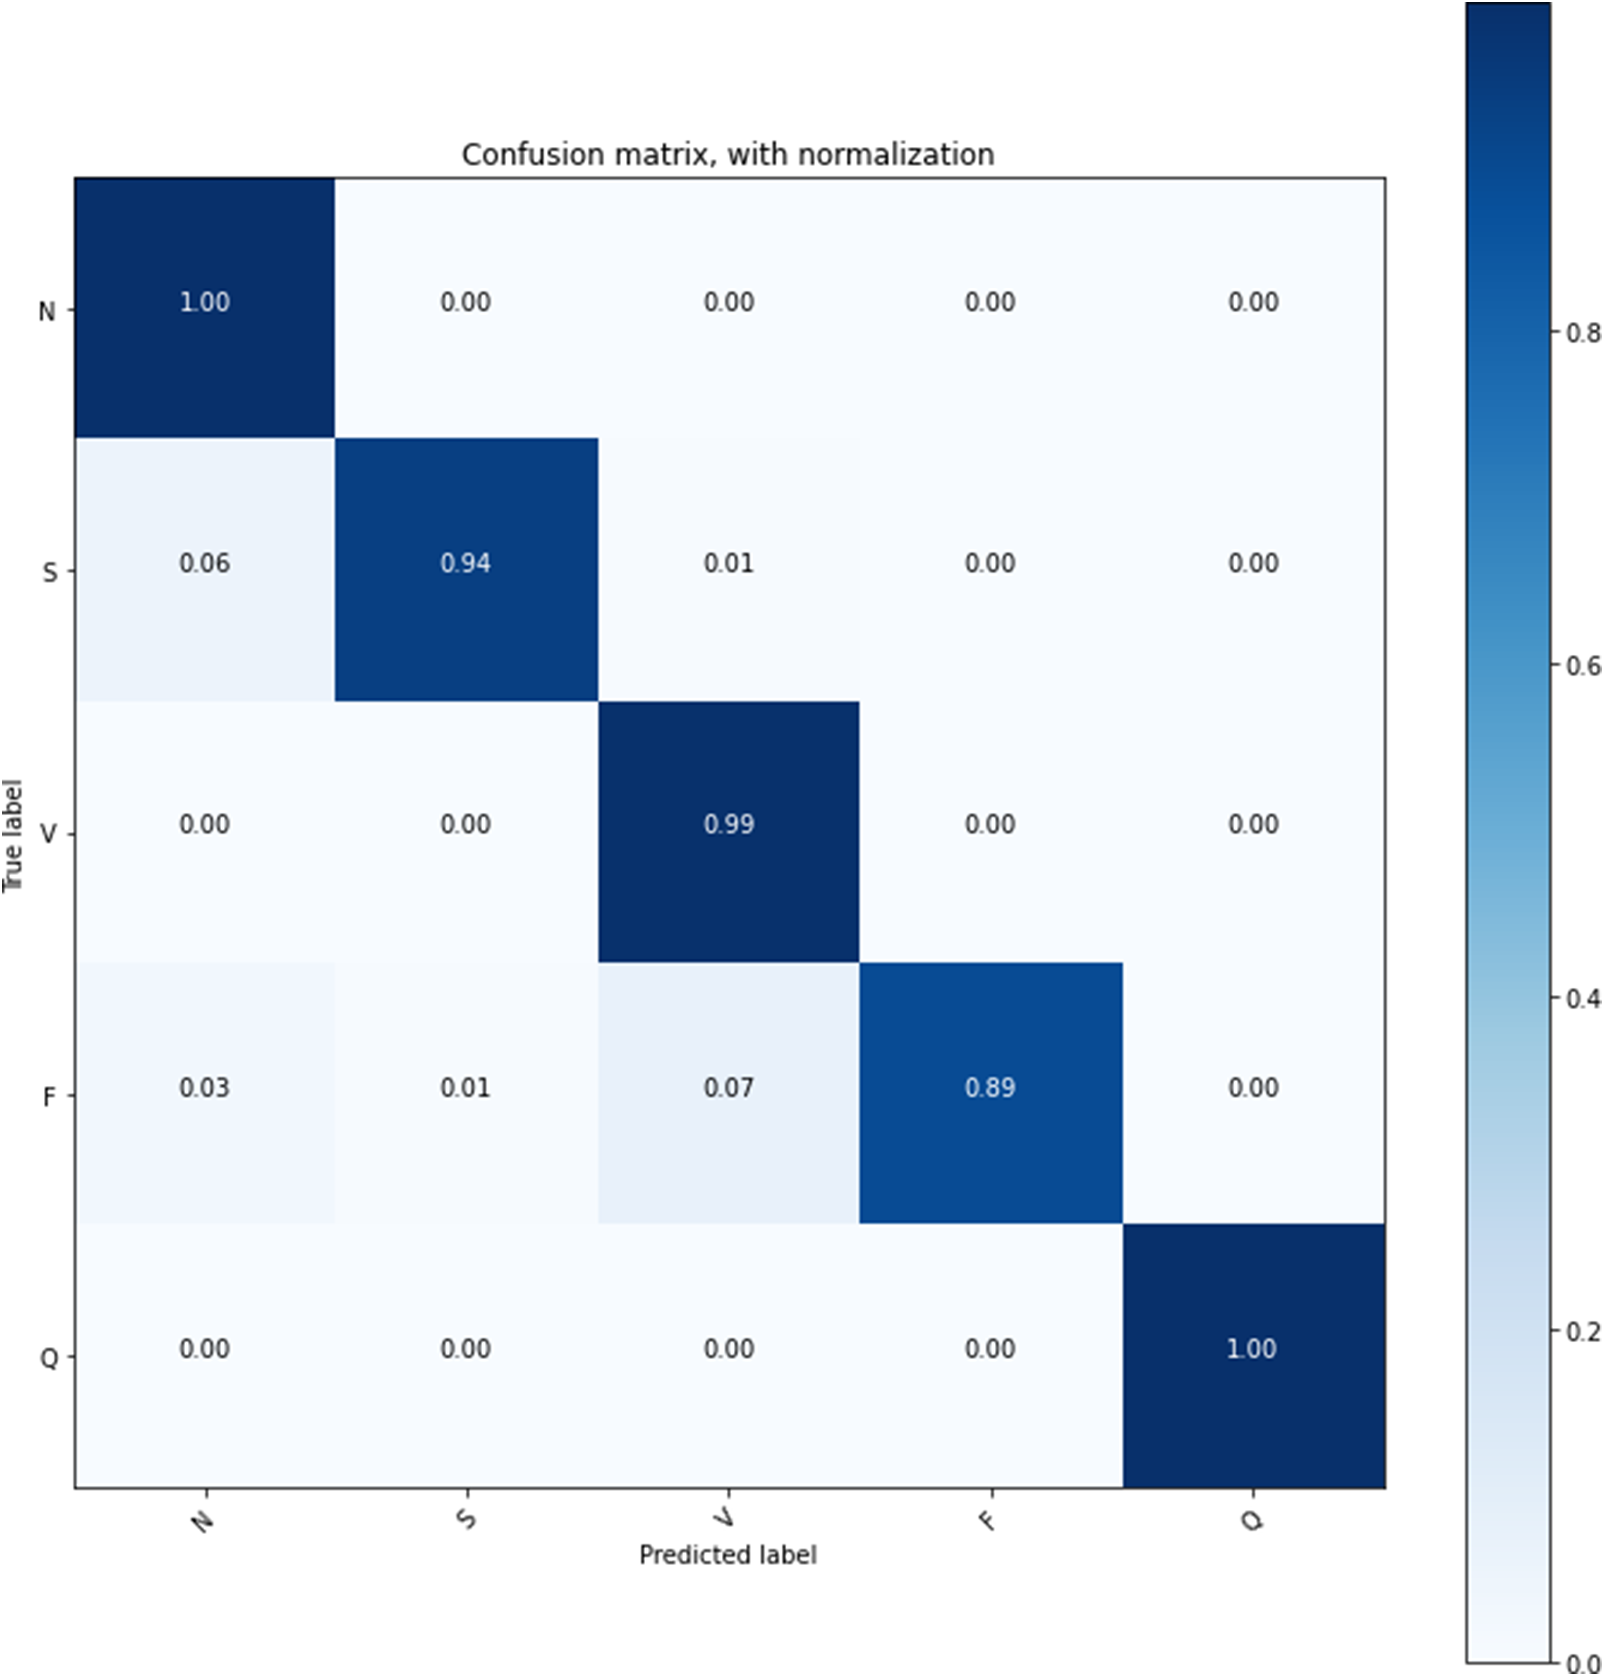
Figure 10: Confusion matrix with normalization
The proposed model is trained on the 25 epochs, time consumes training on every epoch, and achieved the accuracy given in Table 3. In these experiments, it is observed that some essential features of the model’s overall accuracy are between 99.42% and 99.68%, and training time consumed is between 220 s and 239 s.
Classification of the ECG signal is one of the most critical topics in healthcare for arrhythmia detection. Arrhythmia refers to the irregularities in the rhythm of the heartbeat which can arise at any time. A Holter monitor is used to record the long-term ECG data for the arrhythmia capture. In this paper, a Holter monitor data CNN Heartbeat Classifier was developed based on the MLII lead. This model can reach an overall accuracy of around 99.68% percent and achieve accuracy in all 25 repeated tests, showing that our model has high learning stability. The 123998 samples were taken from the MIT-BIH arrhythmia dataset. The convolutional neural network model has taken a maximum of 30 min for training. After analyzing all the results and output of this paper, the trained convolutional neural network model for arrhythmia detection can be used to solve real-world problems and in the Holter machine for heartbeat detection.
Acknowledgement: The authors appreciate the collaboration with University Malaysia Sabah in this work.
Funding Statement: This research work is fully supported by Faculty of Computing and Informatics, University Malaysia Sabah, Jalan UMS, Kota Kinabalu Sabah 88400, Malaysia.
Author Contributions: The authors confirm contribution to the paper as follows: study conception and design: M. A. Raza, M. Anwar; data collection: K. Nisar, U. A. Raza; analysis and interpretation of results: A. A. A. Ibrahim, M. A. Raza, M. Anwar; draft manuscript preparation: S. A. Khan, F. Ahmad. All authors reviewed the results and approved the final version of the manuscript. M. A. Raza and M. Anwar are co-first authors and contributed equally in this work.
Availability of Data and Materials: The data and materials used to support the findings of this study are available from the corresponding author upon request.
Conflicts of Interest: The authors declare they have no conflicts of interest to report regarding the present study.
References
1. M. Anwar, A. H. Abdullah, K. N. Qureshi and A. H. Majid, “Wireless body area networks for healthcare applications: An overview,” Telkomnika, vol. 15, no. 3, pp. 1088–1095, 2017. [Google Scholar]
2. G. Sannino and G. D. Pietro, “A deep learning approach for ECG-based heartbeat classification for arrhythmia detection,” Future Generation Computer Systems, vol. 86, no. 1, pp. 446–455, 2018. [Google Scholar]
3. U. R. Acharya, H. Fujita, O. Shu, Y. Hagiwara and J. Hong, “Automated detection of arrhythmias using different intervals of tachycardia ECG segments with convolutional neural network,” Information Sciences, vol. 405, no. 1, pp. 81–90, 2017. [Google Scholar]
4. M. Anwar, F. Masud, R. A. Butt, S. M. Idrus, M. N. Ahmad et al., “Traffic priority-aware medical data dissemination scheme for IoT based WBASN healthcare applications,” Computers, Materials & Continua, vol. 71, no. 3, pp. 4443–4456, 2022. [Google Scholar]
5. R. Saouli, M. Akil and R. Kachouri, “Fully automatic brain tumor segmentation using end-to-end incremental deep neural networks in mri images,” Computer Methods and Programs in Biomedicine, vol. 166, no. 1, pp. 39–49, 2018. [Google Scholar] [PubMed]
6. E. J. D. S. Luz, W. R. Schwartz, G. Cámara-Chávez and D. Menotti, “ECG-based heartbeat classification for arrhythmia detection: a survey,” Computer Methods and Programs in Biomedicine, vol. 127, pp. 144–164, 2016. [Google Scholar] [PubMed]
7. T. Pan, L. Zhang and S. Zhou, “Detection of ECG characteristic points using Biorthogonal Spline Wavelet,” in Proc. 3rd Int. Conf. on Biomedical Engineering and Informatics, Yantai, China, pp. 858–863, 2010. [Google Scholar]
8. N. Mangathayaru, P. Rani, V. Janaki, K. Srinivas, B. M. Bai et al., “An attention based neural architecture for arrhythmia detection and classification from ECG signals,” Computers, Materials & Continua, vol. 69, no. 2, pp. 2425–2443, 2021. [Google Scholar]
9. A. D. Jasim, “ECG signal classification based on deep learning by using convolutional neural network (CNN),” Iraqi Journal of Information and Communications Technology, vol. 3, no. 3, pp. 12–23, 2020. [Google Scholar]
10. U. R. Acharya, S. Lih, Y. Hagiwara, J. Hong and M. Adam, “A deep convolutional neural network model to classify heartbeats,” Computers in Biology and Medicine, vol. 89, no. 1, pp. 389–396, 2017. [Google Scholar] [PubMed]
11. A. Kumar, R. Komaragiri and M. Kumar, “From pacemaker to wearable: Techniques for ECG detection systems,” Journal of Medical Systems, vol. 42, no. 2, pp. 1–17, 2018. [Google Scholar]
12. F. Rundo, S. Conoci, A. Ortis and S. Battiato, “An advanced Bio-inspired photoplethysmography (PPG) and ECG pattern recognition system for medical assessment,” Sensors, vol. 18, no. 2, pp. 405, 2018. [Google Scholar] [PubMed]
13. S. M. Anwar, M. Gul, M. Majid and M. Alnowami, “Arrhythmia classification of ECG signals using hybrid features,” Computational and Mathematical Methods in Medicine, vol. 2018, pp. 1–8, 2018. [Google Scholar]
14. S. Nurmaini, R. U. Partan, W. Caesarendra, T. Dewi, M. N. Rahmatullah et al., “An automated ECG beat classification system using deep neural networks with an unsupervised feature extraction technique,” Applied Sciences, vol. 9, no. 14, pp. 2921, 2019. [Google Scholar]
15. P. Plawiak and U. R. Acharya, “Novel deep genetic ensemble of classifiers for arrhythmia detection using ECG signals,” Neural Computing and Applications, vol. 32, no. 15, pp. 11137–11161, 2020. [Google Scholar]
16. Ö. Yıldırım, P. Pławiak, R. S. Tan and U. R. Acharya, “Arrhythmia detection using deep convolutional neural network with long duration ECG signals,” Computers in Biology and Medicine, vol. 102, no. 4, pp. 411–420, 2018. [Google Scholar] [PubMed]
17. V. Patil and S. N. Patil, “Robust system for patient specific classification of ECG signal using PCA and neural network,” International Research Journal of Engineering and Technology, vol. 4, pp. 1400–1404, 2017. [Google Scholar]
18. S. N. Yu and K. T. Chou, “Integration of independent component analysis and neural networks for ECG beat classification,” Expert Systems with Applications, vol. 34, no. 4, pp. 2841–2846, 2008. [Google Scholar]
19. L. Rukhsar, W. H. Bangyal, M. S. A. Khan, A. A. A. Ibrahim K. Nisar et al., “Analyzing RNA-seq gene expression data using deep learning approaches for cancer classification,” Applied Sciences, vol. 12, no. 4, pp. 1850, 2022. [Google Scholar]
20. X. Xu and H. Liu, “ECG heartbeat classification using convolutional neural networks,” IEEE Access,vol. 8, pp. 8614–8619, 2020. [Google Scholar]
21. B. Vuksanovic and M. Alhamdi, “AR-based method for ECG classification and patient recognition,” International Journal of Biometrics and Bioinformatics, vol. 7, no. 2, pp. 74, 2013. [Google Scholar]
22. S. L. Oh, E. Y. K. Ng, R. S. Tan and U. R. Acharya, “Automated diagnosis of arrhythmia using combination of CNN and LSTM techniques with variable length heart beats,” Computers in Biology and Medicine, vol. 102, no. 4, pp. 278–287, 2018. [Google Scholar] [PubMed]
23. F. Murat, O. Yildirim, M. Talo, U. B. Baloglu, Y. Demir et al., “Application of deep learning techniques for heartbeats detection using ECG signals-analysis and review,” Computers in Biology and Medicine, vol. 120, no. 4, pp. 103726, 2020. [Google Scholar] [PubMed]
24. E. J. S. Luz, W. R. Schwartz, G. Cámara-Chávez and D. Menotti, “ECG-based heartbeat classification for arrhythmia detection: A survey,” Computer Methods and Programs in Biomedicine, vol. 127, no. 14, pp. 144–164, 2016. [Google Scholar] [PubMed]
25. G. Sannino and G. D. Pietro, “A deep learning approach for ECG-based heartbeat classification for arrhythmia detection,” Future Generation Computer Systems, vol. 86, pp. 446–455, 2018. [Google Scholar]
26. F. Ahmad, Z. Munawar, K. S. Nisar, S. A. Alanazi, M. Khalid et al., “Predicting the prevalence of lung cancer using feature transformation techniques,” Egyptian Informatics Journal, vol. 2022, pp. 1–12, 2022. [Google Scholar]
27. M. N. Meqdad, F. Abdali-Mohammadi and S. Kadry, “Meta structural learning algorithm with interpretable convolutional neural networks for arrhythmia detection of multi-session ECG,” IEEE Access, vol. 10, pp. 61410–61425, 2022. [Google Scholar]
28. M. Sraitih, Y. Jabrane and A. H. E. Hassani, “An automated system for ECG arrhythmia detection using machine learning techniques,” Journal of Clinical Medicine, vol. 10, no. 22, pp. 5450, 2021. [Google Scholar] [PubMed]
29. H. Assodiky, I. Syarif and T. Badriyah, “Arrhythmia classification using long short-term memory with adaptive learning rate,” EMITTER International Journal of Engineering Technology, vol. 6, no. 1, pp. 75–91, 2018. [Google Scholar]
30. A. Khan, A. Sohail, U. Zahoora and A. S. Qureshi, “A survey of the recent architectures of deep convolutional neural networks,” Artificial Intelligence Review, vol. 53, no. 8, pp. 5455–5516, 2020. [Google Scholar]
31. S. Celin and K. Vasanth, “Survey on the methods for detecting arrhythmias using heart rate signals,” Journal of Pharmaceutical Sciences and Research, vol. 9, no. 2, pp. 183, 2017. [Google Scholar]
Cite This Article
 Copyright © 2023 The Author(s). Published by Tech Science Press.
This work is licensed under a Creative Commons Attribution 4.0 International License , which permits unrestricted use, distribution, and reproduction in any medium, provided the original work is properly cited.
 Downloads
 Citation Tools