
 Submit a Paper
 Propose a Special lssue
 Open Access
ARTICLE

Developing Transparent IDS for VANETs Using LIME and SHAP: An Empirical Study
1 Beijing Key Laboratory of Work Safety Intelligent Monitoring, School of Electronic Engineering, Beijing University of Post and Telecommunication, Beijing, 100876, China
2 Department of Telecommunication Engineering, Mehran University of Engineering and Technology, Jamshoro, 76062, Pakistan
3 State Key Laboratory of Networking and Switching Technology, Beijing University of Post and Telecommunication, Beijing, 100876, China
4 School of Electronic Science, Beijing University of Post and Telecommunication, Beijing, 100876, China
* Corresponding Author: Fayaz Hassan. Email:
Computers, Materials & Continua 2023, 77(3), 3185-3208. https://doi.org/10.32604/cmc.2023.044650
Received 04 August 2023; Accepted 30 October 2023; Issue published 26 December 2023
 View Full Text
 Download PDF
Abstract
Vehicular Ad-hoc Networks (VANETs) are mobile ad-hoc networks that use vehicles as nodes to create a wireless network. Whereas VANETs offer many advantages over traditional transportation networks, ensuring security in VANETs remains a significant challenge due to the potential for malicious attacks. This study addresses the critical issue of security in VANETs by introducing an intelligent Intrusion Detection System (IDS) that merges Machine Learning (ML)–based attack detection with Explainable AI (XAI) explanations. This study ML pipeline involves utilizing correlation-based feature selection followed by a Random Forest (RF) classifier that achieves a classification accuracy of 100% for the binary classification task of identifying normal and malicious traffic. An innovative aspect of this study is the incorporation of XAI methodologies, specifically the Local Interpretable Model-agnostic Explanations (LIME) and SHapley Additive exPlanations (SHAP). In addition, this research also considered key features identified by mutual information-based feature selection for the task at hand. The major findings from this study reveal that the XAI-based intrusion detection methods offer distinct insights into feature importance. Key features identified by mutual information, LIME, and SHAP predominantly relate to Transmission Control Protocol (TCP), Hypertext Transfer Protocol (HTTP), Domain Name System (DNS), and Message Queuing Telemetry Transport (MQTT) protocols, highlighting their significance in distinguishing normal and malicious network activity. This XAI approach equips cybersecurity experts with a robust means of identifying and understanding VANET malicious activities, forming a foundation for more effective security countermeasures.Keywords
Vehicular Ad-hoc Network (VANET) is a type of intelligent transport system that allows vehicles to communicate wirelessly with each other. VANETs have many applications, including improving traffic safety and providing real-time traffic information. For example, VANETs can detect and warn drivers of potential hazards, such as accidents or roadblocks. VANETs can also offer entertainment services such as streaming music and videos. Fig. 1 depicts the communication architecture.
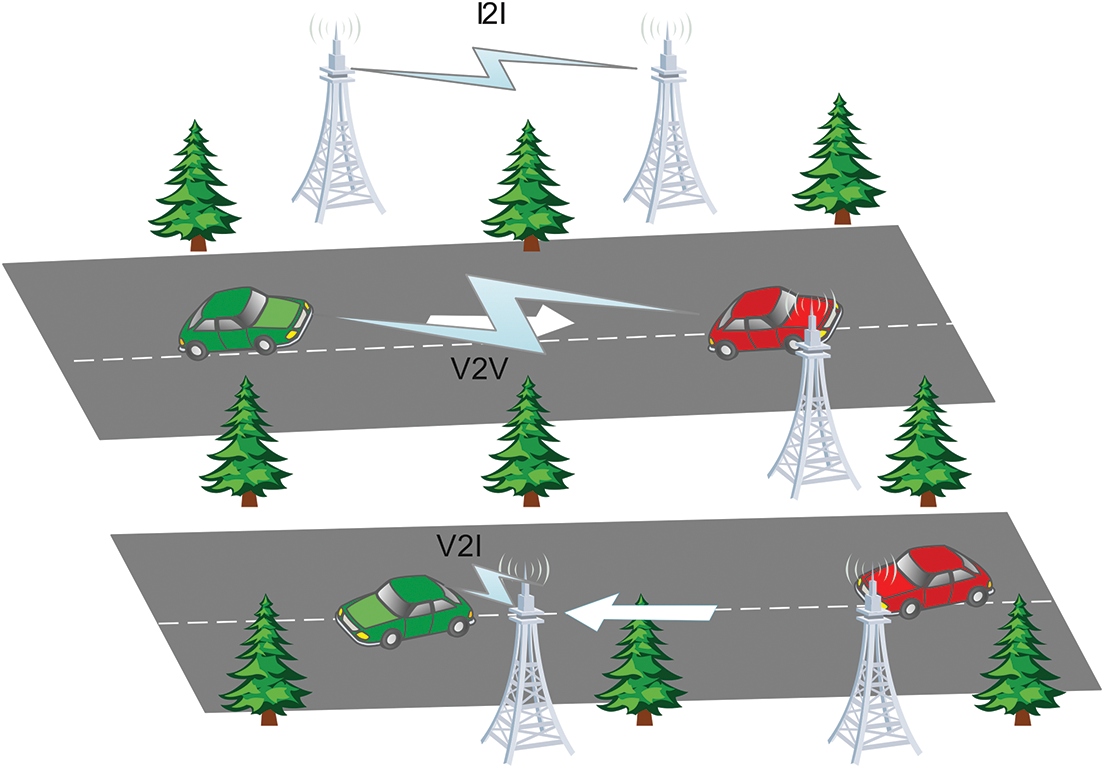
Figure 1: VANETs communication architecture
VANETs are vulnerable to malicious attacks, such as spoofing, content poisoning [1], and jamming, that can compromise user privacy and network availability. Therefore, VANETs must be designed to protect user privacy as they collect and transmit sensitive data. Intrusion Detection Systems (IDS) can be used to detect and prevent such attacks in VANETs [2]. However, IDS faces several challenges in this context, including the high mobility of vehicles, which can cause significant changes in network topology. Machine Learning (ML) based IDS, which can learn from previous network traffic patterns and adapt to changing network conditions, can help to overcome these challenges.
This paper focuses on developing an ML-based IDS for VANETs. The proposed method uses Local Interpretable Model-agnostic Explanation (LIME) and SHapley Additive exPlanations (SHAP) toolkits to provide interpretability to the model, which can help cyber security experts understand the factors contributing to the predictions from the IDS. Random Forest (RF) classifiers are chosen for their capability to handle high-dimensional data, interpret feature importance, and robustness against overfitting. Although Deep Learning (DL) models have their merits, their complexity, resource requirements, and the need for extensive training data is a challenge in VANET environments. The proposed system can detect and prevent various attacks, including Denial of Services/Distributed Denial of Services (DoS/DDoS) attacks, which can compromise network availability. The main contributions of this study are as follows:
• This study proposes an ML-based IDS framework for identifying an attack and non-attack traffic in the VANET environment. This research evaluates the framework using various ML models and classification metrics such as accuracy, precision, recall, and F1-score.
• This study investigates the correlation between features in terms of Pearson’s correlation coefficient and leverages this measure to remove highly correlated features, thus implementing feature selection. The unnecessary features that do not contribute to information regarding intrusion are removed from the Edge Industrial Information of Things (IIoT) dataset.
• LIME and SHAP methods are used to analyze the interpretability of the IDS and justify its reliability, trustworthiness, and understandability for the Random Forest classifier.
By explaining their decisions, ML-based IDS systems can build trust between cyber security analysts and the system. Analysts can understand how the system works and why it makes certain decisions, increasing confidence in the system’s effectiveness.
This paper implemented two pioneering explainable methods, i.e., LIME and SHAP, along with a Random Forest classifier model, which enables accurate detection (100% accuracy) and provides understanding and explainability of this model. The pipeline allows cybersecurity experts to integrate advanced ML methods to secure VANETs.
The remainder of this paper is organized as follows: Section 2 introduces the background and literature on the recent development in cyber-attack detection methods. It details the implemented model’s workflow, architecture, and parameter settings. The next step introduces the dataset, the associated proposed method, and the concept of Explainable Artificial Intelligence (XAI) in Section 3. Section 4 evaluates the developed model’s performance for attack classification. This paper presented the explanations from the model using a model dashboard deployed from the task. Section 5 describes the observations of the results. Finally, Section 6 concludes the paper with ideas for future work.
This research study focuses on developing an IDS for VANETs using ML, with a particular emphasis on the adversarial resilience of IDS and the dependability of XAI. Over the past decade, numerous IDS systems have been suggested to prevent harmful attacks on VANETs. ML-based IDS has shown remarkable capability in terms of classification performance for detecting malicious attacks [2]. However, using black-box models, which provide predictions without clear explanations, can introduce ambiguity, complexity, and challenges in interpretation. Without understanding the reasoning behind the IDS predictions, incorrect assessments may leave the system susceptible to malicious attacks. It is essential for the sake of reliable IDS that ML models provide transparent and explainable decisions.
Several IDS systems have been proposed in the past decade to prevent the network from harmful attacks [3]. In a previous study, the NSL-KDD dataset and a Deep Neural Network (DNN)-based ML model were used to detect network intrusions. Five distinct XAI frameworks were deployed to illustrate the trained model’s behavior [4]. However, the framework did not use any explanation to validate the accuracy of the projected results.
In another study, several ML models were employed to classify and predict chronic kidney disease, including RF classifier, Logistic Regression (LR), K-Nearest Neighbor (KNN), XGBoost, Gaussian Naive Bayes (GNB), and Decision Tree (DT) [5]. They used KDE plots to visualize and investigate the association between various characteristics.
In [6], LIME and SHAP explainable methods were used to emphasize the feature importance for various ML models. However, these XAI methods did not explain or analyze why certain features contribute more to an ML model than others. Moreover, the statistical data provided by these methodologies can be confusing and unclear. Similarly, in [7], the authors employed Kernel Density Estimation (KDE) plots to visualize the distribution of the “class” feature to explain the AI-based IDS, with SHAP as an XAI method. The work described in [8] used a customized SHAP-based XAI model to explain AI-based intrusion detection systems. Additionally, in [9], several XAI approaches were compared for IDS, focusing on the outcomes of XAI methods. That study proposed a way to justify the results generated based on each feature’s KDE plot.
Most newly released datasets, such as those in [10–13], are network-based datasets that contain packet level and flow level information or a combination of both to detect IoT network attacks. However, they lack actual data from sensor readings. While these datasets can help detect network-based attacks against IIoT systems, they are inadequate for detecting sensor attacks that manipulate sensory data or compromise IoT devices [14–16]. To fully evaluate data-driven IoT intrusion detection solutions, there is an urgent need for datasets containing sensor reading data and various types of attacks. In [17], Sun et al. proposed a deep learning-based Convolutional Neural Network-Long Short-Term Memory (CNN-LSTM) with Attention Model (CLAM) for intrusion detection for identifying Controller Area Networks (CAN) attacks. The proposed model uses the bit flip rate to extract continuous signal boundaries in the 64-bit CAN data to achieve an F1-score of 95.10%. However, the proposed method is complex and less accurate as compared to the proposed work.
On the other hand, Liu et al. [18] proposed a Privacy-Preserving Trust Management (PPTM) scheme for Emergency Message Dissemination in Space-Air-Ground-Integrated Vehicular Networks (SAGIVNs). Their method simultaneously achieves precise trust management and strong conditional privacy preservation with low communication overhead. The scheme also provides strong applicability, robustness, and other attractive features. The exhaustive theoretical analysis and simulation evaluation show that the proposed scheme is significantly superior to existing techniques in several aspects. However, the current method is based on static pre-configured reputation scores, where nodes are deemed reputed once they achieve a threshold value. Due to the dynamic reputation change in a network, the proposed method lacks granularity, which may result in unfairness.
Moreover, Guo et al. [19] proposed a context-awareness trust management model to evaluate the trustworthiness of messages received by vehicles, which allows them to adjust the evaluation strategy in different driving scenarios. The model is based on reinforcement learning and considers available related information to determine the trust evaluation result of an evaluation request. The main limitation of the proposed model includes the need for a large amount of data to train the reinforcement learning model. However, regardless of the proportion of malicious nodes, adaptive schemes to different driving schemes with negligible time overhead. Authors in [20] proposed a trust-based system using federated learning in mobile networks. This work evaluates the trust of a node using different parameters. This study combines a user’s local (direct) trust value with their recommended (indirect) trust value to determine their ultimate trust level. The proposed research estimates the trust level of users in a federated learning system in a fine-grained manner. The model, however, ignores the model’s complexity and only presents an idealized scenario, skipping over the difficulties and complexities of real-world deployment. Table 1 presents a concise overview of the literature review with limitations.
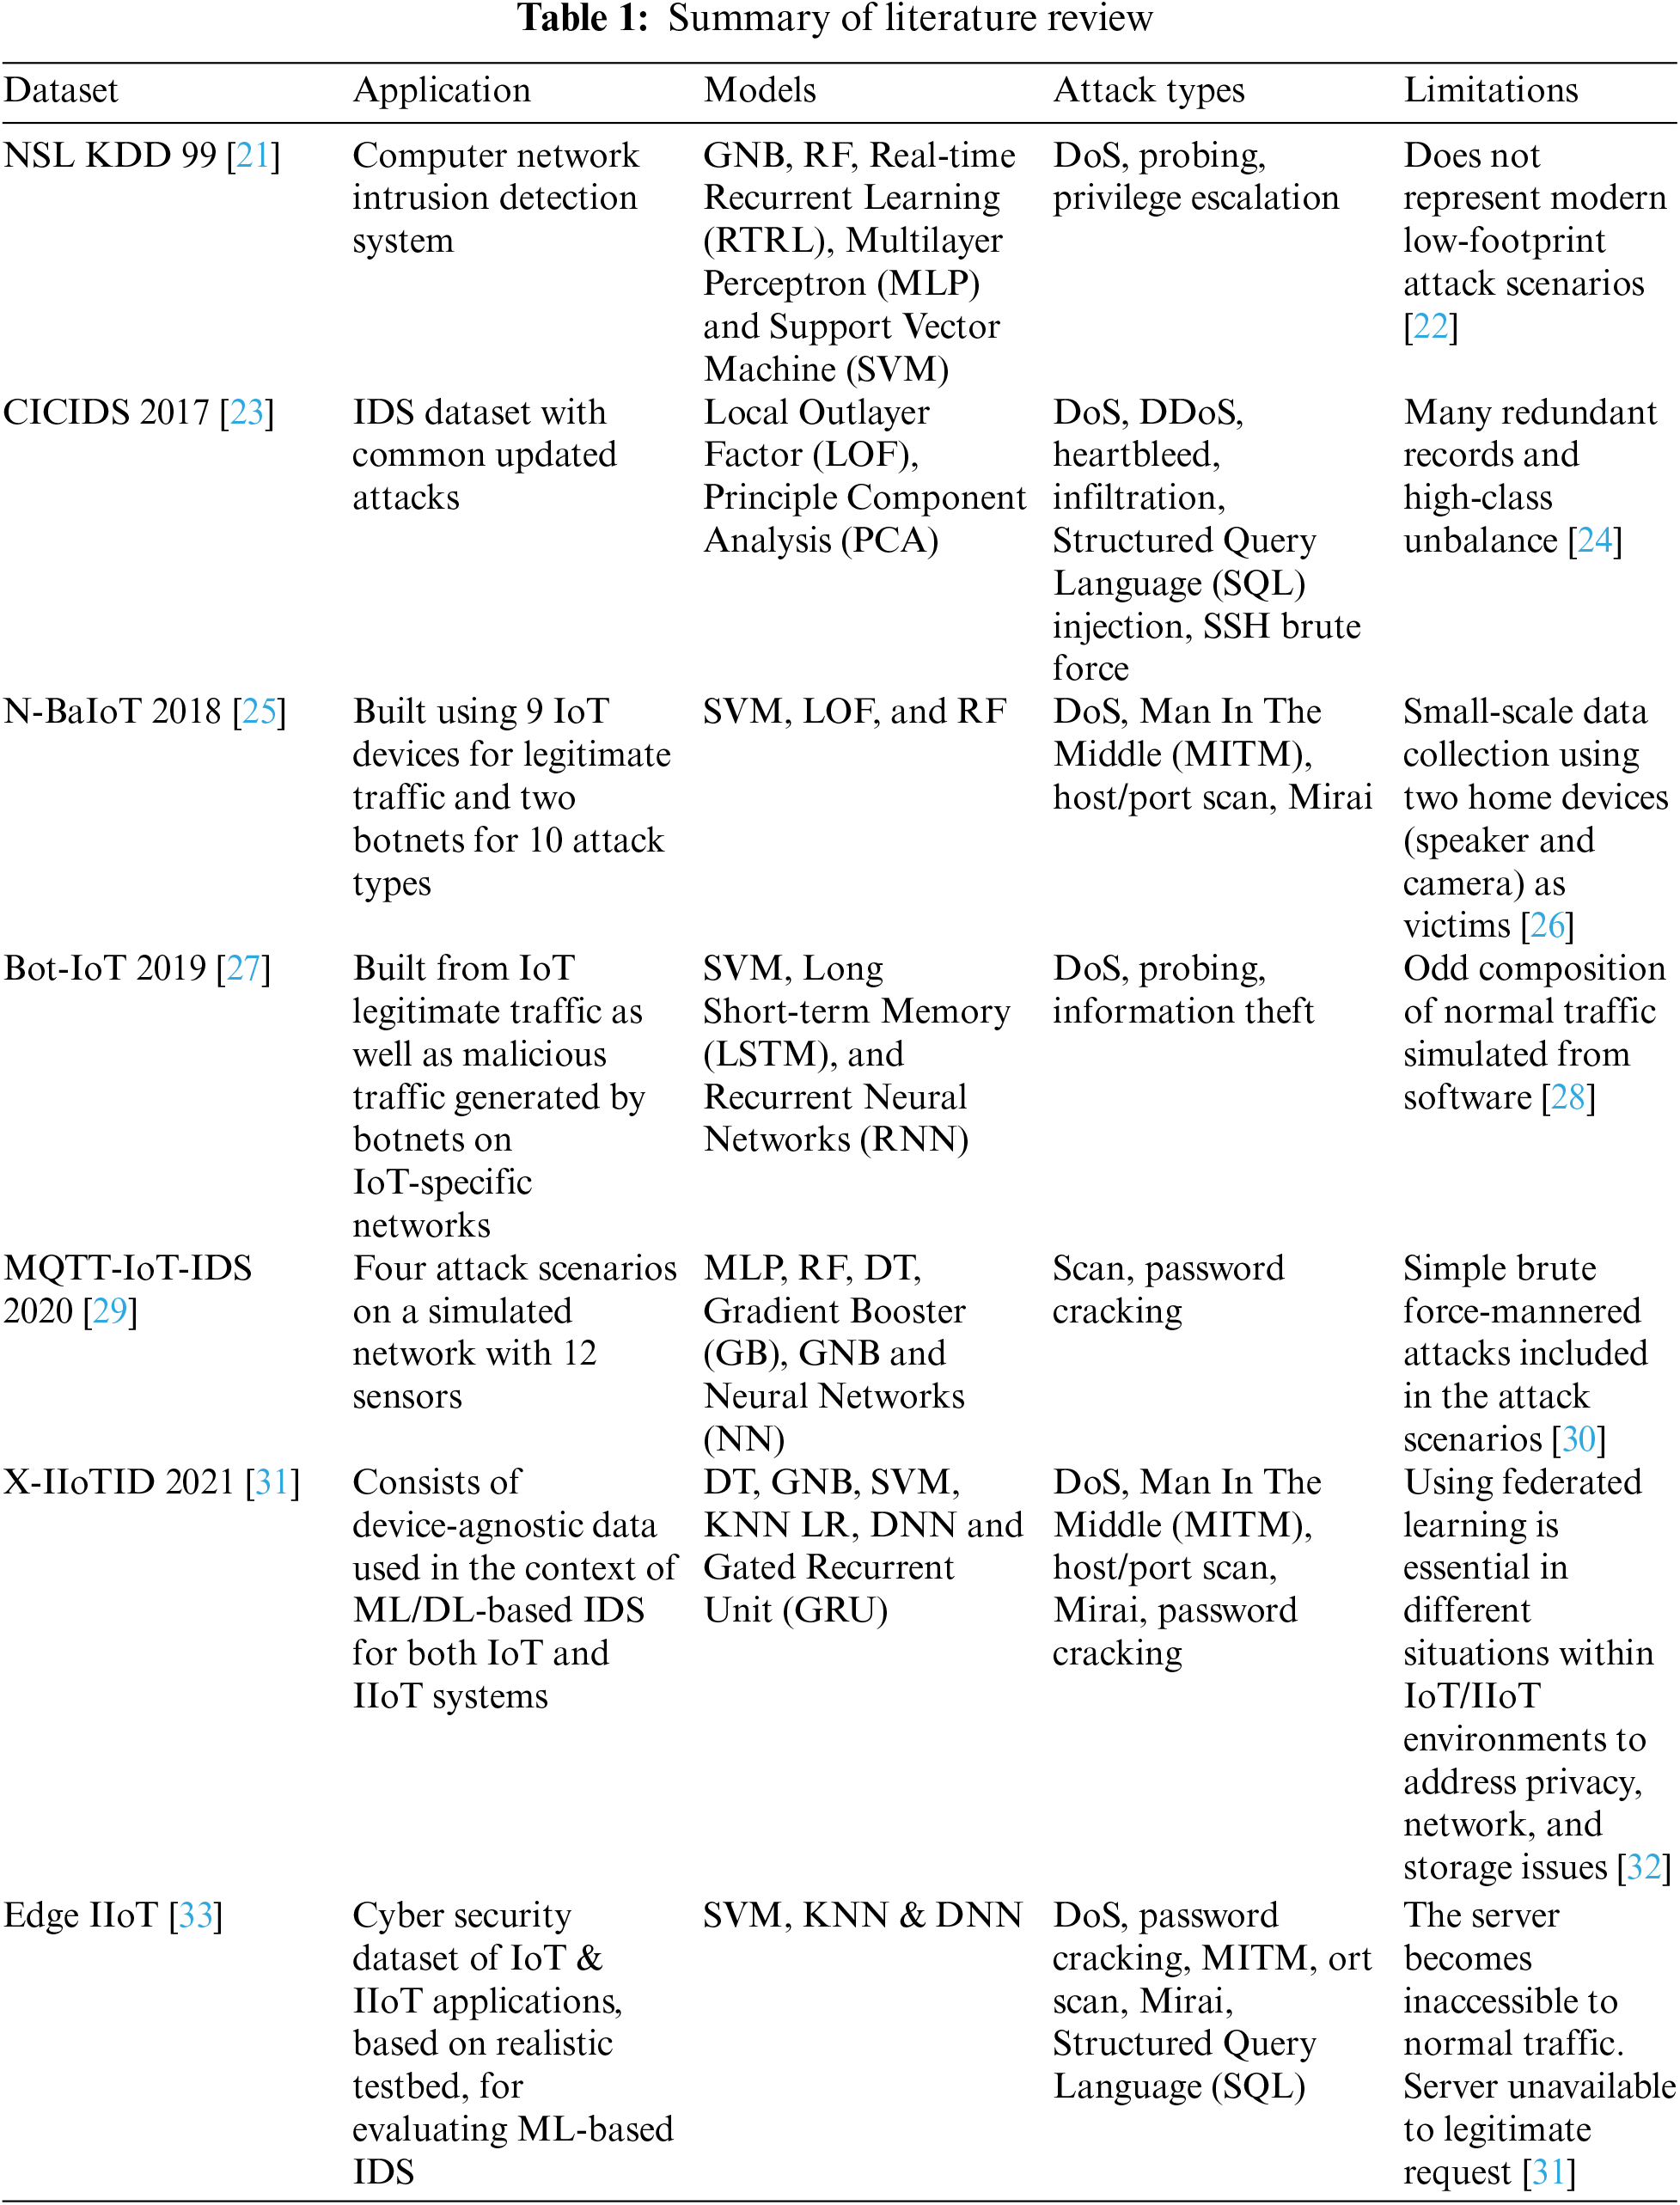
Table 1 illustrates that these models are not created with several Internet of Vehicles (IoV) and other attacks. Most of the datasets were old and unable to detect several cyber-attacks. In addition, the related works specifically focused on improving classification performance rather than interpretability and explainability to improve the confidence of user decisions and did not use the feature selection method. Further, there is less accuracy obtained as compared to the proposed work. Moreover, certain authors have experimented with DNN to enhance IDS performance, even though these models demand substantial computational resources and time.
To the knowledge, different from traditional related work as mentioned above, the proposed research uses the explainability technique in the VANET environment, which can build trust between analysts and the system. It enhances the system’s applicability and robustness. This research has presented the IDS model based on the explainability technique LIME and SHAP with improved accuracy.
VANETs are the wireless network that facilitates communication between vehicles and between vehicles and roadside units. Due to their unique characteristics, VANETs require specific security measures to mitigate various attacks that can significantly impact their performance, such as DoS attacks [34] that introduce unlawful traffic to halt legitimate traffic and the need to ensure information is delivered to drivers without any modification. Real-time detection and secure transmission of emergency messages are crucial to prevent such attacks. Attacks can take the form of malicious code that exploits vulnerabilities in the network.
DoS Attack: Denial-of-service attack exhausts the network system resources, such as bandwidth and memory, which leads to a slowdown in information propagation. Due to their heterogeneity, DoS attacks are a significant threat to VANETs. Here, the exchange of information is rapid, but DoS attacks can cause delays due to network congestion. Therefore, it is essential to protect the network against such attacks. An IDS that leverages ML can detect DoS attacks in VANET. Leveraging the proposed network intrusion detection system that uses explanations generated by the LIME, SHAP, and RF classifier to detect malicious network traffic intrusion and enhance model interpretability. One can categorize the attacks by describing their types in Fig. 2.
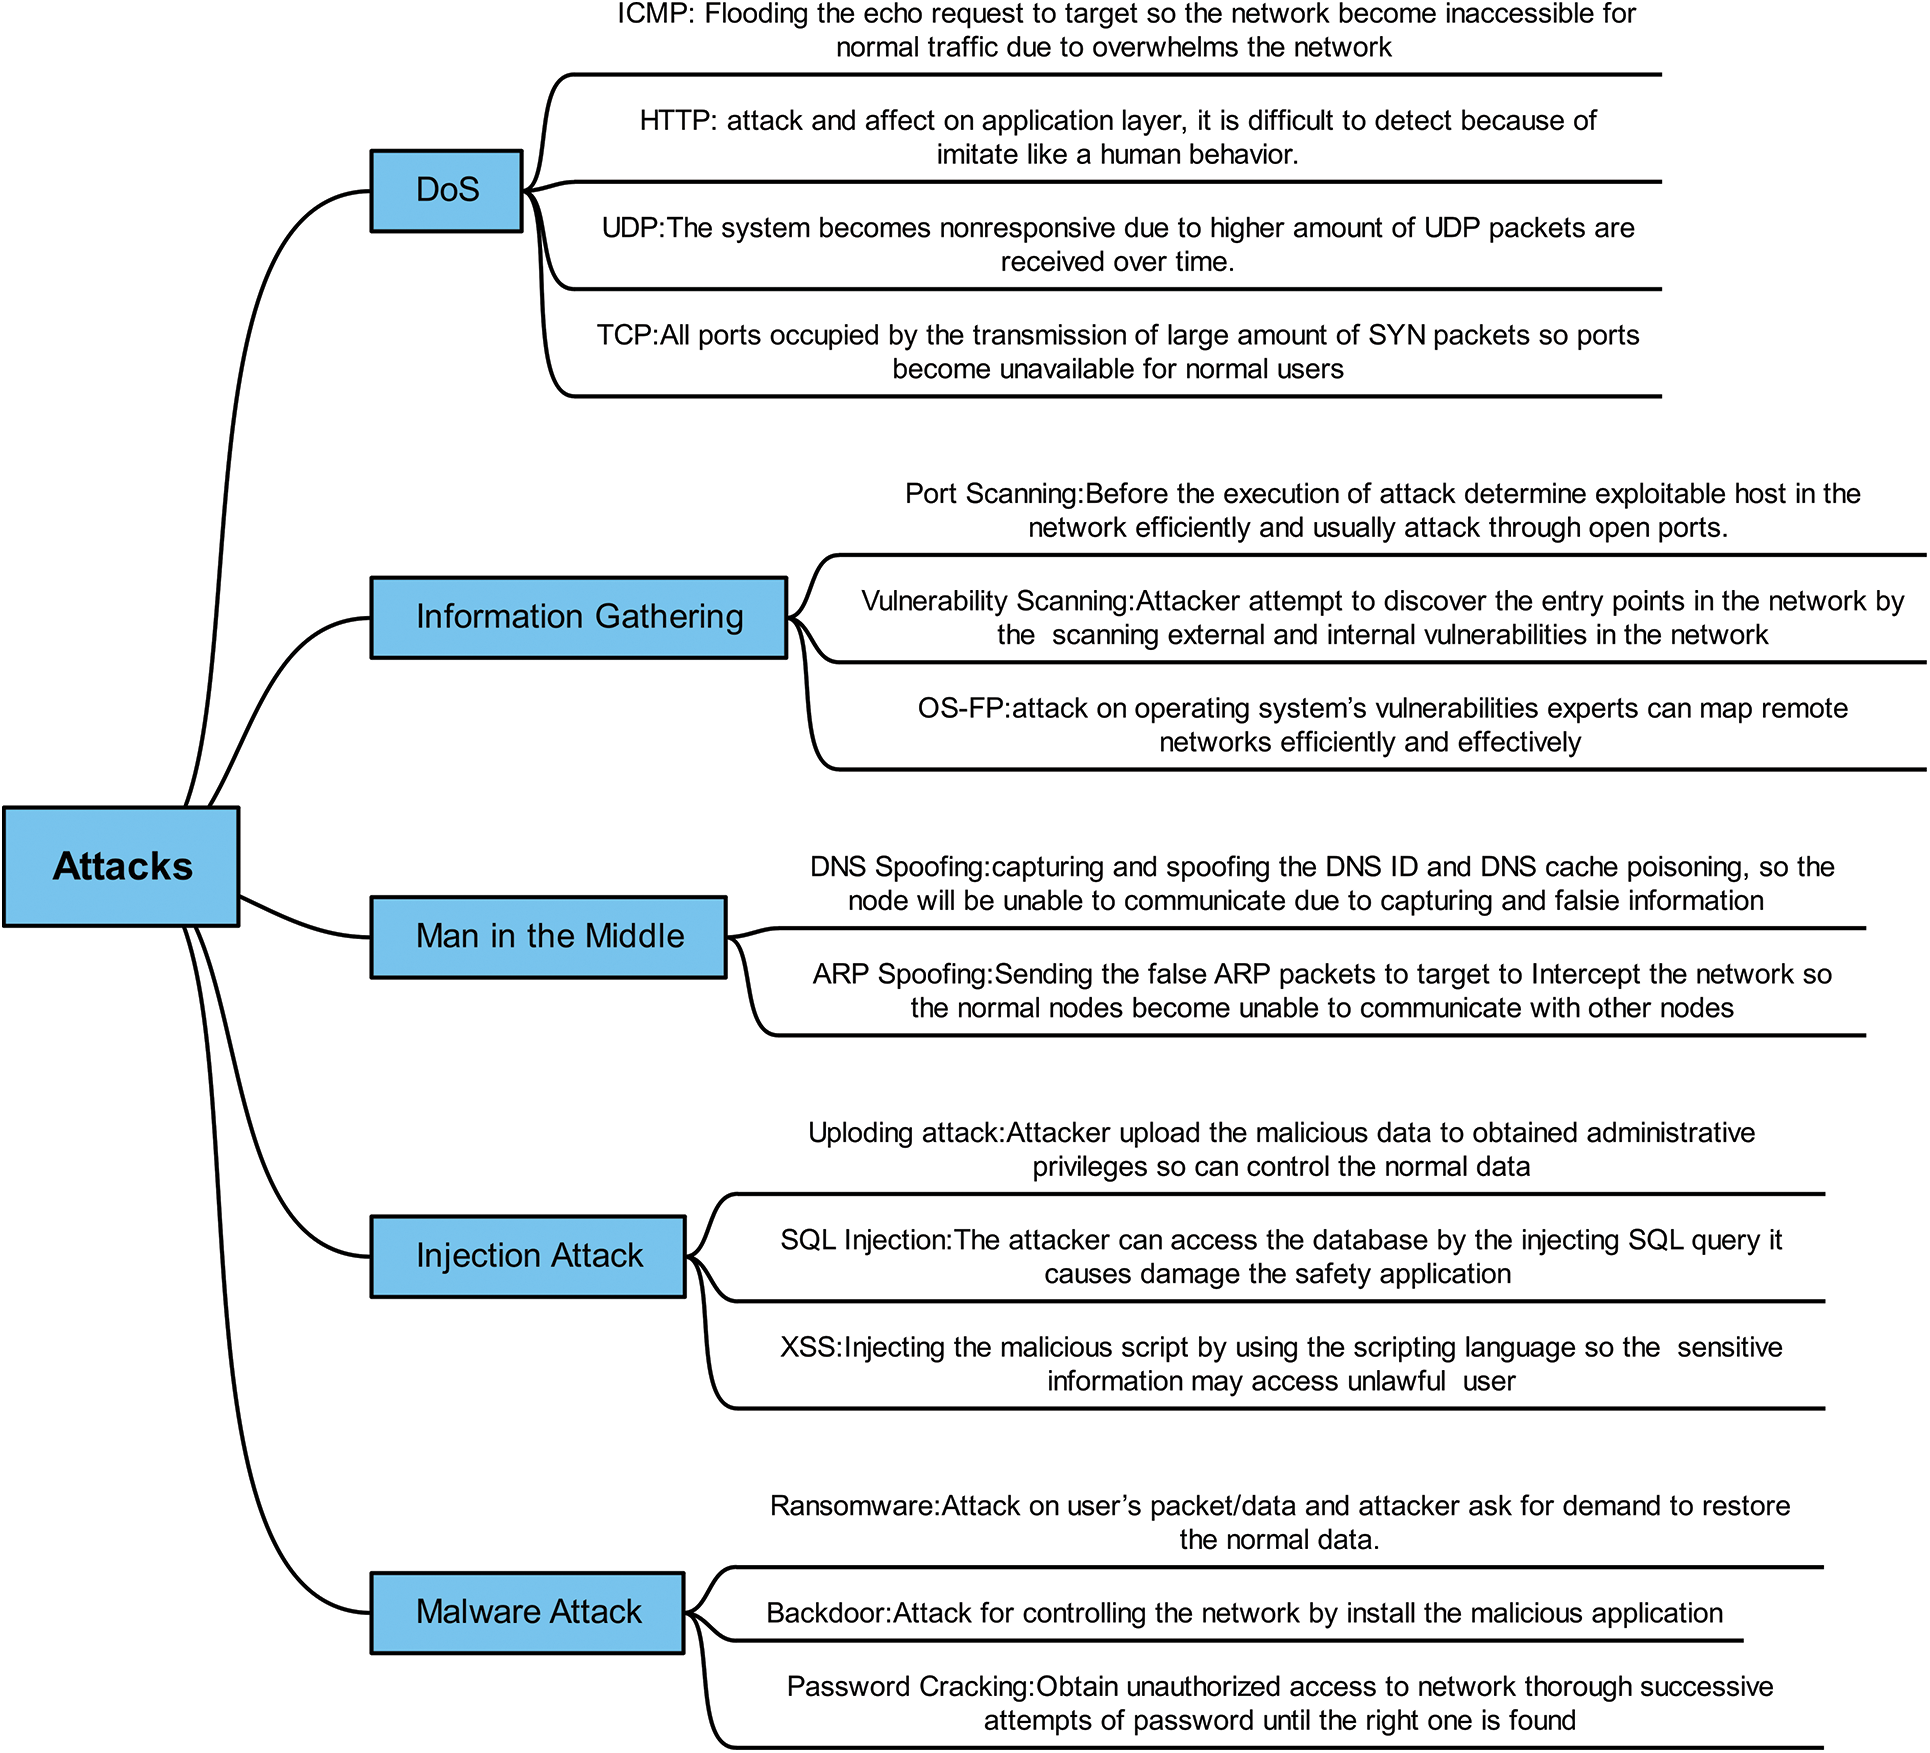
Figure 2: Taxonomy of cyber-attacks in Edge-IIoT dataset
Information-gathering Attack: The initial step attackers take is to gather information about the target system. This process, known as an information-gathering attack, involves obtaining details about open ports and services on the targeted nodes. The types of attacks in this category include port scanning, vulnerability scanning, and operating system fingerprinting (OS-FP).
MITM: In this attack, the attacker intercepts the communication channel between two nodes and can modify the transmitted data. Two common types of MITM attacks are Domain Name System (DNS) and Address Resolution Protocol (ARP) attacks.
Injection Attack: In IoT applications, injection attacks involve the injection of malicious data or attempts to execute such data. Attackers can modify normal data and manipulate telemetry data after obtaining control commands in the network system. SQL and Cross-Site Scripting (XSS) are two common types of injection attacks.
Malware Attack: These attacks involve the attacker gaining access to the control system and stealing or modifying data. This category includes ransom attacks, backdoor attacks, and password-cracking attacks.
3.2 Intrusion Detection System
The IDS has gained increased attention due to its efficiency in detecting DoS attacks. In VANETs, the IDS is critical in detecting and monitoring network traffic, as malicious nodes can flood the network with a large volume of information. The IDS can be integrated into the VANET system to monitor suspicious activity between vehicle-to-vehicle (V2V), vehicle-to-infrastructure (V2I), and infrastructure-to-infrastructure (I2I) communications. The intrusion detection approach can ensure reliable network security and protect against unauthorized access to the network, which can disrupt the functionality of the network. In the past, IDS methods have not been applied in practical deployments due to the lack of explanation provided to cybersecurity experts to aid them in optimizing their decisions by the IDS models’ assessments. In fact, alleviating this limitation served as the motivation for current work.
Therefore, this study proposes an ML-based IDS system that can explain why it makes certain decisions, making the detection process transparent and understandable to human analysts. This approach allows analysts to understand why a specific alert was triggered and make informed decisions about how to respond to the attack. By providing interpretable models, this approach enhances the trust and reliability of the IDS, which is crucial in the context of VANETs. The IDS is one of the potential applications for ML in VANETs. IDS can be organized as signature-based, anomaly-based, and rule-based, as shown in Fig. 3.
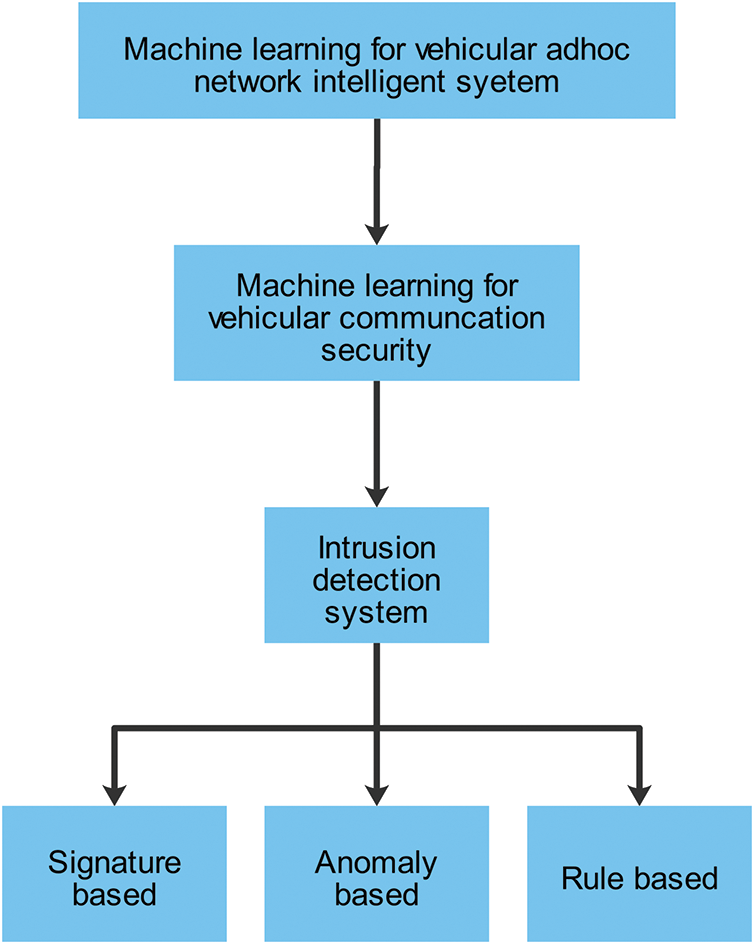
Figure 3: Context of IDS for vehicular network security
Signature-based: This method is suitable for detecting known attacks but is ineffective for detecting new attacks that are not pre-defined. Also known as misuse detection, signature-based detection involves comparing observed data with attack patterns learned from training data to detect attacks.
Anomaly-based: This method effectively detects new attacks, but obtaining a complete description of normal behavior can be difficult, leading to false alarms. In anomaly-based detection, attacks are identified by comparing observed data with normal patterns learned from training data.
Rule-based: This method defines rules or criteria that network traffic must meet to be considered normal. Any traffic not meeting these criteria is flagged as suspicious and alerted to the network administrator. Rule-based detection can be effective in detecting known attacks and can be customized to meet the specific security needs of the network.
The process flow diagram for the proposed approach is defined in Fig. 4. A dataset, Edge-IIoT, is used for training and evaluation of the IDS. Data preprocessing is used to clean, scale, and encode various features in the dataset to a standard format acceptable by the RF classifier. The RF classifier, an ensemble ML algorithm, differentiates between normal and attack traffic classes. Model explanation techniques are employed to interpret the RF classifier’s decisions and identify important features so the explanations and predictions to users clearly and understandably, ensuring effective communication of insights for informed decision-making. Each element of the proposed framework is discussed in the following subsections to understand the solution comprehensively.
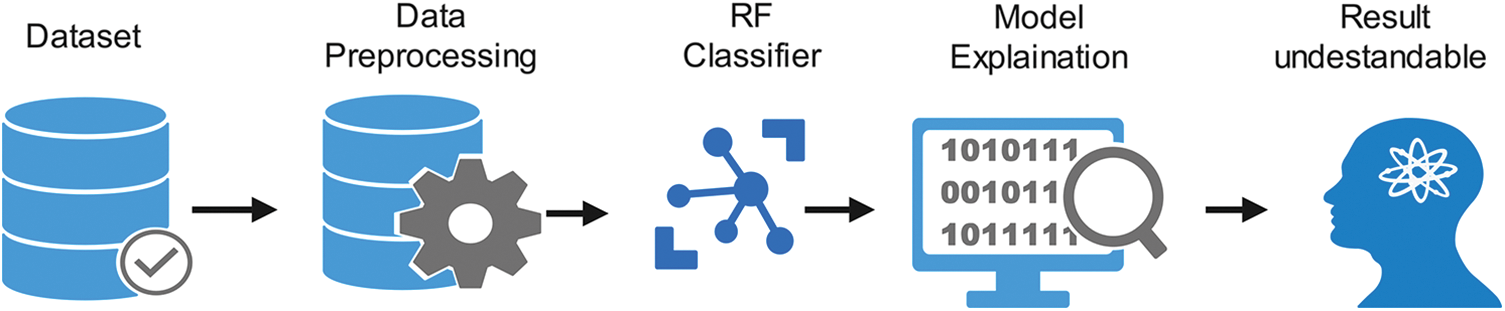
Figure 4: Comprehensive framework for RF classification with model explanation and interpretation
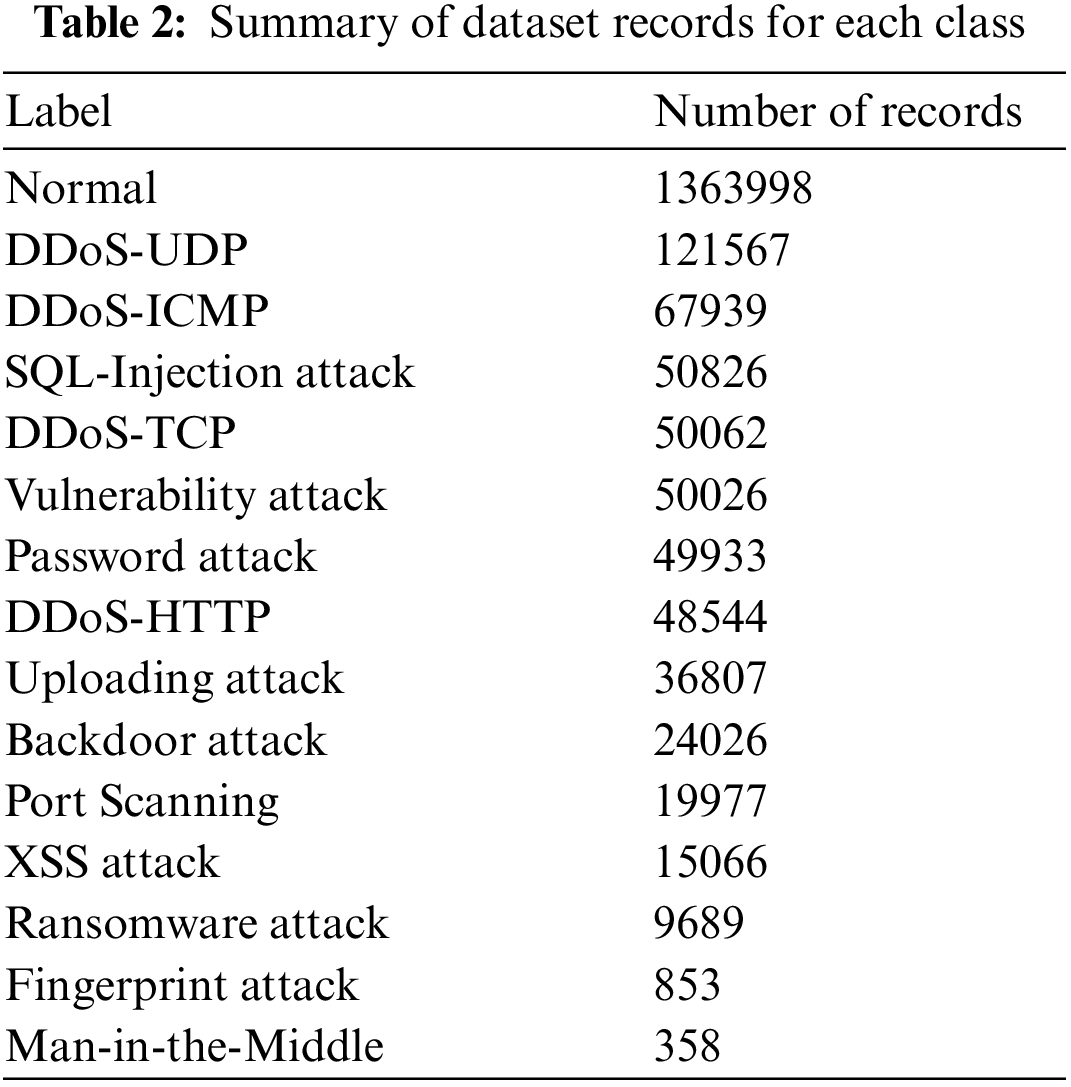
The Edge-IIoT dataset can be accessed from the IEEE data port [35]. The dataset contains 20,952,648 records, including normal records and attacks of 11,223,940 and 9,728,708, respectively. The fourteen attacks have different number of records, i.e., DDoS-ICMP~(2914354), DDoS-Hypertext Transfer Protocol (HTTP)~(229022), DDoS-UDP~(3201626), DDoS-Transmission Control Protocol (TCP)~(2020120), Port Scanning attack~(1053385), vulnerability scanner attack~(145869), fingerprint attack~(1001), MITM~(1229), uploading attack~(37634), SQL-Injection attack~(51203), XSS attack~(15915), ransomware~attack~(10925), backdoor attack~(24862), and password attack~(1053385). Further, the label distribution of the dataset is described in Table 2. This study formalizes a binary classification problem such that there is a normal “non-attack” class and an “attack” class that consists of a uniform sample of records from each of the 14 attacks. While it is acknowledged that the Edge-IIoT dataset was initially designed for IIoT environments rather than VANETs, there are shared similarities and common aspects that make it relevant to this research. For example, both VANETs and IIoT environments share characteristics such as the requirement for secure communication, the presence of wireless networks, and the potential for malicious attacks. Therefore, the rationale for utilizing the Edge-IIoT dataset in this research is that it serves as the starting point and proof of concept for assessing the efficacy of the proposed IDS in a real-world context.
As reflected in Fig. 5, the data preprocessing includes various steps such as data cleaning, data preparation, and feature selection.
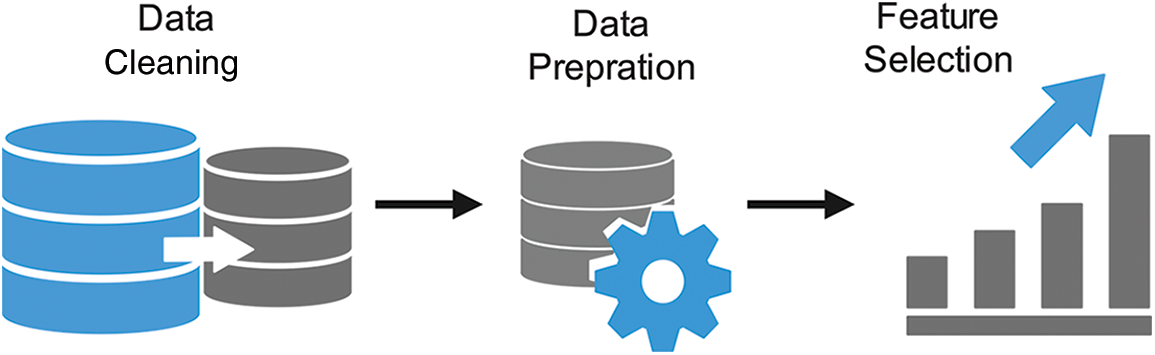
Figure 5: Data processing for model training
Dataset Cleaning is essential to any ML-based Artificial Intelligence (AI) system. The preprocessing steps are summarized as follows:
1. The rows with duplication and missing data are dropped.
2. The next step is to featurization of categorical variables. The one-hot encoding is used for features such as: http.request.method, http.referer, http.request.version, dns.qry.name.len, mqtt.conack.flags, mqtt.protoname, and mqtt.topic.
3. In this step, the same values for records (rows) of the dataset were removed.
4. Drop features such as metadata, time stamps, and port addresses are irrelevant to the classification task. Moreover, following Ferrag et al. [33], the following features were removed: frame.time, ip.src host, ip.dst_host, arp.src.proto_ipv4, arp.dst.proto_ipv4, http.file_data, http.request.full_uri, tcp.srcport, tcp.dstport, icmp.transmit_timestamp, http.request.uri.query, tcp.options, tcp.payload, tcp.srcport, tcp.dstport, udp.port, mqtt.msg, icmp.unused, http.tls_port, dns.qry.type, and mqtt.msg_decoded_as.
To create a balanced dataset for classification between normal and malicious traffic, 358 instances were selected from each category of the attack class through a random sampling process, albeit with a fixed seed. This study chose 358 as the desired instances because the MITM class only contains 358 instances in the entire dataset. By maintaining an equal number of instances from each attack class, this research ensured the stratification of the train/test data. As a result, for the 14 other malicious classes, there are a total of 14 * 358 = 5012 instances. This study also selected 5012 instances from the normal class through random sampling. It resulted in a balanced dataset with a total of 10,024 instances. The label distribution of this stratified dataset is presented in the form of a bar plot and a pie chart in Fig. 6.
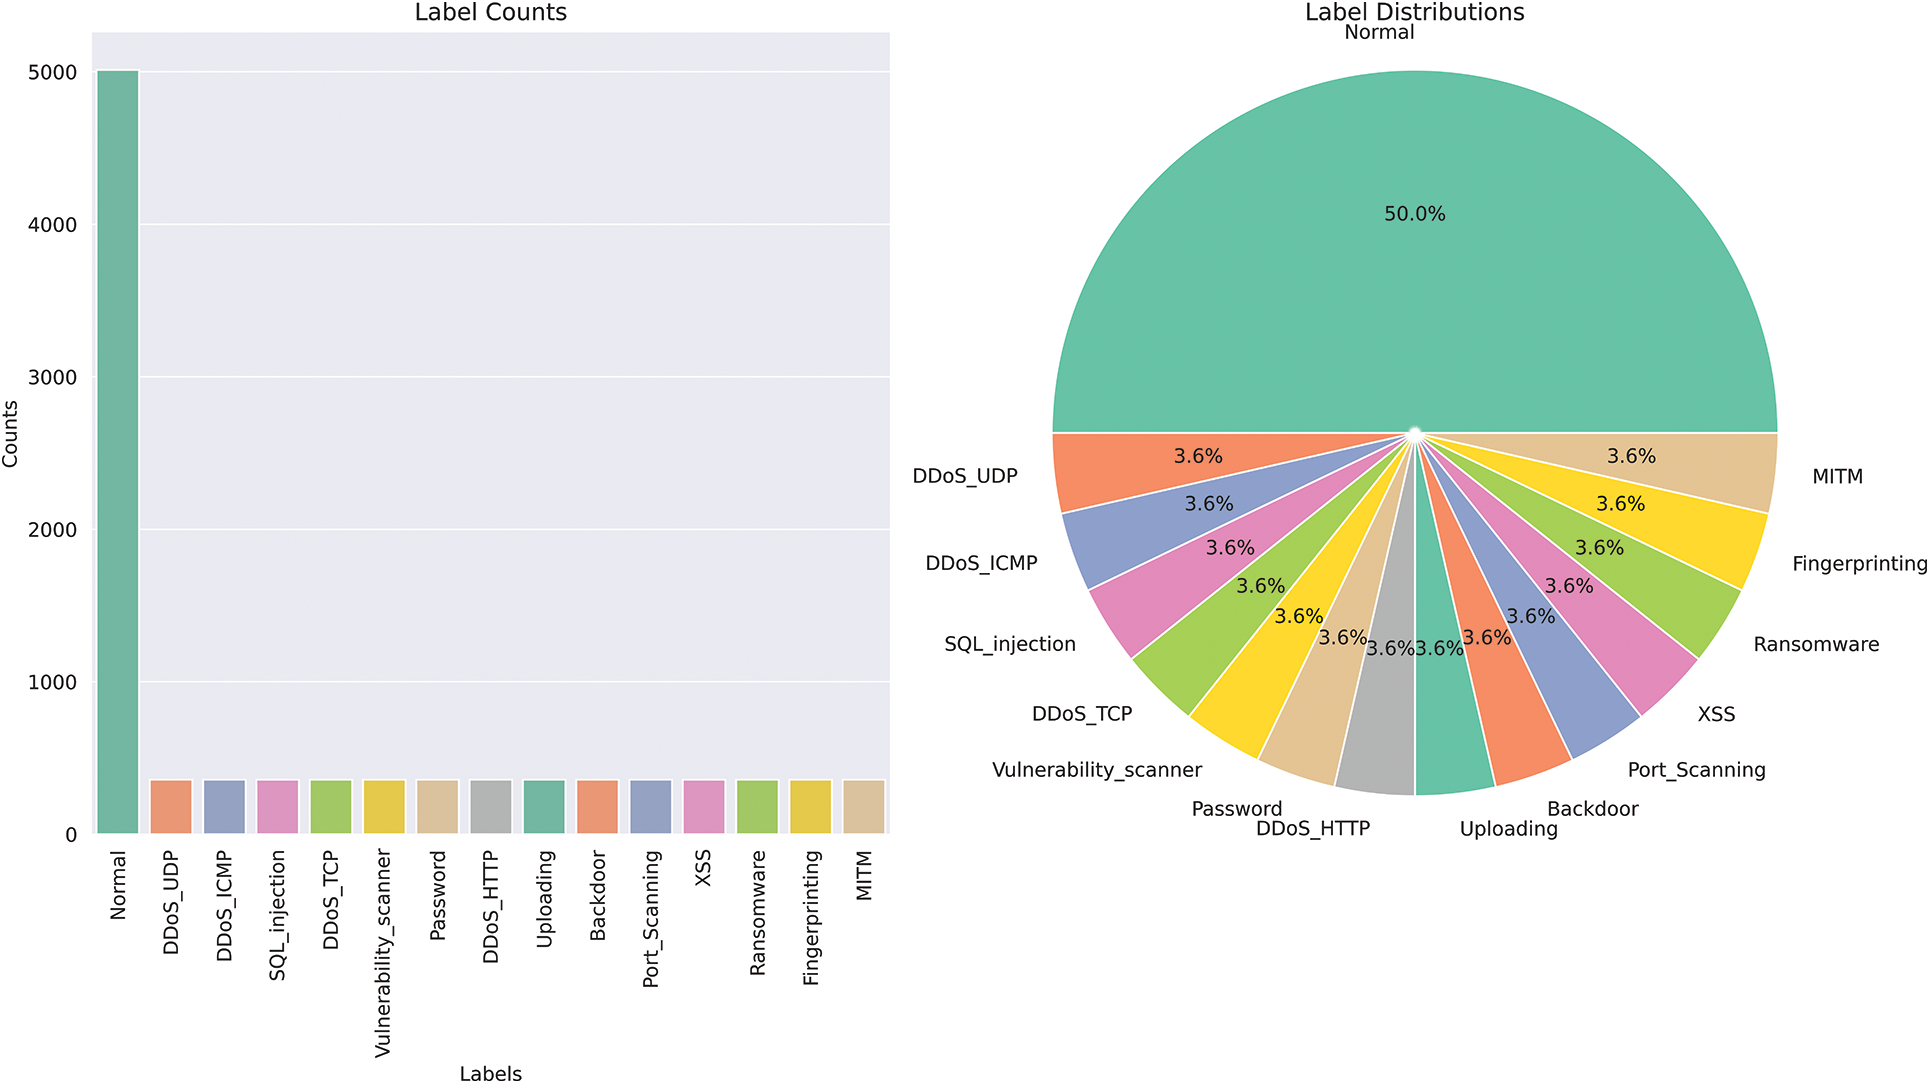
Figure 6: Overview of label distribution in a dataset using bar plot and pie chart
This study performed feature selection by removing highly correlated features. Specifically, the computation of the correlation matrix to identify features with an absolute correlation value greater than 0.9 and remove them. Fig. 7 shows the binarized correlation matrix where features with a correlation of 0.9 or more are represented by binary 1. It is observed that several features with a correlation factor of 90% or more potentially affect LIME and SHAP models’ computational complexity and interpretability. Therefore, these highly correlated features were removed from the feature matrix. The feature selection based on inter-feature correlation was performed and did not use any labels to avoid introducing bias into the system. Doing so ensures that the IDS model can detect attacks accurately and robustly.
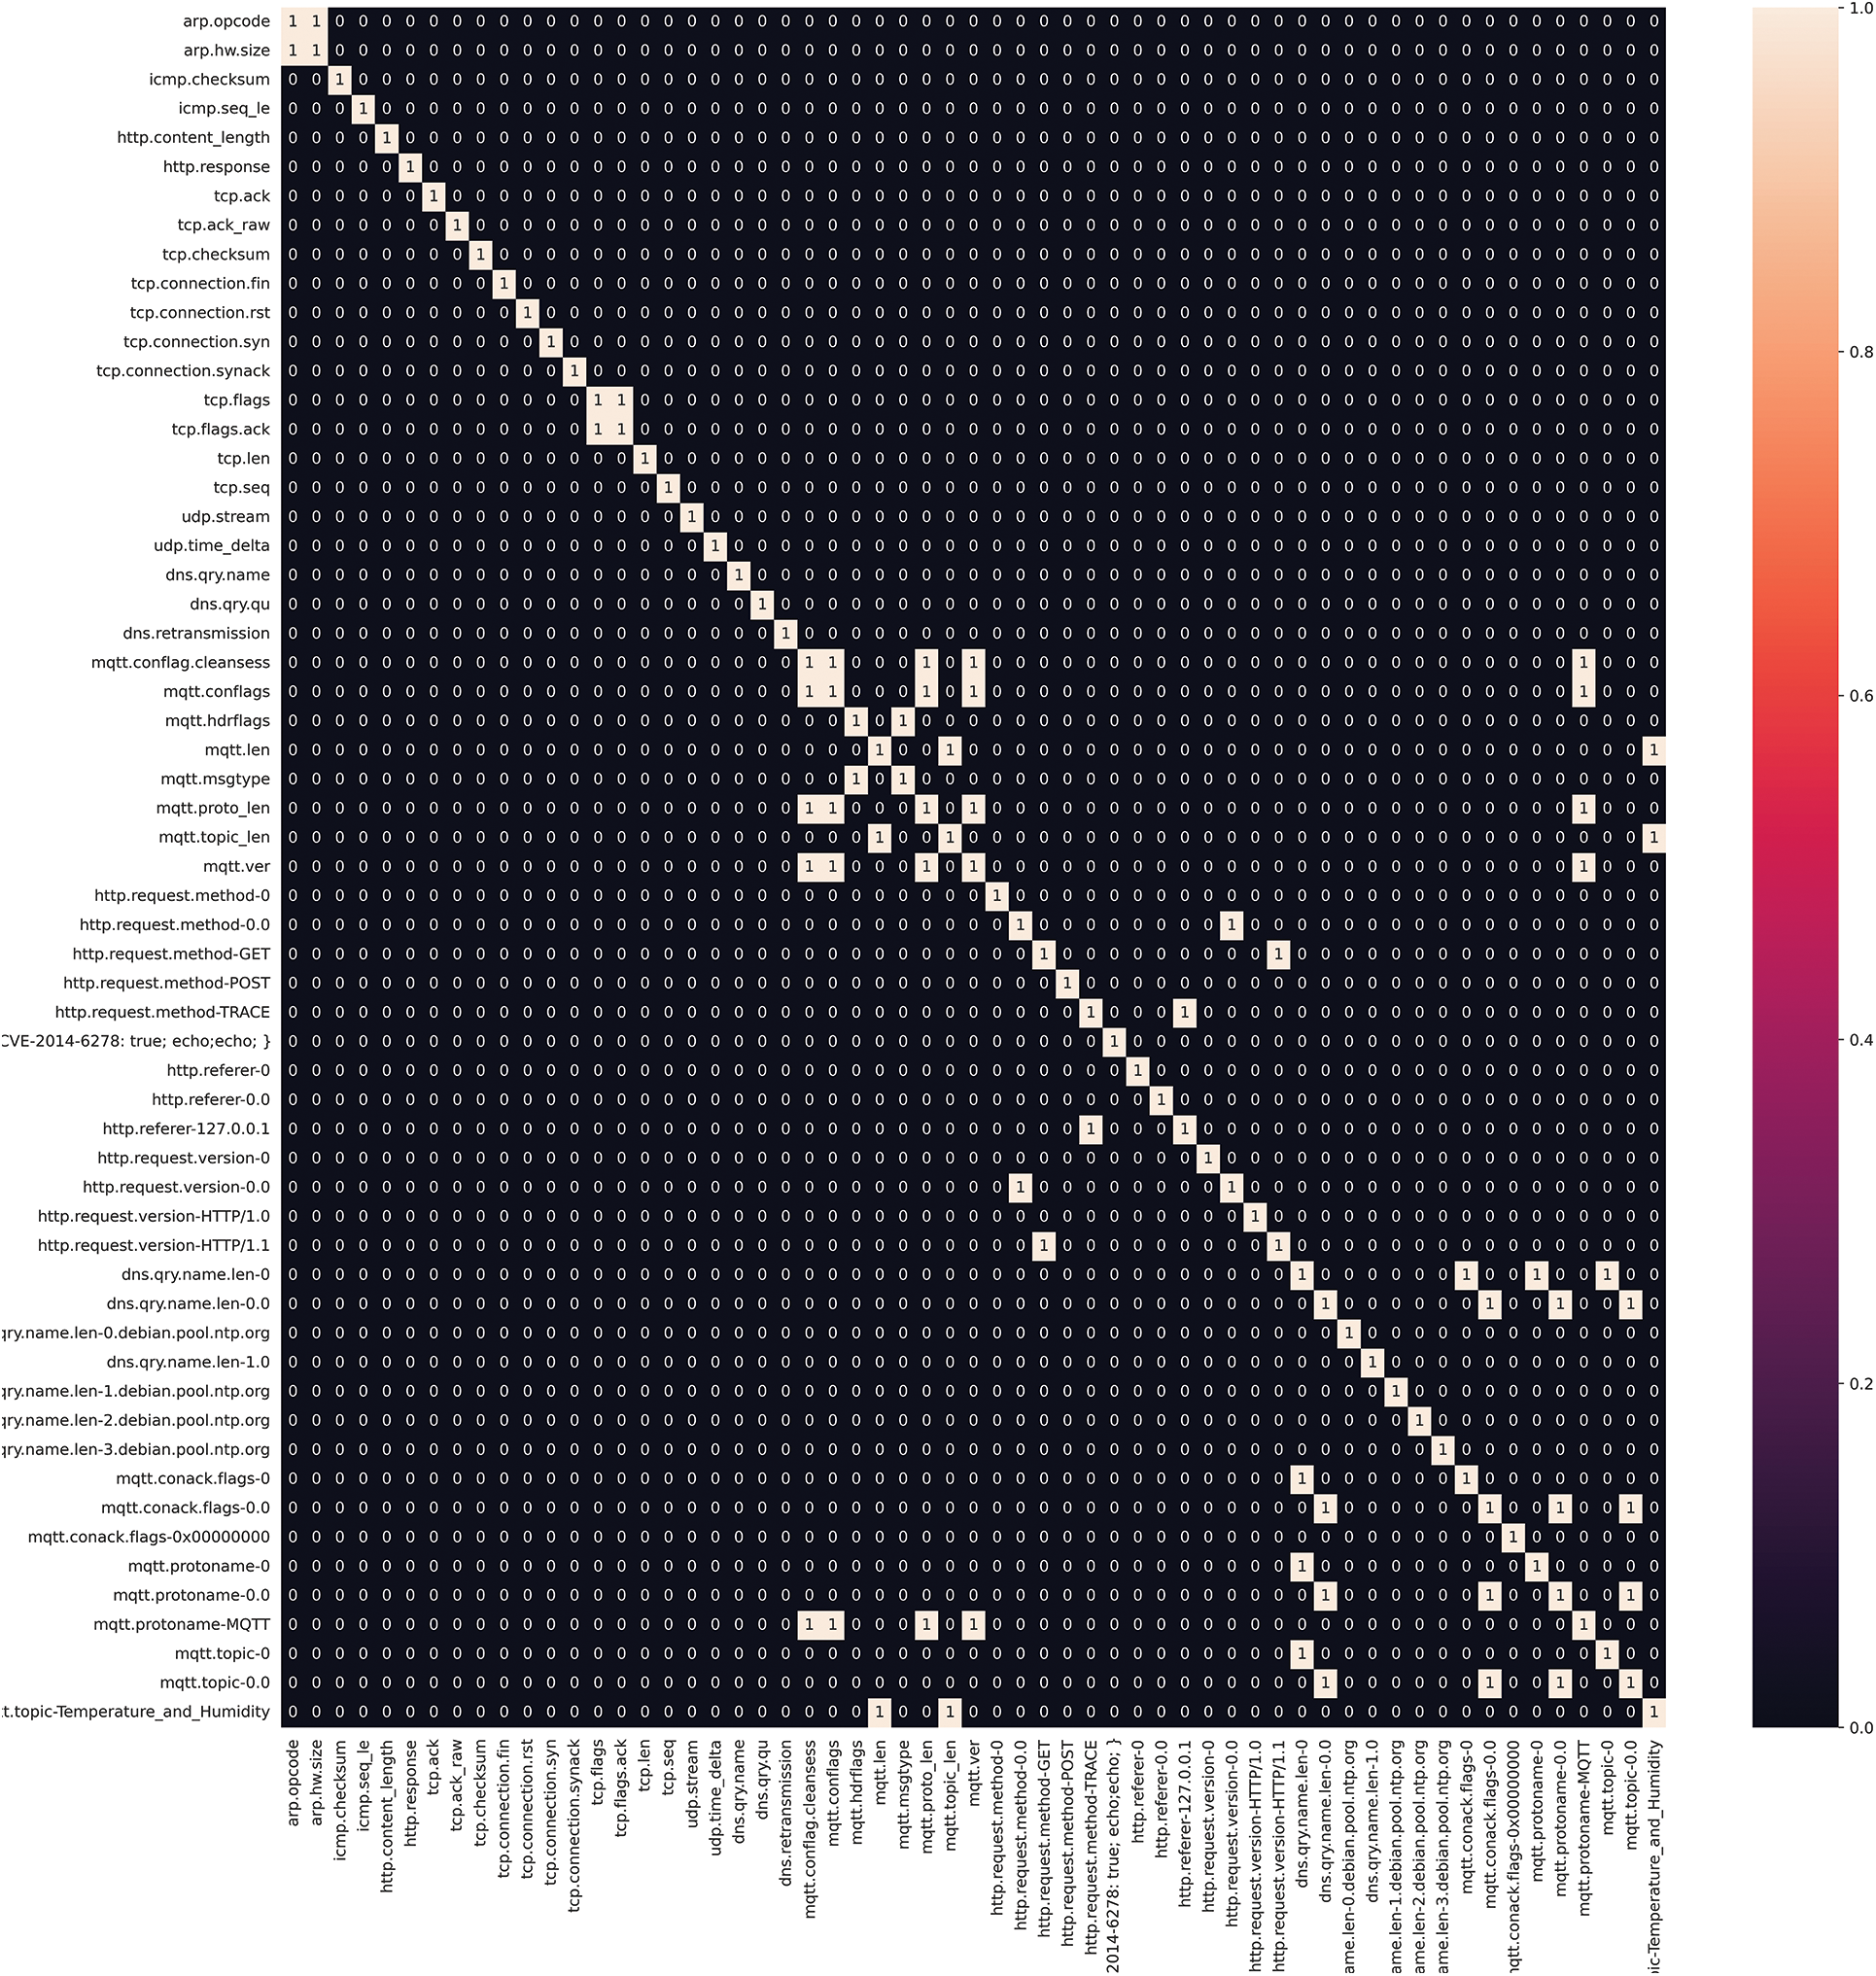
Figure 7: Correlation heatmap after feature selection
Feature Importance through Mutual Information Metric: As part of the preliminary feature importance analysis, we utilized the mutual_info_regression function from the Scikit-learn toolkit to identify features with a high mutual information value against the binary labels of normal and malicious traffic. Mutual information measures the dependence between two variables and is commonly used in feature selection to identify the relevance of a feature to the target variable. Using the regression model, the mutual_info_regression function estimates the mutual information between each feature and the target variable.
This work determined the mutual information between features and the class label for the development partition to understand which features are deemed important by this algorithm. To this end, the results of this step are illustrated in Fig. 8. It was noted that the top-5 features are dns.qry.name.len-0, tcp.ack, tcp.seq, and tcp.flags. The top feature is dns.qry.name.len-0 with mutual information score of 0.684388, indicating that it provides the most information about network intrusion detection. The feature represents the length of the domain name in the DNS query. Other important features include the TCP acknowledgment number, the TCP sequence number, and the TCP payload length. These features can help identify various types of suspicious activity, such as phishing attempts, data injection, session hijacking, data exfiltration, and malware propagation.
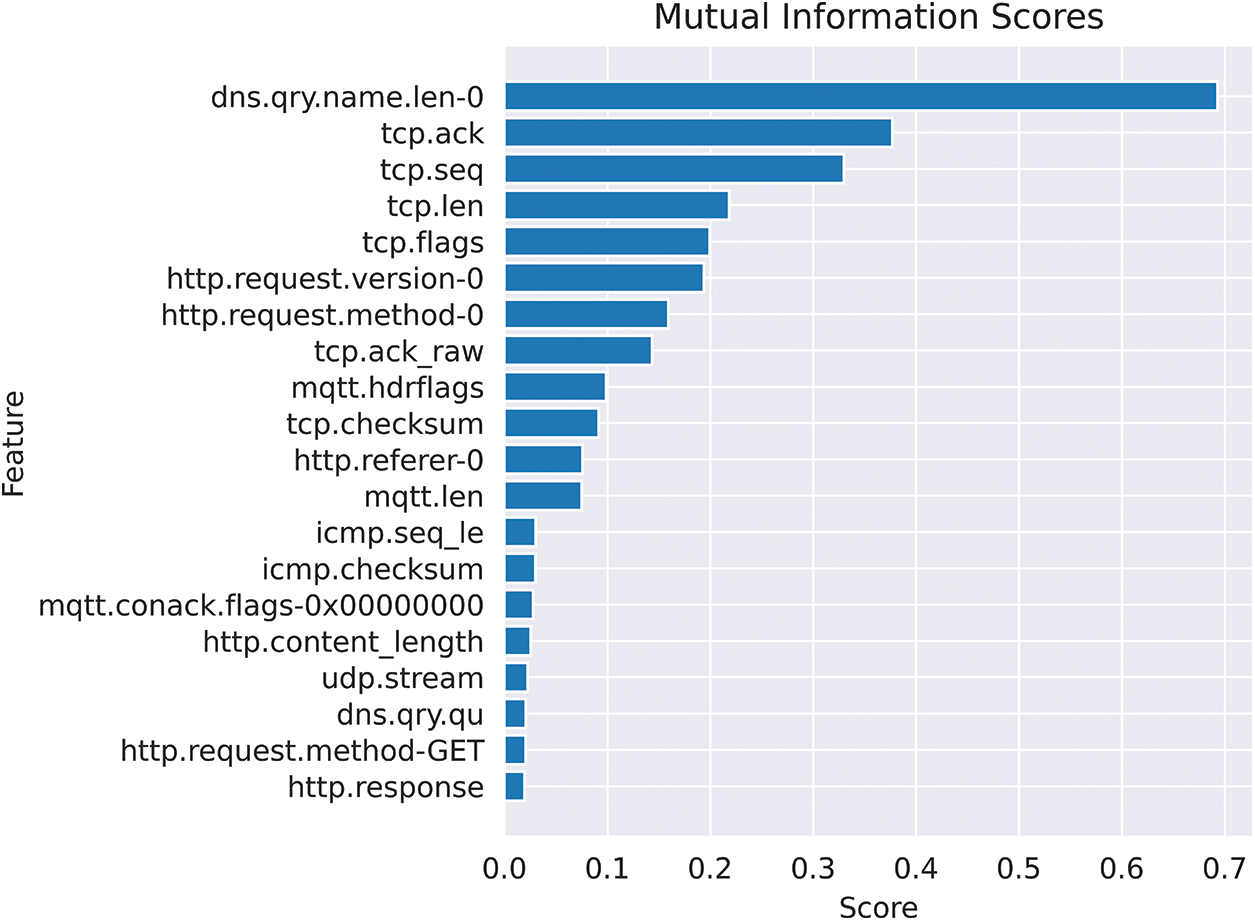
Figure 8: Mapping mutual information scores for model performance
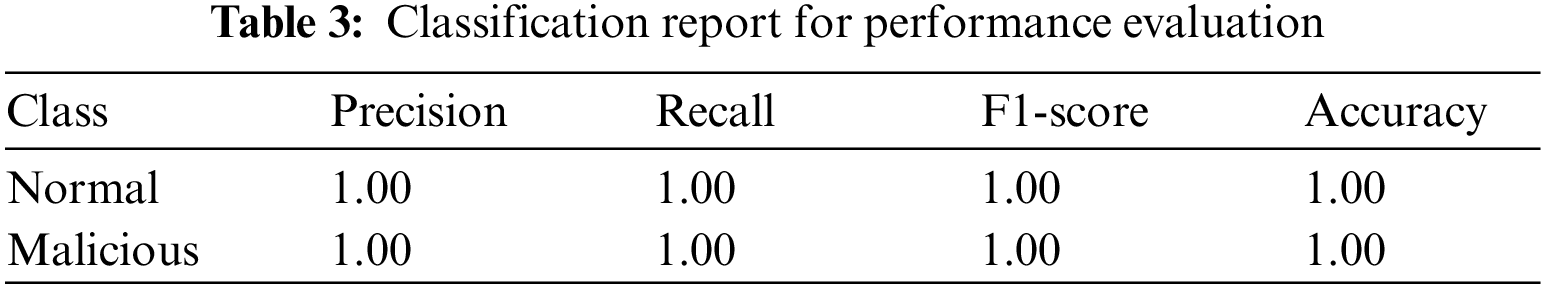
An RF classifier is utilized for the classification of normal and malicious traffic. The RF is a supervised learning method in which multiple decision trees, known as weak learners, work together to generate a strong learner [36]. The RF approach generates each tree using bootstrap randomized resampling to prevent overfitting the training dataset. To make a classification, the algorithm obtains the prediction results from each tree, builds a voting mechanism, and then takes a vote among the classifiers. Before training the classifier, the dataset was divided into training and testing partitions with a 60% and 40% ratio, respectively. It was ensured that both partitions were created stratified and balanced. This study did not perform feature scaling on the feature matrices for the training and testing partitions, as this step can obfuscate the features, which is undesirable since the aim is to investigate the explainability of features. For the RF classifier, 50 estimators with a maximum depth of 5 were used while keeping the other hyperparameters as default. These settings were chosen as they provide excellent performance for the classification task, resulting in 100% accuracy in differentiating between normal and malicious traffic. This validates the choice of hyperparameters. The classification metrics are summarized in Table 3. RF is well-suited for tabular data because it can handle high-dimensional feature spaces, effectively capture complicated relationships between features, and handle imbalanced datasets.
3.7 Model Explanation with LIME and SHAP
LIME and SHAP are two popular toolkits used for interpreting ML models. In the following sections, the method is briefly described.
LIME is a model-agnostic method that can interpret any black-box model, explaining individual predictions [37]. It generates random sample data around a specific input instance. It creates new predictions based on the weights of the generated instances, allowing for a better understanding of how the model arrived at its prediction. LIME provides a local interpretation of the model, making it easier for cybersecurity experts to understand the rationale behind each prediction. The Python package for the LIME toolkit [38] for the task is used.
3.7.2 SHapley Additive exPlanations
SHAP provides both local and global explanations for ML models. SHAP calculates the contribution of each feature to the model’s prediction, allowing users to understand the factors that influenced the model’s outcome [39]. It utilizes SHapley values from game theory to measure each feature’s marginal contribution to the model’s overall outcome. SHAP is compatible with many ML and AI models, making it a versatile toolkit for model interpretation. The Python package for the SHAP toolkit [40] for the task is used.
3.7.3 Similarities and Differences between SHAP and LIME
Although both methods offer approaches to XAI, there are certain similarities and differences between the two algorithms. Regarding similarities, both SHAP and LIME generate explanations for individual predictions and can be used to interpret any ML model. They generate local explanations, focusing on individual predictions rather than the entire model [41]. Another similarity is that both methods aim to increase the transparency and interpretability of ML models.
Whereas SHAP and LIME generate local explanations for ML models, they differ in calculating feature contributions. SHAP calculates the contribution of each feature to the model's prediction using SHapley values based on an approach derived from Game Theory where the objective is to assign credit in a fair way to each feature based on its impact on the overall outcome. On the other hand, LIME generates local explanations by training an interpretable model on perturbed samples generated by perturbing the original data. It should be mentioned here that LIME’s approach is less computationally intensive than SHAP and more suitable for large datasets. SHAP uses SHapley values from game theory [42], while LIME uses a local interpretable model trained on perturbed samples.
This section focuses on strategies for interpretability that can be applied to any black-box model. LIME and SHAP are black-box models’ most prominent interpretability strategies [43]. The workflow for explanation AI is depicted in Fig. 9. The workflow begins with attack detection, after which data such as network traffic and application activity are collected and processed. Next, features that reflect important qualities are extracted and fed to AI models for training. After the models are trained, test samples are analyzed, and decisions are made. Self-interpretable models provide the user with clear choices and explanations, whereas black-box models require explanations from explanation models to satisfy users seeking the detection task. These strategies are particularly relevant to cybersecurity, although the specifics may vary depending on the task.
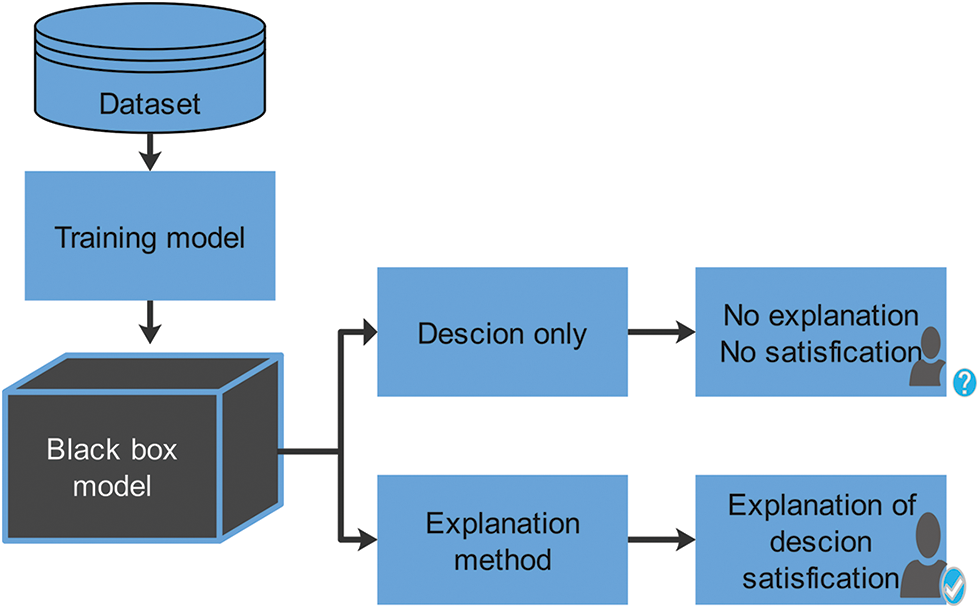
Figure 9: Importance of explanations in model interpretation
4.1 Model Interpretability Using LIME
Since the dataset is tabular, this study utilized the Lime Tabular Explainer from the LIME Python toolkit for model interpretability. The training partition was used as the training dataset for the tabular explainer, and a fixed random state parameter for the reproducibility of results was used. Figs. 10 and 11 illustrate LIME-based XAI when the instances belong to the “Normal” and “Malicious” classes, respectively. Based on the provided LIME values, one can see that certain features have higher weights for the “Normal” and “Malicious” classes, which indicate the contribution of each feature towards the predicted class.
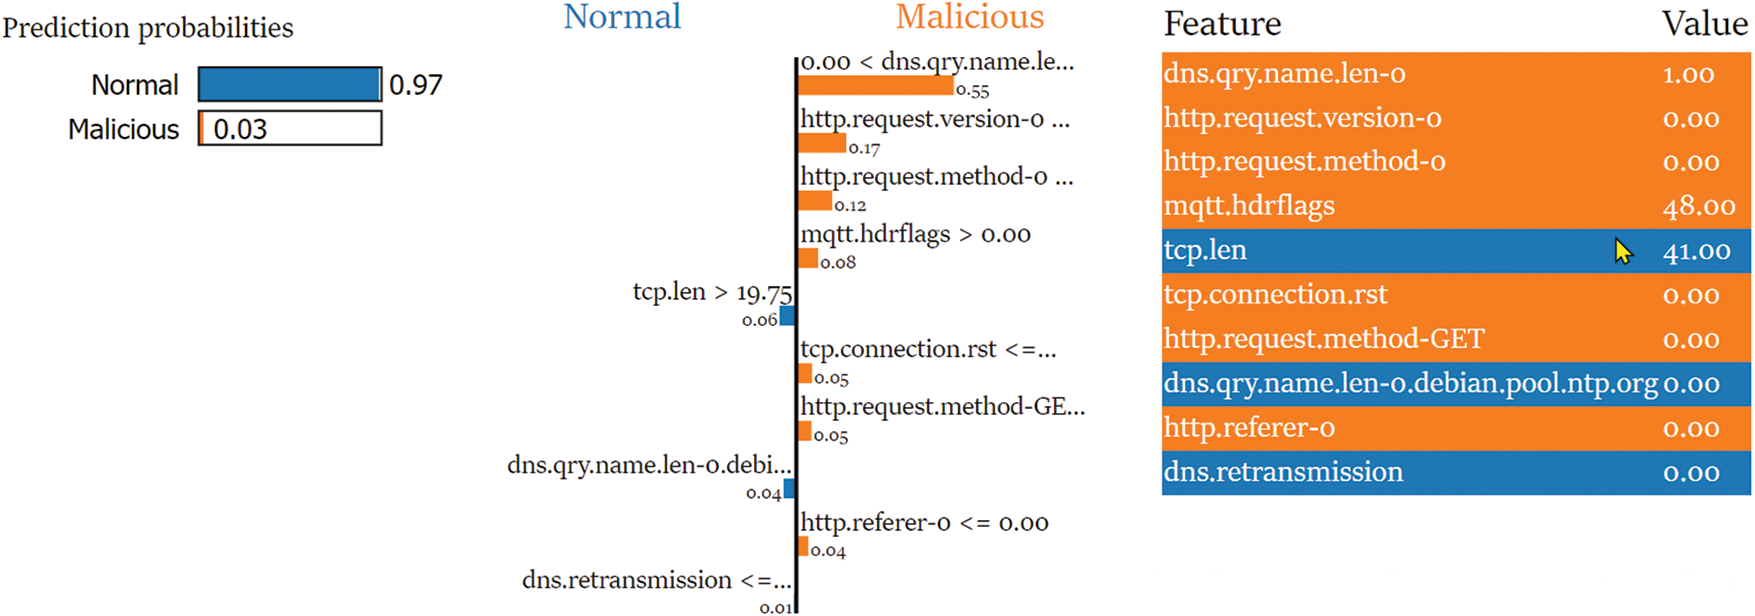
Figure 10: Analyzing LIME graph of normal class interpretability
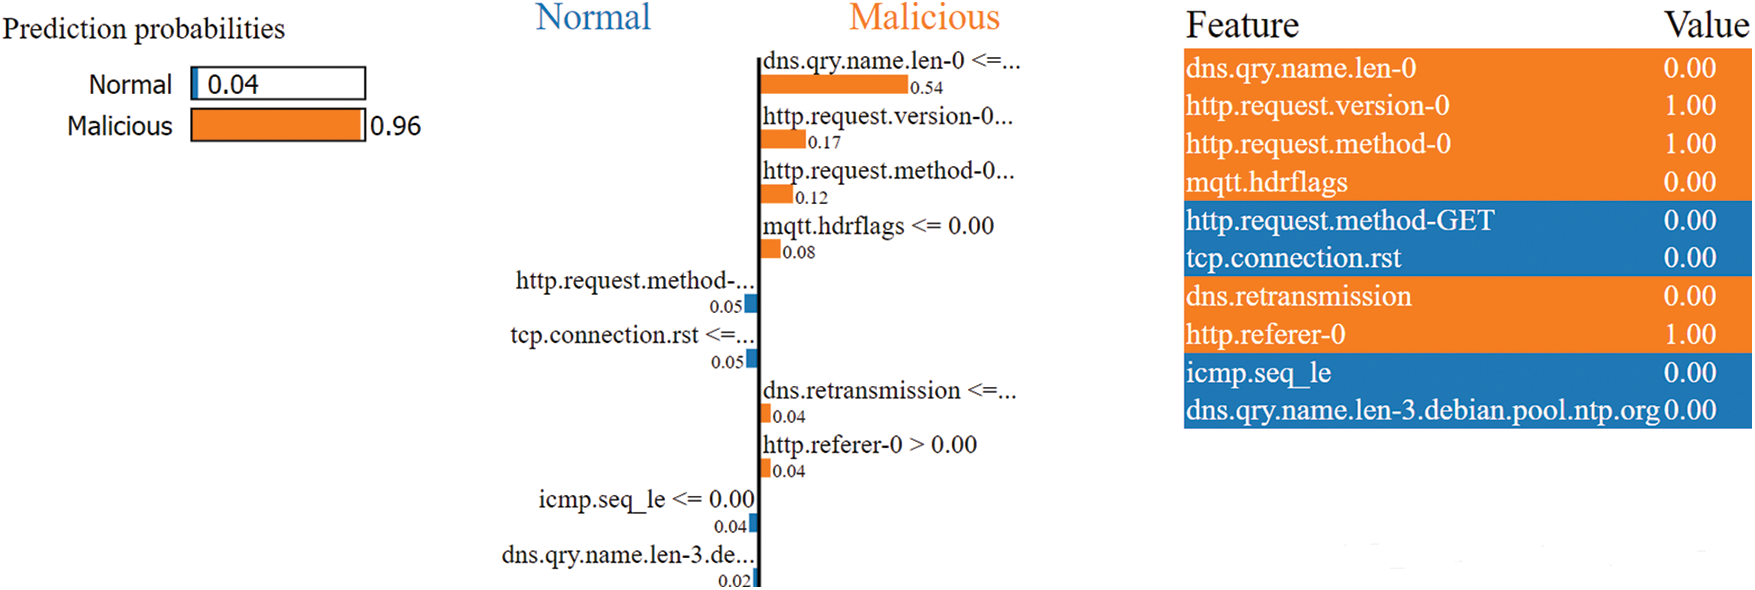
Figure 11: Analyzing LIME graph of malicious class interpretability
For the “Normal” class, it is noted that dns.qry.name.len-0, http.request.version-0, http.request.method-0, mqtt.hdrflags, http.request.method-POST, tcp.connection.rst, http.request.method-GET, http.referer-0, and dns.qry.name.len-2.debian.pool.ntp.org are important features. These features suggest that normal traffic in VANETs is characterized by short DNS query names, low HTTP request versions and methods, and MQTT header flags. LIME also suggests that HTTP requests with the POST method and TCP connections that are not reset are more likely to be classified as normal traffic.
On the other hand, for the “Malicious” class, it was noted that the features that positively contribute to the prediction include: dns.qry.name.len-0, http.request.version-0, http.request.method-0, mqtt.hdrflags, http.referer-0, dns.retransmission, icmp.seq_le, and dns.qry.name.len-2.debian.pool.ntp.org. These features suggest that attacks in VANETs are characterized by DNS queries with no name or very short names, high HTTP request versions and methods, and the absence of MQTT header flags. Additionally, retransmitted DNS queries and ICMP sequence numbers that are less than or equal to 0 are more likely to be classified as malicious. Overall, it was noted from experiments from LIME-based XAI that LIME values provide interesting insights into how the ML model is making its predictions for intrusion detection in VANETs. These insights can be used to improve the model’s effectiveness and reliability and identify potential threats.
4.2 Model Interpretability Using SHAP
This research used the SHAP Tree Explainer to explain the trained RF classification model. This study explained the test partition features using SHAP. The SHAP summary plot is used. The SHAP summary plot provides an intuitive and visual way to understand how a ML model makes predictions based on different features for each data point. By understanding the important features and the direction and magnitude of their impact, it can gain insights into how the model works and identify improvement areas. The vertical axis shows the features, with the most important feature at the top and the least important feature at the bottom. The horizontal values show the SHAP value of each feature, indicating how much that feature contributes to the prediction for each data point. Positive values indicate that the feature increases the prediction, while negative values indicate that the feature decreases the prediction. The length of the bar indicates the magnitude and direction of the feature’s effect on the model’s output. Additionally, red and blue indicate the increased and decreased SHAP values, respectively. Fig. 12 shows the summary plot results from the normal class’s perspective. The graph shows that the feature dns.qrt.name.len-0 has the greatest impact on the prediction. The graphs suggest positive SHAP values, indicating higher dns.qrt.name values.len-0 feature is associated with positive predictions for normal class. While the bottom feature http.content_length has a negative impact on the prediction, as shown by their negative SHAP values.
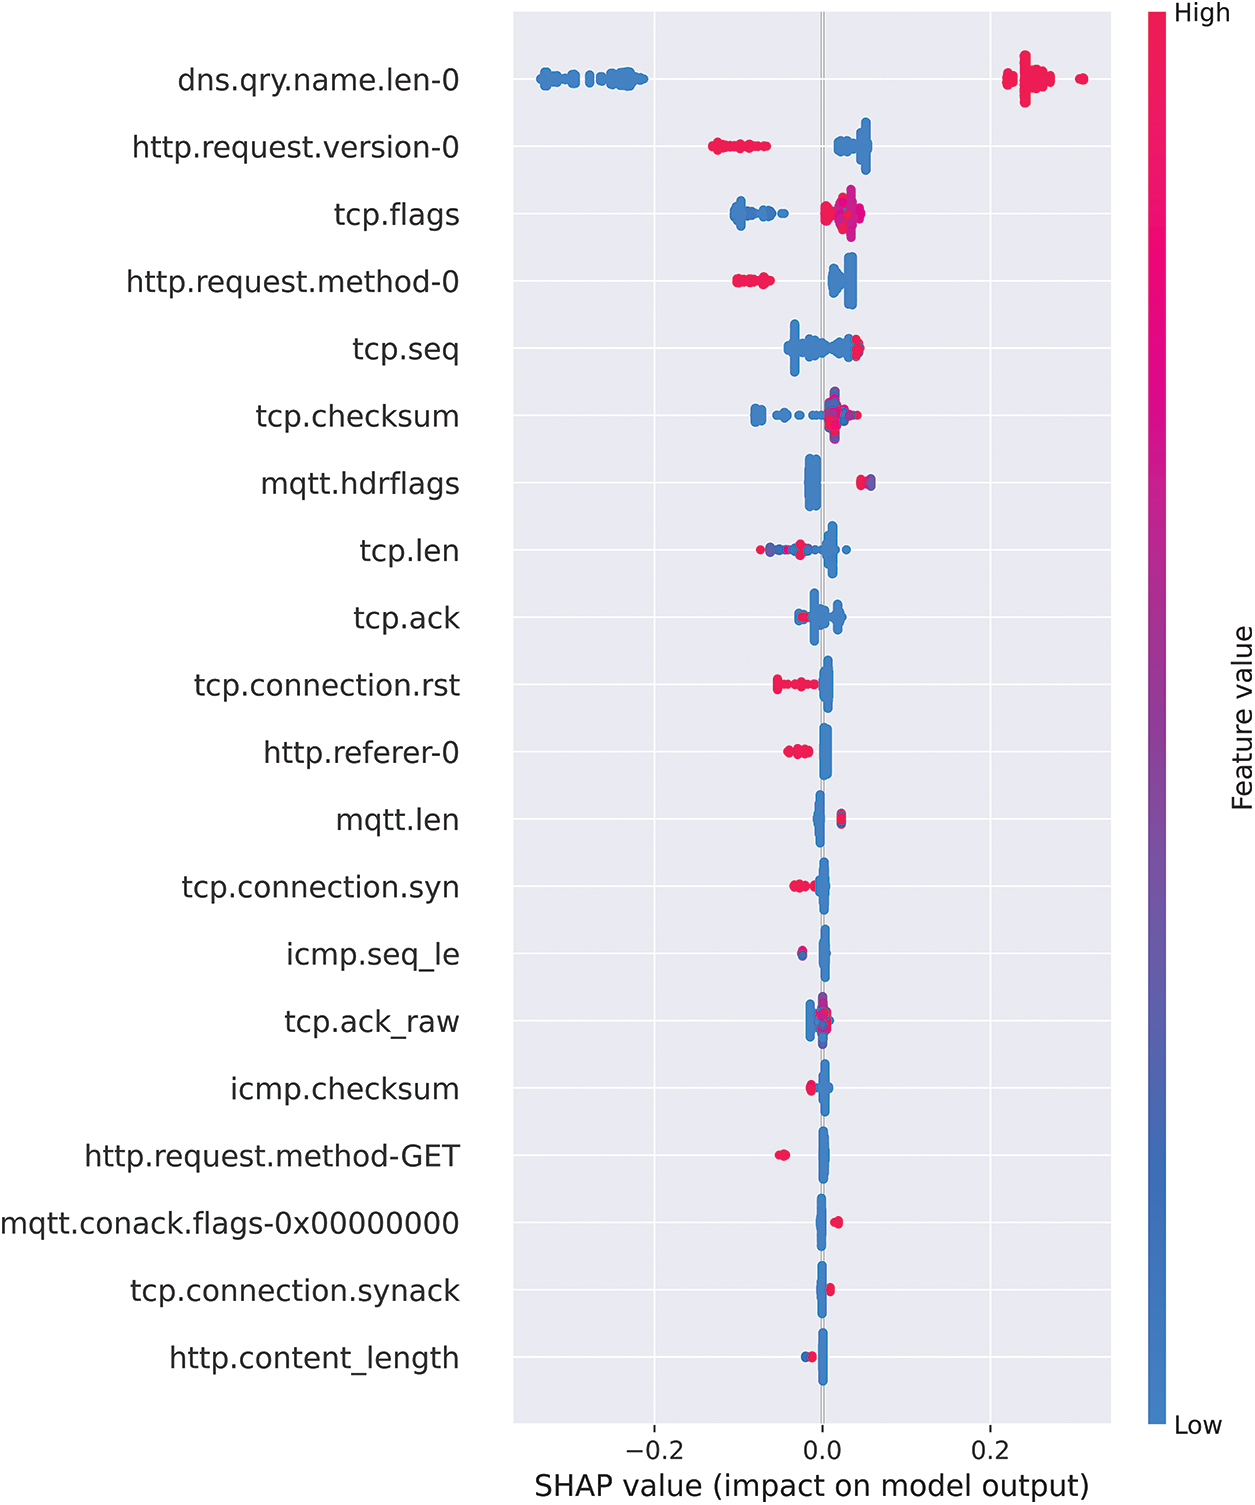
Figure 12: Comprehensive guide to SHAP summary plot for the normal point of view
Fig. 13 displays the results of the summary plot from the perspective of the malicious class. It is important to note that both summary plot graphs provide complementary information. The first graph provides information from the point of view of the normal class, whereas this graph provides information from the point of view of the malicious class.
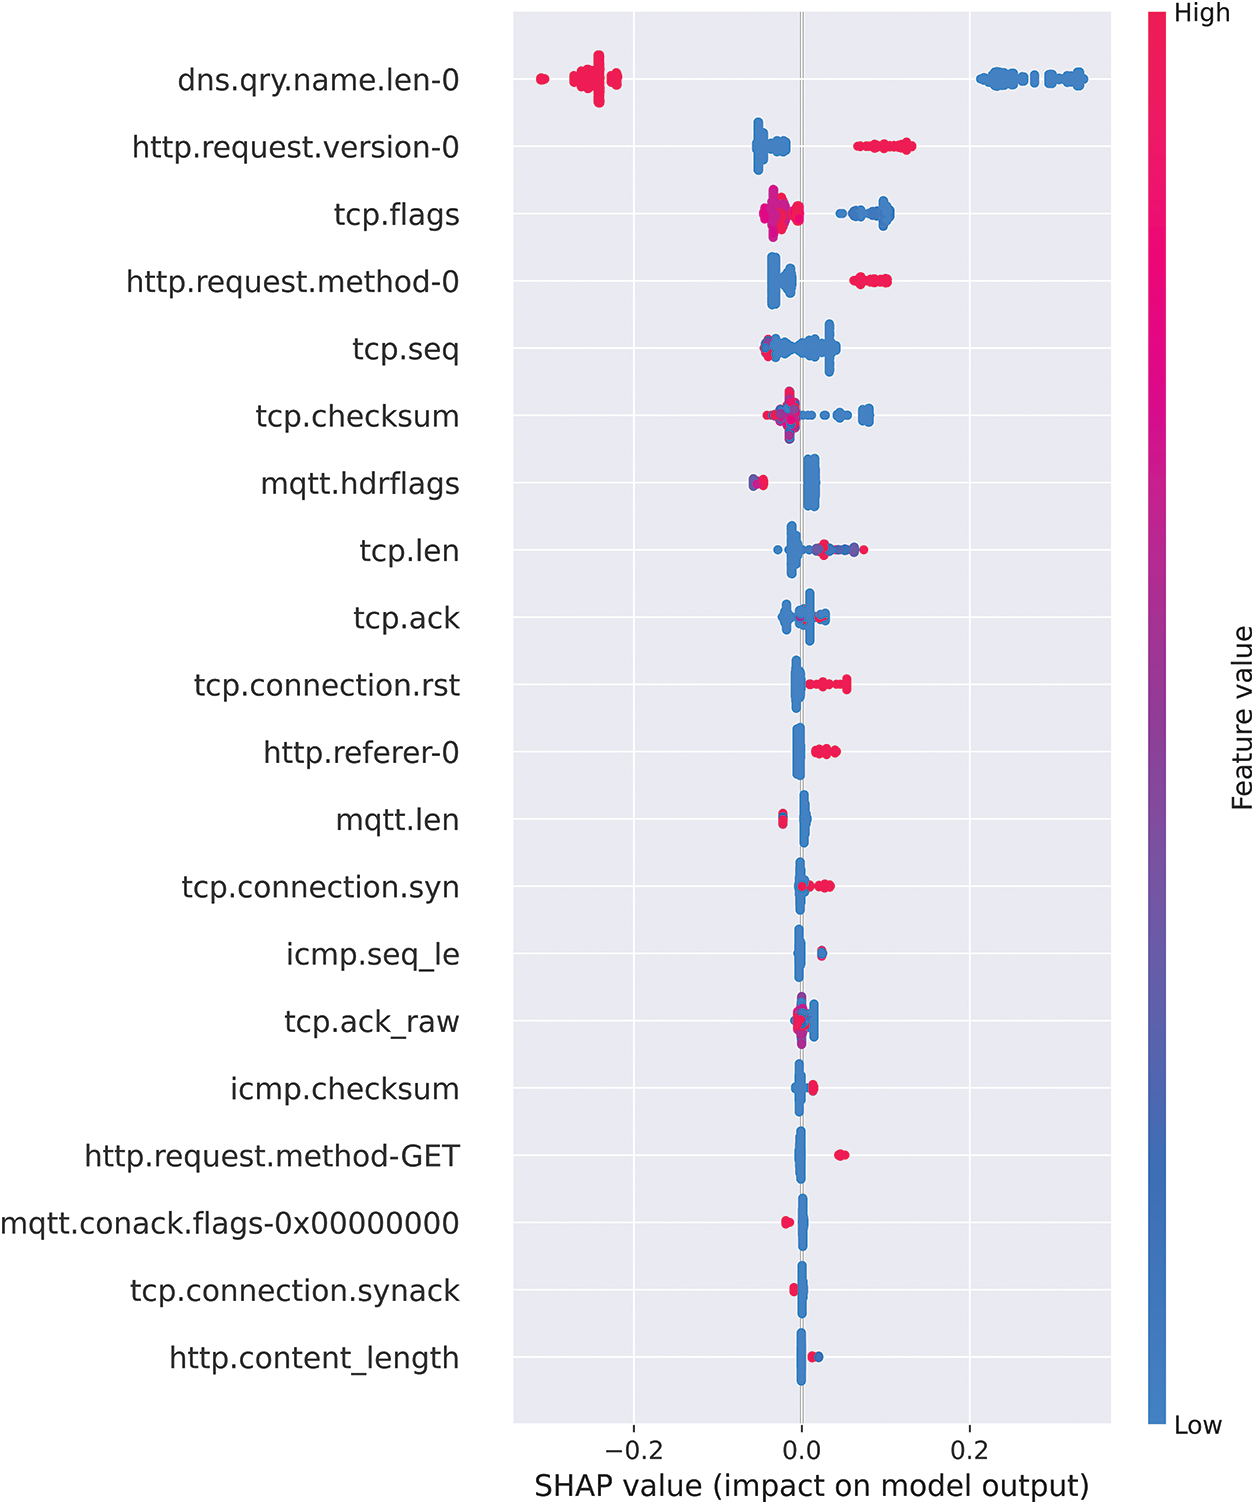
Figure 13: Comprehensive guide to SHAP summary plot for malicious point of view
The graph indicates that the feature “dns.qrt.name.len-0” is the most important feature for the classification task since it has the largest impact. The graph suggests that a smaller value of “dns.qrt.name.len-0” results in a larger SHAP value for the malicious class, meaning that a smaller value of this feature indicates the malicious class. This observation is exactly opposite to the observation from the previous graph and is in line with the understanding of SHAP.
Both Figs. 12 and 13 provide complementary information, and it is worth combining them into a single graph to identify the features that have the largest impact. It can be achieved by plotting the summary plot with absolute SHAP values, as shown in Fig. 14. The x-axis displays the average impact (mean absolute SHAP value) on the decision-making of a particular sample for a specific feature. It is observed how much a specific feature can change the model's prediction (compared to the prediction of the feature value at some baseline). The y-axis displays the feature’s importance globally according to their presentation in the entire training set.
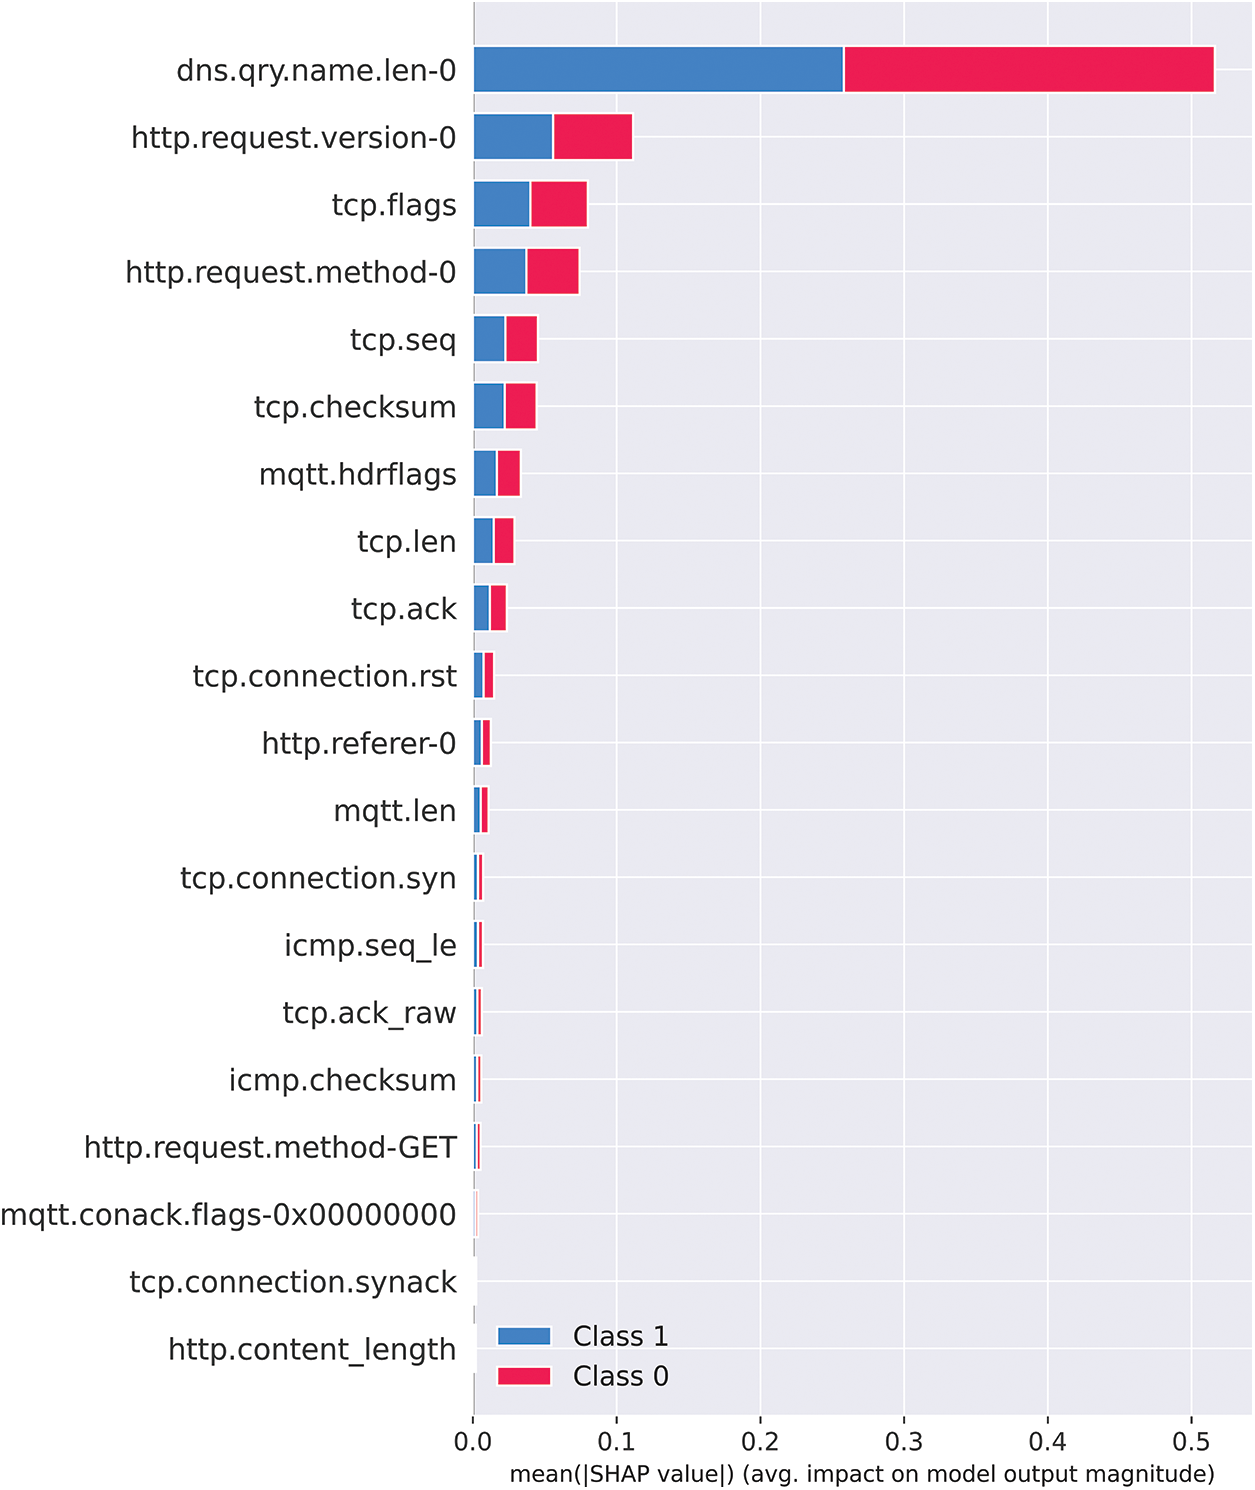
Figure 14: Visual guide for SHAP value using absolute plot
Fig. 14 shows that the feature “dns.qry.name.len-0” is the most powerful in differentiating between attack and normal data, compared to other given features.
Fig. 14 illustrates the absolute average SHAP score results for the top 20 features. Certain features have a large impact on the model’s performance. The feature “dns.qry.name.len-0” has the highest SHAP score of 0.258173, indicating that it has the most significant impact on network intrusion detection. It is reminded that this feature represents the length of the domain name in the DNS query, and based on the SHAP score, one can surmise that a longer domain name may indicate suspicious activity, such as a phishing attempt or malware communication. The feature “http.request.version-0” has a SHAP score of 0.055773, indicating a moderate impact on network intrusion detection. The feature represents the version of the HTTP request, which can be used to identify outdated or vulnerable software that attackers may target. Finally, the third most informative feature is “tcp.flags” with a SHAP score of 0.040036. This feature represents the TCP flags used in network traffic, which can be used to identify suspicious activity such as port scanning or denial-of-service attacks.
The force plot shows the contribution of each feature to the prediction for a specific instance or observation. The horizontal bar represents the feature’s contribution to the model’s prediction. The length of the bar represents the magnitude and direction of the feature’s impact, and the colour represents the feature’s value for that instance. Red indicates a contribution in favour of the correct decision, whereas blue indicates a contribution against the correct decision. Figs. 15 and 16 provide illustrations of “force plots” from the perspectives of normal and attack classes, respectively.
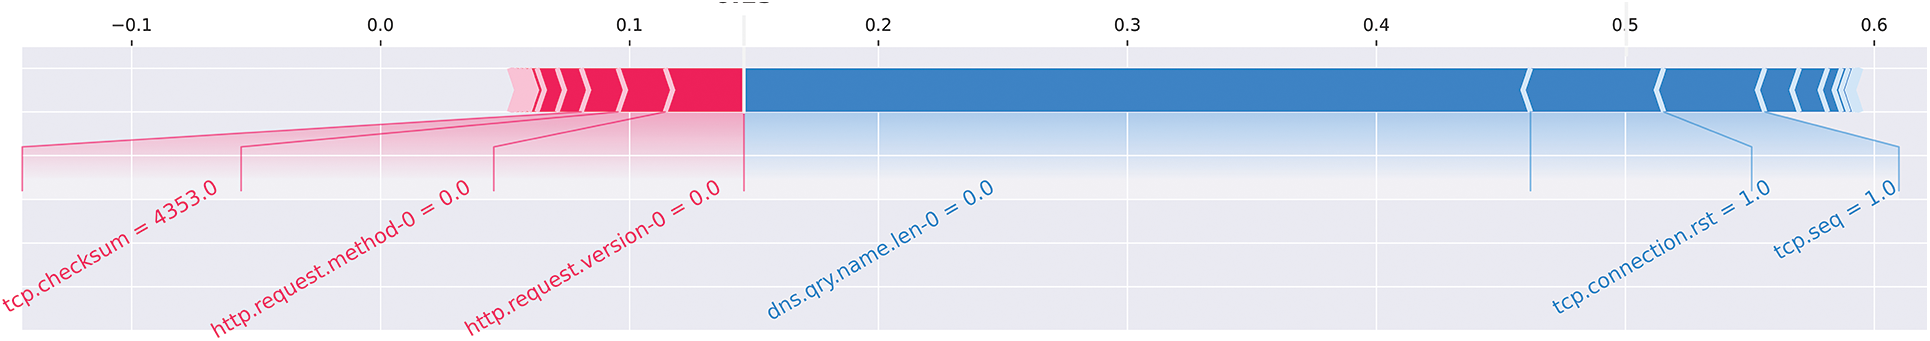
Figure 15: Illustration of a forced plot from the perspective of the “Normal” class for an input sample with a true class label of “Malicious”
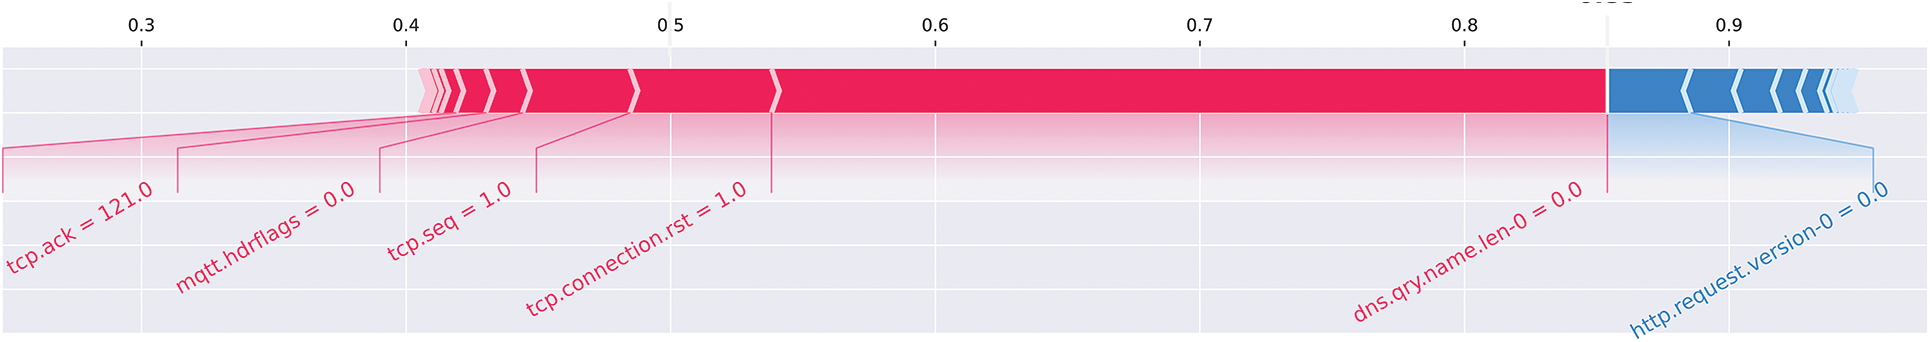
Figure 16: Illustration of a forced plot from the perspective of the “malicious” class for an input sample with a true class label of “malicious”
Figs. 15 and 16 present a SHAP force plot-based explanation of an RF classifier for intrusion detection in VANETs. The input sample used for the force plot belonged to the “Attack” class and was correctly identified as such by the classifier. As with summary plots, force plots can be viewed from both perspectives, i.e., “Normal” and “Malicious” classes, and we will provide descriptions from both points of view.
From Fig. 15, which shows the perspective of the “Normal” class, it can be observed that features such as http.request.version supports the hypothesis that the input sample belongs to the normal class, while the features dns.qry.name.len-0 and tcp.connect.rst support the opposite, indicating that the input sample belongs to the “Malicious” class. The supporting force is shown in red, while the opposing force is shown in blue. However, since the opposing force for the “Malicious” class (blue colour) is greater, it can be concluded that the input sample belongs to the “Malicious” class rather than the “Normal” class.
Fig. 16 provides the force plot from the perspective of the “Malicious” class. The observations from this plot are identical to those in Fig. 15. For example, here dns.qry.name.len-0 and tcp.connect.rst features support the prediction of the input sample belonging to the “Malicious” class, while http.request features to support the opposite. However, the supporting force of the features is greater than the opposing force, leading to the classifier’s decision towards the “Malicious” class, which is the correct class.
The SHAP force plot provides a detailed breakdown of the contribution of individual features to the classifier’s prediction and helps understand the reasoning behind the classification decision. The force plot can assist in identifying the most important features for intrusion detection in VANETs, allowing for improved accuracy and interpretability of the model.
So far, this study has examined using three distinct tools for XAI-based intrusion detection in VANETs. The observations reveal that these three approaches—mutual information, SHAP values, and LIME values—provide different viewpoints on feature importance. This section analyzes the top five features identified by each method and aims to present a comprehensive overview of the outcomes. The list of these features can be found in Table 4, and it is worth noting that there is an overlap between the three methods.
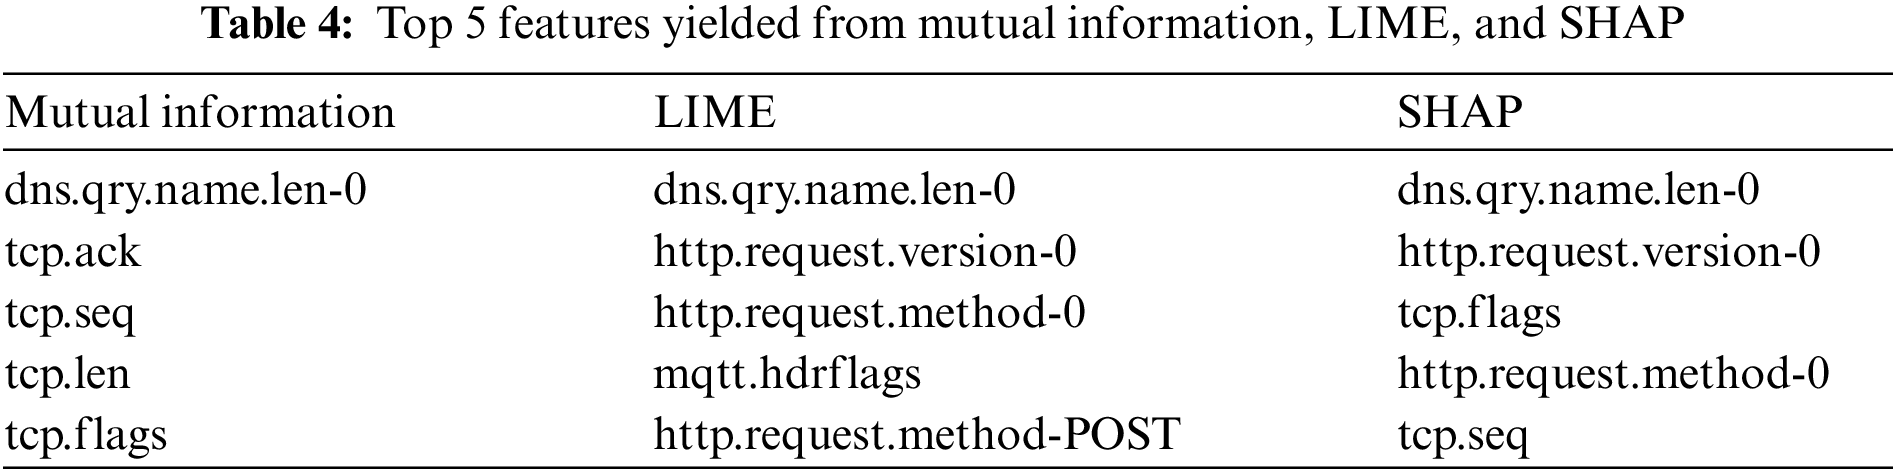
Mutual information measures the degree of information shared between the feature and the target variable. This study used it to identify features that contribute significantly through mutual information to differentiate between normal and malicious network activity. As shown in Table 4, these features are mostly related to the TCP protocol that attackers often use to exploit vulnerabilities or perform attacks on networks. On the other hand, LIME provides a local explanation of the model’s predictions by approximating it with an interpretable model. The identified features include a combination of DNS, HTTP, and MQTT protocol attributes. The presence of mqtt.hdrflags suggests that the MQTT protocol, commonly used in IoT devices, may also play a role in intrusion detection. Finally, SHAP values offer insight into the impact of each feature on the model’s output. The identified features are a mix of TCP-related and HTTP-related attributes, suggesting that both protocols are important for intrusion detection. The presence of http.request.version-0 and http.request.method-0 indicates the relevance of HTTP-specific features in identifying malicious activity. Based on Table 4, one can note that the feature dns.qry.name.len-0 is consistently identified as an important feature across all three methods, indicating the significance of DNS-related information for intrusion detection. Also, features related to the TCP and HTTP protocols are prominent in all three methods, indicating their importance in detecting malicious network activity. Moreover, the MQTT protocol attribute appearing in the LIME values indicates the potential relevance of IoT-related features in this context. Overall, it is believed that it is essential to consider the features identified by different XAI methods to understand their importance in intrusion detection, especially when the aim is to build an XAI model. While some features consistently appear across all methods, others are unique to a specific approach. Employing multiple methods can also improve model interpretability, confidence in the results, and better-informed decisions when using the model for critical application results.
This paper presented, discussed, and demonstrated that ML-based IDS systems could detect malicious traffic data in VANET environments for a new comprehensive, realistic Edge-IIoT dataset. As V2V or vehicle-to-roadside unit (RSU) propagation of information becomes more prevalent, it is critical to ensure the security of the data, making it essential to employ advanced AI-based techniques, such as IDS systems. This research proposed an IDS capable of identifying threats from fourteen types of malicious attacks in network traffic using the explanations generated through LIME-and SHAP-based models to address this issue. Furthermore, this study utilized the mutual_info_regression function to analyze and gain a deeper understanding of the importance of features in ML models. This study also proposed a mechanism to remove redundant features from the dataset that can reduce computational complexity. Overall, this research exhibited 100% accurate results in differentiating between attack and normal traffic. It suggests that integrating AI-explanation and ML-based systems holds promise for developing more robust and reliable IDS. Moreover, this research achieved 100% accurate results on adversarial samples and the test dataset.
For future work, it aimed to overcome the main limitation of the proposal by creating a unique dataset specifically designed for VANETs containing various types of attacks. Currently, such a dataset is not available, but this gap is identified during this research and includes the creation of this dataset as a task to tackle in the future. In addition to the need for a customized dataset for VANETs, it also understands the requirement for a more nuanced classification approach where the IDS identifies an attack and the attack type. As an extension of current work, it is planned to explore multi-label classification methods to classify different types of attacks. In addition, the existing work can be enhanced by comparing the impact of mobility over static learning-based schemes. In future work, a new dataset will be created that will include the effects of poor communication quality and report the performance as a separate research publication at some point in the future. Moreover, this work could be further expanded by exploiting other attacks, such as black hole attacks and Sybil attacks.
Acknowledgement: The authors wish to express their appreciation to the reviewers for their helpful suggestions which greatly improved the presentation of this paper.
Funding Statement: This work was supported in part by the National Natural Science Foundation of China (NSFC) under Grant Number 62127802.
Author Contributions: The authors confirm contribution to the paper as follows: study conception and design: Fayaz Hassan, Jianguo Yu, Zafi Sherhan Syed, Nadeem Ahmed, Arif Hussain Magsi; data collection: Fayaz Hassan, Zafi Sherhan Syed and Arif Hussain Magsi; analysis and interpretation of results: Fayaz Hassan and Nadeem Ahmed; draft manuscript preparation: Fayaz Hassan, Jianguo Yu and Arif Hussain Magsi. All authors reviewed the results and approved the final version of the manuscript.
Availability of Data and Materials: The data used to support the findings of this study are available from authors upon request.
Conflicts of Interest: The authors declare that they have no conflicts of interest to report regarding the present study.
References
1. A. H. Magsi, L. V. Yovita, A. Ghulam, G. Muhammad and Z. Ali, “Content poisoning attack detection and prevention system in vehicular named data networking,” Sustainability, vol. 15, no. 14, pp. 10931, 2023. [Google Scholar]
2. A. R. Gad, A. A. Nashat and T. M. Barkat, “Intrusion detection system using machine learning for vehicular ad hoc networks based on ToN-IoT dataset,” IEEE Access, vol. 9, pp. 142206–142217, 2021. [Google Scholar]
3. A. A. Salih and A. M. Abdulazeez, “Evaluation of classification algorithms for intrusion detection system: A review,” Journal of Soft Computing and Data Mining, vol. 2, no. 1, pp. 31–40, 2021. [Google Scholar]
4. S. Mane and D. Rao, “Explaining network intrusion detection system using explainable AI framework,” arXiv preprint arXiv:2103.07110, 2021. [Google Scholar]
5. O. Abuomar and P. Sogbe, “Classification and detection of chronic kidney disease (CKD) using machine learning algorithms,” in Proc. of ICECET, Cape Town, South Africa, pp. 1–8, 2021. [Google Scholar]
6. U. Schlegel, H. Arnout, M. El-Assady, D. Oelke and D. A. Keim, “Towards a rigorous evaluation of XAI methods on time series,” in Proc. of ICCVW, Seoul, Korea, pp. 4197–4201, 2019. [Google Scholar]
7. T. Zebin, S. Rezvy and Y. Luo, “An explainable AI-based intrusion detection system for DNS over HTTPS (DoH) attacks,” IEEE Transactions on Information Forensics and Security, vol. 17, pp. 2339–2349, 2022. [Google Scholar]
8. S. Wali and I. Khan, “Explainable signature-based machine learning approach for identification of faults in grid-connected photovoltaic systems,” in Proc. of TPEC, College Station, TX, USA, pp. 1–6, 2022. [Google Scholar]
9. P. Michalopoulos, “Comparing explanations for black-box intrusion detection systems,” Ph.D. dissertation, Eindhoven University of Technology, Netherlands, 2020. [Google Scholar]
10. M. Nour and J. Slay, “A comprehensive data set for network intrusion detection systems (UNSW-NB15 network data set,” in Proc. of MilCIS, Canberra, ACT, Australia, pp. 1–6, 2015. [Google Scholar]
11. I. Sharafaldin, A. H. Lashkari and A. A. Ghorbani, “Toward generating a new intrusion detection dataset and intrusion traffic characterization, 4th International Conference on Information Systems Security and Privacy (ICISSP), Funchal-Madeira, Portugal, vol. 1, pp. 108–116, 2018. [Google Scholar]
12. A. Sivanathan, H. H. Gharakheili, F. Loi, A. Radford, C. Wijenayake et al., “Classifying IoT devices in smart environments using network traffic characteristics,” IEEE Transactions on Mobile Computing, vol. 18, no. 8, pp. 1745–1759, 2018. [Google Scholar]
13. A. Hamza, H. H. Gharakheili, T. A. Benson and V. Sivaraman, “Detecting volumetric attacks on lot devices via sdn-based monitoring of mud activity,” in Proc. of SOSR, San Jose CA USA, pp. 36–48, 2019. [Google Scholar]
14. F. A. Alaba, M. Othman, I. A. T. Hashem and F. Alotaibi, “Internet of things security: A survey,” Journal of Network and Computer Applications, vol. 88, pp. 10–28, 2017. [Google Scholar]
15. D. Ding, Q. L. Han, Y. Xiang, X. Ge and X. M. Zhang, “A survey on security control and attack detection for industrial cyber-physical systems,” Neurocomputing, vol. 275, pp. 1674–1683, 2018. [Google Scholar]
16. T. Shinohara, T. Namerikawa and Z. Qu, “Resilient reinforcement in secure state estimation against sensor attacks with a priori information,” IEEE Transactions on Automatic Control, vol. 64, no. 12, pp. 5024–5038, 2019. [Google Scholar]
17. H. Sun, M. Chen, J. Weng, Z. Liu and G. Geng, “Anomaly detection for in-vehicle network using cnn-lstm with attention mechanism,” IEEE Transactions on Vehicular Technology, vol. 70, no. 10, pp. 10880–10893, 2021. [Google Scholar]
18. Z. Liu, J. Weng, J. Guo, J. Ma and F. Huang, “PPTM: A privacy-preserving trust management scheme for emergency message dissemination in space–air–ground-integrated vehicular networks,” IEEE Internet of Things Journal, vol. 9, no. 8, pp. 9543–5956, 2021. [Google Scholar]
19. J. Guo, X. Li, Z. Liu, J. Ma, C. Yang et al., “Trove: A context-awareness trust model for vanets using reinforcement learning,” IEEE Internet of Things Journal, vol. 7, no. 7, pp. 6647–6662, 2020. [Google Scholar]
20. J. Guo, Z. Liu, S. Tian, F. Huang, J. Li et al., “TFL-DT: A trust evaluation scheme for federated learning in digital twin for mobile networks,” IEEE Journal on Selected Areas in Communication, vol. 41, no. 11, pp. 3548–3560, 2023. [Google Scholar]
21. N. Farnaaz and M. A. Jabbar, “Random forest modeling for network intrusion detection system,” Procedia Computer Science, vol. 89, pp. 213–217, 2016. [Google Scholar]
22. M. Tavallaee, E. Bagheri, W. Lu and A. A. Ghorbani, “A detailed analysis of the KDD CUP 99 data set,” in Proc. of CISDA, Ottawa, ON, Canada, pp. 1–6, 2009. [Google Scholar]
23. G. Engelen, V. Rimmer and W. Joosen, “Troubleshooting an intrusion detection dataset: The CICIDS2017 case study,” in Proc. of SPW, San Francisco, CA, USA, pp. 7–12, 2021. [Google Scholar]
24. R. Panigrahi and S. Borah, “A detailed analysis of CICIDS2017 dataset for designing intrusion detection systems,” International Journal of Engineering & Technology, vol. 7, no. 3, pp. 479–482, 2018. [Google Scholar]
25. Z. K. Maseer, R. Yusof, N. Bahaman, S. A. Mostafa and C. F. M. Foozy, “Benchmarking of machine learning for anomaly based intrusion detection systems in the CICIDS2017 dataset,” IEEE Access, vol. 9, pp. 22351–22370, 2021. [Google Scholar]
26. K. Hyunjae, D. H. Ahn, G. M. Lee, J. D. Yoo, K. H. Park et al., “IoT network intrusion dataset,” IEEE Dataport, 2019. [Online]. Available: https://ieee-dataport.org/ieee-dataport-dataset-upload-contest-entries (accessed on 10/07/2023) [Google Scholar]
27. N. Koroniotis, N. Moustafa, E. Sitnikova and B. Turnbull, “Towards the development of realistic botnet dataset in the Internet of Things for network forensic analytics: Bot-IoT dataset,” Future Generation Computer Systems, vol. 100, pp. 779–796, 2019. [Google Scholar]
28. J. M. Peterson, J. L. Leevy and T. M. Khoshgoftaar, “A review and analysis of the bot-iot dataset,” in Proc. of SOSE, Oxford, UK, pp. 20–27, 2021. [Google Scholar]
29. I. Vaccari, G. Chiola, M. Aiello, M. Mongelli, E. Cambiaso et al., “MQTTset, a new dataset for machine learning techniques on MQTT,” Sensors, vol. 20, no. 22, pp. 6578, 2020. [Google Scholar] [PubMed]
30. H. Hindy, E. Bayne, M. Bures, R. A. tkinson, C. Tachtatzis et al., “Machine learning based IoT intrusion detection system: An MQTT case study (MQTT-IoT-IDS2020 dataset),” in Proc. of INC, UK, pp. 73–84, 2020. [Google Scholar]
31. N. Islam, F. Farhin, I. Sultana, M. S. Kaiser, M. S. Rahman et al., “Towards machine learning based intrusion detection in IoT networks,” Computers, Materials & Continua, vol. 69, no. 2, pp. pp 1801–1821, 2021. [Google Scholar]
32. M. Al-Hawawreh, E. Sitnikova and N. Aboutorab, “X-IIoTID: A connectivity-agnostic and device-agnostic intrusion data set for industrial Internet of Things,” IEEE Internet of Things Journal, vol. 9, no. 5, pp. 3962–3977, 2021. [Google Scholar]
33. M. A. Ferrag, O. Friha, D. Hamouda, L. Maglaras and H. Janicke, “Edge-IIoTset: A new comprehensive realistic cyber security dataset of IoT and IIoT applications for centralized and federated learning,” IEEE Access, vol. 10, pp. 40281–40306, 2022. [Google Scholar]
34. N. Ahmed, Z. Deng, I. Memon, F. Hassan, K. H. Mohammadani et al., “A survey on location privacy attacks and prevention deployed with IoT in vehicular networks,” Wireless Communications and Mobile Computing, vol. 2022, pp. 1–5, 2022. [Google Scholar]
35. M. A. Ferrag, O. Friha, D. Hamouda, L. Maglaras and K. H. Janicke,“Edge-IIoT dataset,” 2022. [Online]. Available: https://dx.doi.org/10.21227/mbc1-1h68 (accessed on 15/01/2023) [Google Scholar]
36. T. T. H. Le, H. Kim, H. Kang and H. Kim, “Classification and explanation for intrusion detection system based on ensemble trees and SHAP method,” Sensors, vol. 22, no. 3, pp. 1154, 2022. [Google Scholar] [PubMed]
37. S. Patil, V. Varadarajan, S. M. Mazhar, A. Sahibzada, N. Ahmed et al., “Explainable artificial intelligence for intrusion detection system,” Electronics, vol. 11, no. 19, pp. 3079, 2022. [Google Scholar]
38. R. T. Marco, “lime 0.2.0.1,” [Online]. Available: https://pypi.org/project/lime/ (accessed on 15/01/2023) [Google Scholar]
39. R. Younisse, A. Ahmad and Q. Abu Al-Haija, “Explaining intrusion detection-based convolutional neural networks using shapley additive explanations (SHAP),” Big Data and Cognitive Computing, vol. 6, no. 4, pp. 126, 2022. [Google Scholar]
40. L. Scott, “shap 0.41.0,” [Online]. Available: https://pypi.org/project/shap/ (accessed on 15/01/2023) [Google Scholar]
41. S. Hariharan, R. R. Rejimol, R. R. Prasad, C. Thomas and Balakrishnan, “XAI for intrusion detection system: Comparing explanations based on global and local scope,” Journal of Computer Virology and Hacking Techniques, vol. 19, no. 2, pp. 217–239, 2023. [Google Scholar]
42. S. Amarakoon, Y. Siriwardhana, P. Porambage, M. Liyanage, S. Y. Chang et al., “5G-NIDD: A comprehensive network intrusion detection dataset generated over 5G wireless network,” arXiv preprint arXiv:2212.01298, 2022. [Google Scholar]
43. P. Linardatos, V. Papastefanopoulos and S. Kotsiantis, “Explainable AI: A review of machine learning interpretability methods,” Entropy, vol. 23, no. 1, pp. 18, 2020. [Google Scholar] [PubMed]
Cite This Article
 Copyright © 2023 The Author(s). Published by Tech Science Press.
This work is licensed under a Creative Commons Attribution 4.0 International License , which permits unrestricted use, distribution, and reproduction in any medium, provided the original work is properly cited.
 Downloads
 Citation Tools