
 Submit a Paper
 Propose a Special lssue
 Open Access
ARTICLE

Functional Pattern-Related Anomaly Detection Approach Collaborating Binary Segmentation with Finite State Machine
1 School of Information, Liaoning University, Shenyang, 110036, China
2 School of Computer Science and Technology, Hainan University, Haikou, 570228, China
3 School of Physics, Liaoning University, Shenyang, 110036, China
* Corresponding Author: Jiangyuan Yao. Email:
(This article belongs to the Special Issue: Advanced Data Mining Techniques: Security, Intelligent Systems and Applications)
Computers, Materials & Continua 2023, 77(3), 3573-3592. https://doi.org/10.32604/cmc.2023.044857
Received 10 August 2023; Accepted 08 November 2023; Issue published 26 December 2023
 View Full Text
 Download PDF
Abstract
The process control-oriented threat, which can exploit OT (Operational Technology) vulnerabilities to forcibly insert abnormal control commands or status information, has become one of the most devastating cyber attacks in industrial automation control. To effectively detect this threat, this paper proposes one functional pattern-related anomaly detection approach, which skillfully collaborates the BinSeg (Binary Segmentation) algorithm with FSM (Finite State Machine) to identify anomalies between measuring data and control data. By detecting the change points of measuring data, the BinSeg algorithm is introduced to generate some initial sequence segments, which can be further classified and merged into different functional patterns due to their backward difference means and lengths. After analyzing the pattern association according to the Bayesian network, one functional state transition model based on FSM, which accurately describes the whole control and monitoring process, is constructed as one feasible detection engine. Finally, we use the typical SWaT (Secure Water Treatment) dataset to evaluate the proposed approach, and the experimental results show that: for one thing, compared with other change-point detection approaches, the BinSeg algorithm can be more suitable for the optimal sequence segmentation of measuring data due to its highest detection accuracy and least consuming time; for another, the proposed approach exhibits relatively excellent detection ability, because the average detection precision, recall rate and F1-score to identify 10 different attacks can reach 0.872, 0.982 and 0.896, respectively.Keywords
Intelligent control systems have become a popular option for providing industrial automation control in various critical infrastructures, typically including petroleum, power stations, water conservancy, and other supporting fields. Furthermore, it can automatically manage different kinds of control devices and sensors in the industrial production process through various wireless and wired networks, and carry out industrial activities, such as process control, data acquisition, and business management [1,2]. In general, industrial automation control, which realizes the integration of computer software, electronic and electrical, mechanical operation, and network communication technologies, has been regarded as one functional core of control systems to ensure more automatic and efficient production and manufacturing. When one control system is running, industrial automation control can set and maintain various system parameters without human operation, and enable these systems to continuously run under the default working state [3]. In other words, industrial automation control can realize automatic control, supervision, and optimization of the industrial production process, and improve production efficiency and quality by reducing staffing requirements. However, with the rapid development and deep integration of IT (Information Technology) and OT (Operational Technology), interconnection and intercommunication have been gradually infiltrating into the traditional manufacturing industry, and industrial automation control is also facing huge challenges from information security [4]. Moreover, various networks connecting application services with industrial devices have been considered another important piece of control systems, and break down the physical barrier due to the interconnection and intercommunication of networking technologies. As a result, the relatively isolated information island of original control systems abruptly turns into one wide-open and variable-running environment, and industrial specialized software and hardware can be easily invaded and destroyed due to more and more attack entrances and paths. In recent years, many destructive security incidents have occurred frequently all over the world, and industrial cyber threats have become the focus of attention [5,6].
Essentially, industrial cyber threats put a higher priority on damaging the correctness and availability of industrial automation control, because the incorrect or unavailable control logic in OT systems may result in even worse consequences [7], such as deadly fires and explosions. From a technical perspective, industrial cyber threats are concerned with two aspects: one is the information system-oriented threat, which refers to IT vulnerabilities; the other is the process control-oriented threat, which refers to OT vulnerabilities. Furthermore, the information-oriented threat usually exploits some potential vulnerabilities of IT systems to invade and attack their primary components or function units, and reaches the ultimate destination to steal sensitive information or cause a system crash [8,9]. Differently, the process control-oriented threat represents the OT-related attacks whose primary target is to destroy the normal production process when one control system is running smoothly and orderly [10,11]. More precisely, this threat may invalidate the production process by forcibly inserting some abnormal control commands, or cause alarm failure or error warning by intentionally changing the alarm threshold [12,13]. Typically, when one technological process of production is determined, its automated production line is also supposedly fixed, and the whole production procedure follows one machine-made control and monitoring process according to the specific workflow. Based on this characteristic, once malicious adversaries gain access to the automated production line, they can break the fixed running mode to cause various production operation failures. Therefore, the main characteristics shown by the process control-oriented threat can be summarized as follows: Based on the specific production process, this threat exploits the OT vulnerabilities of control logic relationships between different physical devices, and deploys some IT attack means to launch destructive attacks on process integrity and control availability. According to the information interaction in industrial automation control, the process control-oriented threat can be further classified into two categories: the threat affecting control command delivery and the threat affecting status information acquisition. To be specific, the former usually forges or tampers with some legal control commands which are sent to critical control devices, and results in abnormal or incorrect operations of control devices [9,12]. Dissimilarly, the latter always sends some mendacious or wrong field status information to the monitoring center in control systems, and attempts to cause status analysis failures for the whole production procedure [14].
As one feasible application-level security technology, industrial anomaly detection has received extensive attention and study, and it is mainly classified into two categories: traditional anomaly detection and ML-based (Machine Learning-based) anomaly detection [15,16]. Furthermore, one typical example of traditional anomaly detection is to identify abnormal communication behaviors by using the statistical-based or knowledge-based detection approach, which seems to have fine availability and robustness due to its straightforward feature extraction and simplified engine design [17,18]. Differently, ML-based anomaly detection belongs to one autonomic and intelligent threat identification technology with relatively complex characteristics, because it usually applies various AI (Artificial Intelligence) algorithms to characterize different data interaction patterns and train one or more high-performance detection engines. Moreover, AI algorithms have excellent self-learning and self-adaptation abilities, which are particularly suitable for analyzing the implicit data correlation and multi-dimensional behavior changes in industrial automation control [19]. More specifically, the AI algorithms applied in ML-based anomaly detection largely consist of the traditional machine learning algorithms and the deep learning algorithms: (1) the traditional machine learning algorithms, such as Neural Network [20], Support Vector Method [21], Clustering Algorithm [22], Genetic Algorithm [23] and Decision Tree [24], can offer a fast and convenient detection service due to their lower computational complexity, and are well-suited for the small sample data handling; (2) the deep learning algorithms, such as Long Short-Term Memory [25], Convolutional Neural Network [26] and Recurrent Neural Network [27], can possess excellent learning and adaptive abilities to exploit some potential correlations in a large quantity of data, and jointly execute and optimize the feature representation and classification training by designing some optimization algorithms [28,29]. However, these algorithms frequently require more computing resources and greater computing capability due to their high complexity, and may have an adverse effect on detection efficiency. As stated previously, industrial automation control periodically performs customizable operations according to the predefined production procedure, and its characteristics of finite state and stable pattern can tend to generate small-scale sample data [30]. Additionally, industrial security requirements also encourage strengthening the time-sensitive defense service due to the severity of the losses [5,31]. Therefore, ML-based anomaly detection with simple and efficient algorithms may become one of the preferred solutions in industrial cyber security defense.
From the perspective of field control and data acquisition, industrial automation control can be performed by three types of critical control devices: controller, sensor, and actuator, and these three devices work together to complete one normal control and monitoring process. Moreover, one representative control and monitoring process may be summarized as follows: First, sensors monitor and collect large sets of measuring data in real-time, and transmit these data to controllers. Second, controllers perform the scheduled logic control algorithm to generate control data, and send this data to actuators. Finally, according to the received control data, actuators execute the corresponding control commands to complete the production operations. In practice, the underlying goal of the process control-oriented threat is to change the original operation behaviors of physical systems by disturbing industrial control logic, and breaks the fixed running mode to destroy the normal production process [12,32]. In other words, the running anomaly caused by malicious attacks on three types of critical control devices can further reflect some irregular changes in measuring data and control data when one control system is running. On the one hand, when controllers are under attack, their generated control data may always consist of many abnormal control commands, and cause actuators to execute irregular production operations; on the other hand, when sensors are under attack, their collected measuring data may be maliciously forged or tampered with, and cause controllers to generate abnormal or incorrect control commands [33]. From this point of view, anomaly detection, which utilizes various ML-based algorithms to identify the process control-oriented threat, has become increasingly a real possibility, and some major studies and explorations have been carried out [34,35]. However, these existing studies can still consider the following two points: For one thing, the association relationship between measuring data and control data may have some potential benefits to ensure the completeness and stability of anomaly detection engines; for another, the complexity of ML-based algorithms may bring some effects on detection efficiency and detection coverage. In this paper, we propose one functional pattern-related anomaly detection approach, that skillfully collaborates the change-point detection approach with FSM (Finite State Machine) to identify abnormal behaviors between measuring data and control data. Furthermore, the BinSeg (Binary Segmentation) algorithm is chosen as one optimal change-point detection approach to perform the initial sequence segmentation of measuring data, and all divided sequence segments can be further classified and merged into different functional patterns by computing their backward difference means. Additionally, by sufficiently mining the association relationship between measuring data and control data, the Bayesian network is applied to obtain the domination set of each sensor, and the final FSM model is constructed as one feasible detection engine to identify industrial automation control anomalies. To evaluate the proposed approach, we use the SWaT dataset to perform a series of compared analyses, and the experimental results show that the BinSeg algorithm can be more suitable to perform the optimal change-point detection of measuring data in the sequence segmentation due to its three advantages (the better robustness, the higher detection accuracy and the less consuming time), and the proposed approach exhibits relatively excellent detection ability to identify the process control-oriented threat by comparing and analyzing three applicable indicators (the detection precision, recall rate and F1-score).
The main advantages and contributions of our approach are listed as follows: First, industrial automation control always provides a relatively stable running mode, and one normal control and monitoring process has the communication characteristics of periodicity and time sequence. In this premise, our approach is ideally suited to detect the process control-oriented threat whose main purpose is to destroy the above communication characteristics. Second, by comparing with other change-point detection approaches under different cost functions, our approach eventually turns out to be the excellent one to obtain all sequence segments of measuring data, which can provide basic support to train functional state transition models based on FSM. Finally, the stable running mode can generate a finite number of functional patterns and pattern transitions, which can perfectly meet the requirements to establish one FSM anomaly detection. Additionally, compared with other machine-learning detection engines, our approach has some nice performance advantages to detect most cyber attacks that destroy the normal control and monitoring processes in industrial production.
Based on the above contributions, our major objective involves the following three aspects: first of all, by performing the effective sequence segmentation of measuring data, we propose one functional pattern-related anomaly detection approach which applies FSM to build a normal behavior model, and we hope this approach can have the applicable detection ability to identify the process control-oriented threat; secondly, we summarize some communication characteristics and association relationships between measuring data and control data, and hope these can contribute to the development and improvement of other industrial security defense technologies; finally, we provide detailed descriptions of the process control-oriented threat, and hope this threat can be considered as one direction or breakthrough for industrial cyber security researches.
2 Sequence Segmentation and Pattern Generation
For industrial automation control, measuring data generally refers to one category of time-series data with continuous change regularities, and indicates the actual operating conditions under different control states. By using the change-point detection approach, measuring data can be divided into some sequence segments with different characteristics, and all sequence segments may have different lengths and time intervals. After that, the backward difference mean of each sequence segment can be further computed, and all sequence segments with similar backward difference means and lengths should be merged into one functional pattern.
2.1 Change-Point Detection Based on Binary Segmentation
We use the BinSeg algorithm to perform the optimal change-point detection of measuring data, and realize the initial sequence segmentation [36]. As one greedy sequential algorithm, this algorithm can quickly work out all change points due to its relatively low complexity, and output the approximate value of the optimal solution. Actually, this algorithm is well suited to measuring data, because it is widely applied in the sequence segmentation of univariate and multivariate data. The main procedures to perform the initial sequence segmentation of measuring data are listed as follows:
(1) According to Eq. (1), the first change point in the whole sequence of measuring data is determined.
Here,
Here,
Based on the above calculations, the first change point can be found by using the greedy search, and this change point is the one most capable of lowering the cost sum.
(2) When the first change point
In our approach, the AR (Auto-Regressive) model is selected as one viable cost function, because it has a much greater capacity to generate the future variable value with lower past information by using self-variable regression. Moreover, the AR model belongs to one linear regressive model, which uses the linear combination of some variable values in the previous period to determine the change of variable value. Supposing that
Here,
After computing the minimum sum of squared residuals, we can further obtain the least-squares estimates in the AR model [37], and the AR cost function on the interval
For each original sequence of measuring data, it is not possible to know the actual number of change points in advance. Therefore, we need to combine the BinSeg algorithm with the AR cost function
2.2 Pattern Generation Based on Backward Difference Mean
After performing the change-point detection based on the BinSeg algorithm, we can obtain all change points of measuring data, which are further used to generate different sequence segments. Specifically, we define the time-series data between two consecutive change points as one sequence segment, whose length may be different from one another. Additionally, each sequence segment represents one functional pattern, which is generated by classifying and merging all sequence segments with the same backward difference mean and length. To be precise, the obtained functional patterns can be regarded as all different states of sensors. The backward difference mean should be computed by
Here,
Different backward difference means can reflect the smooth or dramatic change degree in trend, and similar states of sensors have the same or approximately the same backward difference mean. Furthermore, random noises may bring out some redundant change points when performing the change-point detection based on the BinSeg algorithm, and the sequence segments divided by these change points belong to the same state of sensors. By comparing the backward difference means around each change point, we can classify the sequence segments with the same or approximately the same backward difference mean as one category; namely, if two backward difference means are similar or identical, their corresponding sequence segments are merged into the same functional pattern. Additionally, to accurately sort out all possible functional patterns, we also suppose that any two sequence segments with different lengths are classified as different functional patterns, even if they have the same or approximately the same backward difference mean.
According to the specific characteristics of each sequence segment, we can further give a formalized description of each functional pattern, which can provide a clear physical significance for each sequence segment. For example, we suppose the original measuring data can generate one functional pattern set
3 Pattern Association Analysis
In practical industrial fields, controllers usually collaborate with sensors and actuators to perform the scheduled industrial automation control according to some technological process of production. As a result, the corresponding control and monitoring process brings about a positive association relationship between sensors and actuators. Moreover, different states of actuators can cause changes in measuring data, which sensors monitor and collect in real-time. When the collected measuring data reaches a certain threshold, controllers can send new control data to actuators, and a state transition of actuators occurs consequently. However, it is extremely difficult to directly achieve the association relationship between sensors and actuators in control systems, and the main causes include two aspects: for one thing, the measuring data may be collected from many sensors in control systems, and the amount of measuring data is too large to intuitively distinguish each impact of different actuators; for another, measuring data and control data come from different devices, and no definite corresponding relationship is found to exist between these two types of data. When one state transition of actuators occurs, the characteristic of measuring data associated with these actuators inevitably changes, namely, one change point in the sequence of measuring data is successfully detected. From this point, we realize the backward inference to obtain the domination set of each sensor by judging the state transition of some actuators, when one change point in the sequence of measuring data is found. In practice, if one actuator undergoes the state transition between two adjacent sequence segments, we can confirm that this actuator has a pattern association with the observed sensor. Through the above analysis process, we can obtain the initial domination set of each sensor, and this set consists of some actuators that cause different pattern changes in this sensor.
Bayesian network is a probabilistic graph model that represents a set of random variables and their conditional dependencies by using DAG (Directed Acyclic Graph), and describes the joint probability distribution through CPT (Conditional Probability Table) [38]. In our pattern association analysis, we construct one directed acyclic graph to explain the association relationship between sensors and actuators. Moreover, all sensors and actuators are designed as attribute nodes, and each directed edge represents the probabilistic dependency relationship between sensors and actuators. As a simplified example, Fig. 1 shows a possible Bayesian network constructed by some sensors and actuators. In this figure,
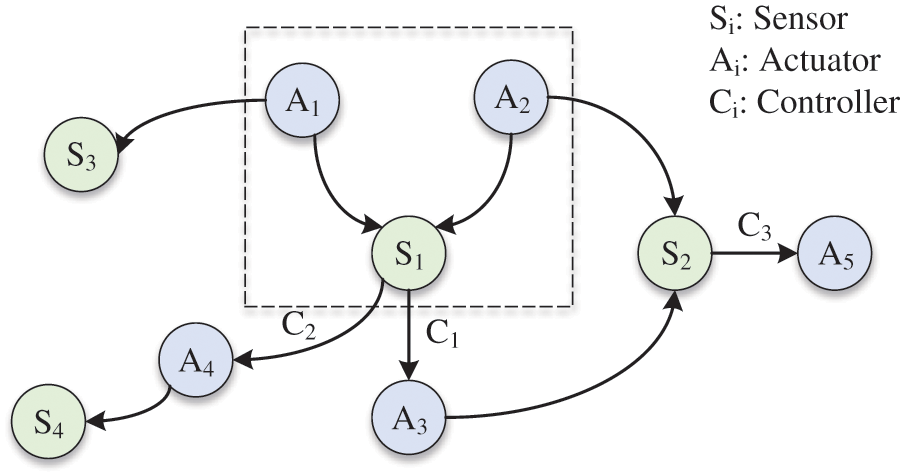
Figure 1: An example of Bayesian network constructed by sensors and actuators
Suppose that
Here,
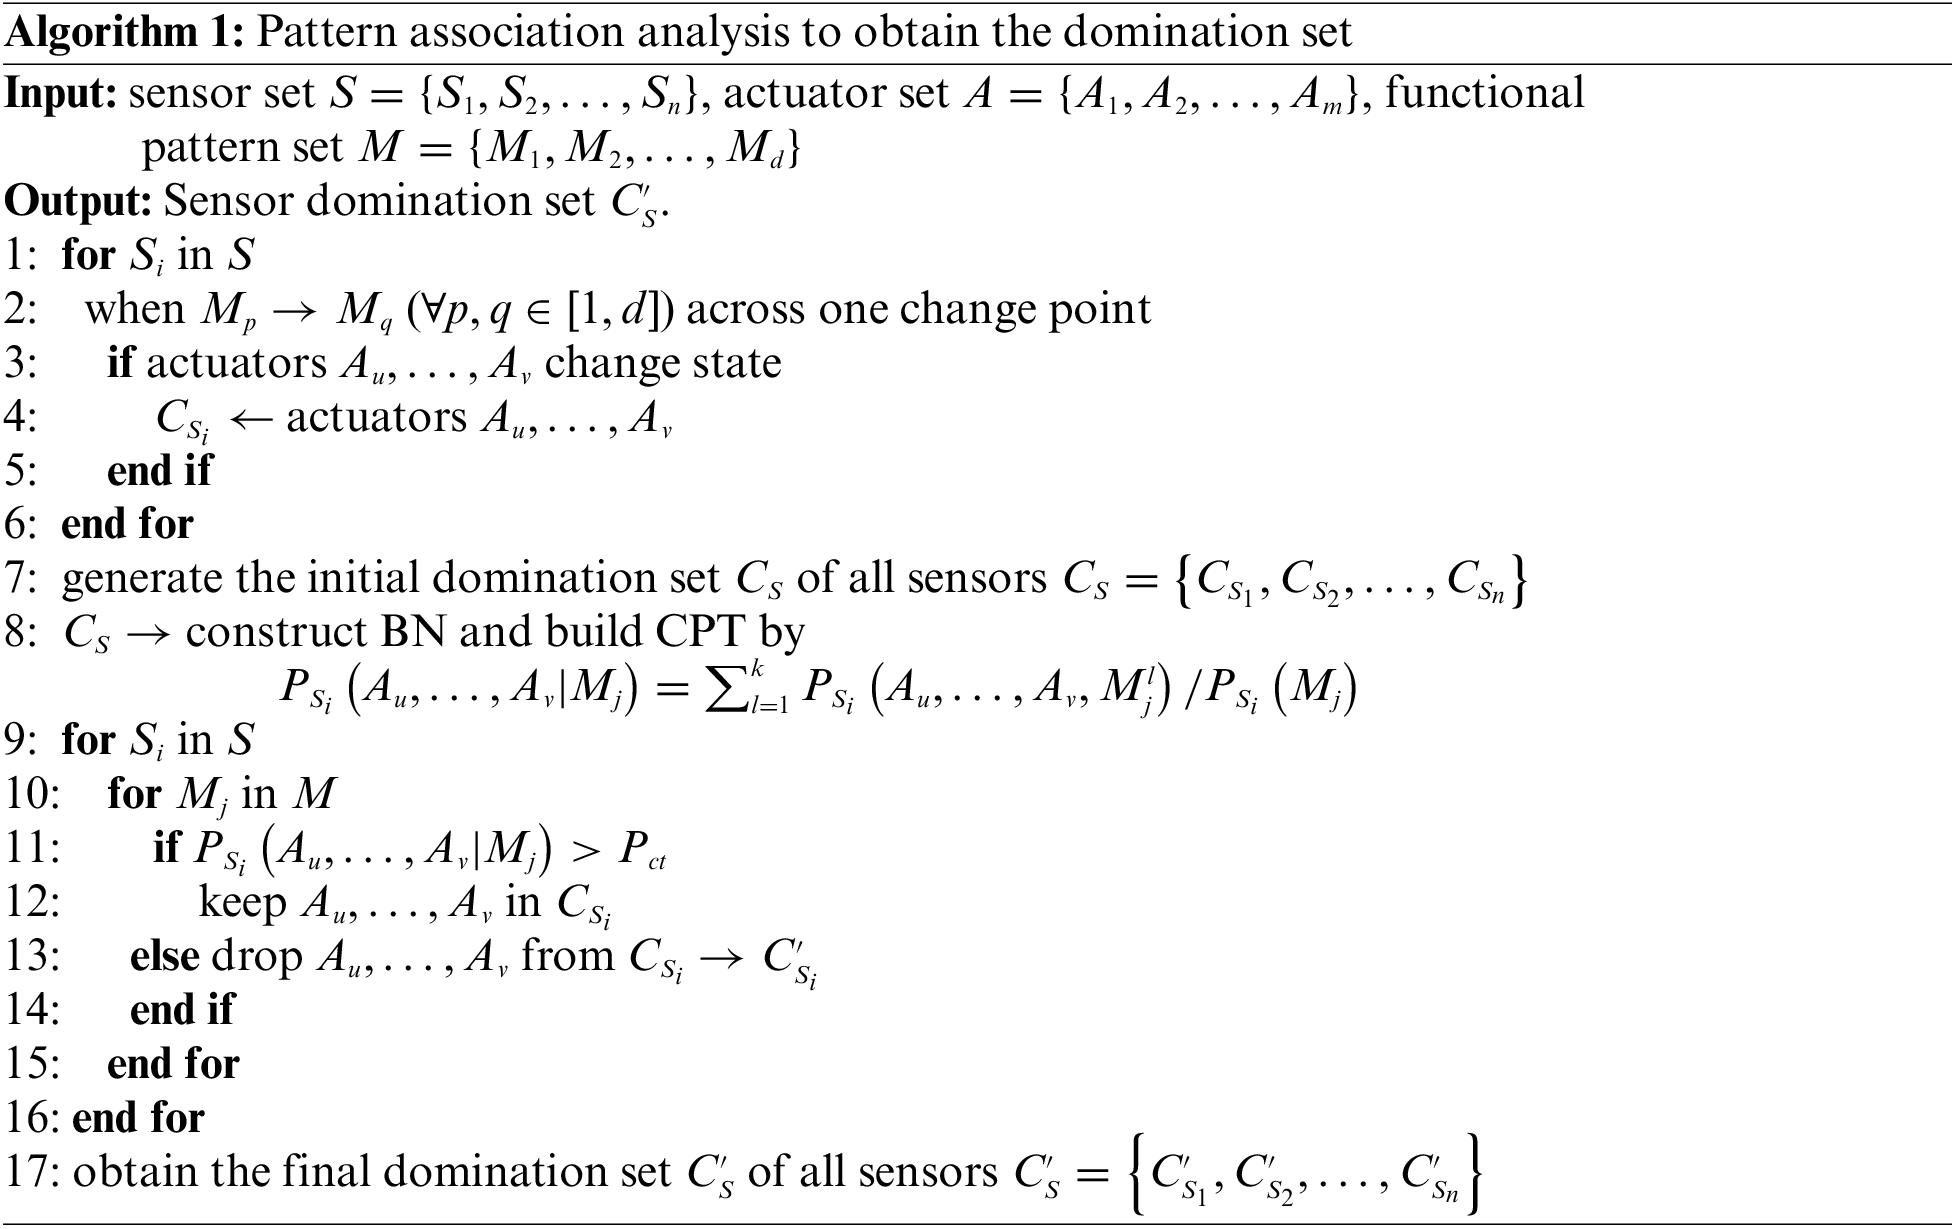
Based on the above analysis, the construction of the domination set aims to learn the structure of the Bayesian network, and determines all parent nodes of each sensor. In this construction process, we need to calculate all the conditional probabilities of each sensor to build its conditional probability table, which can guide us in determining the dependency relationship between one actuator and this sensor. Moreover, under a certain state of one actuator, if the corresponding conditional probability of this sensor exceeds the predefined confidence threshold
FSM belongs to one abstract computational model, which is applied to describe the dynamic system with inherent randomness [39]. According to the obtained functional pattern set and domination set, we can use FSM to establish one functional state transition model, that accurately describes the normal control and monitoring process. In this model, each functional pattern can be regarded as one state of FSM, and each domination set related to this functional pattern is considered the input signal to trigger the state transition. Moreover, this model properly belongs to one Mealy machine, because it is built by two important components: the functional pattern and the domination set. In practice, this model can perfectly meet the FSM’s requirements, and the chief reasons are summarized as follows: firstly, the regular measuring data and control data imply a degree of repeatability due to the cyclical and customizable production procedure, and the BinSeg algorithm can generate a finite number of sequence segments; secondly, all sequence segments with similar characteristics can be merged to one functional pattern, which can qualitatively denote one physical significance or change trend by the formalized description; finally, the pattern association analysis not only gives the final domination set of sensors, but also clearly explains the pattern transition process under different states of actuators.
Fig. 2 depicts an example of a functional state transition model based on FSM. In this model,
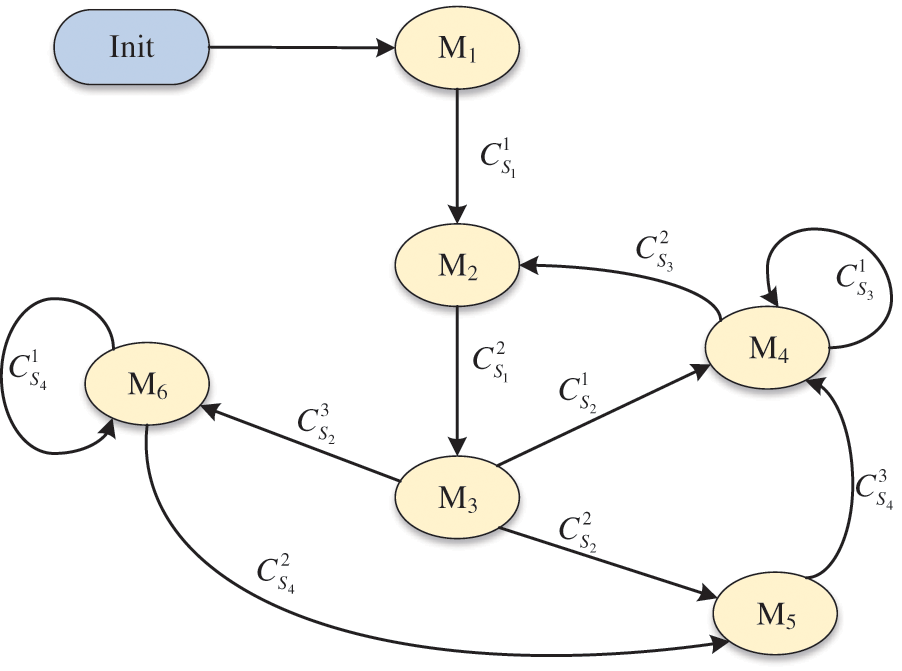
Figure 2: An example of functional state transition model based on FSM
Based on industrial characteristics of periodicity and continuity, we can use a lot of regular measuring data and control data to train one normal functional state transition model, which can accurately describe the whole control and monitoring process in practical industrial fields. By comparing the observed measuring data with this model, the devastating process control-oriented threat can be effectively identified. Moreover, the basic judgment criterion of anomaly detection consists of two parts: for one thing, if one unfamiliar functional pattern generated from the observed measuring data differs from any functional pattern in the trained model, some abnormal measuring data caused by one threat may exist in this unknown functional pattern; for another thing, if one unfamiliar pattern transition that in reality does not exist in the trained model is suddenly triggered, some abnormal measuring data caused by one threat may result in this unknown pattern transition. Additionally, to enhance its scalability and efficiency, if one complicated control and monitoring process may include different stages, the corresponding measuring data and control data in each stage can be used to train one small-scale functional state transition model, which can further be applied to identify anomalies existing in its stage.
If one sequence segment is identified as one abnormal functional pattern according to the basic judgment criterion, this sequence segment must contain some abnormal measuring data caused by certain cyber threats. However, this sequence segment may also involve lots of normal measuring data, which can have a negative effect on detection precision. To accurately isolate normal measuring data from one abnormal sequence segment, we further perform deep detection by defining the slope-change trend. More specifically, the main process of deep detection is described as follows: firstly, if some measuring data in the abnormal sequence segment obviously exceed the highest value in the normal production process, these measuring data can be directly considered as abnormal measuring data; secondly, the rest of measuring data can be divided into a group of short sequences with the same length, and the slope-change trend of each short sequence is calculated according to Eq. (7); thirdly, the slope-change trend of one normal functional pattern in the established functional state transition model is also calculated, and this normal functional pattern can be confirmed by the previous functional pattern and actuator state of this abnormal sequence segment; finally, we further compare the slope-change trend of each short sequence with the one of normal functional pattern, and the corresponding short sequence can be regarded as normal measuring data if the compared result is consistent. The slope-change trend is defined by
Here,
5 Experimental Result and Analysis
To evaluate the proposed anomaly detection approach, we perform some comparison experiments to verify its detection performance by using the typical SWaT (Secure Water Treatment) dataset. Furthermore, the SWaT system is a secure water treatment testbed that consists of a modern six-stage process, and some pre-set cyber attacks are launched to destroy its control and monitoring process in different stages. In our experimental analysis, we consider the measuring data and control data in the P1 stage as feasible experimental data, because the cyber attacks in this stage can exercise a negative influence on these data through some sophisticated technologies, such as sensor measurement spoofing and malicious control command forging. Moreover, the measuring data and control data in the P1 stage totally contain over about 165,000 records, and their collection time (running time) is about 26 hours. Additionally, these data cover 10 different attack types, whose attack points are different critical control devices in the P1 stage, and Table 1 shows some critical control devices and their labels in the P1 stage. Additionally, we use Python to analyze the experimental data, and all experiments run on a PC with a 2.4 GHz Intel Core i5-10200H CPU, 16 GB RAM, and 256 GB solid-state storage.

5.1 Compared Evaluation on Binary Segmentation
We perform the change-point detection of measuring data which is collected in the P1 stage, and our main purpose is to explain the correctness and advantage of the BinSeg algorithm. Furthermore, we select the measuring data with a fixed length as the original experimental data, and these data have several verified change points. Additionally, we compare the different detection performances of four change-point detection approaches, which are BinSeg, Pelt, BottomUp (Bottom-Up segmentation) and WinSlid (Window Sliding segmentation). In each approach, three different cost functions are further considered to achieve one optimal effect, and various penalties are carefully chosen according to the apriori knowledge. Table 2 shows the compared results of four change-point detection approaches. In this table, we focus on two aspects: on the one hand, the large Hausdorff distance means that one considerable error between the detected change points and the verified change points exists or an excess of wrong change points is detected, and its immediate aftermath can bring greater uncertainty of anomaly detection; on the other hand, if the F1-score trends closer to 1, the number of detected change points is the same as the number of verified change points, and the number of wrong change points is the lowest.

Compared with other approaches, the Pelt and BinSeg algorithms with the AR cost function exhibit some similar detection properties: for Hausdorff distance, the corresponding values are 12 and 13, respectively, which are two minimum distances in all change-point detection approaches with different cost functions; for F1-score, both of them can reach 1, which represents the optimum accuracy in all change-point detection approaches with different cost functions. Additionally, it is worth mentioning that some F1-score values of the WinSlid algorithm are nonexistent, because both their detection precisions and detection recall rates are zero. From the above analysis we can conclude that, the Pelt and BinSeg algorithms can be regarded as two alternative change-point detection approaches in our sequence segmentation.
However, industrial automation control has the characteristics of high real-time ability and high reliability, that is, the consuming time to perform the sequence segmentation should be as little as possible. Fig. 3 depicts the consuming time comparison between the Pelt and BinSeg algorithms with the AR cost function. Statistically speaking, the average consuming time of the BinSeg algorithm is 0.43 s, and the average consuming time of the Pelt algorithm is 6.71 s. Obviously, the BinSeg algorithm with the AR cost function takes less consuming time to detect all change points, which may have better advantages to meeting industrial characteristics. As a whole, the BinSeg algorithm with AR cost function can be more suitable for our sequence segmentation to perform the optimal change-point detection of measuring data because of the following three advantages: the better robustness, the higher detection accuracy, and the less consuming time.
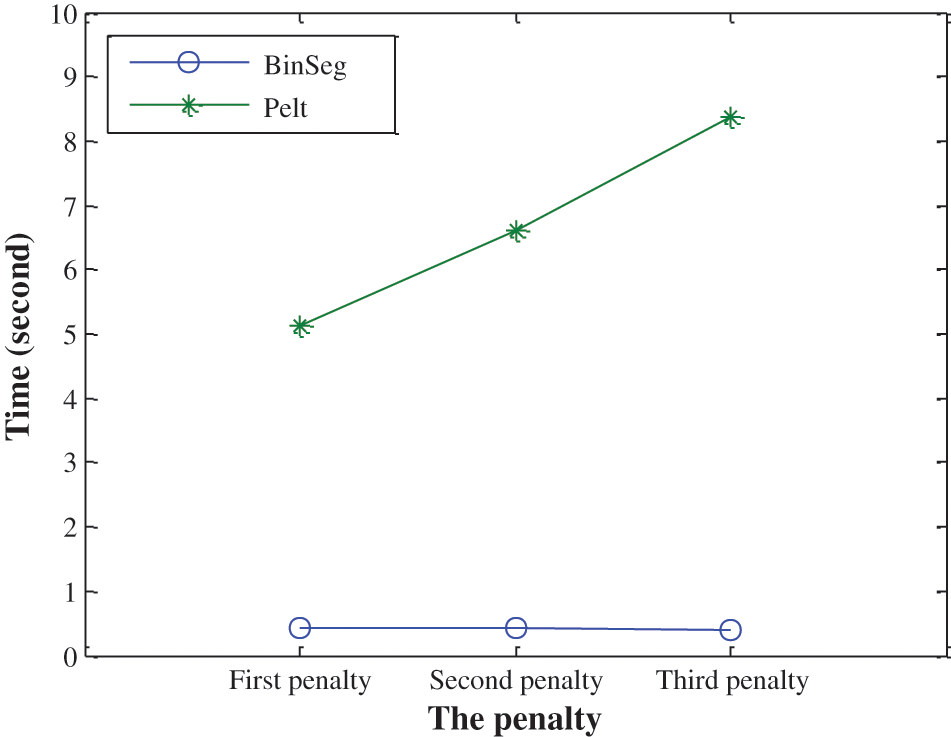
Figure 3: Consuming time comparison between the Pelt and BinSeg algorithms
5.2 Pattern Association and Domination Set Analysis
After detecting all actual change points of measuring data, we can classify all sequence segments into different functional patterns by comparing their backward difference means and lengths, and give a clear physical significance for each functional pattern. To evaluate the pattern association between sensors and actuators, we select two segments of representative measuring data to calculate their conditional probability tables, because the obtained functional patterns in these measuring data have characteristics of frequency and repeatability in the P1 stage. Fig. 4 shows eight functional patterns
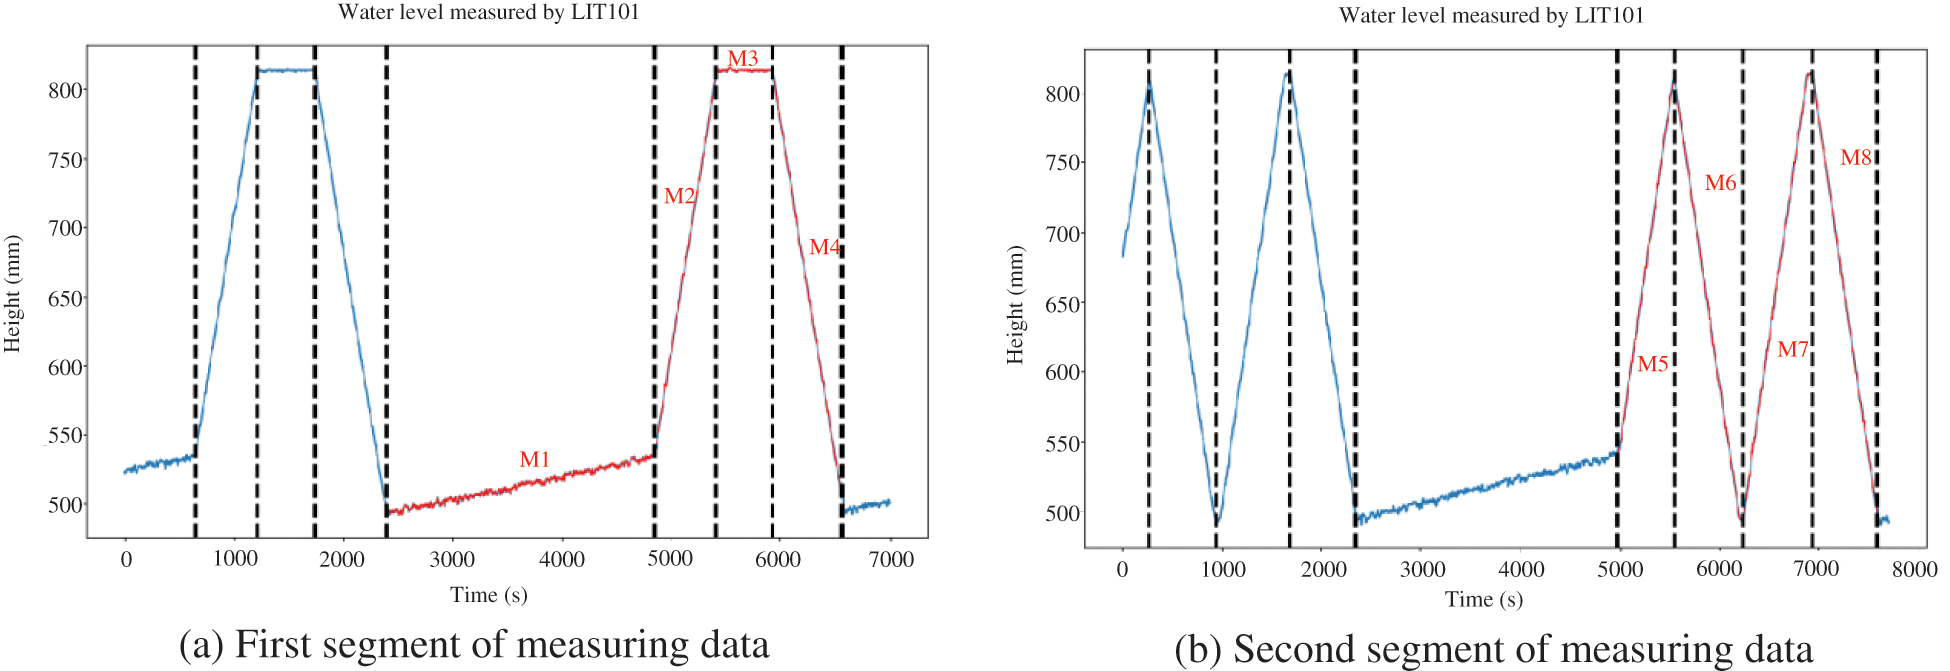
Figure 4: Eight functional patterns of LIT101 under selected segments of measuring data
As stated previously, if some actuators undergo the state transition between two adjacent functional patterns, these actuators are strongly linked to the observed sensor, and can be assigned to its initial domination set. In our experiments, by analyzing the selected measuring data and control data, we find that when the measuring data of LIT101 changes from one functional pattern to another functional pattern, some new control data are sent to the actuators MV101 and P101, and one state transition of these two actuators occurs consequently. In other words, the initial domination set of LIT101 can be considered
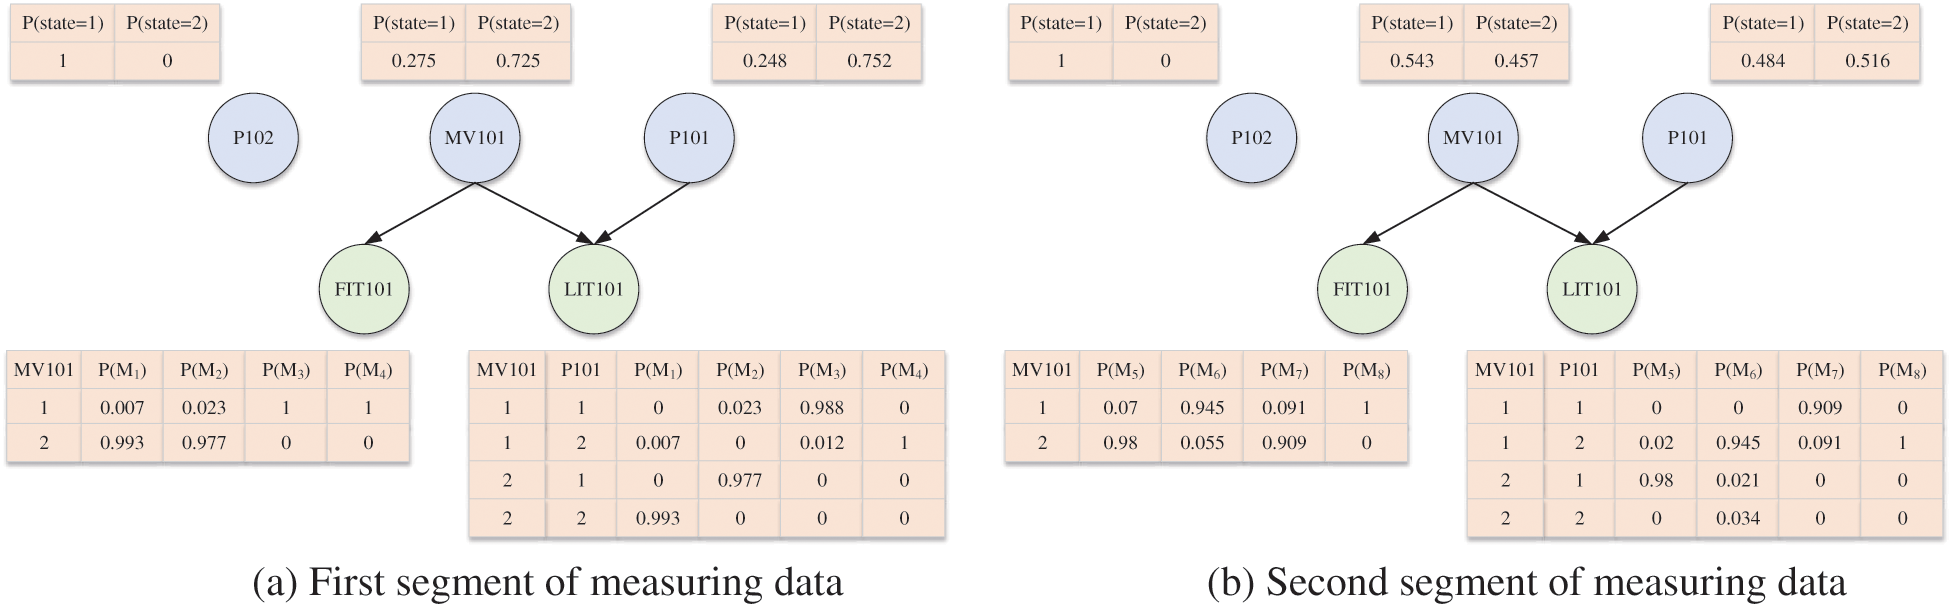
Figure 5: Association relationship and conditional probability table of each control device
In the P1 stage, all actuators relate to two different states: 1 represents the closed state, and 2 represents the open state; that is, each functional pattern can be dominated by a state combination of these actuators. In Fig. 5, we focus on the conditional probability tables of FIT101 and LIT101, and draw some intuitive conclusions: for one thing, FIT101 is directly affected by MV101, because its conditional probability is large enough when the state of MV101 is open, namely
5.3 Detection Performance Evaluation
After obtaining the final domination set of LIT101, we can further use FSM to establish the functional state transition model of LIT101 in the P1 stage, and Fig. 6 shows this model which can accurately describe the normal control and monitoring process in the P1 stage. Moreover, this model covers 16 different functional patterns

Figure 6: The established functional state transition model based on FSM in the P1 stage
Based on the above model, we select three applicable indicators to evaluate the detection ability of the proposed approach, and these indicators include detection precision, recall rate, and F1-score. Moreover, we analyze these indicators for 10 different attack types in the P1 stage, whose main objective is to destroy the normal control and monitoring process by attacking the critical control devices. Table 3 gives the attack point and attack description for all 10 attack types, and shows the experimental results for each attack in the P1 stage. On the whole, the proposed approach exhibits relatively excellent detection ability to identify 10 different attacks, because the average detection precision and recall rate can reach 0.872 and 0.982, respectively. Also, the average F1-score is 0.896 which is close to 1, and this value strongly suggests that the proposed approach has fine detection stability, which can coordinate the balance between detection precision and recall rate. In practice, for the majority of attack types, their detection precisions can exceed 90%, which may refer to a relatively ideal level for one professional detection approach. However, for attack types 2 and 8, their detection precisions are only 0.825 and 0.196, which are largely responsible for the significant deterioration of average detection precision. Furthermore, the main reason for attack type 2 is that this attack simultaneously opens P101 and P102, which can cause a rapid drop in water level. In other words, this attack only increases the drop speed of the water level, and its corresponding functional pattern still contains a small number of normal measuring data which can be regarded as abnormal data. Differently, the main reason for the attack type 8 is that this attack opens P102 when closing P101, which only causes some weak or indiscernible changes in water level. Additionally, this attack is of short duration, and the corresponding number of abnormal measuring data is very small. Therefore, the detection precision of attack type 2 is very low.

We also compare the detection performance with other machine-learning detection engines, and Table 4 shows the compared results on detection precision, recall rate, and F1-score. From this table, we can see that although the detection precision is slightly lower than other detection engines, the proposed approach exhibits the best recall rate and F1-score. Also, the higher recall rate can provide direct support that the proposed approach can enlarge the detection coverage and improve the detection integrity. In practice, if we ignore attack type 8, the average detection precision of other 9 attacks can also reach 0.947, which can make the proposed approach alongside the others. To sum up, the proposed approach has some nice performance advantages for detecting most cyber attacks that destroy the normal control and monitoring process in industrial production.

By analyzing the characteristics of industrial automation control, this paper proposes one functional pattern-related anomaly detection approach, whose main objective is to effectively identify industrial cyber threats, especially the process control-oriented threat in control systems. Moreover, the proposed approach mainly consists of three parts: First, the BinSeg algorithm is used to perform the optimal change-point detection of measuring data, and all divided sequence segments are classified and merged into different functional patterns according to the backward difference mean and length. Second, the pattern association analysis applies a Bayesian network to obtain the domination set of each sensor, which describes the dependency relationship between actuators and sensors. Third, according to the obtained functional patterns and the domination set, one functional state transition model based on FSM is established as the feasible detection engine, which can accurately describe the whole control and monitoring process. To evaluate the proposed approach, we perform some compared experiments by using the typical SWaT dataset, and the experimental results fully verify that: (1) our approach can achieve a relatively ideal detection precision and recall rate, both of which exceed 90% for the majority of attack types; and (2) the high F1-score also explains that our approach has fine detection stability. Although our approach exhibits the relatively excellent detection ability to identify the process control-oriented threat, some problems still deserves further investigation, mainly including: firstly, for some complicated control and monitoring process that involves lots of critical control devices, the pattern association analysis may become one bottleneck problem due to its degraded performance; secondly, there is still room to improve the detection precision for some special attacks; thirdly, because one complicated control and monitoring process may generate one large-scale functional state transition model, the overfitting and model tuning is further required to guarantee the fine enough detection performance [26,44,45].
Acknowledgement: The authors are grateful to the anonymous referees for their insightful comments and suggestions.
Funding Statement: This work is supported by the Hainan Provincial Natural Science Foundation of China (Grant No. 620RC562), the Liaoning Provincial Natural Science Foundation: Industrial Internet Identification Data Association Analysis Based on Machine Online Learning (Grant No. 2022-KF-12-11) and the Scientific Research Project of Educational Department of Liaoning Province (Grant No. LJKZ0082).
Author Contributions: The authors confirm contribution to the paper as follows: study conception and design: M. Wan, J. Yao; data collection, analysis and interpretation of results: H. Lei, J. Li; draft manuscript preparation: M. Wan, J. Yao, Y. Song. All authors reviewed the results and approved the final version of the manuscript.
Availability of Data and Materials: The analyzed SWaT dataset for this study can be found in the link https://itrust.sutd.edu.sg/testbeds/secure-water-treatment-swat/. The original contributions presented in the study are included in the manuscript, further inquiries can be directed to the corresponding author.
Conflicts of Interest: The authors declare that they have no conflicts of interest to report regarding the present study.
References
1. S. Mubarak, M. Hadi Habaebi, M. Rafiqul Islam, A. Balla, M. Tahir et al., “Industrial datasets with ICS testbed and attack detection using machine learning techniques,” Intelligent Automation & Soft Computing, vol. 31, no. 3, pp. 1345–1360, 2022. [Google Scholar]
2. L. Ma, N. Li, Y. Guo, X. Wang, S. Yang et al., “Learning to optimize: Reference vector reinforcement learning adaption to constrained many-objective optimization of industrial copper burdening system,” IEEE Transactions on Cybernetics, vol. 52, no. 12, pp. 12698–12711, 2022. [Google Scholar] [PubMed]
3. V. Lesi, Z. Jakovljevic and M. Pajic, “Security analysis for distributed IoT-based industrial automation,” IEEE Transactions on Automation Science and Engineering, vol. 19, no. 4, pp. 3093–3108, 2022. [Google Scholar]
4. M. Wan, Q. Li, J. Yao, Y. Song, Y. Liu et al., “Compared insights on machine-learning anomaly detection for process control feature,” Computers, Materials & Continua, vol. 73, no. 2, pp. 4033–4049, 2022. [Google Scholar]
5. M. Conti, D. Donadel and F. Turrin, “A survey on industrial control system testbeds and datasets for security research,” IEEE Communications Surveys & Tutorials, vol. 23, no. 4, pp. 2248–2294, 2021. [Google Scholar]
6. W. Duo, M. Zhou and A. Abusorrah, “A survey of cyber attacks on cyber physical systems: Recent advances and challenges,” IEEE/CAA Journal of Automatica Sinica, vol. 9, no. 5, pp. 784–800, 2022. [Google Scholar]
7. G. M. Makrakis, C. Kolias, G. Kambourakis, C. Rieger and J. Benjamin, “Industrial and critical infrastructure security: Technical analysis of real-life security incidents,” IEEE Access, vol. 9, pp. 165295–165325, 2021. [Google Scholar]
8. M. Alanazi, A. Mahmood and M. J. M. Chowdhury, “SCADA vulnerabilities and attacks: A review of the state-of-the-art and open issues,” Computers & Security, vol. 125, pp. 1–29, 2023. [Google Scholar]
9. S. D. D. Anton, D. Fraunholz, D. Krohmer, D. Reti, D. Schneider et al., “The global state of security in industrial control systems: An empirical analysis of vulnerabilities around the world,” IEEE Internet of Things Journal, vol. 8, no. 24, pp. 17525–17540, 2021. [Google Scholar]
10. A. H. E. l-Kady, S. Halim, M. M. El-Halwagi and F. Khan, “Analysis of safety and security challenges and opportunities related to cyber-physical systems,” Process Safety and Environmental Protection, vol. 173, pp. 384–413, 2023. [Google Scholar]
11. S. Khan and S. Madnick, “Cybersafety: A system-theoretic approach to identify cyber-vulnerabilities & mitigation requirements in industrial control systems,” IEEE Transactions on Dependable and Secure Computing, vol. 19, no. 5, pp. 3312–3328, 2022. [Google Scholar]
12. I. Siniosoglou, P. Radoglou-Grammatikis, G. Efstathopoulos, P. Fouliras and P. Sarigiannidis, “A unified deep learning anomaly detection and classification approach for smart grid environments,” IEEE Transactions on Network and Service Management, vol. 18, no. 2, pp. 1137–1151, 2021. [Google Scholar]
13. A. Andreu, “Operational technology security–a data perspective,” Network Security, no. 1, pp. 8–13, 2020. [Google Scholar]
14. V. Sklyar and V. Kharchenko, “ENISA documents in cybersecurity assurance for Industry 4.0: IIoT threats and attacks scenarios,” in in 2019 10th IEEE Int. Conf. on Intelligent Data Acquisition and Advanced Computing Systems: Technology and Applications (IDAACS), Metz, France, pp. 1046–1049, 2019. [Google Scholar]
15. M. Wan, J. Li, Y. Liu, J. Zhao and J. Wang, “Characteristic insights on industrial cyber security and popular defense mechanisms,” China Communications, vol. 18, no. 1, pp. 130–150, 2021. [Google Scholar]
16. M. Fahim and A. Sillitti, “Anomaly detection, analysis and prediction techniques in IoT environment: A systematic literature review,” IEEE Access, vol. 7, pp. 81664–81681, 2019. [Google Scholar]
17. T. Zhou, K. Xiahou, L. L. Zhang and Q. H. Wu, “Real-time detection of cyber-physical false data injection attacks on power systems,” IEEE Transactions on Industrial Informatics, vol. 17, no. 10, pp. 6810–6819, 2021. [Google Scholar]
18. M. Rodríguez, D. P. Tobón and D. Múnera, “Anomaly classification in industrial Internet of Things: A review,” Intelligent Systems with Applications, vol. 18, pp. 1–13, 2023. [Google Scholar]
19. A. Bécue, I. Praça and J. Gama, “Artificial intelligence, cyber-threats and Industry 4.0: Challenges and opportunities,” Artificial Intelligence Review, vol. 54, no. 2, pp. 3849–3886, 2021. [Google Scholar]
20. L. Ma, N. Li, G. Yu, X. Geng, S. Cheng et al., “Pareto-wise ranking classifier for multi-objective evolutionary neural architecture search,” IEEE Transactions on Evolutionary Computation, pp. 1–12, 2023. https://doi.org/10.1109/TEVC.2023.3314766 [Google Scholar] [CrossRef]
21. M. Esmalifalak, L. Liu, N. Nguyen, R. Zheng and Z. Han, “Detecting stealthy false data injection using machine learning in smart grid,” IEEE Systems Journal, vol. 11, no. 3, pp. 1644–1652, 2017. [Google Scholar]
22. R. F. Mansour, “Blockchain assisted clustering with intrusion detection system for industrial Internet of Things environment,” Expert Systems with Applications, vol. 207, pp. 1–9, 2022. [Google Scholar]
23. X. Deng, P. Jiang, X. Peng and C. Mi, “An intelligent outlier detection method with one class support tucker machine and genetic algorithm toward big sensor data in Internet of Things,” IEEE Transactions on Industrial Electronics, vol. 66, no. 6, pp. 4672–4683, 2019. [Google Scholar]
24. A. N. Jahromi, H. Karimipour, A. Dehghantanha and K. R. Choo, “Toward detection and attribution of cyber-attacks in IoT-enabled cyber-physical systems,” IEEE Internet of Things Journal, vol. 8, no. 17, pp. 13712–13722, 2021. [Google Scholar]
25. W. Hao, T. Yang and Q. Yang, “Hybrid statistical-machine learning for real-time anomaly detection in industrial cyber-physical systems,” IEEE Transactions on Automation Science and Engineering, vol. 20, no. 1, pp. 32–46, 2023. [Google Scholar]
26. M. A. Haq, M. A. R. Khan and T. AL-Harbi, “Development of pccnn-based network intrusion detection system for edge computing,” Computers, Materials & Continua, vol. 71, no. 1, pp. 1769–1788, 2022. [Google Scholar]
27. N. Li, L. Ma, G. Yu, B. Xue, M. Zhang et al., “Survey on evolutionary deep learning: Principles, algorithms, applications and open issues,” ACM Computing Surveys, vol. 56, no. 2, pp. 1–34, 2023. [Google Scholar]
28. L. Ma, S. Cheng and Y. Shi, “Enhancing learning efficiency of brain storm optimization via orthogonal learning design,” IEEE Transactions on Systems, Man, and Cybernetics: Systems, vol. 51, no. 11, pp. 6723–6742, 2021. [Google Scholar]
29. L. Ma, M. Huang, S. Yang, R. Wang and X. Wang, “An adaptive localized decision variable analysis approach to large-scale multiobjective and many-objective optimization,” IEEE Transactions on Cybernetics, vol. 52, no. 7, pp. 6684–6696, 2022. [Google Scholar] [PubMed]
30. W. Zhou, X. Kong, K. Li, X. Li, L. Ren et al., “Attack sample generation algorithm based on data association group by GAN in industrial control dataset,” Computer Communications, vol. 173, pp. 206–213, 2021. [Google Scholar]
31. M. T. Khan and I. Tomić, “Securing industrial cyber-physical systems: A run-time multilayer monitoring,” IEEE Transactions on Industrial Informatics, vol. 17, no. 9, pp. 6251–6259, 2021. [Google Scholar]
32. C. Kim and D. Robinson, “Modbus monitoring for networked control systems of cyber-defensive architecture,” in 2017 Annual IEEE Int. Systems Conf. (SysCon), Montreal, Quebec, Canada, pp. 1–6, 2017. [Google Scholar]
33. J. Chen, X. Gao, R. Deng, Y. He, C. Fang et al., “Generating adversarial examples against machine learning-based intrusion detector in industrial control systems,” IEEE Transactions on Dependable and Secure Computing, vol. 19, no. 3, pp. 1810–1825, 2022. [Google Scholar]
34. M. R. G. Raman and A. P. Mathur, “A hybrid physics-based data-driven framework for anomaly detection in industrial control systems,” IEEE Transactions on Systems, Man, and Cybernetics: Systems, vol. 52, no. 9, pp. 6003–6014, 2022. [Google Scholar]
35. S. Adepu and A. Mathur, “Distributed attack detection in a water treatment plant: Method and case study,” IEEE Transactions on Dependable and Secure Computing, vol. 18, no. 1, pp. 86–99, 2021. [Google Scholar]
36. C. Truong, L. Oudre and N. Vayatis, “Selective review of offline change point detection methods,” Signal Processing, vol. 167, pp. 1–58, 2020. [Google Scholar]
37. J. Bai, “Vector autoregressive models with structural changes in regression coefficients and in variance-covariance matrices,” Annals of Economics and Finance, vol. 1, no. 2, pp. 303–339, 2000. [Google Scholar]
38. B. Cai, X. Kong, Y. Liu, J. Lin, X. Yuan et al., “Application of Bayesian networks in reliability evaluation,” IEEE Transactions on Industrial Informatics, vol. 15, no. 4, pp. 2146–2157, 2019. [Google Scholar]
39. S. Ali, H. Sun and Y. Zhao, “Model learning: A survey of foundations, tools and applications,” Frontiers of Computer Science, vol. 15, no. 5, pp. 1–43, 2021. [Google Scholar]
40. M. Kravchik and A. Shabtai, “Efficient cyber attack detection in industrial control systems using lightweight neural networks and PCA,” IEEE Transactions on Dependable and Secure Computing, vol. 19, no. 4, pp. 2179–2197, 2022. [Google Scholar]
41. J. Inoue, Y. Yamagata, Y. Chen, C. M. Poskitt and J. Sun, “Anomaly detection for a water treatment system using unsupervised machine learning,” in 2017 IEEE Int. Conf. on Data Mining Workshops (ICDMW), New Orleans, LA, USA, pp. 1058–1065, 2017. [Google Scholar]
42. Q. Lin, S. Adepu, S. Verwer and A. Mathur, “Tabor: A graphical model based approach for anomaly detection in industrial control systems,” in 2018 ACM Asia Conf. on Computer and Communications Security (ASIACCS), Incheon, Korea, pp. 525–536, 2018. [Google Scholar]
43. M. Kravchik and A. Shabtai, “Detecting cyber attacks in industrial control systems using convolutional neural networks,” in in 2018 ACM Workshop on Cyber-Physical Systems Security and Privacy (CPS-SPC), Toronto, Canada, pp. 72–83, 2018. [Google Scholar]
44. M. A. Haq, I. Khan, A. Ahmed, S. M. Eldin, A. Alshehri et al., “DCNNBT: A novel deep convolution neural network-based brain tumor classification model,” Fractals, vol. 31, no. 6, pp. 1–26, 2023. [Google Scholar]
45. M. A. Haq, “DBoTPM: A deep neural network-based botnet prediction model,” Electronics, vol. 12, no. 5, pp. 1–14, 2023. [Google Scholar]
Cite This Article
 Copyright © 2023 The Author(s). Published by Tech Science Press.
This work is licensed under a Creative Commons Attribution 4.0 International License , which permits unrestricted use, distribution, and reproduction in any medium, provided the original work is properly cited.
 Downloads
 Citation Tools