
 Submit a Paper
 Propose a Special lssue
 Open Access
ARTICLE

Asymmetric Loss Based on Image Properties for Deep Learning-Based Image Restoration
Henan Key Laboratory of Imaging and Intelligent Processing, PLA Strategic Support Force Information Engineering University, Zhengzhou, 450000, China
* Corresponding Author: Bin Yan. Email:
(This article belongs to the Special Issue: Advances and Applications in Signal, Image and Video Processing)
Computers, Materials & Continua 2023, 77(3), 3367-3386. https://doi.org/10.32604/cmc.2023.045878
Received 10 September 2023; Accepted 30 October 2023; Issue published 26 December 2023
 View Full Text
 Download PDF
Abstract
Deep learning techniques have significantly improved image restoration tasks in recent years. As a crucial component of deep learning, the loss function plays a key role in network optimization and performance enhancement. However, the currently prevalent loss functions assign equal weight to each pixel point during loss calculation, which hampers the ability to reflect the roles of different pixel points and fails to exploit the image’s characteristics fully. To address this issue, this study proposes an asymmetric loss function based on the image and data characteristics of the image recovery task. This novel loss function can adjust the weight of the reconstruction loss based on the grey value of different pixel points, thereby effectively optimizing the network training by differentially utilizing the grey information from the original image. Specifically, we calculate a weight factor for each pixel point based on its grey value and combine it with the reconstruction loss to create a new loss function. This ensures that pixel points with smaller grey values receive greater attention, improving network recovery. In order to verify the effectiveness of the proposed asymmetric loss function, we conducted experimental tests in the image super-resolution task. The experimental results show that the model with the introduction of asymmetric loss weights improves all the indexes of the processing results without increasing the training time. In the typical super-resolution network SRCNN, by introducing asymmetric weights, it is possible to improve the peak signal-to-noise ratio (PSNR) by up to about 0.5%, the structural similarity index (SSIM) by up to about 0.3%, and reduce the root-mean-square error (RMSE) by up to about 1.7% with essentially no increase in training time. In addition, we also further tested the performance of the proposed method in the denoising task to verify the potential applicability of the method in the image restoration task.Keywords
Artificial Intelligence (AI) technology has developed significantly in recent decades and achieved success in many fields [1,2] (e.g., robotics, regression analysis, pattern recognition, etc.). Deep learning, as one of the representative techniques of AI technology, has been rapidly developed in the field of computer vision with the improvement of computational resources, especially in image processing tasks (e.g., denoising [3], super-resolution [4], segmentation [5], and style conversion [6], etc.), where it has demonstrated good processing results. In order to further improve the accuracy of processing results and the effectiveness of information expression in deep learning methods, a large number of network processing models with promising results have been proposed by relevant researchers. In order to optimize the design for specific problems, related researchers have developed new network architectures [7,8]. Meanwhile, to enhance the interpretability of neural networks, a large number of research works have explored understanding the internal mechanisms of neural networks and their inherent limitations. For example, by developing reverse processing networks [9] or trying to spoof networks with specific inputs [10].
The essential components of deep neural networks include forward propagation, backpropagation, optimization, activation function and loss function [11–14]. Forward propagation allows inputs to be passed from one layer to the next until an output is produced. Backpropagation is an iterative process that determines the contribution of each neuron to the output error based on a chain rule and adjusts the weights of each neuron through the network. Optimization techniques are used to reduce the errors generated during backpropagation, and algorithms such as gradient descent and stochastic gradient descent can be used to optimize the network. The activation function converts inputs into outputs that the neural network can recognize. The loss function is used to measure the neural network’s performance after backpropagation and optimization. Combining these components allows deep learning to accept complex inputs and generate accurate predictions for various tasks. The loss function measures the predictive power of the network model based on the network-predicted results. It is a crucial component of deep learning models as it quantifies the difference between the model’s predictions and the actual values. The correct choice of the loss function is vital for achieving effective optimization of deep learning models since it directly impacts the effectiveness of model training [15].
Image recovery is a crucial area of research in computer vision. It involves restoring the original image information from a damaged image, which is essential in various practical applications like medical image processing, image enhancement, and video compression [16]. Traditional image recovery methods rely on mathematical models but often struggle with noise and distortion in complex scenes. In contrast, deep learning techniques can automatically learn advanced feature representations through end-to-end models and have significantly improved image restoration tasks. However, for delicate image recovery tasks, such as medical image processing, the credibility of deep learning recovery results still limits its popularization and application [17]. When utilizing deep networks for image restoration, a loss function quantifies the difference between a low-quality or corrupted image and the original labeled image. A suitable loss function is vital in improving the network’s ability to recover high-quality images from low-quality inputs [18]. Numerous studies have explored different loss functions for image recovery using neural networks. Some commonly used loss functions include Mean Square Error (MSE) and Mean Absolute Error (MAE). These loss functions have shown good performance in various image-processing tasks. For instance, Wang et al. [19] and Zhang et al. [20] employed MSE and MAE, respectively, for image super-resolution. However, these loss functions also have limitations. For example, the MSE loss function may have a significant gap in measuring human-perceived image quality when dealing with tasks related to image quality [21]. This is because the MSE loss function assumes several factors, such as the independence of noise from local image characteristics. Nevertheless, the human visual system (HVS) is sensitive to noise based on local brightness, contrast, and structure [22]. Generally, selecting an appropriate loss function for a specific deep learning task is challenging, and there is no universal selection scheme. The choice depends on the nature of the task and the type of model being used. Using a conventional loss function for training imposes equal weight on each pixel point, making it difficult to distinguish edge parts. Consequently, suppressing visual artifacts in the network’s output image without compromising the true details becomes a key concern.
With the development of deep learning, many researchers have constructed a variety of super-resolution and denoising network models with different frameworks from the design of network models, and these super-resolution and denoising models have achieved relatively good results in super-resolution and denoising problems. However, in the process of network training and processing, in addition to improving the effective utilization of features extracted in the middle of the network, the network training process can be optimized based on the objective so that the information contained in the labels can be fully utilized to improve the processing capability of the network after the completion of training. Especially for different imaging modes in which the physical principles that cause image degradation are different, it is difficult to utilize a single image recovery mode that is applicable to all scenarios, especially for low-contrast images.
The use of asymmetric loss functions has been proposed by related researchers in multi-label classification tasks, especially when the data in each category is not balanced [23,24]. In 2023, Tang et al. [25] constructed a triple representation in the clustering problem, which was further enhanced by different feature constraints for unbalanced data. The asymmetric loss function solves this problem by giving different weights to the losses of different categories. Vogels et al. [26] proposed a modular convolutional architecture for denoising rendered images. The functionality of the kernel prediction network is extended by using a set of asymmetric loss. Liu et al. [27] proposed an asymmetric exponential loss function to address the crack segmentation task sample bias and dataset bias. Depending on the needs of the task, we can adjust the weights of the loss function to balance the importance of different categories. Asymmetric loss function can overcome the drawbacks of the original network to process information equally and improve the processing of the network.
In this paper, we design an asymmetric loss function based on the characteristics of image processing tasks. The loss function considers the greyscale information of each pixel in the image and balances the pixel information of different greyscale values by applying weights to the original loss. Our method focuses on improving the learning process for pixel locations with poor prediction results in the deep learning model. This is achieved by applying dynamic weights to individual pixel points.
This paper uses the models obtained based on MAE and MSE loss functions as comparison models. During processing, the loss function is further optimized according to the data characteristics and features of the original image. In this paper, we change the asymmetry of the loss function by imposing different weight values. We tested the proposed loss in different image processing tasks, and the experimental results show that the asymmetric loss proposed in this paper can improve image processing quality. At the same time, the loss proposed in this paper can be efficiently fused into other network models.
The main innovations of this paper are as follows:
1) This paper designs an asymmetric loss function based on the characteristics of the image itself. Assigning different weights to pixels effectively improves the network’s processing effect.
2) The method proposed in this paper allows for quick implementation of the asymmetric loss function without complicated configuration and adjustment. It has the advantage of plug-and-play, making it more convenient and efficient in practical applications.
3) The method presented in this paper has been tested in various image-processing tasks. It has consistently shown improvement in the network’s processing effect. The method demonstrates good robustness and applicability.
The different levels of greyscale information in an image reflect the brightness of various areas within the image. In a greyscale image, each pixel has a unique greyscale value that indicates the brightness level of that pixel’s location. A higher greyscale value corresponds to a lighter pixel in the image. Therefore, analyzing the greyscale values in an image provides insight into its overall brightness distribution and the differences in brightness between different regions. When training the output image using a deep network with a conventional loss function, each pixel carries the same weight, leading to similar deviations across pixels of different greyscale values. However, it is essential to note that deviations among greyscale values of varying magnitudes are significantly different. The optimization effect of individual pixels can be adjusted by assigning weights to address this issue. In this study, we propose an asymmetric loss function that considers the different levels of greyscale. By increasing the loss weights for pixels with large greyscale values, we aim to enhance the image processing effect. These weight adjustments optimize the network parameters and improve the overall performance of the image processing system.
Traditional loss treats each pixel point equally and each pixel point as having the same weight, i.e., a weight of 1 is imposed. The current loss applied in image processing treats each pixel point equally. The total loss
To enhance the reliability of information in the low-contrast region, asymmetric weights can be used. During the calculation process, weights are added to the low-contrast region. In this way, even a tiny attenuation produces a more significant loss. As a result, in the final result, the magnitude of the information difference of the pixel points with small grey values decreases, enhancing the low-contrast region’s information reliability. Specifically, introducing asymmetric weights changes the degree of deviation of each pixel point, making the degree of deviation of the grey values of different pixel points closer to each other instead of being numerically similar. In this way, we can optimize the whole image more effectively. Fig. 1 illustrates the associated asymmetric loss weight making flowchart.

Figure 1: The flowchart of the proposed scheme
To solve this problem, an asymmetric loss function can be introduced to adjust the optimization effect for pixel points with different grey value sizes. The asymmetric loss function can be designed based on the degree of deviation between the output value and the actual value. Their corresponding loss weight can be increased for pixel points with smaller grey values. Conversely, their corresponding loss weight can be decreased for pixel points with larger grey values. This approach better reflects the difference in importance of pixel points with different grey value sizes and thus improves the optimization of network parameters. Fig. 2 shows the flowchart of asymmetric loss weight computation based on a specific image.

Figure 2: Flowchart of asymmetric loss weight generation
First, for the given images
We have designed an asymmetric weight mask based on the normalized label image,
We use the reciprocal of each pixel point of
We input the normalized
The expression for the MSE loss function is:
The expression for the MAE loss function is:
Finally, the corrected weight mask is applied to the original loss to obtain the result of the loss calculation after applying the weight mask.
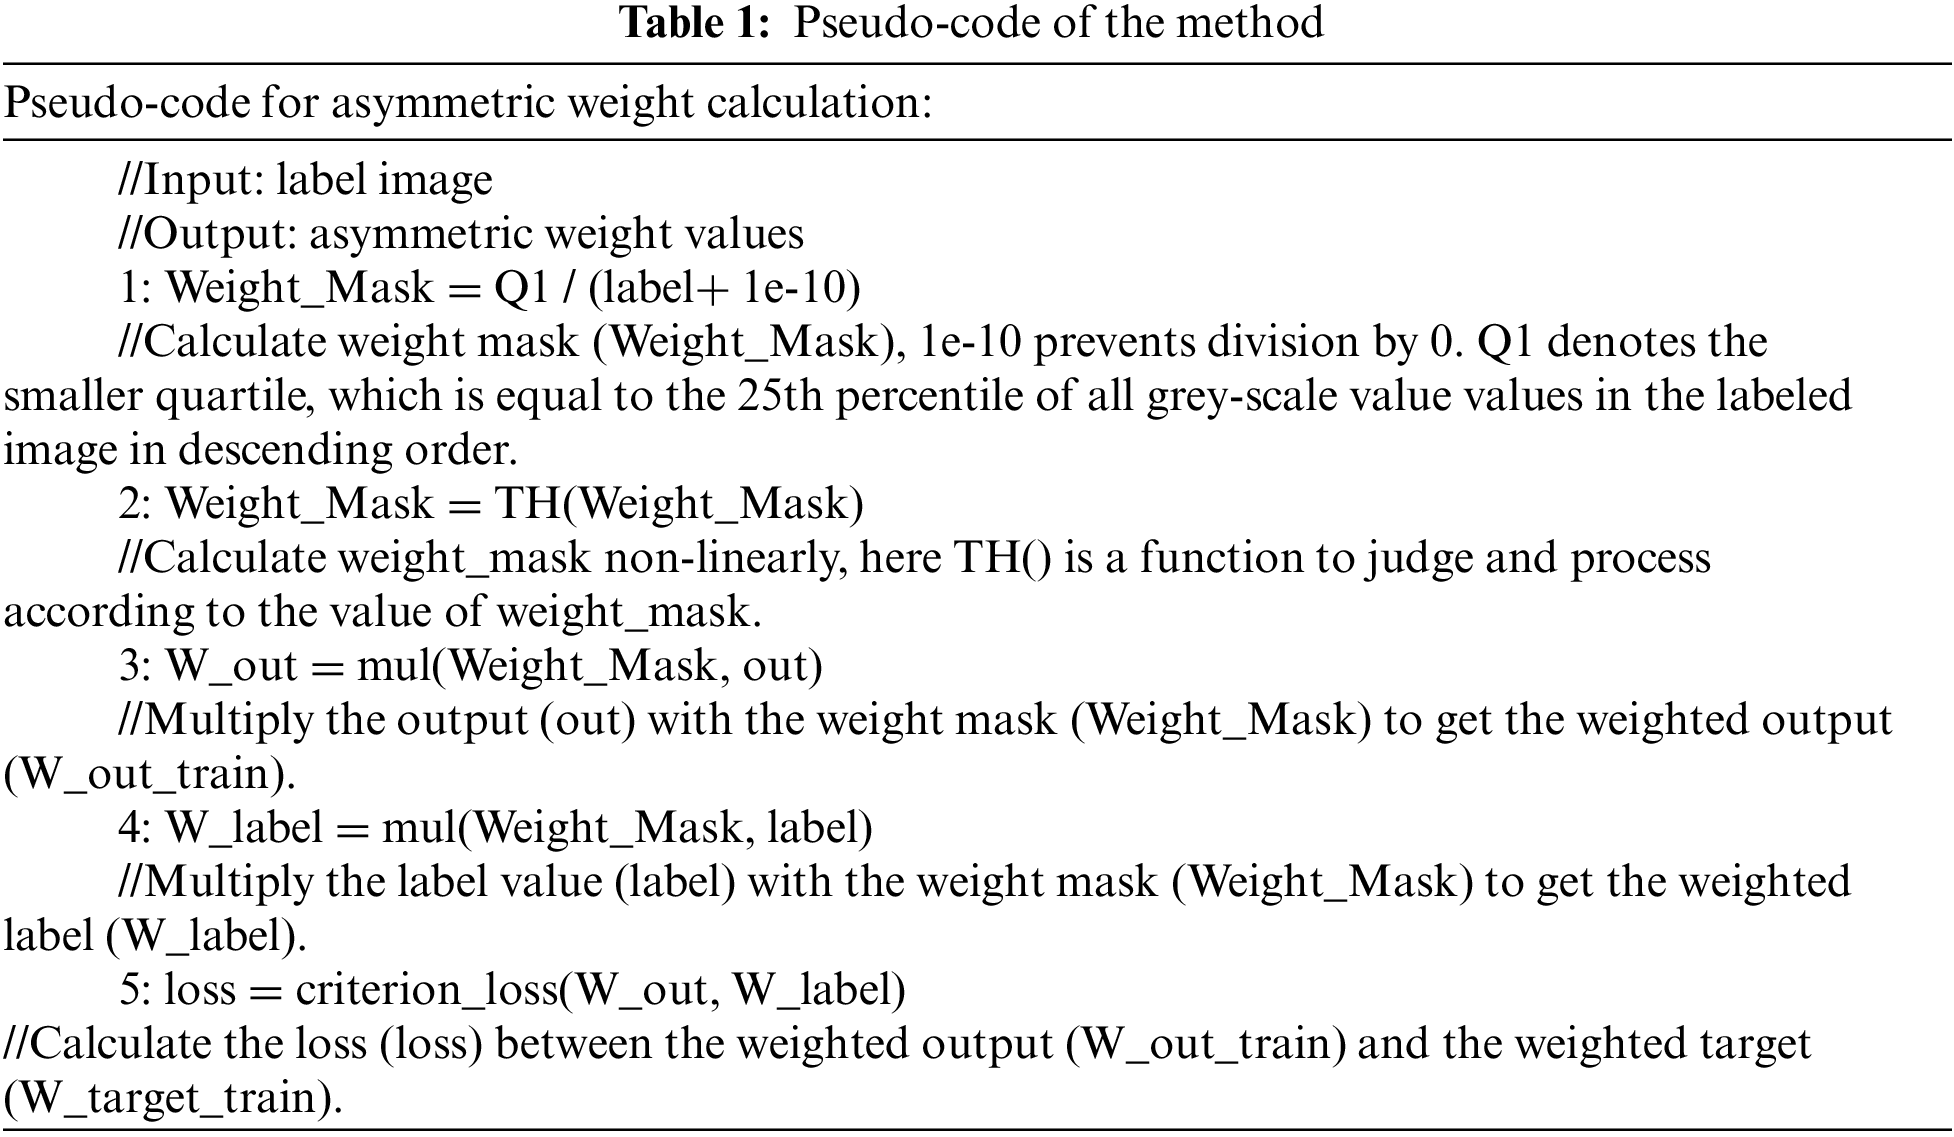
Based on the above description, Table 1 gives the pseudo-code of the method of this paper.
In this paper, the numerical variability between the processed and ideal reference images is used to evaluate the image quality quantitatively. To quantitatively analyze the corrected image quality of the proposed method in this paper, Peak Signal Noise Ratio (PSNR), Structural Similarity Index Measure, SSIM), and Root Mean Square Errors (RMSE) to measure the accuracy of the output results. The expressions for PSNR, SSIM and RMSE are given below:
Here
The closer the RMSE is to zero, the less the numerical variability of the processing result from the ideal labelled image. When the signal-to-noise ratio of the processing result is higher, the larger the PSNR and SSIM value is.
Firstly, we verify the effectiveness and applicability of the proposed method in this paper on the super-resolution problem in deep learning-based image restoration tasks. SRCNN [28] and EDSR [29] are choose as the baseline models for the super-resolution task, respectively. MAE and MSE are the baseline losses during the network training process. The network training is completed and tested by introducing asymmetric loss weights designed in this paper based on MAE and MSE losses, respectively. The test dataset is shown in Fig. 3. All these images involved in the test are not included in the training dataset.

Figure 3: The ground-truth of the image used for super-resolution task testing
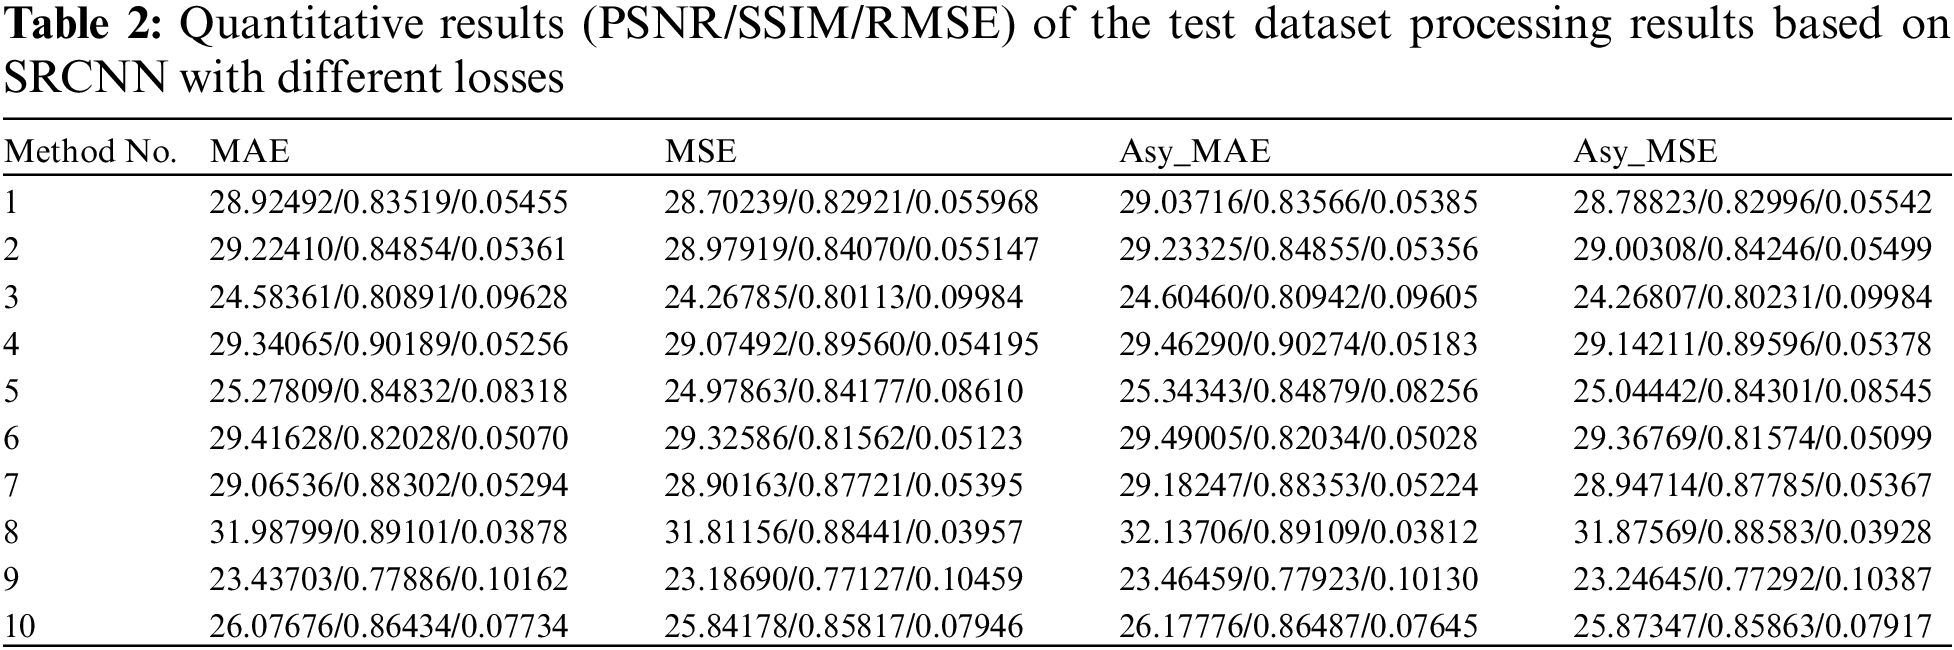
Referring to the parameter settings in the literature [28], we set up the network and selected the BSD300 [30] dataset as the training dataset. The images of the test dataset were obtained after four sets of trained networks with corresponding super-resolution results. We evaluated the test results based on PSNR, SSIM and RMSE metrics and calculated the corresponding metric values. The obtained results are shown in Table 2. The corresponding metric values show that adding the weights proposed in this paper, the asymmetric loss optimization improves the super-resolution of the network.
To comprehensively assess the effectiveness of the asymmetric loss weights proposed in this paper in terms of network processing effect enhancement, we processed the calculated indicator values. Firstly, we use the metric values of the network output results based on MAE and MSE loss as the benchmark. We plotted a radar chart to visualize the numerical results of the processing results for the 10 images. In Fig. 4, the light blue and orange lines represent the evaluation values of the network models trained based on MAE and MSE loss for the super-resolution results of 10 images in the test set, respectively. The red line represents the improvement part of the evaluation values of the network models trained based on asymmetric weighted MAE loss compared to those trained based on MAE loss after the super-resolution processing of 10 images in the test set. The green line represents the improvement part of the evaluation values of the network models trained based on asymmetric weighted MAE loss compared to those trained based on MAE loss after the super-resolution processing of 10 images in the test set.

Figure 4: Quantitative difference of the results of the test dataset processing by SRCNN based on different losses. The light blue and orange bar charts represent the metric values of the results of 10 images after super-resolution the MAE loss-based and MSE loss-based network models, respectively. The red and green line graphs represent the difference between the metric values of the super-resolution results of the model after testing of the 10 images with the introduction of asymmetric weights for the MAE loss and the introduction of asymmetric weights for the MSE loss, respectively
From Fig. 4, we can see that the model introducing asymmetric weights can improve the metrics performance of the images after super-resolution when super-resolution the images in the test set. By using asymmetric weights, different weights can be assigned to different regions during the super-resolution process, thus better preserving the image's detail information and texture features. Compared to the traditional uniform weight assignment method, asymmetric weighting can capture important details in the image more effectively and reduce noise and distortion. This results in a more metrics performance of the super-resolution image.
Fig. 5 shows the output results after the training is completed. To facilitate the comparison of the output results after adding asymmetric weights with the original loss, we place the results based on the same loss in neighboring columns. By comparing the entire image, we can find that the super-resolution results of the network with asymmetric gradient weights are visually closer to the label image. To better understand this result, we enlarged the region of interest marked in red in Fig. 6. In Fig. 6, we have marked the locations where the different results are inconsistent with red arrows. Through this comparison, we can find that after adding asymmetric gradient weights, the network has a certain improvement effect on the edge clarity of super-resolution images. This means that the network can better capture the detailed information in the image, thereby improving the contrast of the restored image.
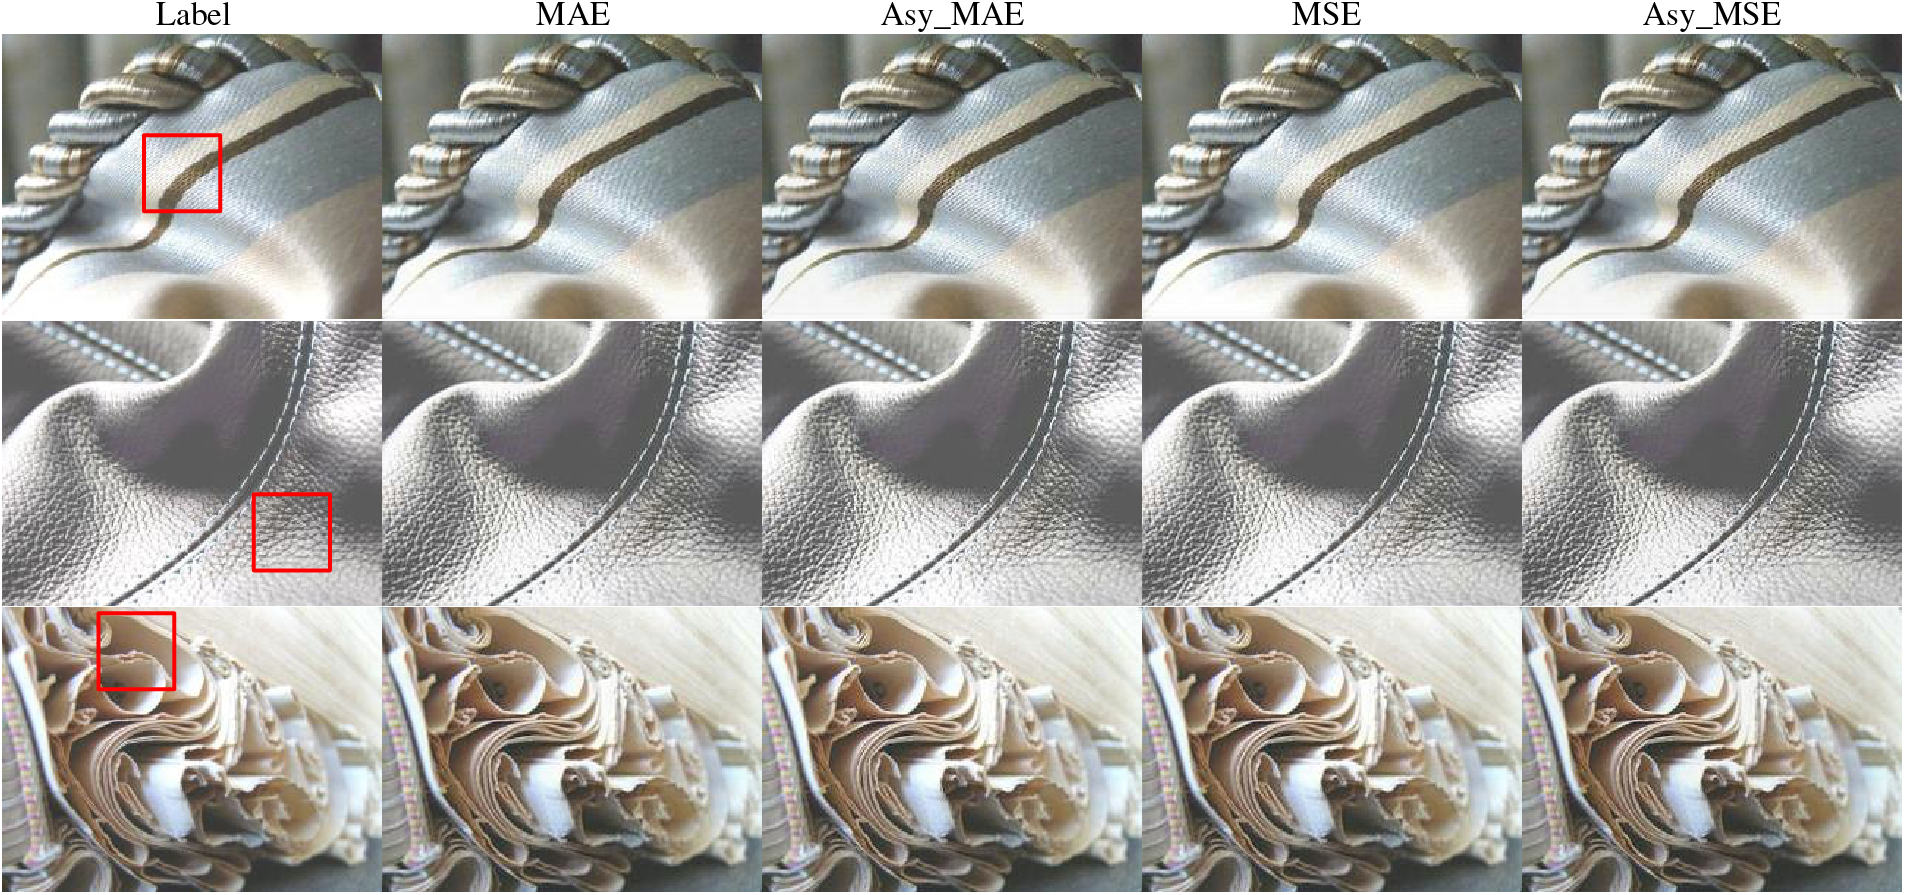
Figure 5: The output images generated by SRCNN models based on different loss function
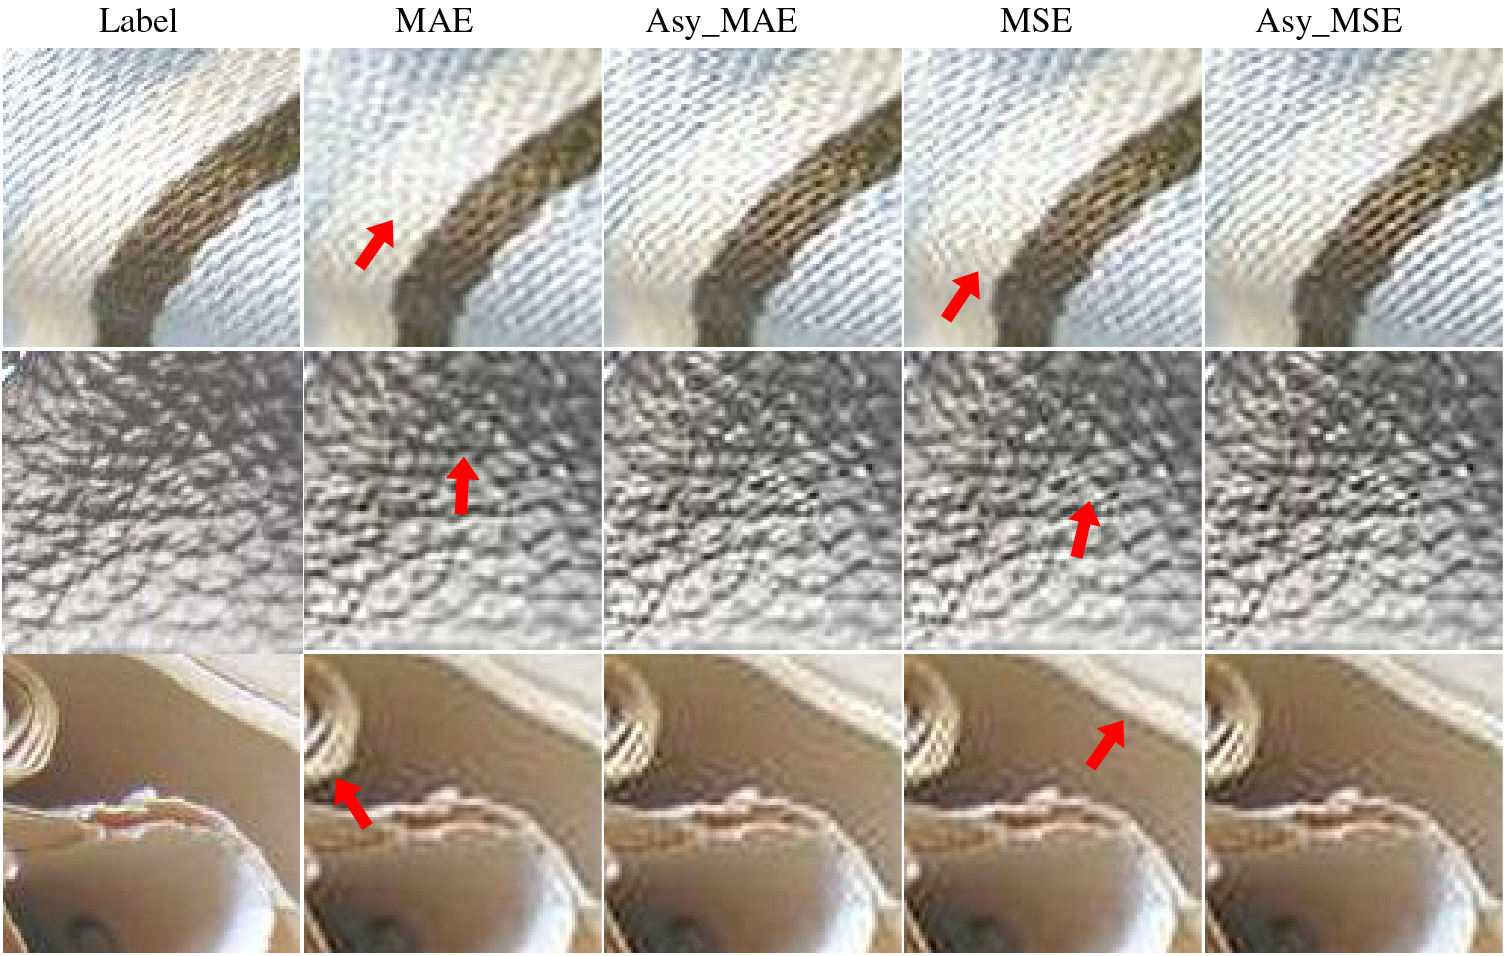
Figure 6: The corresponding magnified images of the region of interest by the red marked locations in Fig. 5
By introducing asymmetric gradient weights during network training, we successfully improved the super-resolution performance of the network. This makes the output visually closer to the label image and improves the edge clarity and contrast of the image. These improvements are significant for image processing tasks as they can help improve image quality and application value.
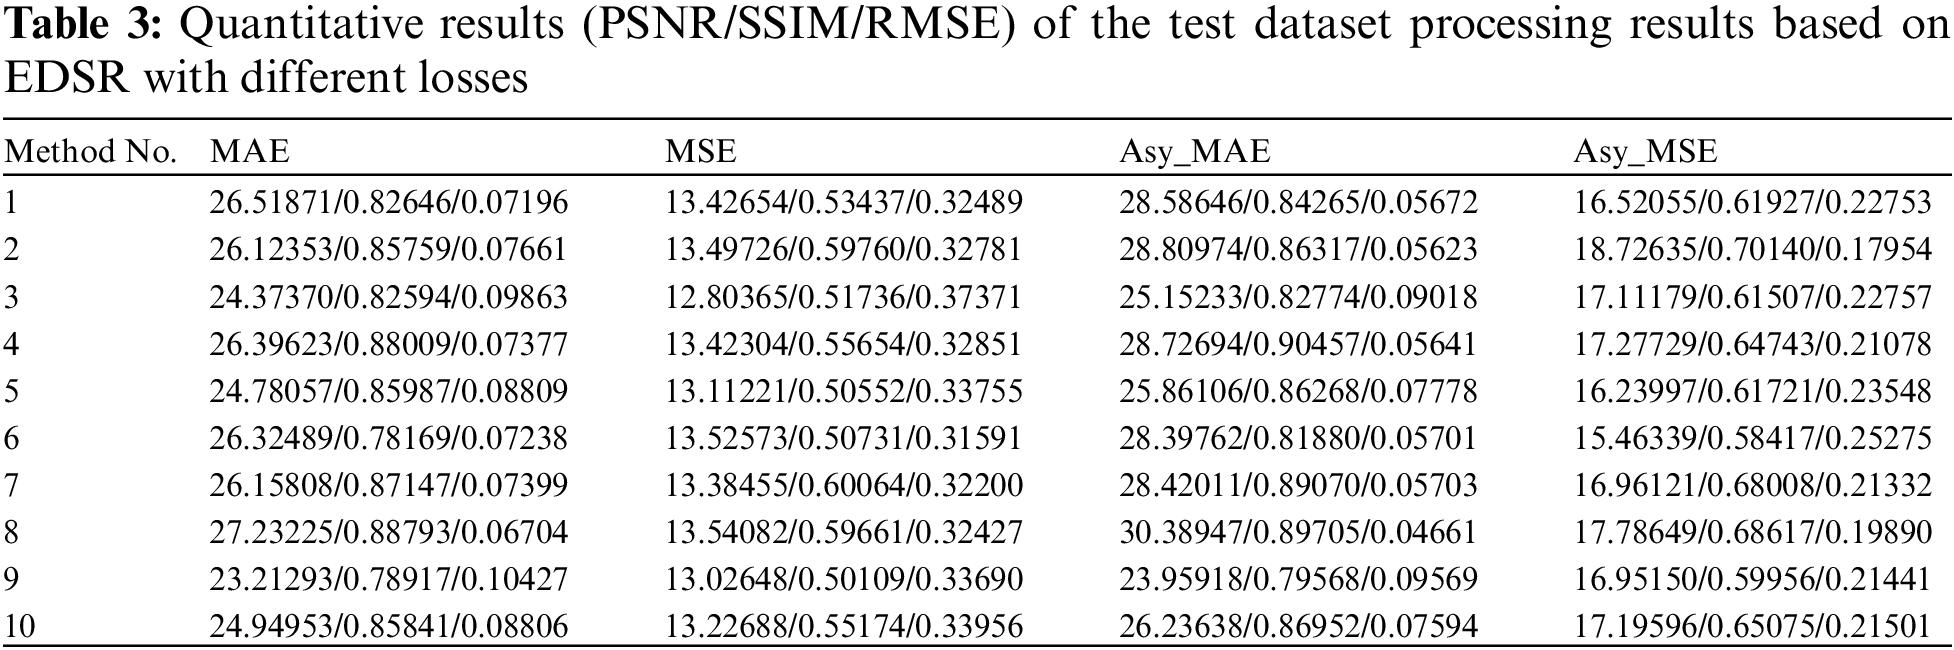
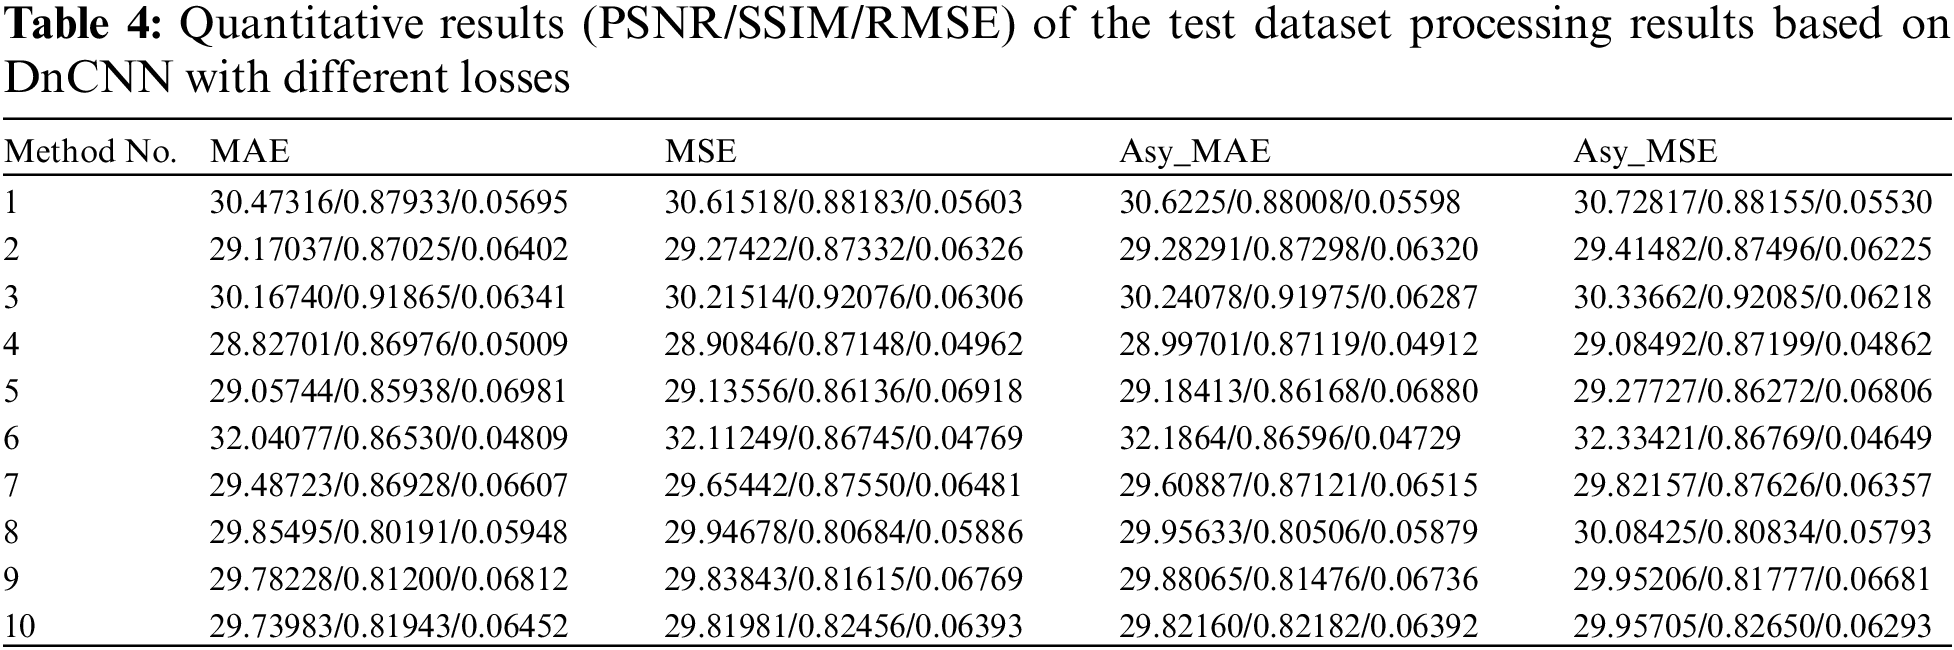
Referring to the parameter settings in the literature [29], we set up the network and selected the BSD300 dataset as the training dataset. The images of the test dataset were obtained after four sets of trained networks with corresponding super-resolution results. We evaluated the test results based on PSNR, SSIM and RMSE metrics and calculated the corresponding metric values. The obtained results are shown in Table 3. In order to better analyze and interpret the impact of the method proposed in this paper on the network performance, we visualized the data in Table 3.
In Fig. 7, the light blue lines represent the measurement values of the results of 10 images after super-resolution of the network model based on MAE loss. The organ line represents the difference between the measurement values of the super-resolution results of the network model with asymmetric weights and the measurement values of the super-resolution results obtained based on MAE losses after testing 10 images. The red lines represent the measurement values of the results of 10 images after super-resolution of the network model based on MAE loss. The green line represents the difference between the measurement values of the super-resolution results of the network model with asymmetric weights and the measurement values of the super-resolution results obtained based on MAE losses after testing 10 images.

Figure 7: Quantitative difference of the results of the test dataset processing by EDSR based on different losses. The light blue and orange bar charts represent the metric values of the results of 10 images after super-resolution the MAE loss-based and MSE loss-based network models, respectively. The red and green line graphs represent the difference between the metric values of the super-resolution results of the model after testing of the 10 images with the introduction of asymmetric weights for the MAE loss and the introduction of asymmetric weights for the MSE loss, respectively
In the PSNR, SSIM and RMSE subplots of Fig. 7, by introducing asymmetric weights, we can see that the output outcome metrics are evaluated better, i.e., the obtained values are higher than the mean values in PSNR and SSIM, while in RMSE, the obtained values are lower than the mean values. This result shows that by using asymmetric loss weights, the model can be guided to pay more attention to grey scale information, which helps to improve the performance of the model.
In order to verify the applicability of the method proposed in this paper to the image restoration problem, the paper is further tested on a deep learning-based denoising model. The denoising problem was addressed using the DnCNN [31] and DPHSIR [32] models as baseline models. The baseline losses were measured using MAE and MSE during the network training process. The network training was completed and tested by incorporating the asymmetric loss weights introduced in this paper. The test dataset is shown in Fig. 8. All these images involved in the test are not included in the training dataset.

Figure 8: The ground-truth of the image used for denoising task testing
Referring to the parameter settings in the literature [31], we set up the network and selected the DIV2K [33] dataset as the training dataset. The DIV2K dataset is a newly proposed high-quality (2K resolution) image dataset for image restoration tasks.
The images of the test dataset were obtained after four sets of trained networks with corresponding denoising results. We evaluated the test results based on PSNR, SSIM and RMSE metrics and calculated the corresponding metric values. The obtained results are shown in Table 4.
For the convenience of observation and analysis, we further processed and visualized the obtained indicator values. We plotted a radar chart to visually display the numerical results of the processing results of 10 images. In Fig. 9, the light blue and orange lines represent the evaluation values of the network models trained based on MAE loss for the super-resolution results of 10 images in the test set. The red line represents the improvement part of the evaluation values of the network models trained based on asymmetric weighted MAE loss compared to those trained based on MAE loss after the super-resolution processing of 10 images in the test set. The green line represents the improvement part of the evaluation values of the network models trained based on asymmetric weighted MAE loss compared to those trained based on MAE loss after the super-resolution processing of 10 images in the test set.
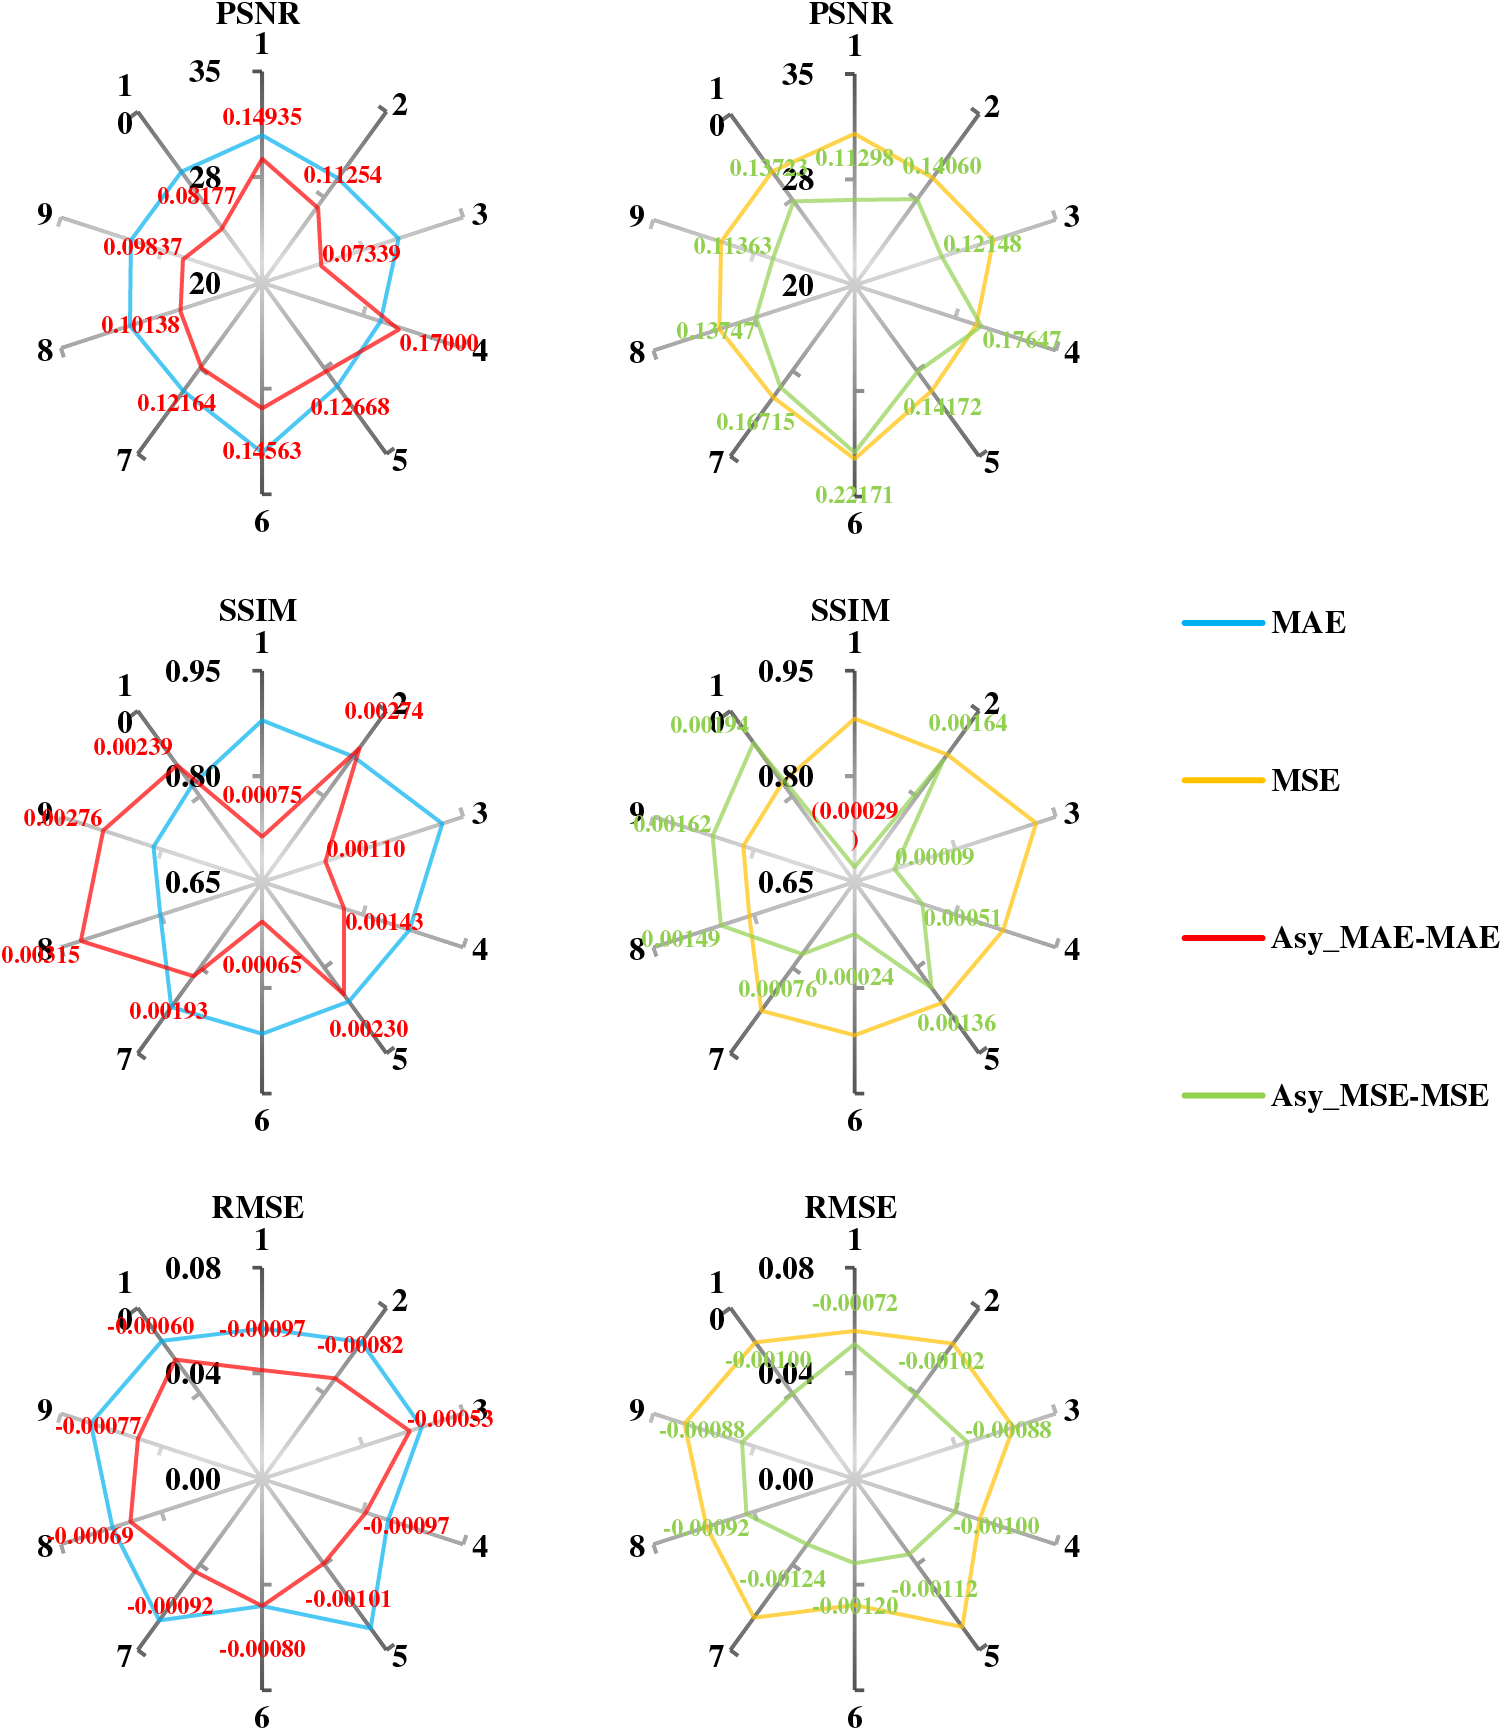
Figure 9: Quantitative result enhancement values of the test dataset processing results based on DnCNN with different losses. The light blue and orange bar charts represent the metric values of the results of 10 images after super-resolution the MAE loss-based and MSE loss-based network models, respectively. The red and green line graphs represent the difference between the metric values of the super-resolution results of the model after testing of the 10 images with the introduction of asymmetric weights for the MAE loss and the introduction of asymmetric weights for the MSE loss, respectively
By analyzing the radar charts, introducing the asymmetric loss weights proposed in this paper can significantly improve the index values of the processing results compared to the results of MAE and MSE. By processing the calculated index values and analyzing them by drawing radar plots, we can see the effectiveness of asymmetric loss weights in improving the processing results of the network. This indicates that asymmetric loss weighting significantly improves the network processing effect.
Referring to the parameter settings in the literature [32], we set up the network and selected the DIV2K dataset as the training dataset. We have performed the same processing operation on the test results of the DPHSIR network with reference to the processing of the output results of the DnCNN network in Section 3.3.1. The calculated PSNR, SSIM, and RMSE results are shown in Table 5.
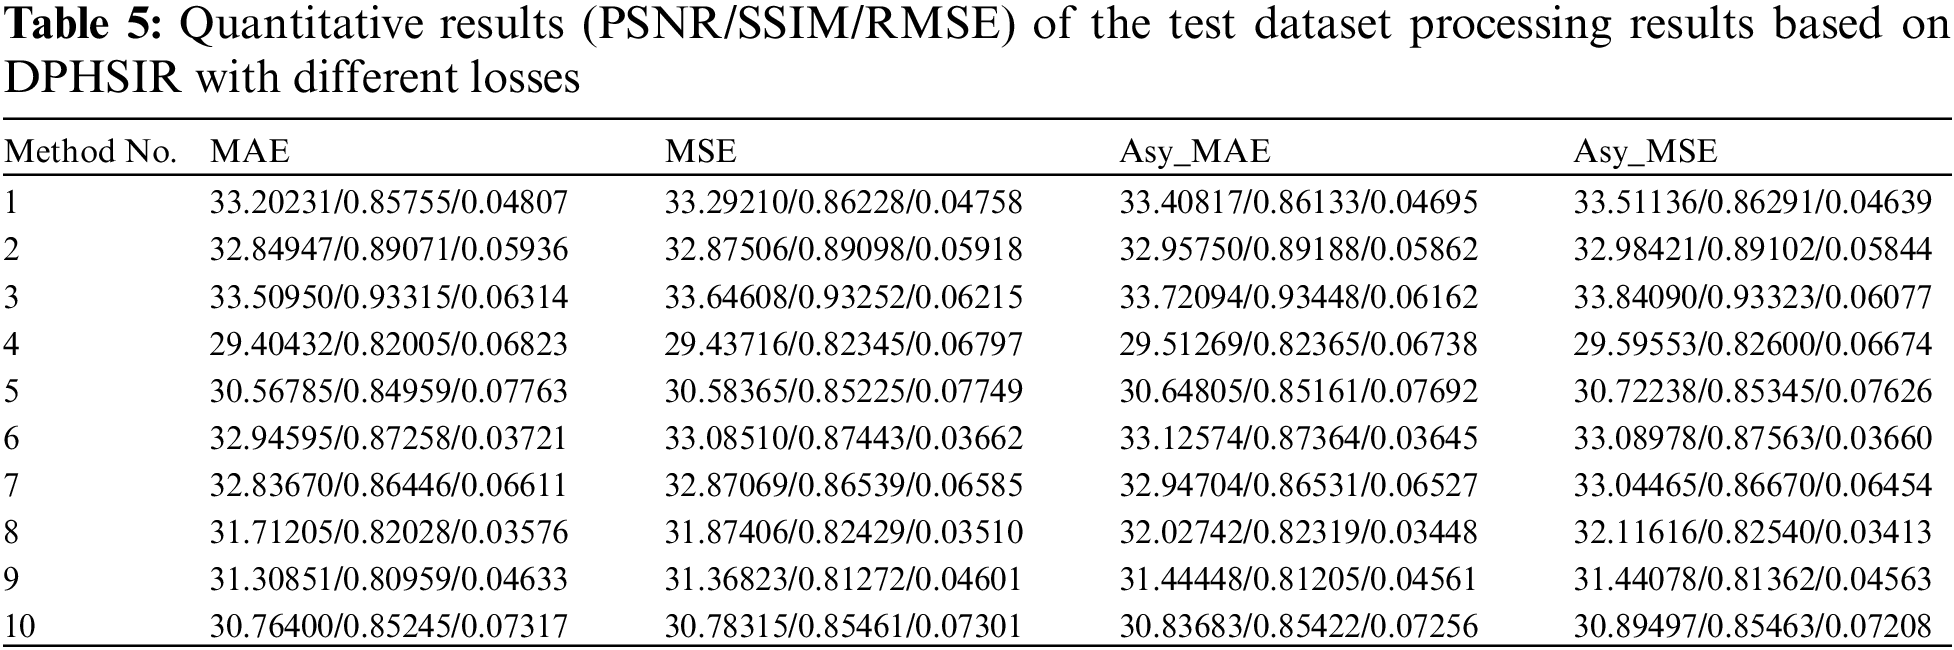
Fig. 10 gives the resultant radar plots of PSNR, SSIM and RMSE metrics for the test results of the test data. In Fig. 10, the light blue and orange lines represent the evaluation values of the network models trained based on MAE loss for the super-resolution results of 10 images in the test set. The red line represents the improvement part of the evaluation values of the network models trained based on asymmetric weighted MAE loss compared to those trained based on MAE loss after the super-resolution processing of 10 images in the test set. The green line represents the improvement part of the evaluation values of the network models trained based on asymmetric weighted MAE loss compared to those trained based on MAE loss after the super-resolution processing of 10 images in the test set.
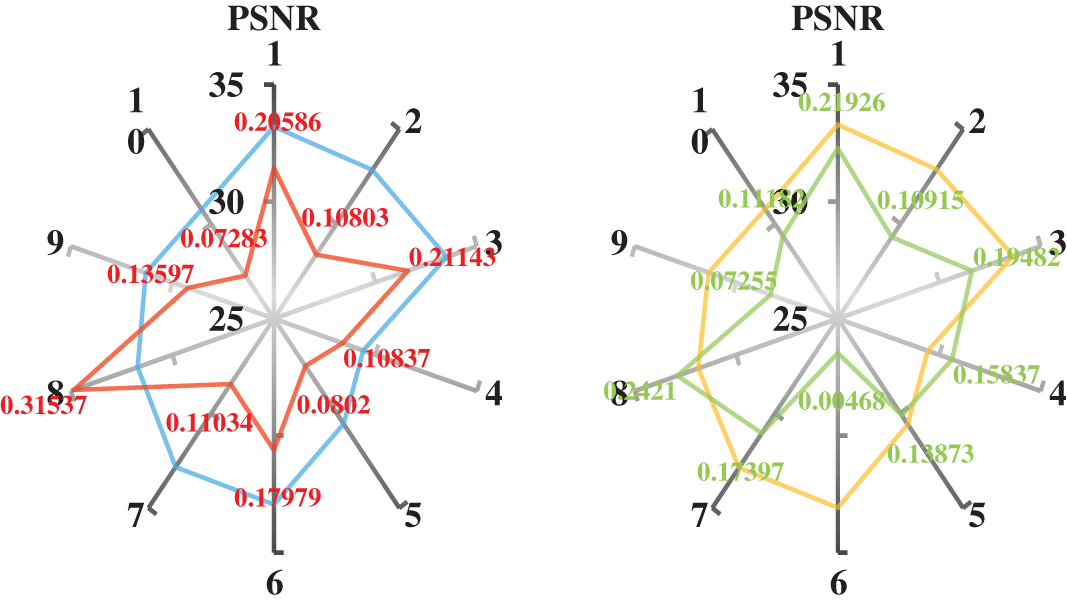

Figure 10: Quantitative result enhancement values of the test dataset processing results based on DPHSIR with different losses. The light blue and orange bar charts represent the metric values of the results of 10 images after super-resolution the MAE loss-based and MSE loss-based network models, respectively. The red and green line graphs represent the difference between the metric values of the super-resolution results of the model after testing of the 10 images with the introduction of asymmetric weights for the MAE loss and the introduction of asymmetric weights for the MSE loss, respectively
In the PSNR, SSIM and RMSE subgraphs of Fig. 10, we observed that the measurement of loss training results was better than the results processed by the network without introducing asymmetric weights. This result indicates that the asymmetric loss weight proposed in this article will positively impact loss calculation and network optimization processes.
Asymmetric weights can also help networks better understand the importance of different pixels with different greyscale values. In traditional loss functions, it is usually assumed that the greyscale values of all pixels are the same, but this is not the case in reality. Therefore, introducing asymmetric weights can help the network distinguish pixels of different greyscale values, thereby achieving better network optimization after training.
Precisely, the introduction of asymmetric weights adjusts the attention level of the network to different pixel points during the training process, enabling the network to better focus on essential areas in the image, thereby improving the learning efficiency of the network. Meanwhile, due to the design of asymmetric weights, the network can better adapt to various image processing tasks, including super-resolution, denoising, etc.
This paper’s asymmetric loss function is designed for deep network-based image regression problems. Image regression is a problem of predicting the corresponding value of an image by processing it, which is widely used in the fields of image super-resolution, image denoising and so on. The asymmetric loss function is a loss function that improves the network processing effect by setting different weight values for different pixel points. In the traditional uniform loss function, all pixel points are given the same weight, which often fails to utilize the image information fully. Because each pixel point in an image contains unequal information, pixel points with more critical information should be given more weight.
A deep network is a multilayer neural network with strong expressive ability and generalization performance, which is increasingly widely used in image processing. Deep networks can recover the information of the image better. However, the subsequent processing tasks have a higher and higher demand for the recovery accuracy and detailed information of the image. The rich information contained in the truth label can improve the training effect of the network, but the current widely used loss function has the same weight for each pixel point, which makes it difficult to mention the role of different pixel points.
To solve this problem, this paper proposes an asymmetric loss function. The asymmetric loss function differentiates the weight settings for different pixel points according to the truth labels’ characteristics and the processing task’s needs, which better achieves the training optimization of the network. Specifically, the asymmetric loss function weights the loss of each pixel point so that the pixel points with more important information occupy a more significant weight in the loss calculation. This can induce the network to pay more attention to the pixel points with more critical information in the image during the training process, thus improving the processing effect of the network.
This paper uses an asymmetric loss function to solve the deep network-based image regression problem. In image processing, the image regression problem is an important task that aims to predict the corresponding output values based on a given image. However, the traditional loss function has some limitations in dealing with such problems and cannot fully explore the image information.
The emergence of asymmetric loss function provides a new way to solve these problems. The asymmetric loss function is a loss function that differentiates different pixel points by setting different weight values. In the specific implementation, the asymmetric loss function assigns different weights to each pixel point according to the importance of the pixel point. In the network training process, the asymmetric loss function can make better use of the image information and improve the network’s processing effect and training optimization.
In order to verify the effectiveness of the asymmetric loss function, we conducted experimental tests in image super-resolution and image denoising tasks. The experimental results show that the deep network model based on the asymmetric loss function exhibits significant advantages in these tasks. The asymmetric loss function can better highlight the image’s detailed information, improve the image’s visual effect, and make it easier to analyze and process the subsequent tasks.
In addition, the asymmetric loss function proposed in this paper is mainly realized by setting the weight values. This design idea makes combining with other loss functions easy to form a more powerful loss function. This design idea is essential for designing loss functions in other tasks and can be extended to other image-processing or non-image-processing tasks.
In the future, we can further study more complex and diverse image properties and explore other effective asymmetric loss function design methods. For example, in computer vision, we can introduce more feature extraction methods and deep learning models to improve the quality of image recovery. In addition, we can design and optimize different asymmetric loss functions for different tasks and datasets to adapt to the needs of different scenarios. In addition to the field of computer vision, asymmetric loss functions can also be applied to other fields, such as natural language processing, speech recognition, etc. Of course, applying asymmetric loss function to other fields also needs to consider its applicability and feasibility. We need to choose the appropriate asymmetric loss function according to the specific task and the characteristics of the dataset and conduct the corresponding experiments and verification. At the same time, we also need to pay attention to issues such as the interpretability and robustness of the model to ensure the stability and reliability of the model.
Acknowledgement: None.
Funding Statement: This work was supported by the National Natural Science Foundation of China (62201618).
Author Contributions: Conceptualization, L.Z. and Y.H.; methodology, Y.H.; software, L.Z.; validation, L.Z., Y.H. and X.X.; formal analysis, L.Z. and Y.H.; investigation, L.Z.; resources, B.Y.; data curation, Z.Z., M.L. and X.X.; writing-original draft preparation, L.Z. and Y.H.; writing-review and editing, S.T., L.L., B.Y. and X.X.; visualization, L.Z., Z.Z. and M.L.; supervision, B.Y.; project administration, X.X.; funding acquisition, Y.H. and L.L. All authors reviewed the results and approved the final version of the manuscript.
Availability of Data and Materials: The data and the code used for the manuscript are available for researchers on request from the corresponding author.
Conflicts of Interest: The authors declare that they have no known competing financial interests or personal relationships that could have appeared to influence the work reported in this paper.
References
1. B. Zhang, J. Zhu and H. Su, “Toward the third generation artificial intelligence,” Science China Information Sciences, vol. 66, no. 2, pp. 121101, 2023. [Google Scholar]
2. Y. Xu, X. Liu, X. Cao, C. Huang, E. Liu et al., “Artificial intelligence: A powerful paradigm for scientific research,” The Innovation, vol. 2, no. 4, pp. 100179, 2021. [Google Scholar] [PubMed]
3. C. Tian, L. Fei, W. Zheng, Y. Xu, W. Zuo et al., “Deep learning on image denoising: An overview,” Neural Networks, vol. 131, pp. 251–275, 2020. [Google Scholar] [PubMed]
4. Z. Wang, J. Chen and S. C. H. Hoi, “Deep learning for image super-resolution: A survey,” IEEE Transactions on Pattern Analysis and Machine Intelligence, vol. 43, no. 10, pp. 3365–3387, 2021. [Google Scholar] [PubMed]
5. S. Minaee, Y. Y. Boykov, F. Porikli, A. J. Plaza, N. Kehtarnavaz et al., “Image segmentation using deep learning: A survey,” in IEEE Transactions on Pattern Analysis and Machine Intelligence, pp. 1, 2021. [Google Scholar]
6. P. Isola, J. Y. Zhu, T. Zhou and A. A. Efros, “Image-to-image translation with conditional adversarial networks,” in IEEE Conf. on Computer Vision and Pattern Recognition, Honolulu, HI, USA, pp. 5967–5976, 2017. [Google Scholar]
7. H. C. Burger, C. J. Schuler and S. Harmeling, “Image denoising: Can plain neural networks compete with BM3D?,” in IEEE Conf. on Computer Vision and Pattern Recognition, Providence, RI, USA, pp. 2392–2399, 2012. [Google Scholar]
8. L. Xu, J. S. J. Ren, C. Liu and J. Jia, “Deep convolutional neural network for image deconvolution,” in Proc. of the 27th Int. Conf. on Neural Information Processing Systems, Cambridge, MA, USA, pp. 1790–1798, 2014. [Google Scholar]
9. M. D. Zeiler, D. Krishnan, G. W. Taylor and R. Fergus, “Deconvolutional networks,” in IEEE Conf. on Computer Vision and Pattern Recognition, San Francisco, CA, USA, pp. 2528–2535, 2010. [Google Scholar]
10. A. Nguyen, J. Yosinski and J. Clune, “Deep neural networks are easily fooled: High confidence predictions for unrecognizable images,” in IEEE Conf. on Computer Vision and Pattern Recognition, Boston, MA, USA, pp. 427–436, 2015. [Google Scholar]
11. H. Zhao, O. Gallo, I. Frosio and J. Kautz, “Loss functions for neural networks for image processing,” 2015. [Online]. Available: https://arxiv.org/abs/1511.08861 (accessed on 26/10/2023) [Google Scholar]
12. G. Xie and J. Lai, “An Interpretation of Forward-Propagation and Back-Propagation of DNN,” in Chinese Conf. on Pattern Recognition and Computer Vision, Guangzhou, China, pp. 3–15, 2018. [Google Scholar]
13. R. Y. Sun, “Optimization for deep learning: An overview,” Journal of the Operations Research Society of China, vol. 8, no. 2, pp. 249–294, 2020. [Google Scholar]
14. B. Ding, H. Qian and J. Zhou, “Activation functions and their characteristics in deep neural networks,” in Chinese Control and Decision Conf., Shenyang, China, pp. 1836–1841, 2018. [Google Scholar]
15. J. Terven, D. M. Cordova-Esparza, A. Ramirez-Pedraza and E. A. Chavez-Urbiola, “Loss functions and metrics in deep learning. A review,” 2023. [Online]. Available: https://arxiv.org/abs/2307.02694 (accessed on 26/10/2023) [Google Scholar]
16. J. Su, B. Xu and H. Yin, “A survey of deep learning approaches to image restoration,” Neurocomputing, vol. 487, pp. 46–65, 2022. [Google Scholar]
17. A. A. Laghari, V. V. Estrela and S. Yin, “How to collect and interpret medical pictures captured in highly challenging environments that range from nanoscale to hyperspectral imaging,” Current Medical Imaging, vol. 19, pp. 1–10, 2023. [Google Scholar]
18. Y. Tian, D. Su, S. Lauria and X. Liu, “Recent advances on loss functions in deep learning for computer vision,” Neurocomputing, vol. 497, pp. 129–158, 2022. [Google Scholar]
19. Y. Wang, F. Perazzi, B. McWilliams, A. Sorkine-Hornung, O. Sorkine-Hornung et al., “A fully progressive approach to single-image super-resolution,” 2018. [Online]. Available: https://arxiv.org/abs/1804.02900 (accessed on 26/10/2023) [Google Scholar]
20. Y. Zhang, Y. Tian, Y. Kong, B. Zhong and Y. Fu, “Residual dense network for image super-resolution,” 2018. [Online]. Available: https://arxiv.org/abs/1802.08797 (accessed on 26/10/2023) [Google Scholar]
21. L. Zhang, L. Zhang, X. Mou and D. Zhang, “A comprehensive evaluation of full reference image quality assessment algorithms,” in IEEE Int. Conf. on Image Processing, Orlando, FL, USA, pp. 1477–1480, 2012. [Google Scholar]
22. Z. Wang, A. C. Bovik, H. R. Sheikh and E. P. Simoncelli, “Image quality assessment: From error visibility to structural similarity,” IEEE Transactions on Image Processing, vol. 13, no. 4, pp. 600–612, 2004. [Google Scholar] [PubMed]
23. X. Zhou, X. Liu, J. Jiang, X. Gao and X. Ji, “Asymmetric loss functions for learning with noisy labels,” 2021. [Online]. Available: https://arxiv.org/abs/2106.03110v1 (accessed on 26/10/2023) [Google Scholar]
24. S. R. Hashemi, S. S. Mohseni Salehi, D. Erdogmus, S. P. Prabhu, S. K. Warfield et al., “Asymmetric loss functions and deep densely-connected networks for highly-imbalanced medical image segmentation: Application to multiple sclerosis lesion detection,” IEEE Access, vol. 7, pp. 1721–1735, 2019. [Google Scholar]
25. Y. Tang, J. Huang, W. Pedrycz, B. Li and F. Ren, “A fuzzy clustering validity index induced by triple center relation,” IEEE Transactions on Cybernetics, vol. 53, no. 8, pp. 5024–5036, 2023. [Google Scholar] [PubMed]
26. T. Vogels, F. Rousselle, B. Mcwilliams, G. Röthlin, A. Harvill et al., “Denoising with kernel prediction and asymmetric loss functions,” ACM Transactions on Graphics, vol. 37, no. 4, pp. 124:1–124:15, 2018. [Google Scholar]
27. F. Liu, J. Wang, D. Chen, C. Shen and F. Xu, “Asymmetric exponential loss function for crack segmentation,” Multimedia Systems, vol. 29, no. 2, pp. 539–552, 2023. [Google Scholar]
28. C. Dong, C. C. Loy, K. He and X. Tang, “Learning a deep convolutional network for image super-resolution,” in European Conf. on Computer Vision, Zurich, Switzerland, pp. 184–199, 2014. [Google Scholar]
29. B. Lim, S. Son, H. Kim, S. Nah and K. M. Lee, “Enhanced deep residual networks for single image super-resolution,” in IEEE Conf. on Computer Vision and Pattern Recognition Workshops, Honolulu, HI, USA, pp. 1132–1140, 2017. [Google Scholar]
30. D. Martin, C. Fowlkes, D. Tal and J. Malik, “A database of human segmented natural images and its application to evaluating segmentation algorithms and measuring ecological statistics,” in IEEE Int. Conf. on Computer Vision, Vancouver, BC, Canada, vol. 2, pp. 416–423, 2001. [Google Scholar]
31. K. Zhang, W. Zuo, Y. Chen, D. Meng and L. Zhang, “Beyond a gaussian denoiser: Residual learning of deep CNN for image denoising,” IEEE Transactions on Image Processing, vol. 26, no. 7, pp. 3142–3155, 2017. [Google Scholar] [PubMed]
32. Z. Lai, K. Wei and Y. Fu, “Deep plug-and-play prior for hyperspectral image restoration,” Neurocomputing, vol. 481, pp. 281–293, 2022. [Google Scholar]
33. R. Timofte, E. Agustsson, L. V. Gool, M. H. Yang, L. Zhang et al., “Challenge on single image super-resolution: Methods and results,” in IEEE Conf. on Computer Vision and Pattern Recognition Workshops, Honolulu, HI, USA, pp. 1110–1121, 2017. [Google Scholar]
Cite This Article
 Copyright © 2023 The Author(s). Published by Tech Science Press.
This work is licensed under a Creative Commons Attribution 4.0 International License , which permits unrestricted use, distribution, and reproduction in any medium, provided the original work is properly cited.
 Downloads
 Citation Tools