 Open Access
ARTICLE
Smart Healthcare Activity Recognition Using Statistical Regression and Intelligent Learning
1 Department of Computer Sciences, Government Arts College (Autonomous), Salem, 636007, India
2 Department of Computer Sciences, College of Computer and Information Sciences, Princess Nourah Bint Abdulrahman University, Riyadh, 11671, Saudi Arabia
3 Department of Information Systems, College of Computer and Information Sciences, Princess Nourah Bint Abdulrahman University, Riyadh, 11671, Saudi Arabia
* Corresponding Author: Nithya Rekha Sivakumar. Email:
Computers, Materials & Continua 2024, 78(1), 1189-1205. https://doi.org/10.32604/cmc.2023.034815
Received 28 July 2022; Accepted 30 June 2023; Issue published 30 January 2024
Abstract
In this present time, Human Activity Recognition (HAR) has been of considerable aid in the case of health monitoring and recovery. The exploitation of machine learning with an intelligent agent in the area of health informatics gathered using HAR augments the decision-making quality and significance. Although many research works conducted on Smart Healthcare Monitoring, there remain a certain number of pitfalls such as time, overhead, and falsification involved during analysis. Therefore, this paper proposes a Statistical Partial Regression and Support Vector Intelligent Agent Learning (SPR-SVIAL) for Smart Healthcare Monitoring. At first, the Statistical Partial Regression Feature Extraction model is used for data preprocessing along with the dimensionality-reduced features extraction process. Here, the input dataset the continuous beat-to-beat heart data, triaxial accelerometer data, and psychological characteristics were acquired from IoT wearable devices. To attain highly accurate Smart Healthcare Monitoring with less time, Partial Least Square helps extract the dimensionality-reduced features. After that, with these resulting features, SVIAL is proposed for Smart Healthcare Monitoring with the help of Machine Learning and Intelligent Agents to minimize both analysis falsification and overhead. Experimental evaluation is carried out for factors such as time, overhead, and false positive rate accuracy concerning several instances. The quantitatively analyzed results indicate the better performance of our proposed SPR-SVIAL method when compared with two state-of-the-art methods.Keywords
IoT has metamorphosed from being an embedded computing devices interconnection to a smart sensor devices interdependence. With artificial intelligence (AI) and deep learning mechanisms, beginning human-like intelligence to smart healthcare structure is suitable. IoT and cloud technologies have of late perceived consideration progress and have helped impart smart healthcare services inside a dynamic and real time manner. With the incorporation of Internet of Things (IoT) and Cloud, the insistence for an enveloping smart healthcare framework that bestows coherent and swift feedback is considerable. Deep learning and AI are bestowing cognitive behavior and augment decision-making potentiality.
Human activity recognition (HAR) algorithms depend on wide time-domain convolutional neural network and multi environment sensor data (HAR_WCNN) by [1] for daily behavior recognition. A sensor status frequency-inverse type frequency based sensor data contribution significance analysis (CSA) method was developed for human daily activity recognition. Depend on individual human activity trajectories gradual spatial variation, the designed CSA method construct spatial distance matrix to decrease the data noise. But the designed method consumption time was not reduced. To address this problem, in this work, Partial Regression Feature Extraction model is introduced that with the assist of partial regression function extracts the dimensionality reduced features involved inside smart healthcare monitoring and thus minimizing the smart healthcare monitoring time in a significant approach. An IoT-based human activity monitoring model was proposed in [2] to continuously verify the elder people behavior by means of smart sensor-based technologies. In this model, different machine learning algorithms were employed to detect any risk in human activity behavior. But it failed to consider the computational overhead. To address this issue, Support Vector Intelligent Agent Learning for Smart Healthcare Monitoring is proposed that with the assist of optimal model and monitoring at different time, diminishes the overhead and false positive rate. The major contribution of the proposed method is explained as given below:
To develop machine learning and intelligent agent based smart healthcare monitoring method for Heart Rate signal analysis.
To extract the computationally efficient and relevant features, Statistical Partial Regression Feature Extraction model is designed for smart healthcaremonitoring by means of partial least square.
To design Support Vector Intelligent Healthcare Monitoring algorithm with the extracted feature for making analysis with respect to Heart Rate signals by using Intelligent Agent Machine Learning technique using Support Vector. A comprehensive experimental assessment carried out with a variety of performance metrics to illustrate the improvement of the SPR-SVIAL method over conventional methods.
In this paper, Section 2 reviews the related work in smart healthcare monitoring. Explanations about the proposed method that comprises machine learning and intelligent agent are given in Section 3. Section 4 demonstrates the suggested method experimental outcome using two existing smart healthcare monitoring methods and elaborately comparing their results. Section 5 shows experimental outcome.
IoT involves a network of physical devices that are interrelated in an electronically mode according to network connectivity, that are used as software sensors. These IoT devices help to enable data obtaining and swapping. Generally, Smart healthcare or health monitoring system requires numerous devices to link with each other ranging from devices monitoring blood pressure, blood glucose, BMI to EEG. Deep CNN hyperparameter optimization algorithms were designed in [3] for sensor-based human activity recognition. The metaheuristic algorithms-based strategies were investigated to automatically pick the optimum CNN model hyperparameters. But the designed method performance outcome was not better. Human Activity Recognition was overviewed in [4] by means of Wearable Sensors. Also, it highlights HAR systems vital components, comprising sensor factors, data segmentation, feature extraction and selection, and AI model comparison.
In Smart Healthcare System, Wearable Sensor-Based Human Activity Recognition was performed by [5] to examine the wearable sensors basis entire HAR feature using the wearable sensor location, data preprocessing and the recognition methods. In this the performance accuracy was not improved. Embedded Sensor Data Fusion based Human Activity Recognition was developed by [6] for the Internet of Healthcare Things. So, the designed model performance was not enhanced.
IoT sensors assisted physical activity recognition and health monitoring was developed by [7] to identify dissimilar human on a daily basis physical activity. But the performance accuracy was not highly attained with less time consumption. An efficient wearable sensor-depend human activity recognition approach was developed by [8] for precisely recognizing physical activities. The sensor data unprocessed inertial signal value was converted into pixel value through encoding technique. Hence, also a hierarchical combination model was not developed to augment the intra-class activity accuracy.
IoT-enabled smart mask was introduced by [9] for monitoring body parameters and location via cloud. Also, it effectively protects against the COVID-19 spread in addition to data processed for alarms related to temperature and social distancing. Hence, the performance time was not computed. Real-Time Human Activity Recognition System was designed by [10] for Next-Generation Healthcare. In this designed system, machine-learning techniques are applied to get better monitoring performance. But it failed to consider the processing memory usage.
A novel Human Activity Recognition method was developed by [11] for Next-Generation 6G-Enabled Healthcare System. In this approach was better precision and reliability for human activity monitoring application. But the analyzing time was not addressed. A novel supervised denoising algorithm was proposed [12] for elevating the horizontal and vertical periodic noise from the 2D spatiotemporal images. The proposed approach augments the activity classification accuracy but, it failed to focus on the occurring performance overhead.
A smart energy data with activity recognition (SEDAR) system was introduced by [13] to identify elder people behavior patterns using machine learning (ML) techniques. But it failed to deal with class imbalance issue, because special algorithms were not developed. An optimized machine learning techniques were developed by [14] for Human activity recognition during cyber-physical systems. But it failed to address the HAR issue. A new deep-learning design framework was developed by [15] for real-time HAR from wearable sensors. As by which it failed to augment the tradeoff amid accuracy and performance efficiency. A Deep Learning Network with Aggregation Residual Transformation method was designed by [16] for Human Activity Recognition by means of Inertial and Stretch Sensors. So, different human activity patterns were not extracted.
A new locomotion traces depend daily activities detection method was developed by [17] to augment the expressive features extraction from sensor data. Hence it failed to increase the activity detection rate. Deep learning-based CNN-LSTM approaches were developed by [18] to create predictions regarding human activities. But the models were not effectively implemented to a bigger dataset. A low-cost Wireless Body Area Network was developed in [19] for Human Activity Recognition inside Healthy Life and Medical Applications. So, it failed to perform effective data analysis. Moran Autocorrelation and Regression-depend Elman Recurrent Neural Network (MAR-ERNN) was introduced by [20] to predict abnormalities for activity recognition by means of Artificial Intelligence (AI) in the IoT healthcare. But it failed to recognize the disease with minimal time consumption.
To summarize, numerous smart healthcare systems are designed with the aim of fast diagnosis execution and to monitor the close patient’s health condition. In order to high accurately monitor smart healthcare with less time and false positive rate, machine learning and intelligent agent technique used in the proposed method. The detailed design of the proposed Statistical Partial Regression and Support Vector Intelligent Agent Learning (SPR-SVIAL) method for Smart Healthcare Monitoring is given below.
3 Statistical Partial Regression and Support Vector Intelligent Agent Learning (SPR-SVIAL) for Smart Healthcare Monitoring
Internet-of-Things (IoT) produces huge data and it is processed, analyzed and stored in cloud. IoT wearable activity tracking for Smart Healthcare Monitoring has attained better response. These massive data analytics resulting monitoring time in cloud is high. The surge in monitoring time and overhead results in slow response rate between the patient and doctor and also analysis falsification is incurred. To overcome the issues, Statistical Partial Regression and Support Vector Intelligent Agent Learning (SPR-SVIAL) method is designed to achieve high accurate Smart Healthcare Monitoring with less time, overhead, false positive rate. The architecture diagram of SPR-SVIAL method is shown in Fig. 1.
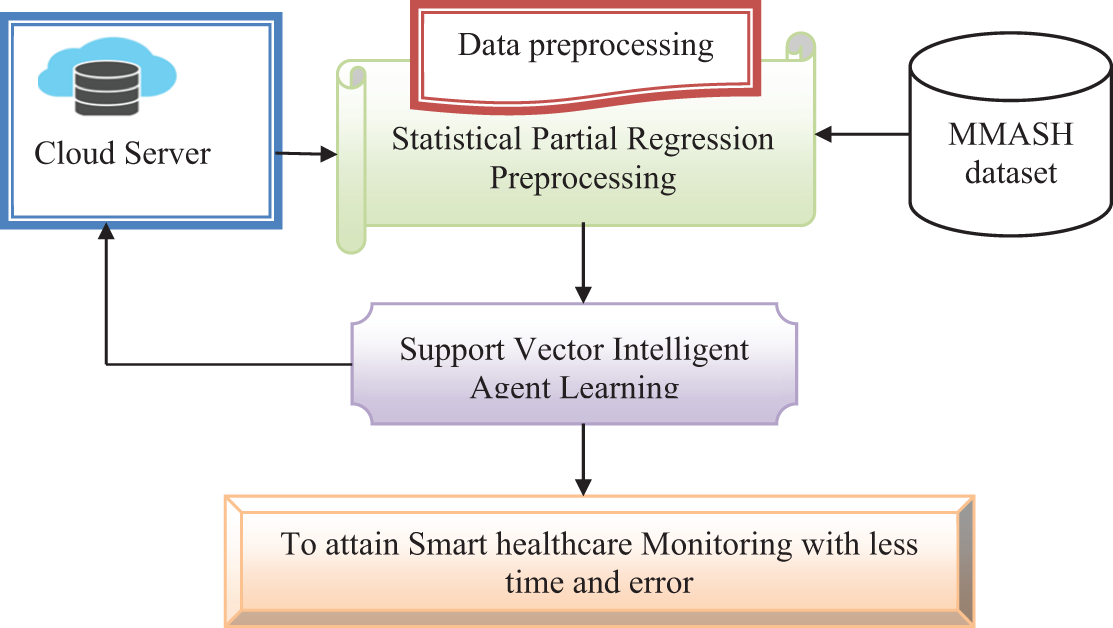
Figure 1: Architecture diagram of SPR-SVIAL
Below figure, the proposed SPR-SVIAL method fusses Statistical Partial Regression Feature Extraction model and Support Vector Intelligent Agent Learning for Smart Healthcare Monitoring. The input data obtained from wearable IoT sensors. Then, implement feature extraction and smart healthcare monitoring and the results are stores separately in the cloud server. The SPR-SVIAL method detailed description is given below.
IoT based Smart Health Care Monitoring with Human Activity Recognition using dataset is Multilevel Monitoring of Activity and Sleep in Healthcare monitoring that contains seven files (seven vectors) for each user. The seven files are user info, sleep, activity, actigraph, questionnaire, RR and saliva. Each file has different numbers of features, with 4 features in user info, 15 features in sleep, 12 features in activity, 12 features in actigraph, 7 features in questionnaire, 3 features in RR and single feature in saliva, respectively. The seven vectors is mathematically indicated as follows:
According to the participation of extreme behavioral data obtained by the sensor, it becomes unfeasible to input each data. Therefore, re-sampling is to perform proceeding to data input to the model. In this work, Activity class’s throughput the information is re-sampled in a uniform pattern with a 200 Hz sampling frequency. A triaxial accelerometer is employed to gather the information, inclinometer along ‘

In this process, three time series along ‘
where
3.3 Statistical Partial Regression Feature Extraction Model
In this method, with the preprocessed features (preprocessed activities), Body Accelerometer Statistical Partial Least Square Regression model is employed for feature extraction to decrease the dimensionality involved in dissimilar activities facets.
Dimensionality reduction decreases the assessing problem ‘
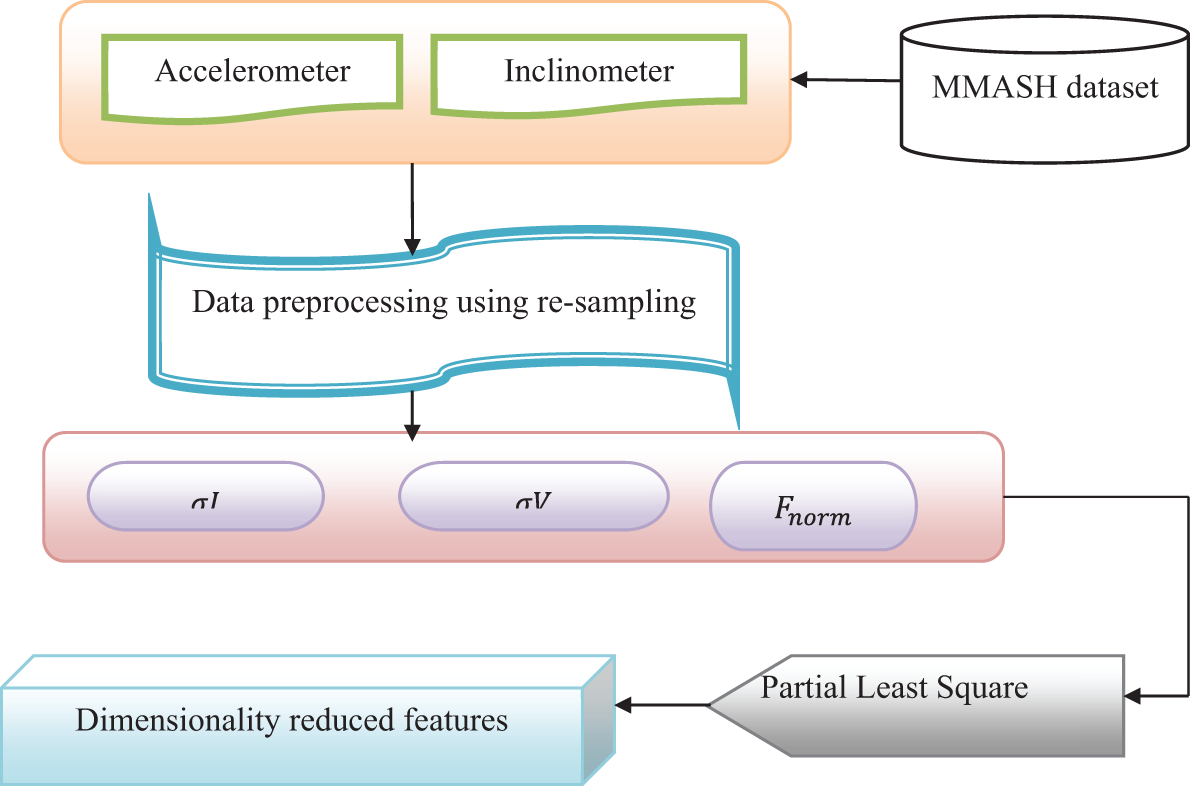
Figure 2: Architecture diagram of statistical partial regression feature extraction model
In Fig. 2, Partial Least Squares is used to identify a innovative smaller set of feature vectors that are in accordance to the original feature vectors linear mixtures, after that employing the least squares, new ‘
where
Lastly, the Z-score normalization ‘
From (7), the dimensionality reduced (i.e., normalized features) are acquired basis of the significant representation data ‘
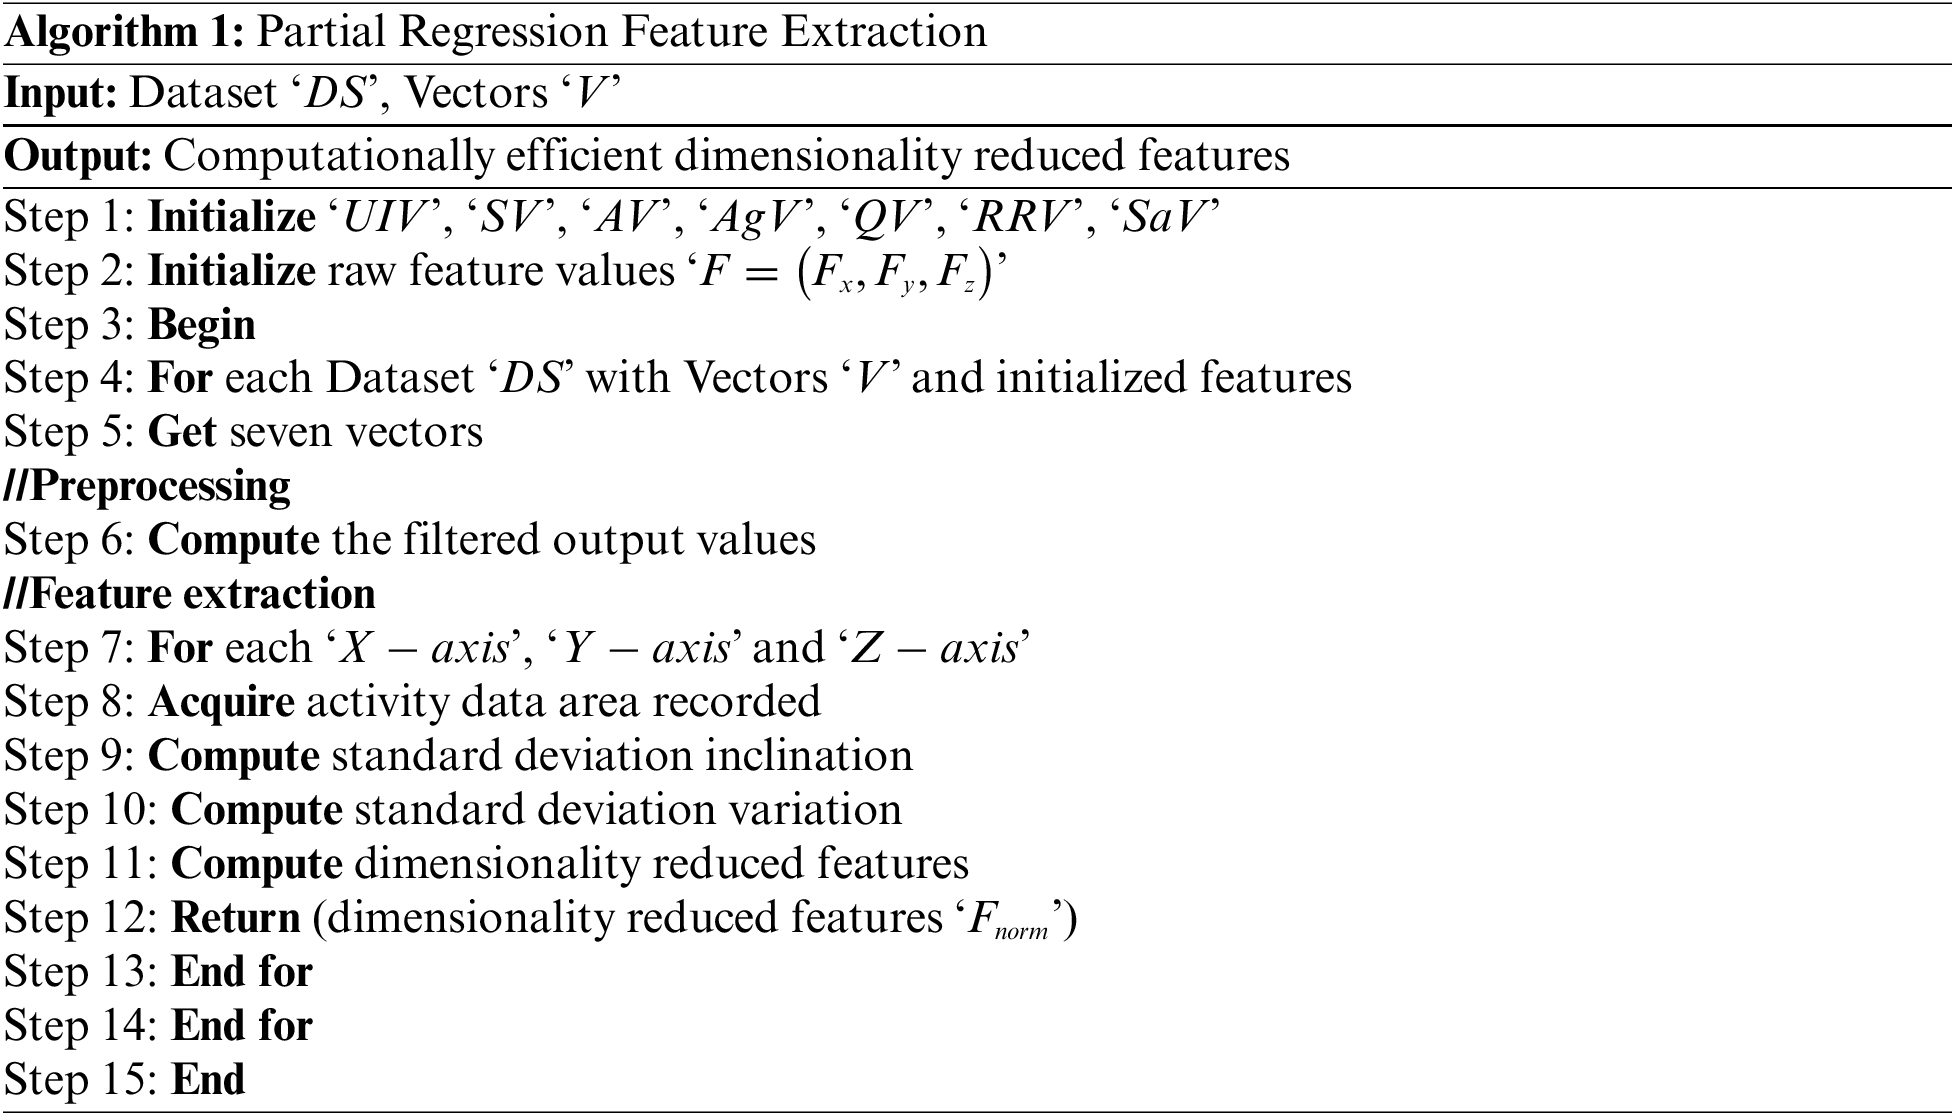
Algorithm 2 given above describes the Partial Regression Feature Extraction algorithm for reducing the smart healthcare monitoring time and also focusing on the specificity, sensitivity and accuracy rate. To attain the actual input feature preprocessing is performed by means of re-sampling, thus obtaining the filtered output values. Then, partial regression function is implemented to body accelerometer signals by means of partial regression function that gets the dimensionality reduced features, necessary for healthcare monitoring, hence minimizing the time involved.
3.4 Support Vector Intelligent Agent Learning for Smart Healthcare Monitoring
With the dimensionality reduced features, a Support Vector Intelligent Agent Learning model is implemented for Smart Healthcare Monitoring with Human Activity Recognition with less false rate and overhead. In Smart Healthcare Monitoring, the fortunate exploitation of intelligent agent has fascinated investigators to apply this paradigm. The proposed Intelligent Agent utilization in Smart Healthcare Monitoring has been to manage several medical and health related problems, like, patients scheduling, organ transplantation hospital administration, many more. In this designed method, Intelligent Agent Learning has been implemented during analyzing the person’s heart rate variation at dissimilar timestamps to recognize intensive behavior and monitor irregularities. The Support Vector Intelligent Agent Learning for Smart Healthcare Monitoring flow diagram is illustrated in Fig. 3.
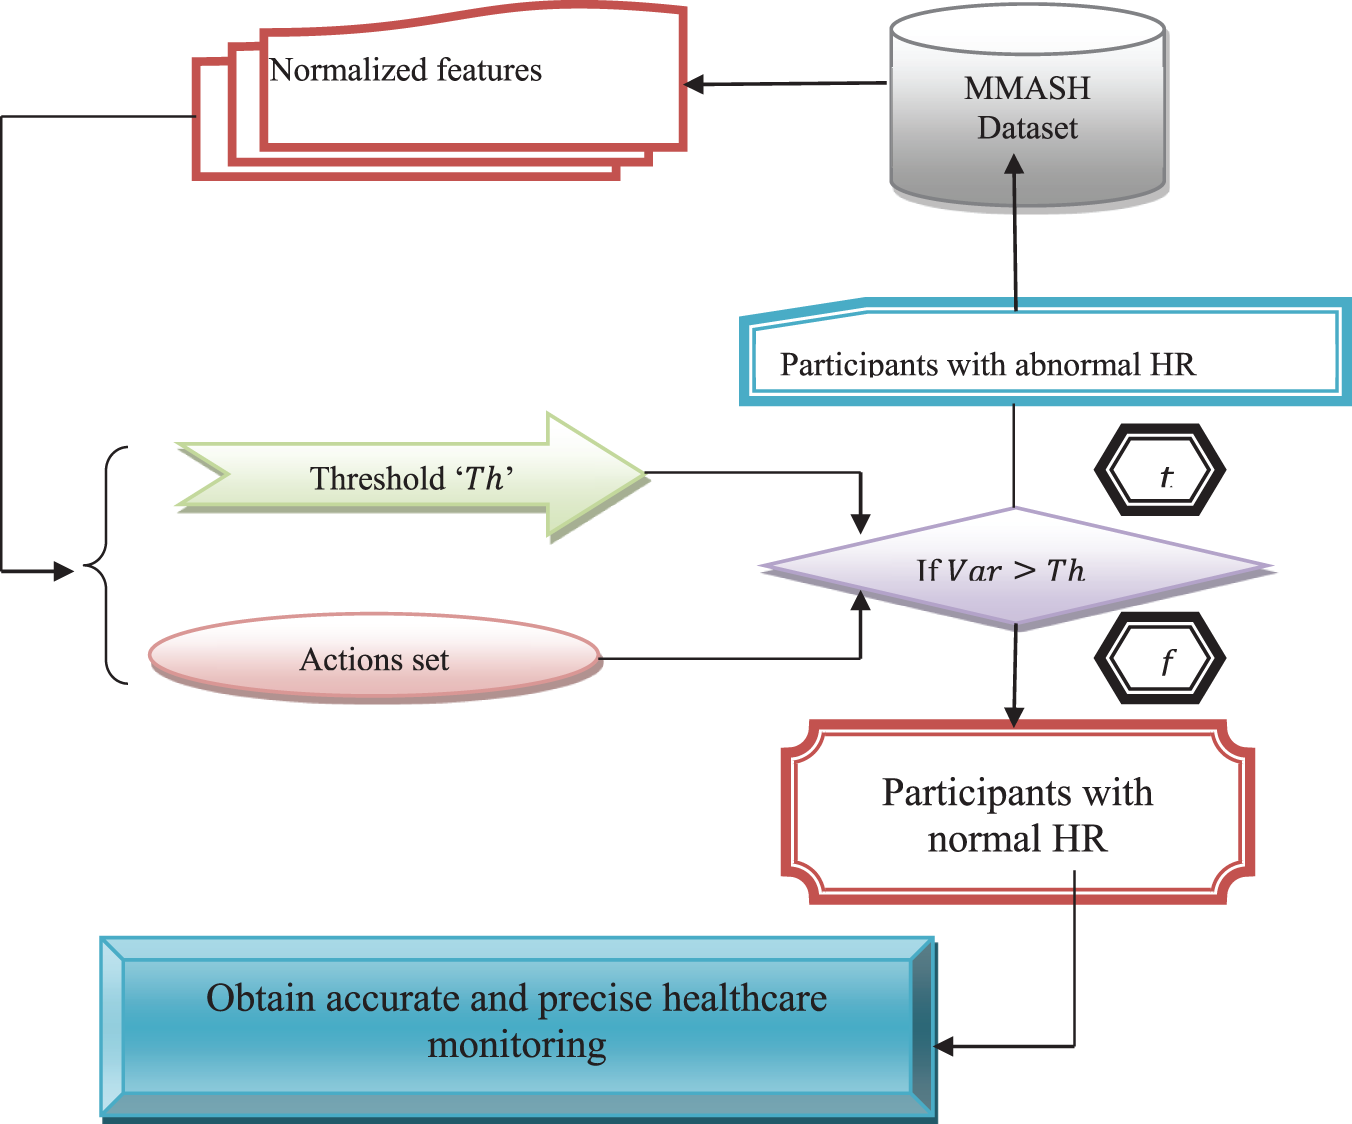
Figure 3: Flow diagram of support vector intelligent agent learning for smart healthcare monitoring
Fig. 4 illustrates the agents in Intelligent Agent Learning comprise structural design and a program that execute on that flow diagram. In this method, specifically focusing in designing the programs by means of four factors to consider, that is, ‘
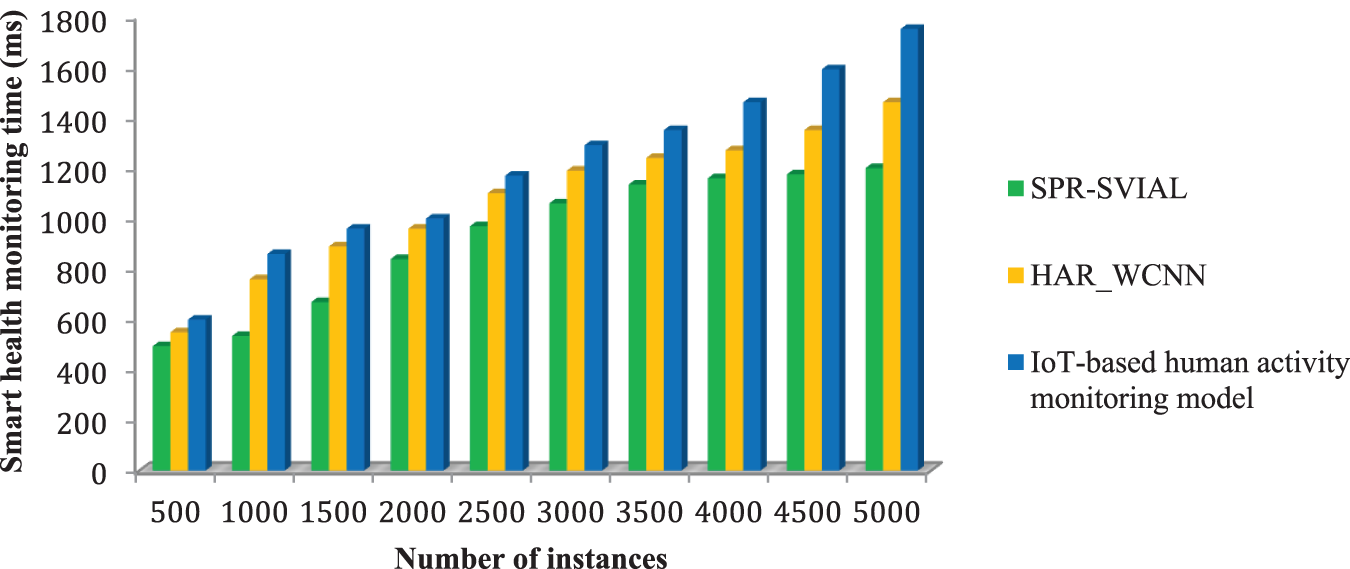
Figure 4: Performance analysis of prediction time
Next, the designed Smart Healthcare Monitoring actions or the outputs remains during analyzing the heart rate depend on the list of activity classes performed throughout the day with minimal false positive rate and overhead. In order to attain this, let us consider a activities training set ‘
where ‘
Amid them, in designed method three set of actions are employed, the minimum Heart Rate ‘
From (11), the less Heart Rate with respect to high Heart Rate correlative factor ‘CorrelativeMinMaxHR’ is computed on the basis of the Heart Rate ‘
From (12), the maximum Heart Rate with respect to less Heart Rate correlative factor ‘
The algorithm of Support Vector Intelligent Healthcare Monitoring is given below.
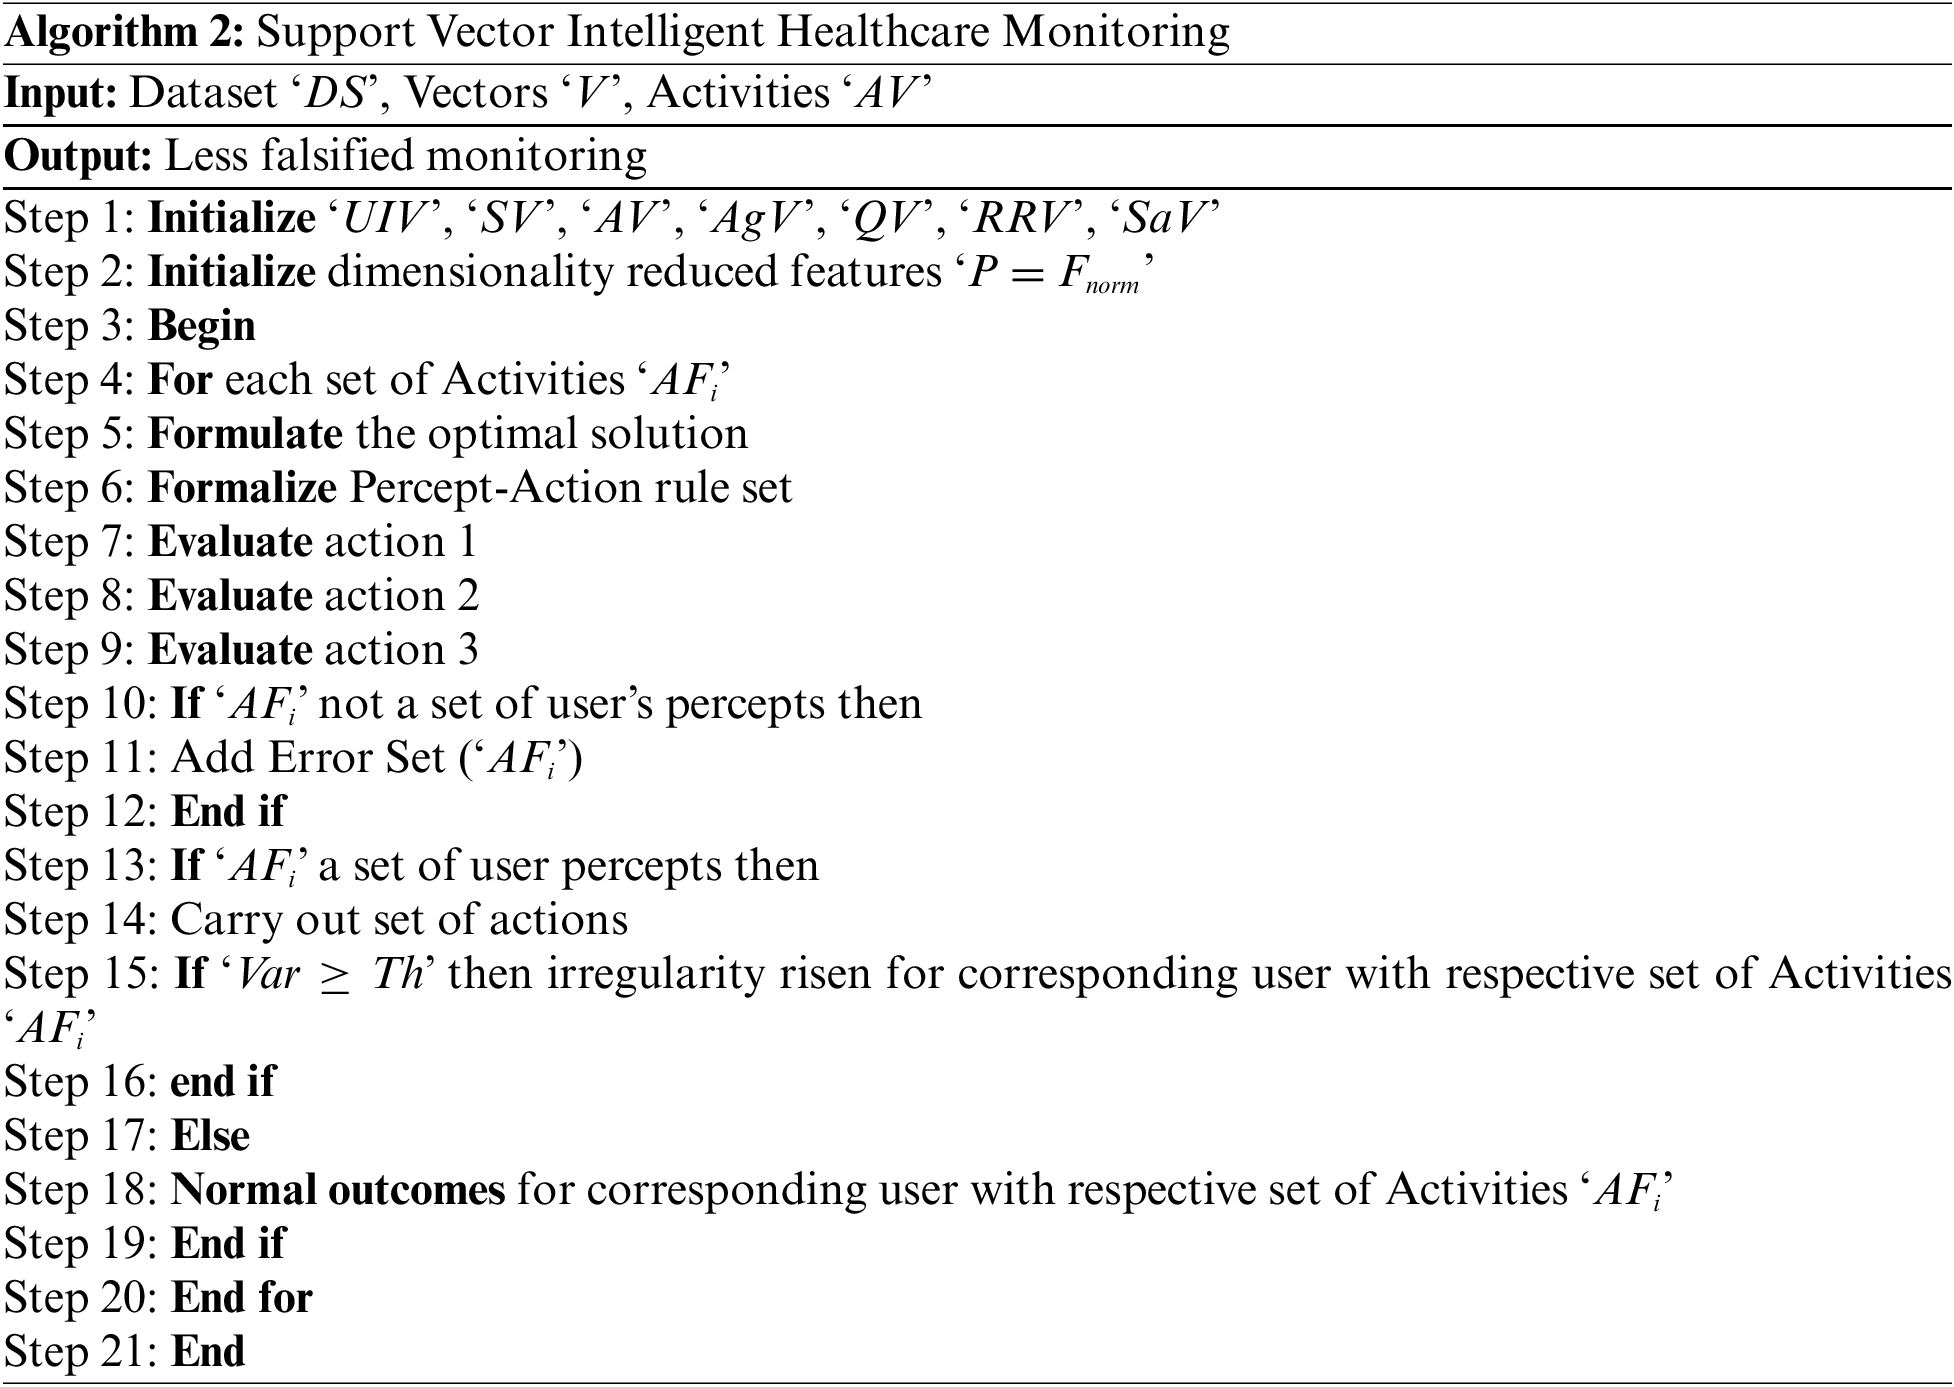
Algorithm 2 given above describes the Support Vector Intelligent Healthcare Monitoring algorithm to achieve less false positive rate and the overhead incurred in healthcare monitoring. This is due to the reason that significant numbers of activities are falsely perceived to anomalous with the participation of larger number of features. In order to overcome, an Intelligent Agent Machine Learning technique using Support Vector with a perfect Percept-Action rule set is formalized to decrease the overhead incurred by means of the percept based three sets of actions. After that, with the optimal solution formulation, the false positive rate is reduced by considering the beats per minute variation of the participant steps per second over time.
Above this designed model is simulated using CloudSim simulation platform. Table 2 illustrates the simulation parameters used in the simulation. The Multilevel Monitoring of Activity and Sleep inside Healthy people (MMASH) dataset bestows continuous beat-to-beat heart data, triaxial accelerometer data, sleep quality, physical activity and psychological features gathered in duration of 24 h for 22 dissimilar as well as unique healthy participants.

With this dataset, wearable activity trackers were gathered for 24 h a day, 7 days a week, with that monitoring of physical activity, Heart Rate (HR) and sleep quality is done within a significant approach. With the incorporation of this information kind, the participant’s wellbeing is analyzed inside an effectual method. The data were acquired from BioBeats (http://biobeats.com) that generates IoT wearable devices for heart rate signal monitoring and offering feedback accordingly.
In this section we mainly focus on the state of methods and results of the proposed SPR-SVIAL method with the existing HAR_WCNN [1] and IoT-based human activity monitoring model [2] for Smart Healthcare Monitoring. Assessment metrics employed for analyzing the performance of both proposed and existing methods are listed as follows:
1) Smart healthcare monitoring time,
2) Smart healthcare monitoring overhead,
3) False positive rate and accuracy with respect to different numbers of participants.
5.1 Performance Analysis of Smart Health Monitoring Time
Recently, Smart Healthcare Monitoring methods have quickly progressed and smart systems have been designed with the aim of observes the patient health conditions globally. The proposed method is implemented to focus on monitoring the patient’s Heart Rate beats per minute. As the significant amount of time taken for monitoring the patient’s Heart Rate signals is called as Smart Health Monitoring Time and it is mathematically expressed,
From (14), the Smart Health Monitoring Time ‘

Fig. 4 demonstrates the smart healthcare monitoring time by means of the three different methods, SPR-SVIAL, HAR_WCNN [1] and IoT-based human activity monitoring model [2]. As shown in the above figure, 5000 instances were acquired from 22 different participants contains both male and female. A surge was monitored in smart healthcare monitoring time with amplify in the number of instances. This is because amplifying the instance frequency causes different numbers of behavior to observed for Heart Rate signal analysis and thus causing an augment in the smart healthcare monitoring time.
However, with ‘
5.2 Performance analysis of Smart Health Monitoring Overhead
Within IoT, a considerable quantity of information is processed and communication through accelerometer and inclinometer. For Smart Healthcare Monitoring, IoT depend connected via wearable devices to observe different biomedical signals, a small portion of overhead is consumed and it is mathematically determined by,
From (15), the Smart Health Monitoring overhead ‘
The smart healthcare monitoring overhead results for diverse instances acquired at different time intervals is shown in Table 4. In addition to, shows the performance comparison of the proposed smart healthcare monitoring method with the state-of-the-art methods, HAR_WCNN [1] and IoT-based human activity monitoring model [2].

Fig. 5 illustrates the smart health monitoring overhead for different numbers of instances in the range of 500 to 5000 obtained from 22 different participants obtained from IoT wearable devices to observe heart rate signals. From the figure the overhead incurred during storing the intermediate data for analyzing health increases with the augment in the instances gathered and hence an increase in the overhead is occurred. In spite of this, with ‘
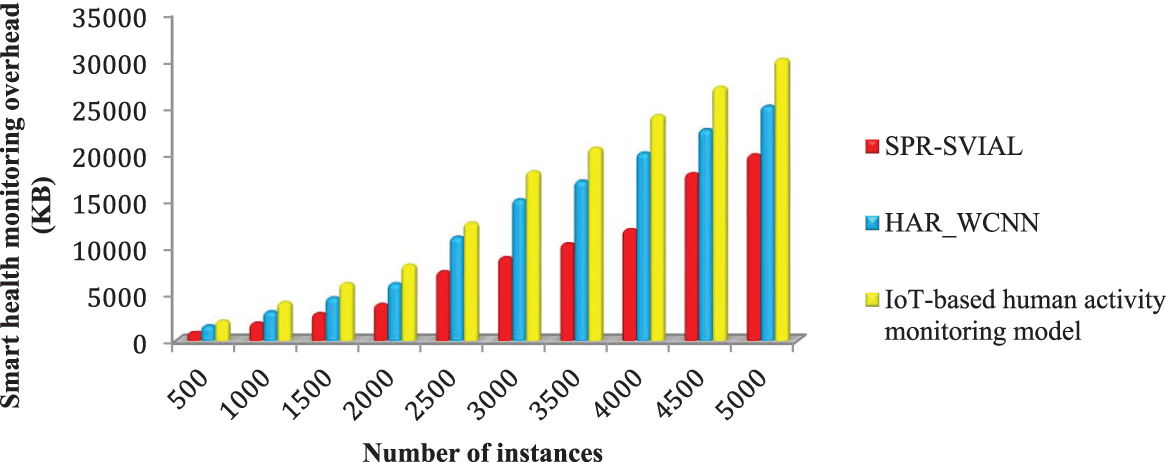
Figure 5: Performance analysis of smart health monitoring overhead
5.3 Performance Analysis of False Positive Rate and Accuracy
Lastly, the false positive rate and accuracy were analyzed. With the intention of this work is s to considerably lessen the rate of false positive and maintain a high accuracy. The false positive rate is described as the ratio of suppressed false rates to the total number of false rates. Accuracy is described as to the ratio of ability of the system to identify positive results with respect to instances. The accuracy and false positive rate for smart healthcare monitoring for different numbers of instances, detailed comparison amid the proposed smart healthcare monitoring method with the state-of-the-art methods, HAR_WCNN [1] and IoT-based human activity monitoring model [2] is also shown in Table 5 [5].

Fig. 6 shows the graphical diagram of false positive and accuracy rate. Depend on the results we remark that the novel SPR-SVIAL method has the less false positive rate and high accuracy rate. According to three sets of actions and accordingly health monitoring analysis was carried out, an Intelligent Agent Machine Learning model using Support Vector was used and a perfect Percept-Action rule set was implemented in this algorithm. This in turn helped in increasing the accuracy rate using SPR-SVIAL method by 5% compared to [1] and 16% [2], respectively. As well, only depend on the optimal solution formulates, beats per minute variation of the participant steps per second overtime are considered that in turn assisted in reducing the false positive rate using SPR-SVIAL method by 28% compared to [1] and 41% compared to [2], respectively.
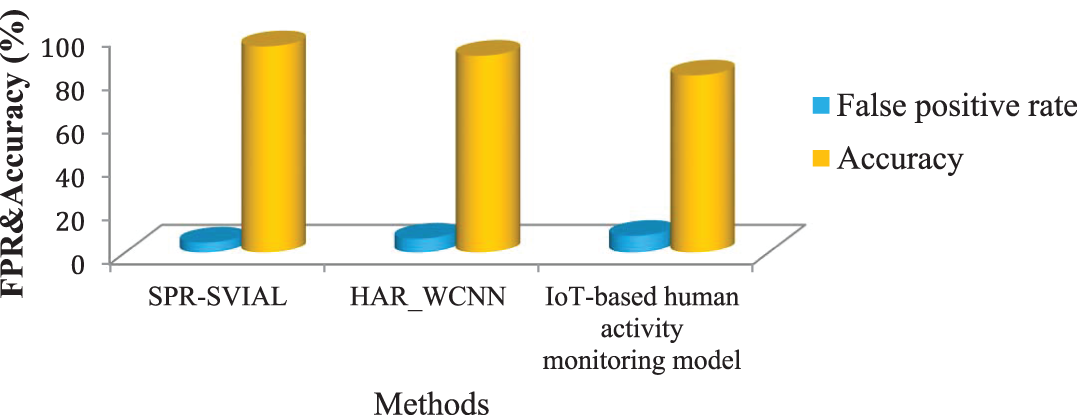
Figure 6: Performance analyses of false positive rate and accuracy
This work has effectively investigated the challenges in smart healthcare monitoring with HAR. This method aims to simultaneously attain high accuracy with minimum time, overhead, and false positive rate. To attain these objectives, we proposed a novel method called Statistical Partial Regression and Support Vector Intelligent Agent Learning (SPR-SVIAL) for Smart Healthcare Monitoring, based on machine learning techniques and intelligent agents. It can perform better. The proposed method leverages the Statistical Partial Regression Feature Extraction model to extract dimensionality-reduced features. Also, it incorporates the support vector machine learning with the intelligent agent percept-action model to enhance the threshold value smart healthcare analysis. Simulation is performed with the MMASH dataset to measure the accuracy, time, overhead, and false positive rate involved in smart healthcare analysis. The overall performance analysis demonstrates that the presented SPR-SVIAL executed well in terms of the smart health monitoring time, overhead, false positive rate, and accuracy.
Acknowledgement: This research is supported by Princess Nourah bint Abdulrahman University Researchers Supporting Project Number (PNURSP2022R194) Princess Nourah bint Abdulrahman University, Riyadh, Saudi Arabia.
Funding Statement: This research is supported by Princess Nourah bint Abdulrahman University Researchers Supporting Project Number (PNURSP2022R194) Princess Nourah bint Abdulrahman University, Riyadh, Saudi Arabia.
Author Contributions: The authors confirm contribution to the paper as follows: study conception and design: Nithya Rekha Sivakumar, K. Akilandeswari; data collection: Nithya Rekha Sivakumar and Sara Abdelwahab Ghorashi; analysis and interpretation of results: Nithya Rekha Sivakumar, K. Akilandeswari, Hend Khalid Alkahtani, Shakila Basheer; draft manuscript preparation: Nithya Rekha Sivakumar, K. Akilandeswari, Shakila Basheer and Sara Abdelwahab Ghorashi. All authors reviewed the results and approved the final version of the manuscript.
Availability of Data and Materials: The data used in this paper can be requested from the corresponding author upon request.
Conflicts of Interest: The authors declare that they have no conflicts of interest to report regarding the present study.
References
1. Y. Li, G. C. Yang, Z. D. Su, S. B. Li and Y. Wang, “Human activity recognition based on multi environment sensor data,” Information Fusion, vol. 9, pp. 47–63, 2023. [Google Scholar]
2. N. Mehra and P. Mittal, “Machine learning (ML) based human activity recognition model using smart sensors in IoT environment,” in 2022 12th Int. Conf. on Cloud Computing, Data Science & Engineering (Confluence), Noida, India, pp. 1–6, 2022. [Google Scholar]
3. S. Raziani and M. Azimbagirad, “Deep CNN hyperparameter optimization algorithms for sensor-based human activity recognition,” Neuroscience Informatics, vol. 2, pp. 1–8, 2022. [Google Scholar]
4. R. Liu, A. A. Ramli, H. Zhang, E. Henricson and X. Liu, “An overview of human activity recognition using wearable sensors: Healthcare and artificial intelligence,” IEEE Access, vol. 12993, pp. 1–14, 2023. [Google Scholar]
5. F. Serpush, M. B. Menhaj, B. Masoumi and B. Karasfi, “Wearable sensor-based human activity recognition in the smart healthcare system,” Computational Intelligence and Neuroscience, vol. 2022, pp. 1–31, 2022. [Google Scholar]
6. M. E. Issa, A. M. Helmi, M. A. A. Al-Qaness, A. Dahou, M. A. Elaziz et al., “Human activity recognition based on embedded sensor data fusion for the Internet of Healthcare Things,” Healthcare, vol. 10, pp. 1–16, 2022. [Google Scholar]
7. C. L. Zhong and Y. L. Li, “Internet of Things sensors assisted physical activity recognition and health monitoring of college students,” Measurement, vol. 159, pp. 1–9, 2020. [Google Scholar]
8. H. T. Thien, C. H. Hua, A. T. Nguyen and D. S. Kim, “Physical activity recognition with statistical-deep fusion model using multiple sensory data for smart health,” IEEE Internet of Things Journal, vol. 8, no. 3, pp. 1533– 1543, 2021. [Google Scholar]
9. S. Mekid and K. Chenaoua, “IoT-enabled smart mask for monitoring body parameters and location through cloud,” Internet of Things, vol. 22, pp. 1–17, 2023. [Google Scholar]
10. W. Taylor, S. A. Shah, K. Dashtipour, A. Zahid, Q. H. Abbasi et al., “An intelligent non-invasive real-time human activity recognition system for next-generation healthcare,” Sensors, vol. 20, pp. 1–20, 2020. [Google Scholar]
11. U. Saeed, S. A. Shah, M. Z. Khan, A. A. Alotaibi, T. Althobaiti et al., “Intelligent reflecting surface-based non-LOS human activity recognition for next-generation 6G-enabled healthcare system,” Sensors, vol. 22, pp. 1–14, 2022. [Google Scholar]
12. Y. Karayaneva, S. Sharifzadeh, Y. Jing and B. Tan, “Human activity recognition for AI-enabled healthcare using low-resolution infrared sensor data,” Sensors, vol. 23, pp. 1–23, 2023. [Google Scholar]
13. P. Franco, F. Condon, J. M. Martínez and M. A. Ahmed, “Enabling remote elderly care: Design and implementation of a smart energy data system with activity recognition,” Sensors, vol. 23, pp. 1–29, 2023. [Google Scholar]
14. I. Priyadarshini, R. Sharma, D. Bhatt and M. Al-Numay, “Human activity recognition in cyber-physical systems using optimized machine learning techniques,” Cluster Computing, vol. 26, pp. 2199–2215, Springer, 2023. [Google Scholar]
15. J. Park, W. S. Lim, D. W. Kim and J. Lee, “GTSNet: Flexible architecture under budget constraint for real-time human activity recognition from wearable sensor,” Engineering Applications of Artificial Intelligence, vol. 124, pp. 1–13, 2023. [Google Scholar]
16. S. Mekruksavanich and A. Jitpattanakul, “A deep learning network with aggregation residual transformation for human activity recognition using inertial and stretch sensors,” Computers, vol. 12, no. 141, pp. 1–19, 2023. [Google Scholar]
17. S. Zolfaghari, S. M. Massa and D. Riboni, “Activity recognition in smart homes via feature-rich visual extraction of locomotion traces,” Electronics, vol. 12, no. 9, pp. 1–21, 2023. [Google Scholar]
18. V. Aruna, A. Deepthi and R. Leelavathi, “Human activity recognition using single frame CNN and convolutional LSTM,” Applications of Artificial Intelligence and Machine Learning, vol. 925, pp. 205–214, 2022. [Google Scholar]
19. F. Demrozi, C. Turetta, P. H. Kindt, F. Chiarani, R. Bacchin et al., “A low-cost wireless body area network for human activity recognition in healthy life and medical applications,” IEEE Transactions on Emerging Topics in Computing, vol. 11, no. 99, pp. 1–12, 2023. [Google Scholar]
20. A. K. Munnangi, S. U. Kumar, V. Ravi, R. Sekaran and S. Kannan, “Survival study on deep learning techniques for IoT enabled smart healthcare system,” Health and Technology, vol. 13, pp. 215–228, 2023. [Google Scholar] [PubMed]
Cite This Article
 Copyright © 2024 The Author(s). Published by Tech Science Press.
This work is licensed under a Creative Commons Attribution 4.0 International License , which permits unrestricted use, distribution, and reproduction in any medium, provided the original work is properly cited.


 Submit a Paper
 Propose a Special lssue
 View Full Text
 Download PDF
 Downloads
 Citation Tools