
 Submit a Paper
 Propose a Special lssue
 Open Access
ARTICLE

Social Robot Detection Method with Improved Graph Neural Networks
Institute of Systems Security and Control, College of Computer Science and Technology, Xi’an University of Science and Technology, Xi’an, 710054, China
* Corresponding Author: Ou Ye. Email:
Computers, Materials & Continua 2024, 78(2), 1773-1795. https://doi.org/10.32604/cmc.2023.047130
Received 26 October 2023; Accepted 15 December 2023; Issue published 27 February 2024
 View Full Text
 Download PDF
Abstract
Social robot accounts controlled by artificial intelligence or humans are active in social networks, bringing negative impacts to network security and social life. Existing social robot detection methods based on graph neural networks suffer from the problem of many social network nodes and complex relationships, which makes it difficult to accurately describe the difference between the topological relations of nodes, resulting in low detection accuracy of social robots. This paper proposes a social robot detection method with the use of an improved neural network. First, social relationship subgraphs are constructed by leveraging the user’s social network to disentangle intricate social relationships effectively. Then, a linear modulated graph attention residual network model is devised to extract the node and network topology features of the social relation subgraph, thereby generating comprehensive social relation subgraph features, and the feature-wise linear modulation module of the model can better learn the differences between the nodes. Next, user text content and behavioral gene sequences are extracted to construct social behavioral features combined with the social relationship subgraph features. Finally, social robots can be more accurately identified by combining user behavioral and relationship features. By carrying out experimental studies based on the publicly available datasets TwiBot-20 and Cresci-15, the suggested method’s detection accuracies can achieve 86.73% and 97.86%, respectively. Compared with the existing mainstream approaches, the accuracy of the proposed method is 2.2% and 1.35% higher on the two datasets. The results show that the method proposed in this paper can effectively detect social robots and maintain a healthy ecological environment of social networks.Keywords
With the growth of the Internet, social media websites, such as Twitter, Facebook, and Weibo have gradually evolved into the primary forums for communication. These social platforms are widely used to read about current events around the world, take part in debates on various subjects, and share ideas. Social platforms’ enormous user bases and wealth of data gradually become the main target of malevolent individuals attempting to engage in illegal activities. As an automated program, social robots have been widely used in social platforms and are often used to carry out malicious activities [1], such as internet fraud, misleading publicity, and public opinion manipulation [2]. Social robots have been essential in shaping political public opinion in the US midterm elections [3], Indonesian presidential candidates [4], Boston Marathon bombings [5], Brexit [6], as well as other incidents. They also post phishing links on social media to disturb the peace of the community [7] and spread malicious content, such as the COVID-19 conspiracy theories [8]. It is vital to research how to effectively detect and identify social robots in social platforms as they pose a severe threat to both the safe growth of social networks and public safety.
With the continuous innovation of social robot technology, the new generations of social robots are able to express opinions, post information, and follow other users in social networks just like human users, and their actions are hidden and more difficult to detect. The existing social robot detection methods are mainly divided into traditional machine learning, deep learning and social graph-based methods. However, traditional machine learning methods often require manual design and selection of features, and may not capture critical information for complex social robot behavior. While deep learning methods can learn the characteristics of different users independently, it has poor adaptability when dealing with large-scale, sparsely connected or complex topological social networks. The method based on social graphs has been a research hotspot in recent years. Social network topology has been used to learn the behavior of social robots and can learn the automation traces of social robots more comprehensively. Among them, the Graph Neural Networks (GNN) [9] method can mine prospective social robot properties, more accurately detect social robots, and extract the topological structural aspects of social networks. Approaches for detecting social robots use GNN [10–12] to build social network graphs based on user relationships. Then, the social network graph’s properties are used to execute social robot detection. However, there are still several issues with this kind of methodology, including the size, density, and complexity of social networks. The information from adjacent nodes will make the node embedding representation on average too smooth when the node embedding dimension is large, which weakens the node characteristics and distinctions. Different nearby nodes can link to the same node in various ways, and there are various connection types between them. The existing graph embedding methods ignore these issues when aggregating adjacent node features, which makes it difficult to describe the topological relationship features of nodes in social networks.
This paper proposes an improved graph neural network social robot detection method to address the aforementioned issues and offer technical support for social platforms to successfully detect social robots. The approach involves constructing subgraphs of social relations according to the user’s followed and following relations, localized processing and analysis to address the challenges posed by large-scale networks with numerous nodes. Subsequently, a Residual Graph Attention Network model with Feature-wise Linear Modulation (ResGAT-FiLM) is constructed to effectively learn the differences between nodes and extract the node and topological structure features of users in the social relationship subgraphs. Text and behavioral gene sequences are extracted from users’ published contents to obtain social behavior features, which are used as auxiliary feature learning modules to increase the scalability and flexibility of the model. Finally, social relationship subgraphs are combined with social behavioral features to better reveal the correlation between social relationships and behaviors, providing a more accurate and rich feature description for subsequent social robot detection. The contributions of this paper are as follows:
• To reduce the complexity of the social network, we extract the social relationship subgraphs from the user’s following and the followed relationships.
• A feature-wise linear modulated graph attention residual network model is constructed, introducing feature-wise linear modulation (FiLM) and residual structure are introduced into the graph attention convolutional network to learn the topological differences among social network nodes more effectively.
• The text properties of the user’s published content types are combined with behavioral gene sequences to create the user’s social behavior traits. The model’s scalability is improved by using this feature as an additional learning module.
This paper is organized as follows: Section 2 provides a brief overview of the current social robot detection methods; Section 3 presents a detailed introduction to the proposed social robot detection methods; in Section 4, we analyze and evaluate the experimental findings; the conclusions are provided in Section 5.
Current approaches for social robot detection are briefly reviewed and summarized in this section. We focus on three social robot identification techniques based on traditional machine learning, deep learning, and social graphs, respectively.
2.1 Social Robot Detection Method Based on Traditional Machine Learning
In traditional machine learning methods, different features such as user attributes, text, emotion, and behavior are extracted through manual feature design and these features are input into traditional machine learning classification algorithms to identify social robots [13]. Commonly use algorithms include XGBoost [14], Support vector Machine [15], Bayesian learning [16], Decision tree [17], Random forest, and Adaboost [18,19]. Octavio et al. [20] used K decision trees to compare and classify various emotional features contained in user text information, which can effectively identify social robots. However, this method is only applicable to English and Spanish. Yang et al. [21] proposed a framework that relies solely on user profiles. By choosing a subset of data and combining the diversity of the dataset to create a more reliable random forest classifier, their strategy increases the generalization ability of social robot identification. To achieve the detection of social robots while taking into account both user features and text content features, Kouvela et al. [22] employed the random forest algorithm to address the limitation issue brought on by a single feature in the detection of social robots. Sayyadiharikandeh et al. [23] designed the diversity processing methods of various types of robots by extracting 1200 features based on six components account metadata, interaction structure, temporal features, content information, and emotions, respectively. This approach realizes the classification of social robots by employing several specialized classifiers, each of which recognizes a particular kind of social robot. Samaneh and Maghsoud [24] extracted a new feature, the friendship preference feature, from the fan attribute and use the random forest, Adaboost, support vector machines, and k-Nearest Neighbors classification algorithm to evaluate the effectiveness and scalability of the friendship preference feature, providing a new idea for the detection of social robots.
Nevertheless, classical machine learning techniques suffer from the low effectiveness of manually built features in social robot detection, and the selection of features may be restricted to specific elements [1]. Deep learning based social robot detection techniques have become a promising solution to these issues.
2.2 Social Robot Detection Method Based on Deep Learning
Deep learning can execute multi-level effective recognition of various social robot types with improved generalization performance in addition to automatically learning features. Convolutional neural networks (CNN), recurrent neural networks (RNN), long short-term memory networks (LSTM), and generative adversarial networks (GAN) are some examples of deep learning-based techniques that have been successfully applied in the field of social robot identification in recent years. Kudugunta et al. [25] exploited metadata and textual features to detect social bots at the tweet level and the account level, and used Bi-directional long short-term memory (BiLSTM) models and traditional machine learning algorithms, combined with new oversampling techniques to train the models and achieve highly accurate classification. Hayawi et al. [26] gathered numeric, binary, and textual data features from user profile metadata information. To efficiently recognize social robots, the model processes mixed sorts of information using LSTM units and a dense layer. Wu et al. [27] proposed a detection method for social robots based on deep neural networks and active learning. Active learning is used to extend the labeled data, extract 30 features from four categories of metadata, interaction, content, and time, and build a neural network model using the residual network, bidirectional gated loop unit, and attention mechanism to realize the detection of social robots. However, this detection method is designed for Weibo, and its performance on other social network platforms still needs to be tested. As a new technology, the generative adversarial network is applied in graph convolutional neural network, which can convert the knowledge in simulation data set into measured data [28], address the problem of fewer labels in social robot detection, and realize unsupervised social robot detection through adversarial network. Najari et al. [29] proposed a model based on GAN, in which the generator and discriminator are connected through the LSTM layer as a shared channel between them so that the model can automatically learn the behavior pattern of social robots, and social robots more accurately.
Although social robot detection methods based on deep learning can solve accuracy and performance problems to a certain extent, it is difficult to accurately depict the social relationships between users. Therefore, methods based on social network graphs have better feasibility. Building social network structures and graph embedding methods can learn the relationship characteristics.
2.3 Social Robot Detection Method Based on Social Graph
Methods based on social graphs regard social media users as nodes of the graph, and the relationships between users as edges of the graph. Social robot detection is performed by analyzing the relationships between these nodes and network structural characteristics. This type of method can use features such as node centrality and degree centrality on the graph to identify social robots, instead of being limited to the analysis of the user’s own profile and text information features. Random walk algorithms [30–32] and community detection methods [33,34] have been used to implement the detection of social robots. Pham et al. [35] proposed a method based on network representation learning and a random walk mechanism within a community. This method effectively maintains the local neighborhood relationships and internal community structure of user nodes without relying on additional user profile characteristics, and it can learn various types of social networks. Dehghan et al. [36] employed six graph embedding techniques to find complex aspects of nodes in social networks by extracting user attributes, text features, and network structure features.
Graph neural networks, as another novel technique, have recently been introduced to the field of social robot detection. This technology can efficiently utilize global information, process huge datasets, and automatically extract user traits and behavior patterns. Alhosseini et al. [37] proposed an embedded representation learning method based on Graph Convolutional Networks (GCN). This method combines node features and social graph structure to detect social robots from social graphs more accurately. Guo et al. [38] proposed a social robot detection method that combines a pre-trained language representation model Bidirectional Encoder Representation from Transformers (BERT) and GCN. In this method, text and words are used as nodes to construct a large heterogeneous text graph, BERT is used as the initialization vector of the text node, and GCN is used to embed the graph into the low-dimensional space for classification. Feng et al. [39] proposed a method based on multimodal feature coding and Relational Graph Convolutional Networks (RGCN). The approach builds a heterogeneous social network graph from text, attribute, and user connection data. It then trains the heterogeneous network using the graph’s convolutional network, which improves its capacity to detect various disguised robots. However, due to the high temporal and space complexity created by large-scale social network data, the changes in user relationships are easily ignored when using these methods, which decreases the effectiveness of social robot detection.
This section mainly introduces the social robot detection method based on an improved graph neural network. The overall process of the method is shown in Fig. 1, which mainly consists of four parts: construction of the social relationship subgraphs, extraction of subgraph features based on the ResGAT-FiLM model, extraction of social behavior features, and subgraph features and behavior features are integrated to classify social robots and normal users.
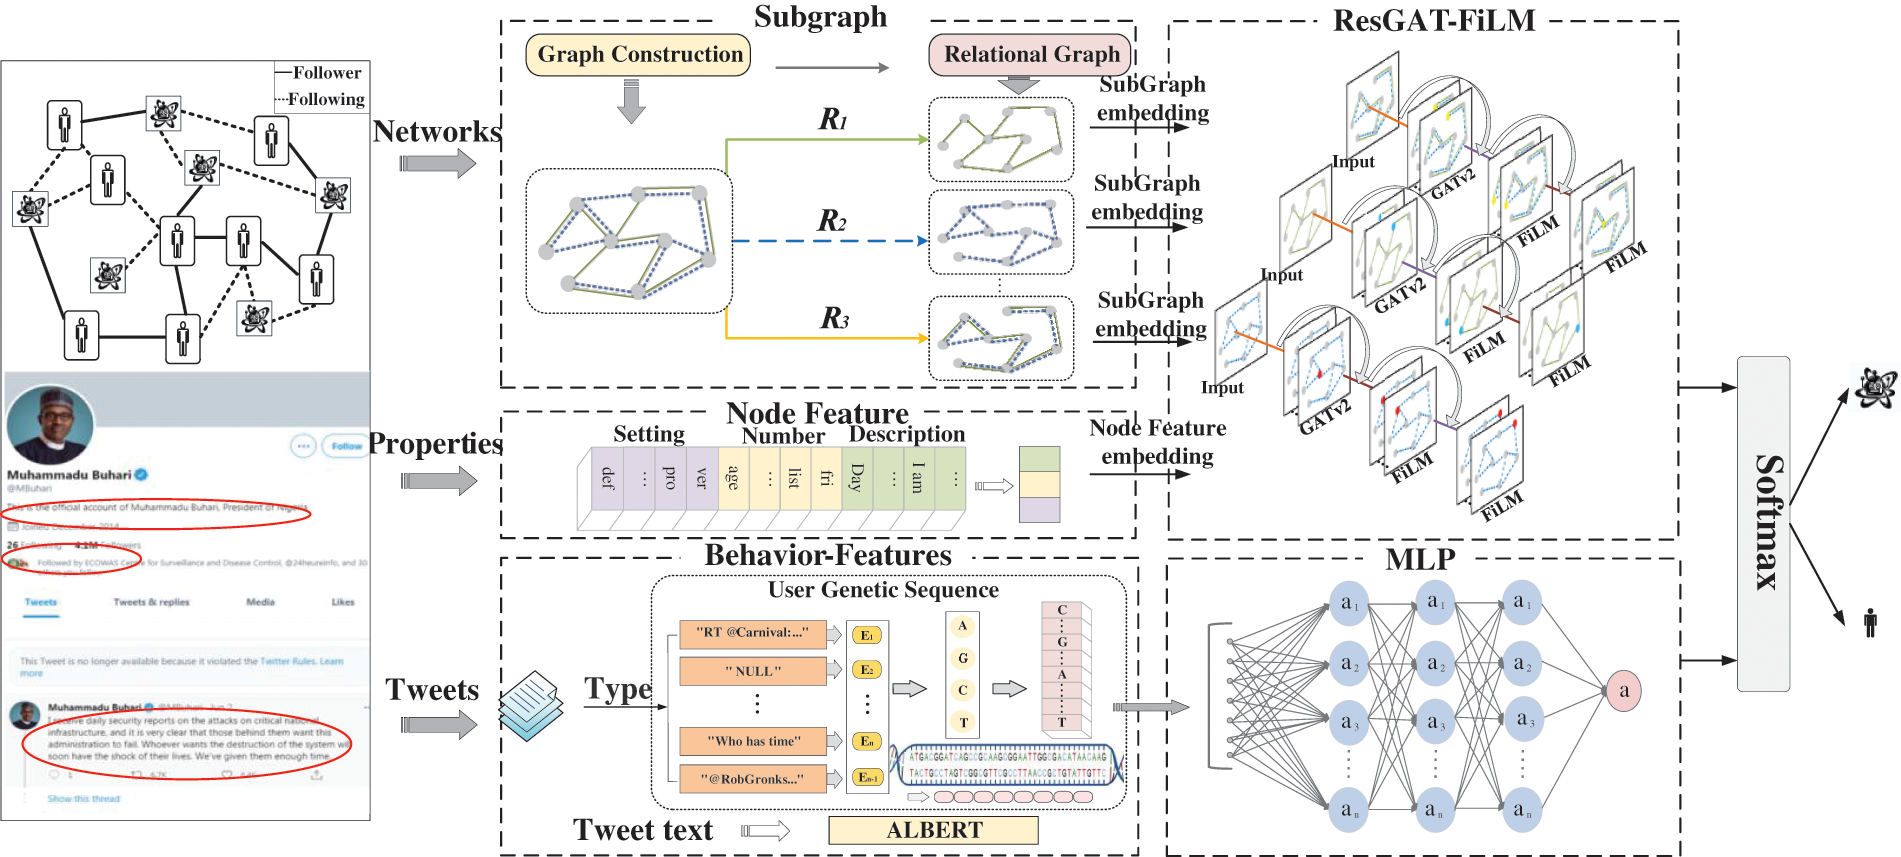
Figure 1: The social robot detection method based on an improved graph neural network
3.1 Construction of User Social Relationship Subgraph
3.1.1 Extracting Node Characteristics of Social Networks
Common metadata include user ID, username, number of fans, number of followers, number of likes, and account creation time. These features are relatively simple and easy to extract from the raw data and can be directly used as node features. In this paper, we analyze account metadata to extract numeric, configuration, description features, and use these features as node features for social networks, as shown in Table 1. Using these simple metadata features as node features reduces the dimensionality of feature embedding, reduces the computational and storage cost of feature embedding, and also reduces the occurrence of overfitting and noise interference. In addition, node features combined with user social relationship features reveal hidden patterns and trends to be analyzed to better understand the social relationships of social bots.

The numerical features shown in Table 1 can provide information on user activity, social status, and the numerical features are represented as m-dimensional vectors
The configuration features are shown in Table 1, include information about the user’s geographic location, background, and account type. The configuration features can provide a user’s background. The configuration features are represented as an n-dimensional vector
By using the full connected layer and the PReLU activation function to connect and transform the configuration features after Eq. (1), the user’s configuration feature vector
The description feature is shown in Table 1 and usually include information about a user’s hobbies, occupation, educational experience, and personality traits, which can be used to determine whether an account is authentic or not. Social bots usually provide false or vague personal descriptions to hide their real identities. To extract the description feature, the natural language processing model A Lite BERT (ALBERT) [40] is used in this paper. First, the text message posted by the user is transformed into a token, and the word vector representation is obtained:
where
The combination of the above extracted numerical features, configuration features and description feature constitutes the node feature
3.1.2 Constructing Social Relationship Subgraphs
Social relationships can help in identifying the correlation between social bots so that these bots can be better identified and removed. There are various ways to identify social relationships, including following, liking, commenting, and other behaviors between users. Human users typically establish real social relationships with other real users and actively participate in social interactions. In contrast, social bots may establish false social relationships by following, liking, commenting, and other behaviors in large numbers to mask their true identities.
Due to the large number of nodes and complex relationships in social networks, the computational complexity is high. This paper uses social attention subgraphs to streamline the network structure, reduce its complexity, and focus on key information. Social relationship subgraphs can identify the social attention characteristics of social robots, and can also learn the social relationships of different types of users, and analyze the abnormal dynamics of social robots in detail. This paper uses the following and followed relationships between users to construct a social relationship subgraph, represented by
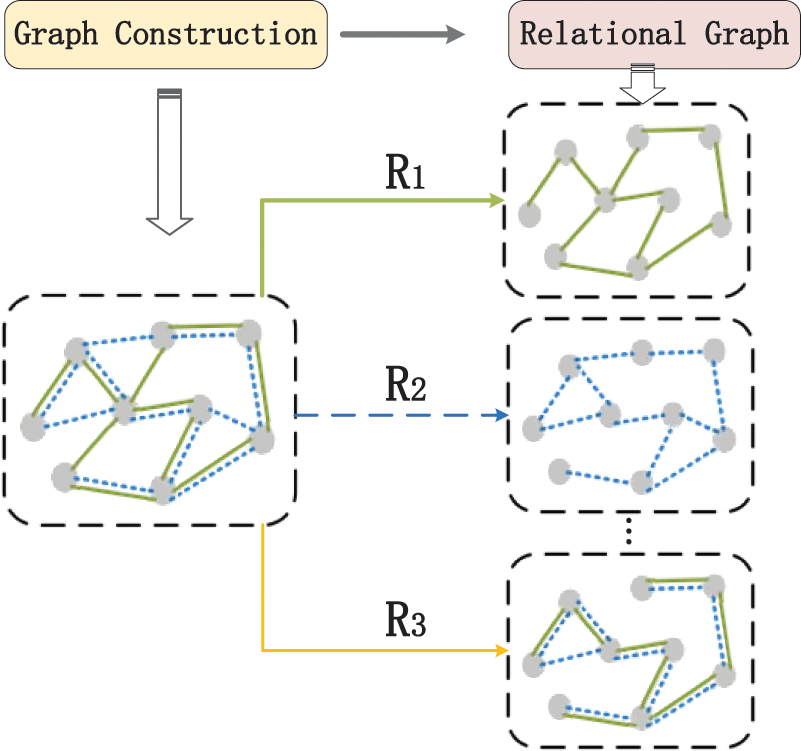
Figure 2: Social relationship subgraphs
3.2 Encoding of User Social Behavior Features
The content posted by users includes concealed data about their social behavior, in addition to metadata and social relationship features. The social behavior features of users are used in this study as an auxiliary module to supplement the model’s data, and later fusion [41] is adopted to integrate social behavior features with social relationship features to identify social robots more accurately, so as to analyze social robots from multiple perspectives. In this way, it is possible to avoid the interaction between behavioral traits and the structure of social networks, to learn more about various facets of user characteristics. The text characteristics and the DNA sequences characteristics of the posting type are two categories of social behavior traits that are taken from user posted content in this section.
Text features refer to features extracted from user posted content that describe the text content, including text length, words used, and emotional polarity (negative, neutral, positive). Social bots typically generate large amounts of automated text content with more mechanized speech patterns than human users, and can suffer from grammatical errors and text incoherence. Some social bots also mention or post content related to a particular topic, while human users post more diverse content. Specifically, we first extract the text content posted by users
3.2.2 Gene Sequences Feature Extraction
User interactions typically include tweets, retweets, and replies to comments, reflecting the differences between average users and social bots. This paper encodes the behavioral gene sequences characteristics according to the user interaction type, and the type of each text is represented by different characters, representing the bases of the gene sequences. The idea is derived from the digital DNA coding proposed by Cresci et al. [42], where they model the social behaviors of social network users similar to a biological DNA with its four nucleotide bases (A, C, G, T). The initial character of each text content is taken from the user’s published text
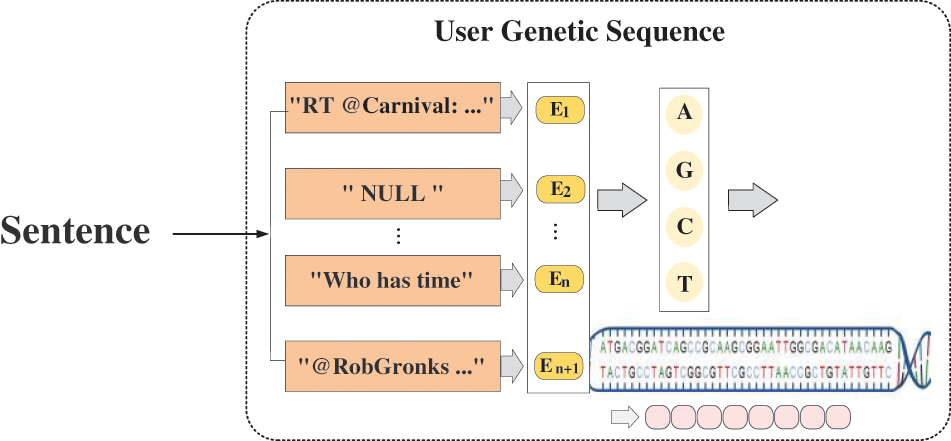
Figure 3: Behavioral gene sequences coding
where each user’s gene sequence is represented by
After coding, each user gets a behavioral gene sequence
The user’s text features and gene sequences features are combined to form social behavior feature
3.3 Improved Graph Neural Network for Social Robot Detection
This section aims to build the graph neural network model ResGAT-FiLM, extract the user’s social relationship subgraph features, and integrate them with social behavior features to realize social robot detection. graph attention networks (GAT) can encode the features of nodes and adjacent nodes. However, they may ignore the differences between node features when summarizing the features of adjacent nodes, making it difficult to describe the differences in topological relationships between nodes in social networks. This paper proposes a ResGAT-FiLM model to extract subgraph features of social relations. It uses the Graph Attention Network version2 (GATv2) [43] to dynamically compute the attention weights between nodes, followed by a graph convolutional layer with FiLM [44] introducing the GATv2 layer. The moderator and bias terms of FiLM adjust each node’s features by learning global and local information to maintain the feature differences between different nodes. The residual structure is introduced between the convolutional layers to avoid the problem of disappearing gradients, and it can also be used to learn the information embedded in the training and test data [45], thus providing the model with more detailed features, improving the training speed and generalization ability of the model, and thus processing large-scale graph data more effectively.
The user node features extracted in Section 3.1 are preprocessed using the full connection layer and LeakyReLU activation function. This is done to reduce the dimension of the input node features and increase the nonlinearity, aiming to enhance the expressiveness of the model. The processed node features and social relationship subgraph structure are input into GATv2, and the aggregated feature vector of each node is obtained. Calculate the attention weight of each node, vid Eq. (7).
where
The calculated attention weight is normalized by softmax, and the normalized attention weight
where
For each node, its own eigenvector
where
The input and output of the GATv2 layer are linearly transformed to get a vector
where
For the node feature vector
where
Then, the local transformation operation of the FiLM layer is carried out on the node feature vector
where
Combine features
The calculation process of the adjustment factor and bias term in FiLM is the same as in Eqs. (11) and (12).
Feature vectors
Finally, the output layer converts the feature vector to get
Then, this paper uses Focal Loss optimizer [46] to train the social robot detection model:
where
(a) Datasets
In this paper, we have selected two datasets, TwiBot-20 [47] and Cresci-15 [48], both of which are public datasets in the bot repository (botometer.osome). These datasets are utilized to construct social network relationship graphs. The dataset Cresci-15 consists of two types of human user sets, TFP and E13, and three types of social bot sets, FSF, INT, and TWT, which contain account information, postings, and social relationships for each user. Users in the dataset TwiBot-20 are classified into four interesting areas: politics, business, entertainment, and sports, and contain semantic, attribute, and neighborhood information about the users. The social relationships between users in these two datasets include following and followed relationships. Table 2 summarizes the statistics of these two datasets, where total represents the total number of users in the datasets, humans represent the number of human users, bots represent the number of social bots, tweets represent the number of texts posted by the users, and edge represents the number of social relationships contained in the datasets. In this paper, these two datasets are divided into training, validation, and testing sets, where 60% is used for training, 20% for validation and 20% for testing. A total of 11,836 users containing humans and bots are selected from the TwiBot-20 dataset for experiments.

(b) Environmental settings and hyperparameters
The experiments in this paper are conducted under Ubuntu 18.04 operating system using Python3.8 and Pytorch1.11 experimental environment on a workbench with Intel(R) Xeon(R) CPU E5-2686 v4 @ 2.30 GHz, NVIDIA GeForce RTX 3080 Ti and 60 GB memory capacity. To implement the proposed method, libraries such as NumPy, Pandas, Scikit-Learn and Torch geometric are applied.
Hyperparameters setting: The model was trained 120 times using AdamW optimization, and the feature embedding dimension is set to 132. The initial learning rate is set to 0.001, weight decay is set to 0.005, and the parameter dropout is set to 0.3.
(c) Evaluation metrics
In order to evaluate the performance of the proposed method, this paper uses four performance metrics: Precision, Recall, F1-score, and Accuracy [49]. TP (True Positive) represents the number of correctly detected social bots, FN (False Negative) represents the number of incorrectly detected social bots, FP (False Positive) is the number of incorrectly detected human users, and TN (True Negative) is the number of correctly detected human users.
Accuracy: the percentage of correct results out of the total sample.
Precision: the percentage of predicted positives that are correctly categorized.
Recall: the percentage of actual positives that are correctly categorized.
F1-score: combines Recall and Accuracy to produce a single metric that falls between them.
4.2 Comparative Analysis of Feature Visualization
Social bots are difficult to detect due to the variety of social network data types and the fact that the new generation of social bots can masquerade as real human users. To better utilize the existing data to extract effective features to identify social bots, this section illustrates the effectiveness of the selected features by visualizing and analyzing the numbers, configuration information, text content, and text types in social network data.
4.2.1 Nodal Characterization Analysis
In social networks, Followers_count represents the number of followers of a particular user, and Friends_count represents the number of other users followed by that user. These two figures are usually key indicators of social media user activity and influence. Social bots follow a large number of users in order to increase their influence. The scatter distributions of Followers_count and Friends_count are shown in Fig. 4. It is found that the scatter distribution pattern of the social bots in the right figure is concentrated on the Friends_count axis compared with the human users in the left figure, indicating that the social bots follow a larger number of users than the human users.
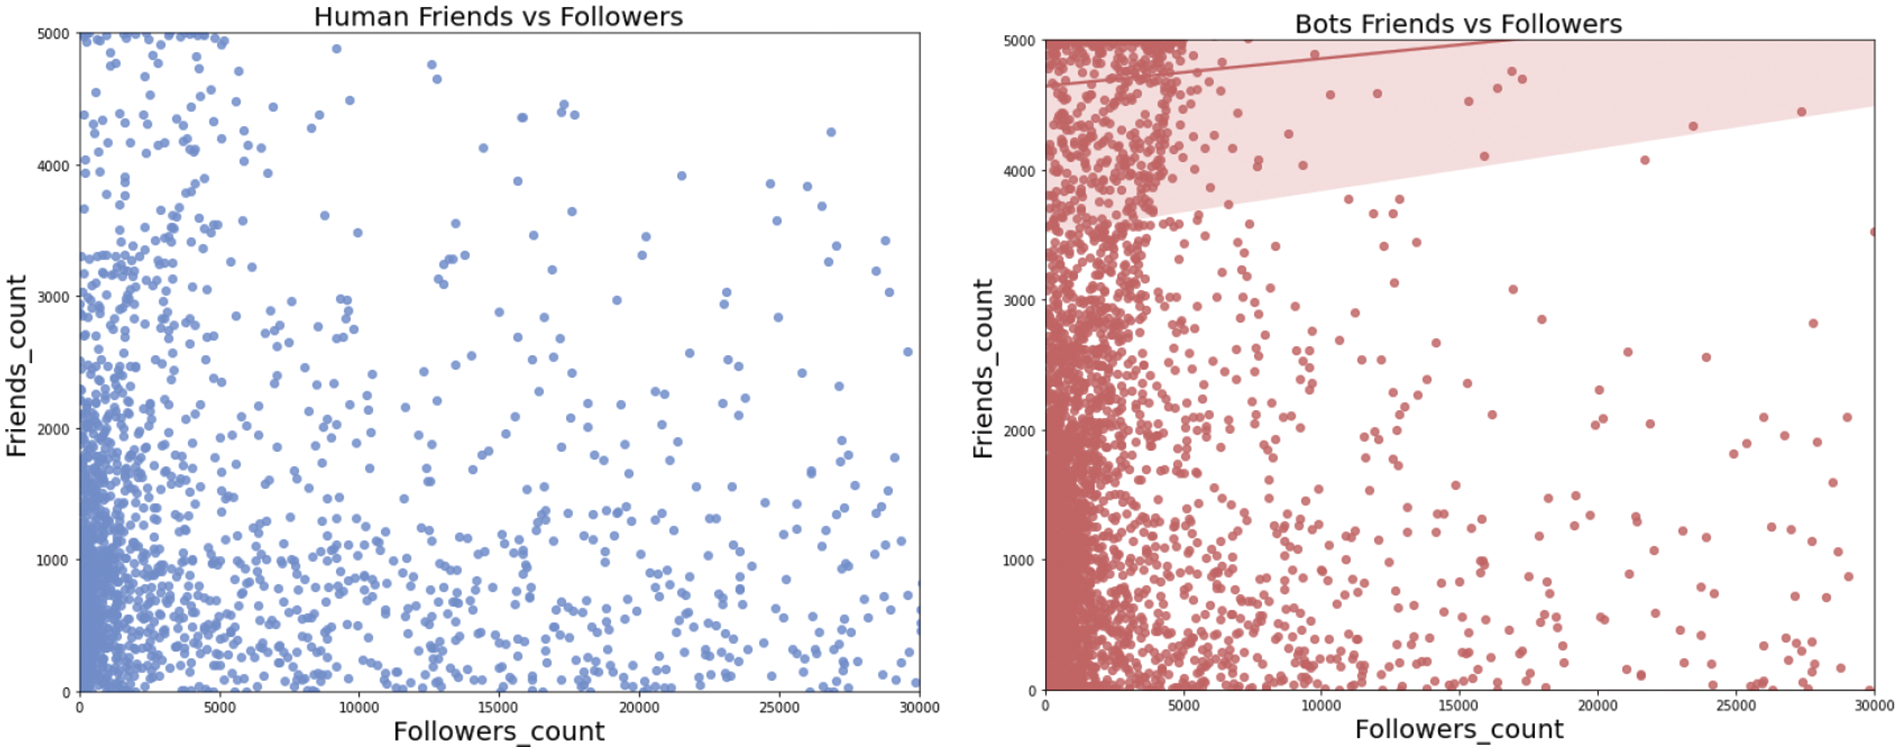
Figure 4: Scatter plot of Followers_count vs. Friends_count
Favourites_count is the number of posts a user likes or favorites, and Listed_count is the number of times a user has been added to the list by other users, both of which reflect the popularity of Internet users. The scatter distributions of Favourites_count and Listed_count are shown in Fig. 5. The figure on the right clearly shows that the social bot distribution is concentrated on the Favourites_count axis, where social bots like or favorite other posts in large numbers in a short period of time, and are relatively less frequently added to the list by other users. In contrast, the left graph human users show a relatively balanced number of Favourites_count and Listed_count, reflecting a more reasonable ratio between these numbers.
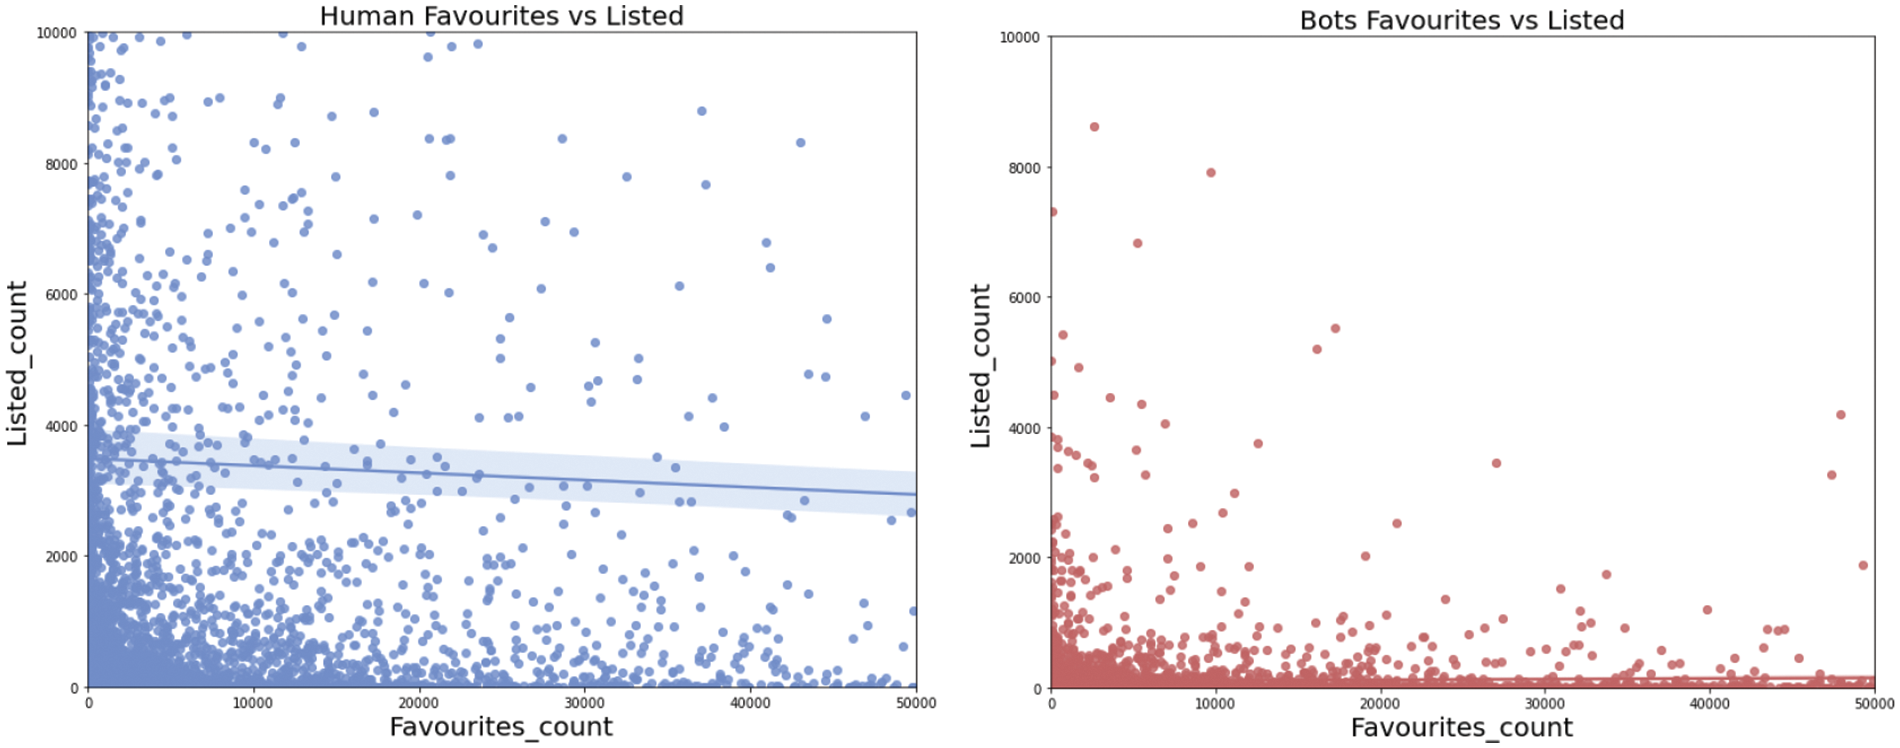
Figure 5: Scatter plot of Favourites_count vs. Listed_count
Statuses_count represents the total number of contents posted by a user, and Created is the age at which the account is registered. Both of these figures also measure aspects such as how active a user is on the platform, the history they have accumulated, and their social dominance. Typically, the longer an account has been created, the more its Statuses_count increases. The scatter distributions of Statuses_count and Created are shown in Fig. 6. It shows that the human user on the left tends to increase the amount of user posted content over time. On the contrary, the social bots on the right graph have a relatively high number of Statuses_count when their Created time is relatively new, and the overall trend of Statuses_count does not increase with the increase of Created time.
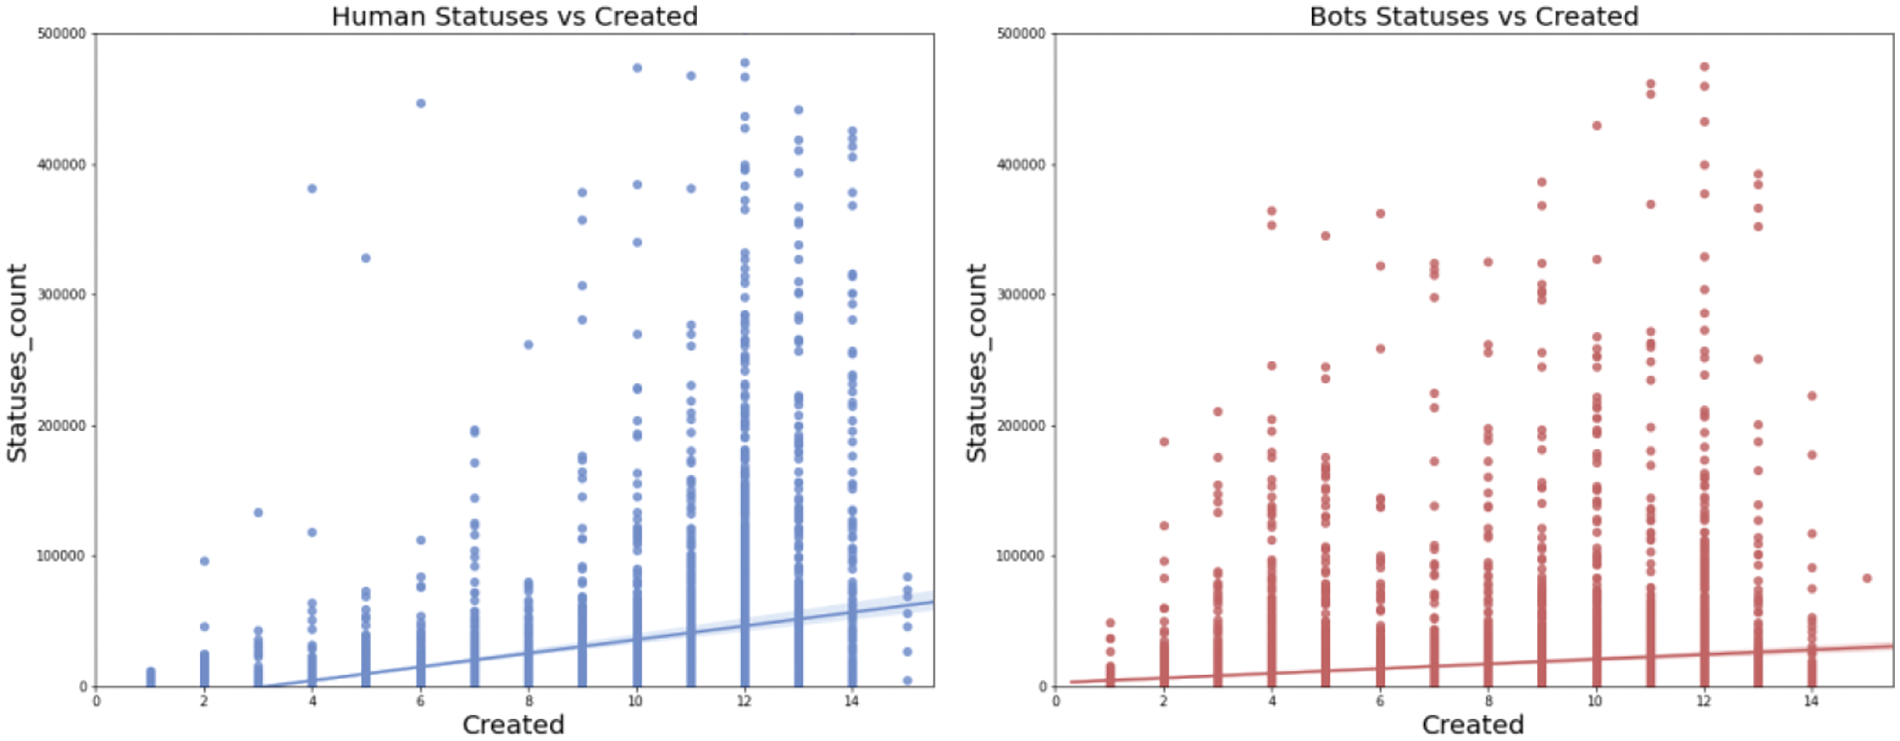
Figure 6: Scatter plot of Statuses_count vs. Created
Strongly correlated data may negatively affect the performance of the model as they may introduce redundant information leading to overfitting and degradation of model generalization performance. When performing feature selection, it is necessary to consider the correlation between node features and select features that are weakly correlated with other data. In order to quickly identify which features are highly correlated with other features, and to identify the features that may be redundant for them, this paper analyzes Spearman’s rank correlation coefficient on the user profile information [50], and calculation is done to obtain the Spearman’s correlation coefficient matrix, which is shown in Fig. 7. It can be seen that Statuses_count has a high correlation with other numerical features. As a result, the numerical features in this paper are not selected from this data, but from other feature data.
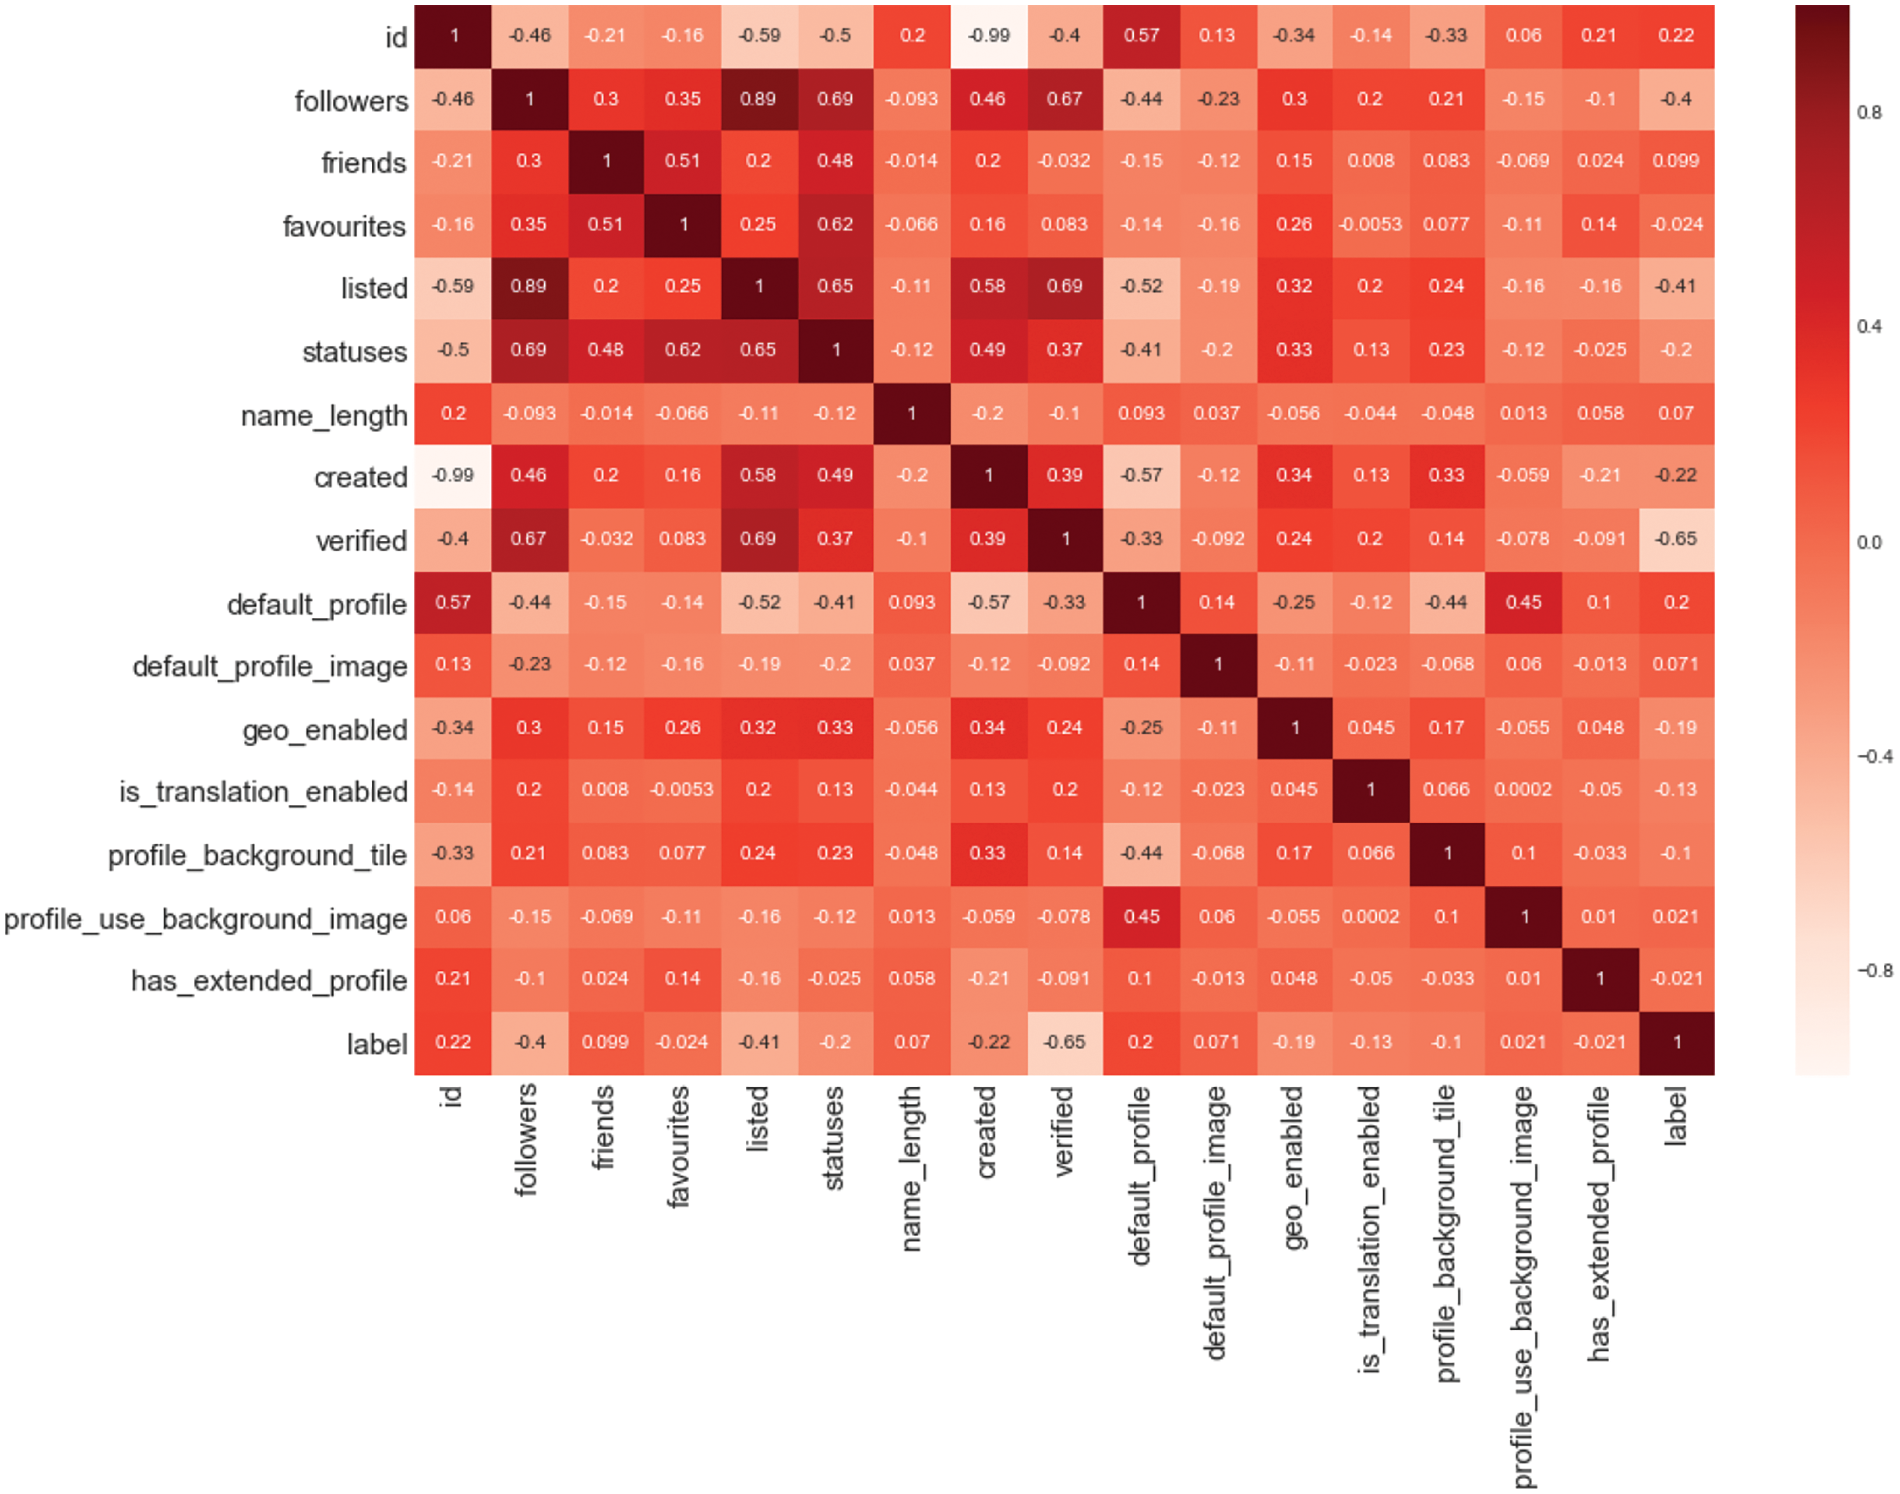
Figure 7: Characteristic Spearman correlation coefficient diagram
4.2.2 Social Behavior Analysis
Humans and social bots have different preferences and habits when using language, and these preferences and habits will be reflected in the words and phrases they use. In order to visualize the differences between the content posted by human users and bots and to verify the validity of the features proposed in this paper, a word cloud graph [51] is generated to compare the content differences between humans and bots. From Fig. 8a, it can be seen that humans may be more inclined to share their personal experiences and feelings when using social media. Hence, the words and phrases they use are more diverse, while those used by social bots are relatively homogeneous. The higher frequency of Trump mentions by bots can be seen in Fig. 8b, indicating the influence of social bots on politics.
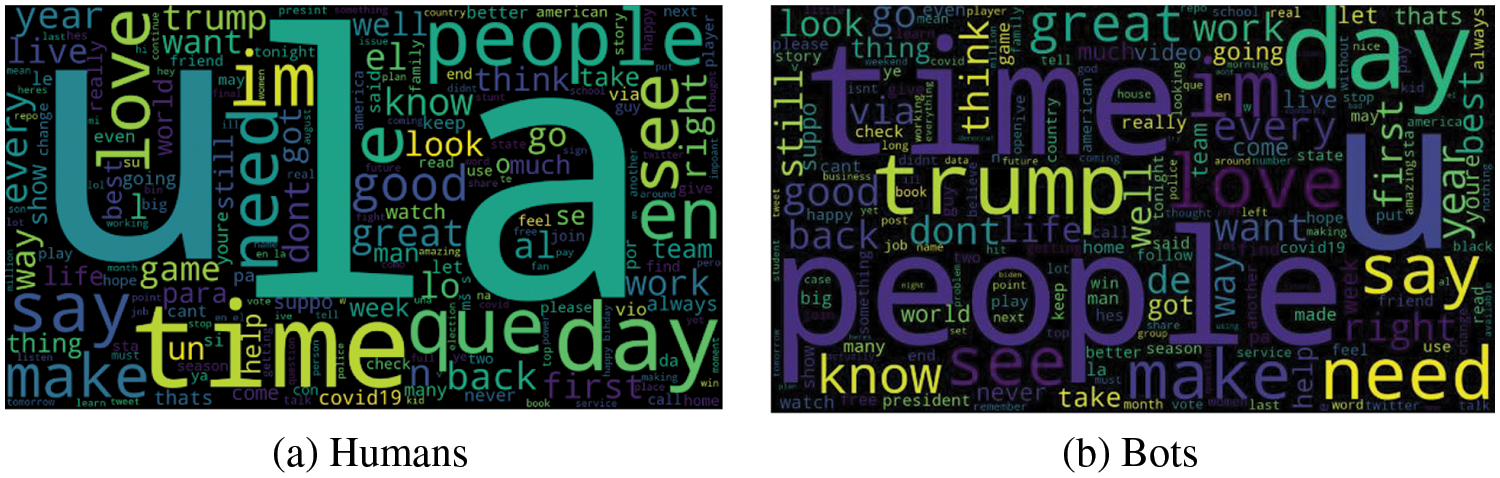
Figure 8: A word cloud visualization of user-posted content
In summary, visual analytics is an effective method that can better help us extract useful information from massive data and identify feature patterns related to social robots. Utilizing visualization, we can more intuitively show the correlation and importance between different features, as well as discover the complex associations between some features. We can extract key feature information more accurately, identify social bots, and provide useful references for the governance, standardization, and management of the social network industry.
4.3 Experimental Contrastive Analysis
This section evaluates the performance of a social robot detection method based on linear modulation of social relationship subgraph features through experimental analysis. Ablation experiments are performed to verify the effect of the selected features on the detection performance and the validity of the proposed model. The effectiveness of the proposed method is verified by comparison experiments with other research methods under datasets.
4.3.1 Ablation Experiment Analysis
(a) Features ablation experiment
To assess the impacts of user features on detection performance, this paper performs feature ablation experiments, where F/All denotes number features, description features, configuration features, text features, and behavioral gene sequences; F/Description denotes description features; F/Number denotes number features; F/Configuration denotes configuration features; F/Tweets denotes text features; and F/DNA denotes behavioral gene sequences. In order to validate the effectiveness of the graph convolutional network ResGAT-FiLM model proposed in this paper, a comparison is made between GCN [52], GAT [53], HAN (Hierarchical Attention Network) [54], and HGT (Heterogeneous Graph Transformer) [55] graph convolutional network models. To verify the role of user social relationships in recognizing social robots, experiments without network structural features are conducted using a multilayer perceptron network.
In this experiment, the Twibot-20 dataset is used to conduct ablation experiments, in which a class of features are removed from the feature set each time and tested on different graph convolutional networks and multi-layer perceptron models. The histogram of ablation results is shown in Fig. 9. As can be seen from Fig. 9a, the method proposed in this paper performs best on the comprehensive feature set. That is, under the comprehensive feature set of digital features, description feature, configuration features, text feature, and behavioral gene sequences, the model shows higher accuracy, recall, F1-score, and precision. This indicates that by combining the graph attention network and FiLM module, the model in this paper shows high efficiency in learning node and structural features. At the same time, the introduction of residual structure can also avoid gradient disappearance and gradient explosion in deep neural networks, which increases the robustness and characterization ability of the model and improves the detection accuracy of social robots. All the experimental results show that each class of features plays an important role in the recognition of social robots. Numerical features, being the more basic features, are the least distinguishable, while the model using the feature set F/All that contains all features performs the best, which proves the importance of the combination of diverse features. Through comprehensive experimental results, it is also found that compared with the single feature and other five models, the proposed model shows better accuracy and F1-score in identifying social robots, which can correctly identify and classify social robots in social networks and reduce misclassification. As can be seen from Figs. 9eand 9f, the worst performance is achieved when only behavioral gene sequences are used without combining text features. Text features can reflect users’ speech habits and content, while gene sequences reflect users’ Posting types on different topics in different scenarios. The combination of these two features can describe users’ social behaviors more comprehensively, thus improving the accuracy and robustness of social robot detection.
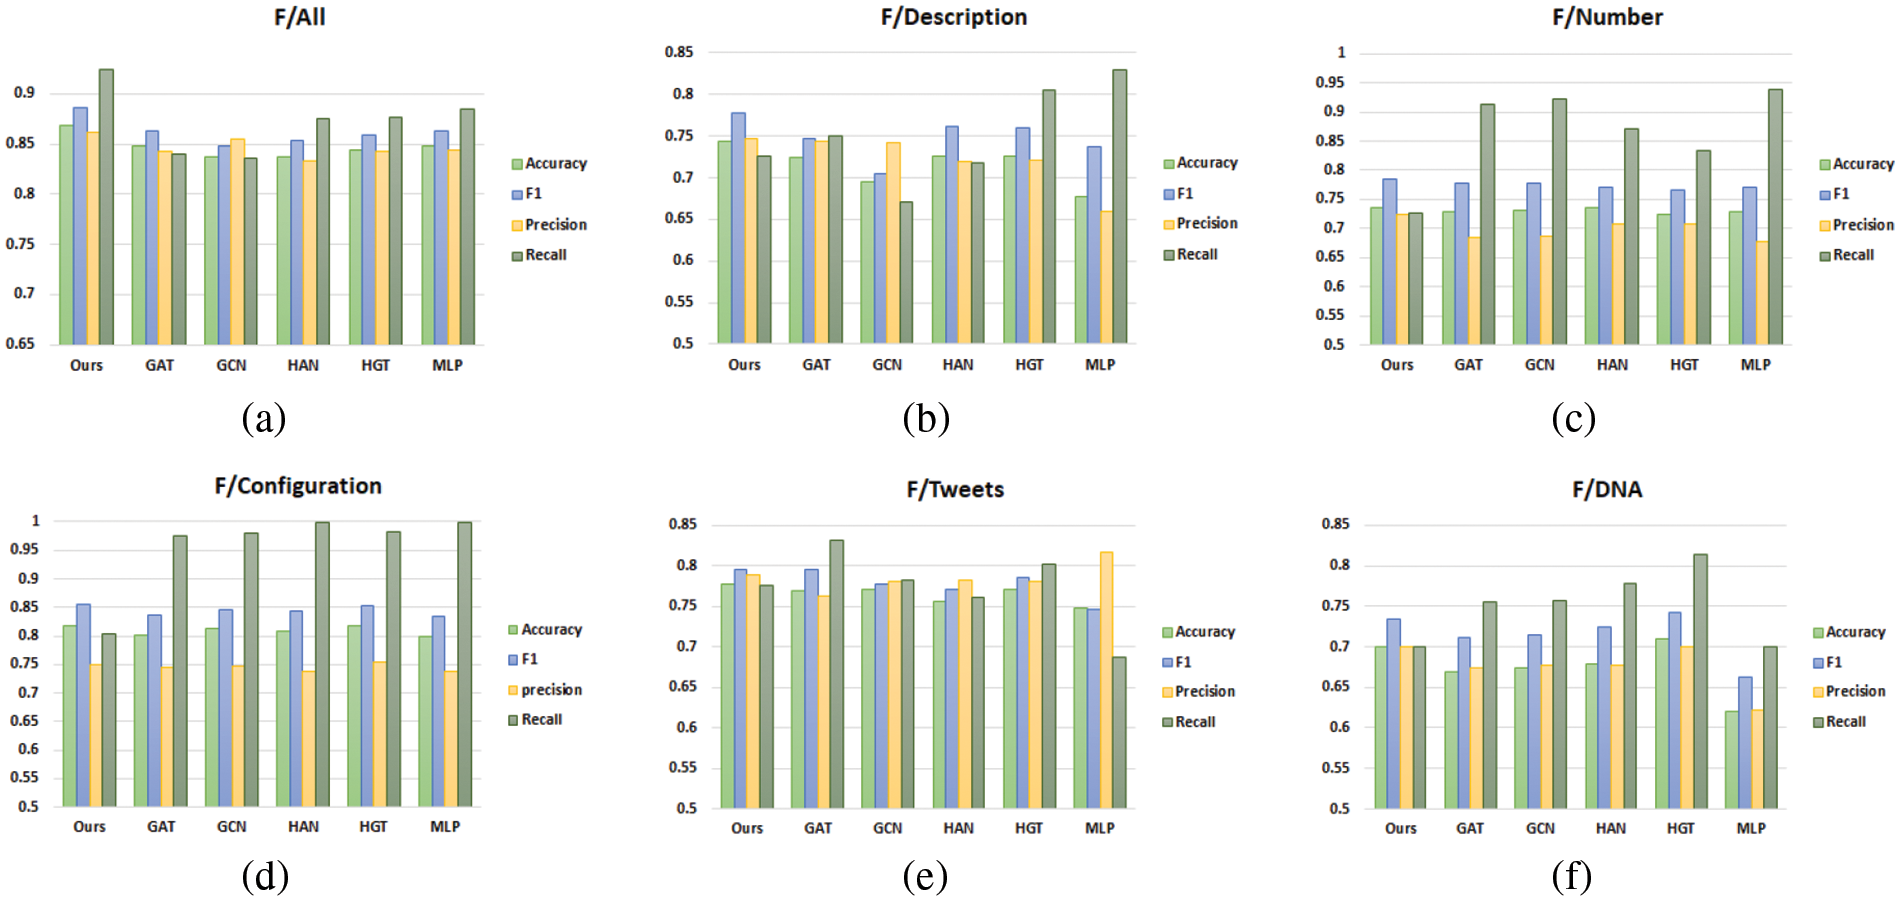
Figure 9: Results of characteristic ablation experiment
(b) Model ablation experiment
Based on the results in Table 3 and Fig. 10, we conduct a series of model ablation experiments in order to gain an in-depth understanding of the performance of our proposed model and the effects of its different components on the performance. The table shows how four different model configurations (Ours, No-subgraph, No-Film, No-Res) perform on four performance metrics: accuracy, F1, Precision, and Recall. In all performance indicators, the proposed model achieves the highest score. Specifically, it achieved 86.81% accuracy, 88.24% F1-score, 85.28% accuracy, and 91.41% recall, respectively. This shows that our proposed complete model performs well in the task and has high classification performance. The No-subgraph model is an experiment with subgraph information removed. Compared with our model, its accuracy decreases slightly with a value of 84.87%. This implies that the subgraph information has a positive effect on the performance of the task. F1-scores also drop from 88.24% to 86.35%. This shows that subgraph information plays an important role in the classification decision of the model, especially when dealing with complex relationships. The No-Film model is an experiment in which the FiLM module is removed. Its accuracy drops to 84.53%, with an F1-score of 86.31%. The No-Res model is an experiment in which residual connections are removed. Compared with our model, the accuracy of the No-Res model is 85.04% and the F1-score is 86.87%. Our complete model performs well on all performance metrics, demonstrating its effectiveness in relation to classification tasks.
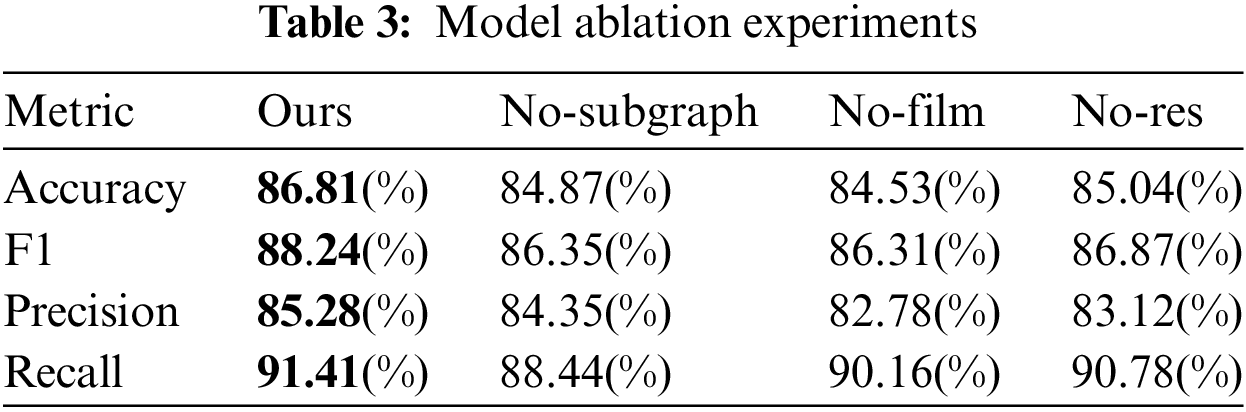
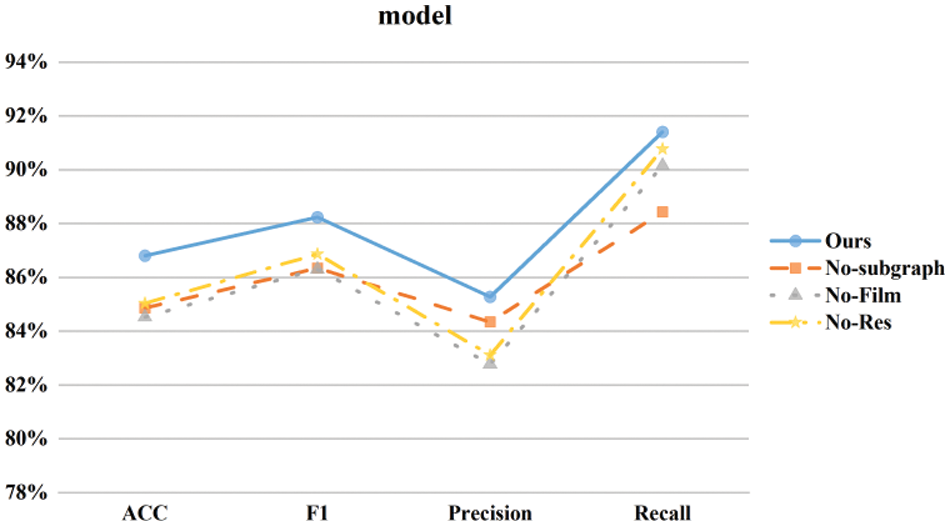
Figure 10: Line diagram of model ablation experiment
4.3.2 Comparative Analysis of Performance Indicators
To evaluate the performance of the social robot detection method proposed in this paper, five social robot detection methods are compared on both datasets, and the average values of the five experimental results are reported in Table 4. As can be seen from Table 4, compared with other methods, the method proposed in this paper performs best and successfully improves the detection accuracy of social robots. The specific analysis is as follows.

The friendship preference [24] method proposes a new feature of friendship preference; that is, the feature of friendship preference is extracted from the profile attributes of users’ followers. DeeProBot [26] uses account information, including numeric values, binary attributes, and profile text data. Both Friendship preference and DeeProBot methods do not consider the user’s social relationship, and their performance on the two datasets is inferior to that of the proposed method. GCNNBot [37] takes age, status count, account length name, followers count, friend count, and like count as node characteristics of the user and enters them into the GCN layer to identify social bots. BGSRD [38] uses BERT and GCN to realize the detection of social robots, and uses the BERT model to initialize the representation of document nodes in the text graph, which is used as the input of GCN. These two kinds of methods extract user digital information and tweet text information to construct graph structure. In contrast, this paper comprehensively considers user numbers, Configuration and personal description information, and proposes a ResGAT-FiLM graph attention model, which can learn node and structural features flexibly and efficiently. The method proposed in this paper has better detection effect than the other two methods. BotRGCN [39] comprehensively considers the semantic and attribute information of multi-modal users to build a heterogeneous graph, and applies the graph attention network to enhance its capture of social robots with multiple camouflage capabilities. This method performs better than the other methods on datasets. On this basis, this paper constructs the user’s social relationship subgraph and social behavior, comprehensively learn the relationship and behavior of social robots, and solve the problem of multiple nodes and complex relationships in social networks. The integration of social relationship subgraph features and social behavior features can reflect the function of nodes in social networks more comprehensively, and improve the accuracy and robustness of social robot detection. The detection accuracies of the proposed method on the Cresci-15 and TwiBot-20 datasets are 1.35% and 2.2% higher than that of the BotRGCN method, respectively.
As a non-negligible existence in social networks, social robots bring challenges to the healthy development and standardized management of social networks. Aiming at solving the problem of social robot detection, this paper proposes an improved graph neural network social robot detection method. First, we extract the features of user social relationship subgraphs and user metadata to form the node features of the social network and simplify the complex social network. Then a ResGAT-FiLM model is proposed by using multi-layer graph convolution to learn the hidden information of complex interactions between user nodes and neighbor nodes. The model includes a neural network layer of residual structure, FiLM, and graph attention networks, which can learn user structure features flexibly and efficiently. In order to achieve a comprehensive analysis of social robots and improve recognition accuracy, this paper further learns users’ social behaviors and uses them to modify users to obtain more accurate recognition results. Finally, experiments are carried out on two real datasets to compare and analyze the latest research on robot detection in social networks. Ablation experiments are also conducted to verify the effectiveness of the features and models proposed in this paper, and feature visualization analysis is used as an auxiliary feature for social robot detection. The experimental results show that the method based on social graphs can learn user relationship characteristics better and perform better in extracting multiple social relationships and integrating user social behaviors. In the future studies, we will delve deeper into the malicious behaviors of social robots to enhance the identification of malicious social robot users, and conduct an in-depth study of the evolutionary trends of social robots and design more intelligent and robust algorithms to effectively counter potential emerging tactics in social robot attacks.
Acknowledgement: None.
Funding Statement: This work was supported in part by the National Natural Science Foundation of China under Grants 62273272, 62303375 and 61873277, in part by the Key Research and Development Program of Shaanxi Province under Grant 2023-YBGY-243, in part by the Natural Science Foundation of Shaanxi Province under Grants 2022JQ-606 and 2020-JQ758, in part by the Research Plan of Department of Education of Shaanxi Province under Grant 21JK0752, and in part by the Youth Innovation Team of Shaanxi Universities.
Author Contributions: Conceptualization: Zhenhua Yu; methodology: Liangxue Bai, Ou Ye; formal analysis: Zhenhua Yu, Liangxue Bai, Ou Ye; writing—original draft preparation: Liangxue Bai, Xuya Cong; writing—review and editing: Zhenhua Yu, Liangxue Bai, Xuya Cong; visualization: Liangxue Bai; project administration: Zhenhua Yu; funding acquisition: Zhenhua Yu. All authors have read and agreed to the published version of the manuscript.
Availability of Data and Materials: TwiBot-20 and Cresci-15 Datasets used for generating the results reported in Sections 3 and 4 are available at https://botometer.osome.iu.edu/bot-repository/datasets.html.
Conflicts of Interest: The authors declare that they have no conflicts of interest to report regarding the present study.
References
1. S. Cresci, “A decade of social bot detection,” Communications of the ACM, vol. 63, no. 10, pp. 72–83, 2020. [Google Scholar]
2. D. Gayo-Avello, “Social media won’t free us,” IEEE Internet Computing, vol. 21, no. 4, pp. 98–101, 2017. [Google Scholar]
3. A. Deb, L. Luceri, A. Badaway and E. Ferrara, “Perils and challenges of social media and election manipulation analysis: The 2018 US midterms,” in Proc. of the 2019 World Wide Web Conf., San Francisco, CA, USA, pp. 237–247, 2019. [Google Scholar]
4. P. G. Pratama and N. A. Rakhmawati, “Social bot detection on 2019 Indonesia president candidate’s supporter’s tweets,” Procedia Computer Science, vol. 161, pp. 813–820, 2019. [Google Scholar]
5. A. Gupta, H. Lamba and P. Kumaraguru, “$1.00 per RT #BostonMarathon #PrayForBoston: Analyzing fake content on twitter,” in Proc. of the 2013 APWG eCrime Researchers Summit, San Francisco, CA, USA, pp. 1–12, 2013. [Google Scholar]
6. C. Llewellyn, L. Cram, R. L. Hill and A. Favero, “For whom the bell trolls: Shifting troll behavior in the Twitter Brexit debate,” Journal of Common Market Studies, vol. 57, no. 5, pp. 1148–1164, 2019. [Google Scholar]
7. M. Jurišić, I. Tomičić and P. Grd, “User behavior analysis for detecting compromised user Accounts: A review paper,” Cybernetics and Information Technologies, vol. 23, no. 3, pp. 102–113, 2023. [Google Scholar]
8. V. van Mulukom, L. J. Pummerer, S. Alper, H. Bai, V. Čavojová et al., “Antecedents and consequences of COVID-19 conspiracy beliefs: A systematic review,” Social Science & Medicine, vol. 301, pp. 114912, 2022. [Google Scholar]
9. Z. Wu, S. Pan, F. Chen, G. Long, C. Zhang et al., “A comprehensive survey on graph neural networks,” IEEE Transactions on Neural Networks and Learning Systems, vol. 32, no. 1, pp. 4–24, 2020. [Google Scholar]
10. A. Breuer, R. Eilat and U. Weinsberg, “Friend or faux: Graph-based early detection of fake accounts on social networks,” in Proc. of the Web Conf. 2020, Taipei, Taiwan, pp. 1287–1297, 2020. [Google Scholar]
11. Y. Dou, Z. Liu, L. Sun, Y. Deng, H. Peng et al., “Enhancing graph neural network-based fraud detectors against camouflaged fraudsters,” in Proc. of the 29th ACM Int. Conf. on Information & Knowledge Management, Ireland, pp. 315–324, 2020. [Google Scholar]
12. S. Feng, Z. Tan, R. Li and M. Luo, “Heterogeneity-aware twitter bot detection with relational graph transformers,” in Proc. of the AAAI Conf. on Artificial Intelligence, Vancouver, Canada, vol. 36, pp. 3977–3985, 2022. [Google Scholar]
13. M. Orabi, D. Mouheb, Z. Al Aghbari and I. Kamel, “Detection of bots in social media: A systematic review,” Information Processing & Management, vol. 57, no. 4, pp. 102250, 2020. https://doi.org/10.1016/j.ipm.2020.102250 [Google Scholar] [CrossRef]
14. S. Alterkav and H. Erbay, “Novel authorship verification model for social media accounts compromised by a human,” Multimedia Tools and Applications, vol. 80, pp. 13575–13591, 2021. [Google Scholar]
15. A. Mahmood and P. Srinivasan, “Twitter bots and gender detection using Tf-idf,” in CLEF (Working Notes), pp. 1–6, Lugano, Switzerland, 2019. [Google Scholar]
16. A. Shevtsov, M. Oikonomidou, D. Antonakaki, P. Pratikakis, A. Kanterakis et al., “Discovery and classification of Twitter bots,” SN Computer Science, vol. 3, no. 3, pp. 255, 2022. https://doi.org/10.1007/s42979-022-01154-5 [Google Scholar] [CrossRef]
17. C. Meda, F. Bisio, P. Gastaldo and R. Zunino, “Machine learning techniques applied to Twitter spammers detection,” in Proc. of Int. Carnahan Conf. on Security Technology, Rome, Italy, pp. 177–182, 2014. [Google Scholar]
18. K. E. Daouadi, R. Z. Rebaï and I. Amous, “Real-time bot detection from Twitter using the Twitterbot+ Framework,” Journal of Universal Computer Science, vol. 26, no. 4, pp. 496–507, 2020. [Google Scholar]
19. P. Kondeti, L. P. Yerramreddy, A. Pradhan and G. Swain, “Fake account detection using machine learning,” in Proc. of ICECMSN, 2020 Conf. on Evolutionary Computing and Mobile Sustainable Networks, Singapore, pp. 791–802, 2021. [Google Scholar]
20. O. Loyola-González, R. Monroy, J. Rodríguez, A. López-Cuevas and J. I. Mata-Sánchez, “Contrast pattern-based classification for bot detection on twitter,” IEEE Access, vol. 7, pp. 45800–45817, 2019. [Google Scholar]
21. K. C. Yang, O. Varol, P. M. Hui and F. Menczer, “Scalable and generalizable social bot detection through data selection,” in Proc. of the AAAI Conf. on Artificial Intelligence, vol. 34, no. 1, pp. 1096–1103, 2020. [Google Scholar]
22. M. Kouvela, I. Dimitriadis and A. Vakali, “Bot-Detective: An explainable Twitter bot detection service with crowdsourcing functionalities,” in Proc. of the 12th Int. Conf. on Management of Digital EcoSystems, New York, NY, USA, pp. 55–63, 2020. [Google Scholar]
23. M. Sayyadiharikandeh, O. Varol, K. C. Yang, A. Flammini and F. Menczer, “Detection of novel social bots by ensembles of specialized classifiers,” in Proc. of the 29th ACM Int. Conf. on Information & Knowledge Management, New York, NY, USA, pp. 2725–2732, 2020. [Google Scholar]
24. S. H. Moghaddam and M. Abbaspour, “Friendship preference: Scalable and robust category of features for social bot detection,” IEEE Transactions on Dependable and Secure Computing, vol. 20, no. 2, pp. 1516–1528, 2022. [Google Scholar]
25. S. Kudugunta and E. Ferrara, “Deep neural networks for bot detection,” Information Sciences, vol. 467, pp. 312–322, 2018. [Google Scholar]
26. K. Hayawi, S. Mathew, N. Venugopal, M. M. Masud and P. H. Ho, “DeeProBot: A hybrid deep neural network model for social bot detection based on user profile data,” Social Network Analysis and Mining, vol. 12, no. 1, pp. 1–43, 2022. [Google Scholar]
27. Y. Wu, Y. Fang, S. Shang, J. Jin, L. Wei et al., “A novel framework for detecting social bots with deep neural networks and active learning,” Knowledge-Based Systems, vol. 211, pp. 106525, 2020. https://doi.org/10.1016/j.knosys.2020.106525 [Google Scholar] [CrossRef]
28. K. Feng, Y. D. Xu, Y. L. Wang, S. Li, Q. B. Sun et al., “Digital twin enabled domain adversarial graph networks for bearing fault diagnosis,” IEEE Transactions on Industrial Cyber-Physical Systems, vol. 1, pp. 113–122, 2023. [Google Scholar]
29. S. Najari, M. Salehi and R. Farahbakhsh, “GANBOT: A GAN-based framework for social bot detection,” Social Network Analysis and Mining, vol. 12, pp. 1–11, 2022. [Google Scholar]
30. Q. Cao, M. Sirivianos, X. Yang and T. Pregueiro, “Aiding the detection of fake accounts in large scale social online services,” in Proc. of the 9th USENIX Symp. on Networked Systems Design and Implementation (NSDI 12), San Jose, CA, USA, pp. 197–210, 2012. [Google Scholar]
31. W. Ma, S. Z. Hu, Q. Dai, T. T. Wang and Y. F. Huang, “Sybil-Resist: A new protocol for sybil attack defense in social network,” in Proc. of 5th Int. Conf. on Applications and Techniques in Information Security, Melbourne, VIC, Australia, pp. 219–230, 2014. [Google Scholar]
32. G. Danezis and P. Mittal, “Sybilinfer: Detecting sybil nodes using social networks,” in Proc. of the 12th Annual Network and Distributed System Security Symp. (NDSS), San Jose, CA, USA, pp. 1–15, 2009. [Google Scholar]
33. A. Mislove, B. Viswanath, K. P. Gummadi and P. Druschel, “You are who you know: Inferring user profiles in online social networks,” in Proc. of the third ACM Int. Conf. on Web search and Data Mining, New York, NY, USA, pp. 251–260, 2010. [Google Scholar]
34. B. Viswanath, A. Post, K. P. Gummadi and A. Mislove, “An analysis of social network-based sybil defenses,” ACM SIGCOMM Computer Communication Review, vol. 40, no. 4, pp. 363–374, 2010. [Google Scholar]
35. P. Pham, L. T. T. Nguyen, B. Vo and U. Yun, “Bot2Vec: A general approach of intra-community oriented representation learning for bot detection in different types of social networks,” Information Systems, vol. 103, pp. 101771, 2022. https://doi.org/10.1016/j.is.2021.101771 [Google Scholar] [CrossRef]
36. A. Dehghan, K. Siuta, A. Skorupka, A. Dubey, A. Betlen et al., “Detecting bots in social-networks using node and structural embeddings,” Journal of Big Data, vol. 10, no. 1, pp. 1–37, 2023. [Google Scholar]
37. S. A. Alhosseini, R. B. Tareaf, P. Najafi and C. Meinel, “Detect me if you can: Spam bot detection using inductive representation learning,” in Proc. of the 2019 World Wide Web Conf., San Francisco, USA, pp. 148–153, 2019. [Google Scholar]
38. Q. L. Guo, H. Y. Xie, Y. Y. Li, W. Ma and C. Zhang, “Social bots detection via fusing BERT and graph convolutional networks,” Symmetry, vol. 14, no. 1, pp. 1–30, 2021. [Google Scholar]
39. S. B. Feng, H. R. Wan, N. N. Wang and M. N. Luo, “BotRGCN: Twitter bot detection with relational graph convolutional networks,” in Proc. of the 2021 IEEE/ACM Int. Conf. on Advances in Social Networks Analysis and Mining, Netherlands, pp. 236–239, 2021. [Google Scholar]
40. Z. Z. Lan, M. D. Chen, S. Goodman, K. Gimpel, P. Sharma et al., “ALBERT: A lite bert for self-supervised learning of language representations,” in Proc. of ICLR, Addis Ababa, Ethiopia, Africa, pp. 1–17, 2020. [Google Scholar]
41. Y. D. Xu, K. Feng, X. A. Yan, R. Q. Yan, Q. Ni et al., “CFCNN: A novel convolutional fusion framework for collaborative fault identification of rotating machinery,” Information Fusion, vol. 95, pp. 1–16, 2023. [Google Scholar]
42. S. Cresci, R. D. Pietro, M. Petrocchi, A. Spognardi and M. Tesconi, “Social fingerprinting: Detection of spambot groups through DNA-Inspired behavioral modeling,” IEEE Transactions on Dependable and Secure Computing, vol. 15, no. 4, pp. 561–576, 2017. [Google Scholar]
43. S. Brody, U. Alon and E. Yahav, “How attentive are graph attention networks?,” in Proc. of ICLR, Kigali, Rwanda, pp. 1–26, 2022. [Google Scholar]
44. M. Brockschmidt, “GNN-FiLM: Graph Neural Networks with Feature-wise Linear Modulation,” in Proc. of Int. Conf. on Machine Learning, Vienna, Austria, pp. 1144–1152, 2020. [Google Scholar]
45. Q. Ni, J. C. Ji, B. Halkon, K. Feng and A. K. Nandi, “Physics-Informed Residual Network (PIResNet) for rolling element bearing fault diagnostics,” Mechanical Systems and Signal Processing, vol. 200, pp. 110544, 2023. https://doi.org/10.1016/j.ymssp.2023.110544 [Google Scholar] [CrossRef]
46. T. Y. Lin, P. Goyal, R. Girshick, K. He and P. Dollár, “Focal loss for dense object detection,” in Proc. of the IEEE Int. Conf. on Computer Vision, Venice, Italy, pp. 2980–2988, 2017. [Google Scholar]
47. S. B. Feng, H. R. Wan, N. N. Wang, J. D. Li and M. N. Luo, “Twibot-20: A comprehensive twitter bot detection benchmark,” in Proc. of the 30th ACM Int. Conf. on Information & Knowledge Management, Queensland, Australia, pp. 4485–4494, 2021. [Google Scholar]
48. S. Cresci, R. D. Pietro, M. Petrocchi, A. Spognardi and M. Tesconi, “Fame for sale: Efficient detection of fake Twitter followers,” Decision Support Systems, vol. 80, pp. 56–71, 2015. [Google Scholar]
49. F. Fkih and M. N. Omri, “Estimation of a priori decision threshold for collocations extraction: An empirical study,” International Journal of Information Technology and Web Engineering, vol. 8, no. 3, pp. 34–49, 2013. [Google Scholar]
50. W. Y. Zhang, Z. W. Wei, B. H. Wang and X. P. Han, “Measuring mixing patterns in complex networks by Spearman rank correlation coefficient,” Physica A: Statistical Mechanics and its Applications, vol. 451, pp. 440–450, 2016. [Google Scholar]
51. F. Heimerl, S. Lohmann, S. Lange and T. Ertl, “Word cloud explorer: Text analytics based on word clouds,” in 2014 47th Hawaii Int. Conf. on System Sciences, Waikoloa, HI, USA, pp. 1833–1842, 2014. [Google Scholar]
52. T. N. Kipf and M. Welling, “Semi-supervised classification with graph convolutional networks,” in Proc. of ICLR, Toulon, France, pp. 1–14, 2017. [Google Scholar]
53. V. Petar, G. Cucurull, A. Casanova, A. Romero, P. Liò et al., “Graph attention networks,” in Proc. of ICLR, Vancouver, BC, Canada, pp. 1–12, 2018. [Google Scholar]
54. Z. Yang, D. Yang, C. Dyer, X. He and E. Hovy, “Hierarchical attention networks for document classification,” in Proc. of the 2016 Conf. of the North American Chapter of the Association for Computational Linguistics: Human Language Technologies, San Diego, California, USA, pp. 1480–1489, 2016. [Google Scholar]
55. Z. N. Hu, Y. X. Dong, K. S. Wang and Y. Z. Sun, “Heterogeneous graph transformer,” in Proc. of the Web Conf. 2020, Taipei, Taiwan, pp. 2704–2710, 2020. [Google Scholar]
Cite This Article
 Copyright © 2024 The Author(s). Published by Tech Science Press.
This work is licensed under a Creative Commons Attribution 4.0 International License , which permits unrestricted use, distribution, and reproduction in any medium, provided the original work is properly cited.
 Downloads
 Citation Tools