
 Submit a Paper
 Propose a Special lssue
 Open Access
ARTICLE

A Machine Learning Approach to User Profiling for Data Annotation of Online Behavior
1 Computer Science and Information Technology Department, NED University of Engineering and Technology, Karachi, Pakistan
2 Computer Engineering Department, Sir Syed University of Engineering and Technology, Karachi, Pakistan
3 College of Education, Health and Human Services, Longwood University, Farmville, VA, USA
* Corresponding Author: Moona Kanwal. Email:
Computers, Materials & Continua 2024, 78(2), 2419-2440. https://doi.org/10.32604/cmc.2024.047223
Received 30 October 2023; Accepted 18 December 2023; Issue published 27 February 2024
 View Full Text
 Download PDF
Abstract
The user’s intent to seek online information has been an active area of research in user profiling. User profiling considers user characteristics, behaviors, activities, and preferences to sketch user intentions, interests, and motivations. Determining user characteristics can help capture implicit and explicit preferences and intentions for effective user-centric and customized content presentation. The user’s complete online experience in seeking information is a blend of activities such as searching, verifying, and sharing it on social platforms. However, a combination of multiple behaviors in profiling users has yet to be considered. This research takes a novel approach and explores user intent types based on multidimensional online behavior in information acquisition. This research explores information search, verification, and dissemination behavior and identifies diverse types of users based on their online engagement using machine learning. The research proposes a generic user profile template that explains the user characteristics based on the internet experience and uses it as ground truth for data annotation. User feedback is based on online behavior and practices collected by using a survey method. The participants include both males and females from different occupation sectors and different ages. The data collected is subject to feature engineering, and the significant features are presented to unsupervised machine learning methods to identify user intent classes or profiles and their characteristics. Different techniques are evaluated, and the K-Mean clustering method successfully generates five user groups observing different user characteristics with an average silhouette of 0.36 and a distortion score of 1136. Feature average is computed to identify user intent type characteristics. The user intent classes are then further generalized to create a user intent template with an Inter-Rater Reliability of 75%. This research successfully extracts different user types based on their preferences in online content, platforms, criteria, and frequency. The study also validates the proposed template on user feedback data through Inter-Rater Agreement process using an external human rater.Keywords
Supplementary Material
Supplementary Material FileThe Internet has allowed people to reach across the globe and businesses to reach and engage people across the world. User-centric digitization has benefited businesses and users by creating more relevant, helpful, and engaging digital experiences. Technological advancement has also generated opportunities for scientists to investigate online users, their needs, and intentions in online engagement and provide solutions to make users’ online experiences satisfying. Seeking information is the most common and leading online engagement for people. The information influx observed on the internet has crossed a staggering figure in zettabytes and is expected to reach exabytes by 2025. Thus, user needs for information, or as [1] calls it, user intent, is a subject that has been continuously researched for two decades. The internet is all about users; whether it is educational, entertainment, marketing, or commerce, user experiences are analyzed to create better content, produce better products, advertise better deals, or, in short, improve revenue. User profiling is an effective way to identify user informational needs and analyze users based on their online behaviors and practices, leading to the creation of customized information filters, digital marketing models, optimized search results, etc.
The research focuses on the intent to identify user groups of similar information interests. Other research discussed in the article has studied users and classified intentions based on a single behavior aspect. In contrast, this research proposes multiple behavioral dimensions to explore user intent and type. The research is part of Ph.D. research work and aims to collect online users’ feedback on searching, sharing, and verifying information. This study targets the South Asian population residing in any region, male and female, and above the age of 18 years. Different venues like social media, universities, and professional circles are targeted to enroll participants for this study with an estimated population size of 250. The research answers the following research questions:
• Can machine learning determine user characteristics based on their behavior and practices in searching, sharing, and verifying information?
• Can user behavior be generalized as a ground truth or golden rule for labeling users?
This research develops a machine learning model to identify user intent types based on search, dissemination, trust behavior, and practices for obtaining information. First, the user information is captured by a survey questionnaire. Next, the data is preprocessed and analyzed using statistical methods. Scoring is computed for the user’s openness in searching, extravert sharing, and conscientiousness in trusting information. The scores are then clustered using K-Mean Clustering. The clustering provided five clusters depicting users’ intent. User intent characteristics are extracted using feature averaging. The user profile is created based on user intent clusters and lastly, generalized to obtain ground truth for user labeling.
1.1 Exploration of Multidimensional User Online Behavior Using AI
One of the trending research topics is to capture user intention in acquiring information and provide ease in bringing that information to the user screen. The research stretches from user navigation, individual preferences, likes and dislikes, search results, and relevance of search queries [2], to user interaction and preferences on social media. For example, in the study [3], the users’ physical attributes are used to analyze user interaction in image searching and content to design a search intent system. Online social platforms have also become a dynamic source of information, as was noted by the researchers [4] during COVID-19. User intent to browse information has taken an active seat by also becoming part of the information creation that is being searched. Social media engagement shifts the user intention from browsing to disseminating content [5]. Sentiment Analysis is also used in analyzing and understanding user online behavior, e.g., reference [6] used machine learning on tweets to analyze the sentiments of online users and study their intentions, whereas reference [7] performed semantic analysis of websites to customize search results to better suit the user intent. This research and many others have shaped search engine results, social platform information feeds, and online marketing [8].
Users’ need to propagate information is also essential as it can help control the dissemination of authentic information while filtering misinformation. Recent surveys show that social platforms are the prime source of information gathering and exchange [9]. Numerous research studies have investigated user perspectives on internet content and news integrity. A recent study showed that certain types of social media users are highly motivated to verify information vs. the users whose primary intent on social media is to seek entertainment [10]. In [11], the authors conducted a study exploring the user’s purpose in verifying the information and the methods employed. The research discovered various factors like source credibility and headline content to be prima facie in ascertaining the veracity of information. Information verification has become a challenge for news agencies and end users with the spread of fake information. Research shows that users easily fall for false information if it supports their viewpoint [12].
1.2 Depicting Intent through User Conceptual Profile
Another set of research has targeted capturing a broad set of user characteristics that can target the user’s search intent. Authors [13] studied the demographic characteristics of online users and their wide range of activities, including searching, socializing, banking, etc., reference [14] discussed gender differences in searching behavior and search satisfaction, whereas reference [15] used machine learning classifier to identify gender based on user’s browsing history. Furthermore, an exploratory study was conducted in [16] to observe different personality traits in generation groups based on internet usage and other online activities whereas reference [17] created a BP Neural Network model for predicting personality traits based on user social standing and textual content produced on social platforms. Another work is that of [18], which studied Instagram users’ social behavior and proposed three groups of users based on their e-commerce activities. Authors in [19] presented user characteristics based on behavior on online social platforms. They used clustering analysis to group users based on social activities on social networks like YouTube and presented the different types of information consumer and producer users. The authors in another research [20] investigated differences in gender behavior and intention in information sharing. According to the authors, the information shared on social platforms varies from status updates and liking a post to advertisement sharing, especially on social media like Facebook or Twitter. Furthermore, the intention to share information differs for men and women based on social ties and commitments. The study [21] discussed factors like extraordinary circumstances or times of crisis (e.g., the COVID-19 pandemic), social influence, or user attitudes as causes of an increase in the use of social platforms to access and share information being the only way to connect to rest of the world. The study in [18] investigated Taiwan’s Instagram users’ social behavior and used big data analytics and k-Mean to cluster users and generate user profiles for social media and commerce development. Searching intent and browsing activities on given content were analyzed by authors in [22]. The study proposed three user groups based on the query analysis and selection based on the given target.
The literature review reveals that different user profiles have been researched based on single metrics like e-commerce activity, content consumption, production or social activities, demographics, etc. This research investigates user online behavior and practices in seeking information and uses multiple factors like online searching, information propagation, verification, and demographics like gender, age, and occupation. This research proposes user profiles benefit businesses and users by creating a more personalized experience, targeting ideal customers through focused marketing, increasing website traffic by filtering information users desire, designing customized search filters, etc. The user profile template can be used as a metric for learning systems that can classify users.
The research contributions are as follows:
• Identified the user behavioral features based on information searching, verifying, and sharing behaviors.
• Identified user groups of similar information interests.
• Proposed a new User Intent Class template or golden rule for annotating users based on online information seeking behavior.
• Proved that machine learning can distinguish online users based on a combination of multi-behavioral factors.
The following section highlights and discusses the methodology used for feature engineering, data modeling, clustering, and generating User Intent Class Template. Finally, Section 3 focuses on the results, followed by the discussion and conclusion.
This research aims to investigate online activities and preferences that users employ in searching, sharing, and verifying information and develop a user intent model that can summarize the general characteristics of users concerning online behavior and practices. The proposed modeling steps are presented in Fig. 1. The pipeline is developed after considering related work with a particular focus on the categorical nature of the data. The literature review also revealed that the existing models have yet to cover user search, social, and verify information aspects as complete user information-seeking behavior and, therefore, cannot be directly used. Other works include data types, like textual, and state-of-the-art models, like deep net models used in [23] for text analysis. However, text extraction from social media and visual data are hard to obtain from participants due to privacy and hence are hard to acquire. This concern has also inspired this research to use user feedback on internet experience as they perceive and use this data to generate a user intent model. Also, formulating a generic user profile that can be used later to label users is one of the objectives.
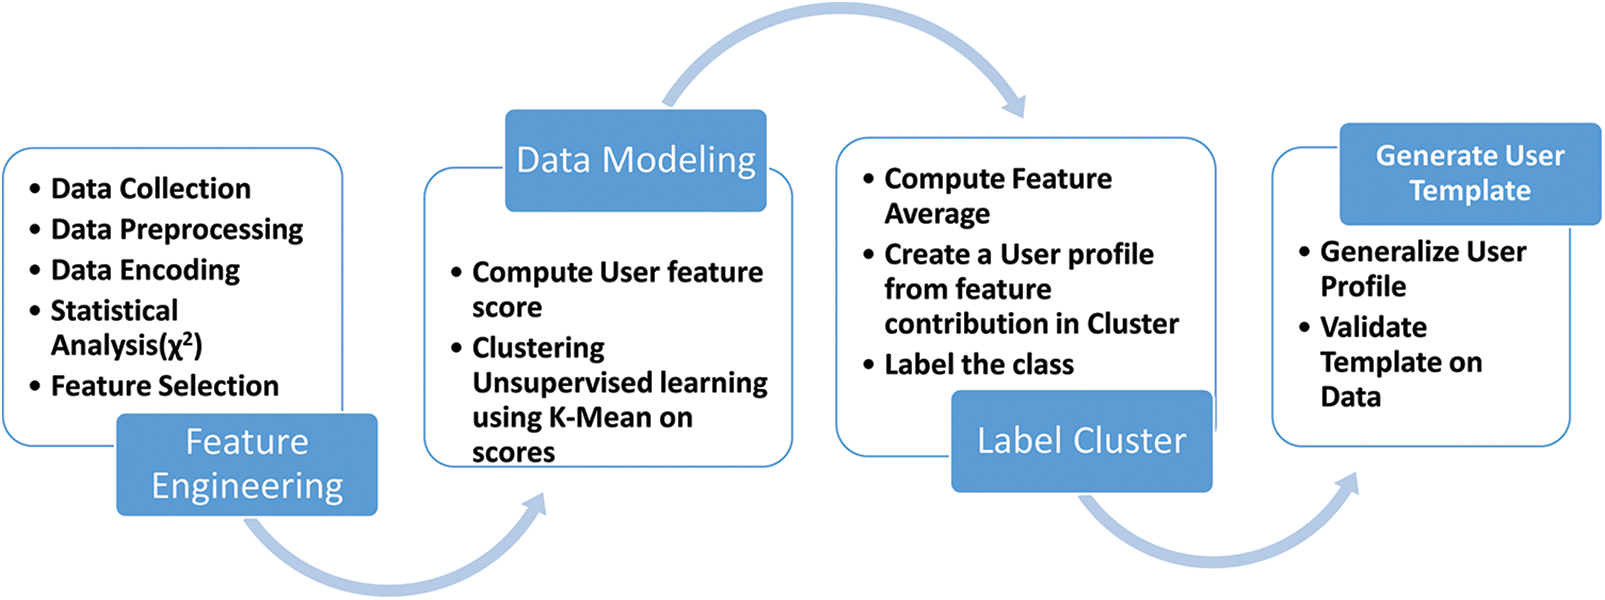
Figure 1: Proposed process flow
The investigation collected user feedback on their online activities, preferences, and use of social networks for information dissemination. The data collected underwent the feature engineering process to extract prominent features. Three new attributes, Search Openness, Online Extravert, and Information Conscientious, are introduced, which are computed based on existing data and represent scores for searching, sharing, and verifying behavior. K-Mean Clustering is used on the new attributes to group similar data. Based on the user characteristics, labels are assigned to clusters. The clusters obtained are added to the original data. Feature average is computed for each class, and the user profile is summarized and labeled. A generalized user template is created and validated by domain experts. User attributes are then analyzed to understand user intent as learned by the machine. Each process in modeling is explained in detail in the following sections.
PyCaret1, Python pandas, and scikit-learn2 are used for feature engineering, data modeling, and classification. Pearson Chi-square Test is run using the Python SciPy3 stats module. Visualization is done using PyCaret and OriginPro20234.
The investigation is based on a qualitative survey comprising multiple categorical questions about user online behavior. It is divided into four parts: (1) users’ demographic data, (2) searching behavior and action, (3) user intent toward information dissemination, and (4) user perception and actions on verification of information. The questions include a mixture of multiple choice, Likert-type, open-ended questions and case studies, which are formulated based on the literature survey on automated fact-checking [24] and traditional journalism [25–27]. It has been piloted by ten users of different backgrounds and ages to ensure that the question’s objective is correctly captured. Based on their review, the questions are finalized. Two special cases are introduced (Figs. SA-I and SA-II). The cases highlight the user’s point of view toward sharing and verifying content. Both cases use fake content deliberately to gather the user behavior toward trusting online content. Domain experts have examined the questionnaire to ensure that standard practices and ethical obligations are met. The JotForm5 platform is used as a survey medium. The questionnaire link, consent form, and invitation letter are broadcasted to different national and international community groups on social platforms like Facebook6 and WhatsApp, closed faculty, students, and other university employee groups. Participation has been anonymous and voluntary, and no incentive was pledged. Three hundred initial responses have been received against the threshold of 200. The final participants are mainly from South Asia and North America, with mostly Urdu or Hindi as their native language. Table SI shows a summary of participants’ demographic information. Other features that later became insignificant are listed in Table SII.
2.1.2 Data Preprocessing and Encoding
Data pre-processing is essential in data analysis to ensure that the data is correct and free from noise, incomplete records, or unwanted or unsuitable data. Therefore, formal data pre-processing steps defined in [28] are carried out to clean and prepare the data for analysis. Fig. 2 illustrates the pre-processing steps.
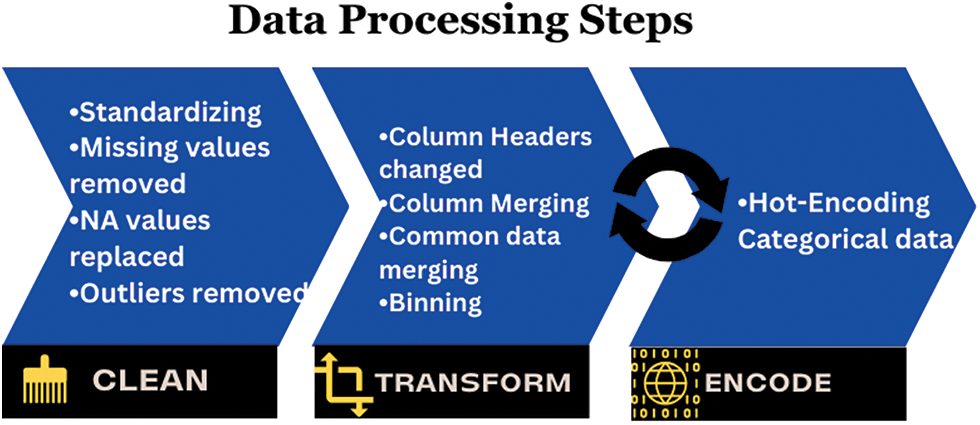
Figure 2: Data preprocessing steps
Since the data is collected using a well-defined input validation mechanism, the chances of noise in the data are significantly less. However, data still requires transformation to be helpful for any statistical or machine-learning process. The data is structured but textual and descriptive; hence, all descriptive data are transformed into short words for processing ease. All the columns or categories have the same naming convention, i.e., main_variable|category_name, e.g., Gender|Male. The category’s skewness is decreased by combining skewed options with other options, eliminating options, or creating range bins. For example, the occupation sector has many options, but some are merged based on the imbalance response count. Similarly, age ranges created in the questionnaire are further combined to create two bins in years, adults (18–40) and old adults (>40). Missing values are replaced with None. The data is further transformed by splitting columns with multiple entries due to multiple-choice selections. Since the nature of the data is categorical, the data with more than two categories are treated as nominal variables, and some with ordered categories like sometimes, rarely, and frequently are considered ordinal [29].
The data is hot encoded [30] to convert nominal and ordinal data to a numerical format. This is done because statistical analysis and general machine learning models require a numerical data format. One-hot encoding, the most used categorical data encoding scheme, is selected for transformation. Hot encoding converts categorical data into a binary vector where each category value is assigned a separate column. All entries with a value are marked one and the rest zero. This is repeated for all the values of categories. Other efficient encoding schemes like Hash encoding, Factorization [30], Target encoding [31], etc., can also be used for categorical data; however, hot encoding is still a better choice as it expands data column-wise while keeping rows the same with no data loss. Other techniques support single-category variables, and separating each category before encoding would lead to an exponential increase in rows, creating redundancy in data. Hot encoding creates sparse data, but it becomes a problem for a large number of columns [31], which is not the case here. Table I in the supplementary file lists a few initial categorical data.
The Skewness in data influences the data analysis and feature reduction process; therefore, after encoding, the slightly skewed categories are merged. Some categories like trusted_publisher, though they did not appear skewed, are still combined with medium_verify_online categories to simplify data and reduce dimensions while removing the skewness of medium_verification_online categories. Figs. SB–I–V illustrate initial skewed data (encoded form). Figs. 3–5 show the distribution of the final feature after feature engineering. Table 1 lists some of the features after transformation (for readability, the naming convention defined above is not used). Scaling and normalization are not required for binary data, but for transformation to numeric data for dimension reduction and scoring, normalization is performed on the dataset. This is discussed more in Section 2.2.2.
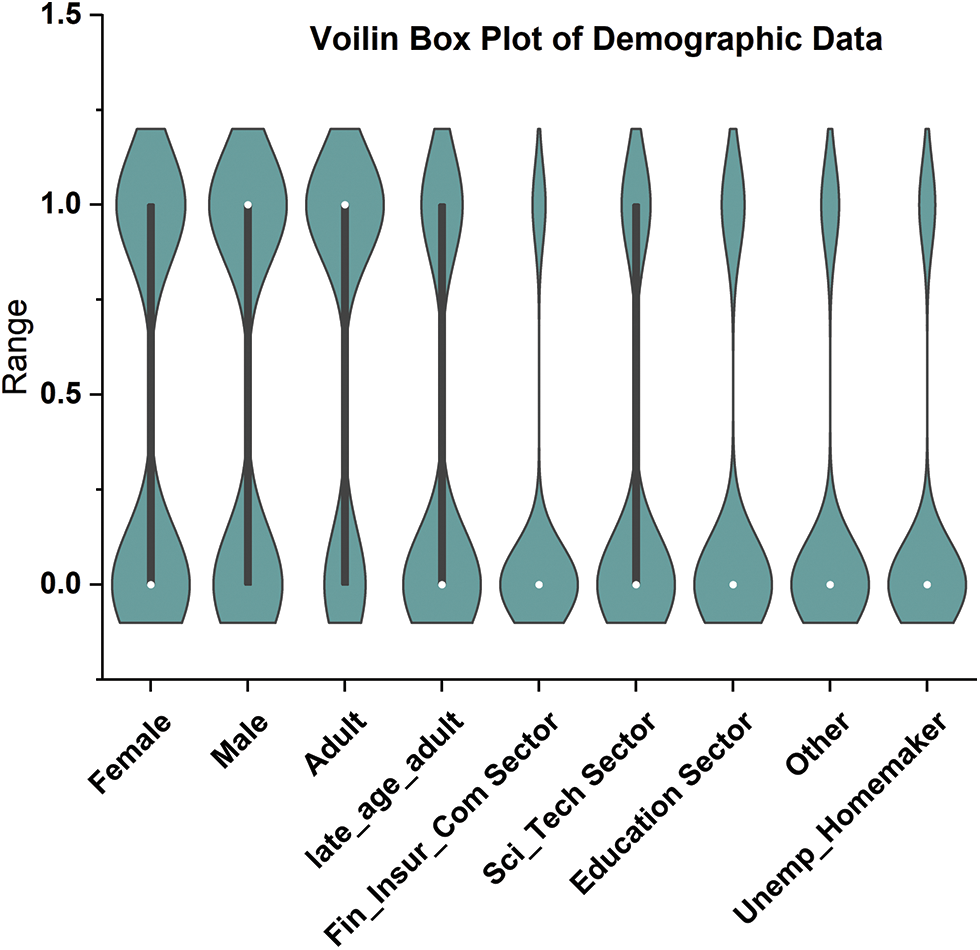
Figure 3: Demographic features after feature processing

Figure 4: Search, share, and verify preferences features after feature processing

Figure 5: Search, share, and verify medium features after feature processing

The initial dataset has 30 main variables, and after preprocessing of data, it is reduced to 25, while categories within these variables are also reduced. As a result, the participants’ responses are also reduced to 255 after preprocessing. After encoding, the 25 variables are expanded to 50 variables.
2.1.3 Data Analysis and Feature Selection
Feature selection is an essential step in data analysis as it eliminates redundant or insignificant features that may cause overfitting of machine learning models. The outcome also reduces the data dimensions, which may help in better accuracy of the machine learning model [32]. Different feature analysis techniques are available under the umbrella of 3 significant methods. (1) Filter, which is based on the ranking model; (2) Wrapper based on classification learning models; and (3) Embedded based on simple feature searching or recursive elimination models [33]. The filtering method is chosen for initial analysis, and univariant statistical analysis, like the Hypothesis Test for Independence, is used to help distinguish dependent and independent variables [29].
The chi-square test for independence (
Bonferroni Adjustment is a simple and adaptive method for any simultaneous inference situation and is used for correcting the p-value. It divides the nominal p-value by the number of tests performed simultaneously or, in other words, by the number of classes within the variable. This way, each class is now transposed to become the primary variable. This ensures the main variable’s overall significance does not exceed the nominal p-value [36]. Thus, the significance of features is determined by p-value ≤ αc whereas αc < p-value < αt is considered medium significance. Then, feature selection is performed based on the adjusted p-values and correlations obtained from the analysis. Table SIII outlines the adjusted αc and αt for features under main categories. In Fig. SB-VI, the final p-values are depicted. After the feature engineering process, it is observed that almost all categories show a high or medium correlation with demographic categories and can be used in modeling and classifying data. The features related to case 1 and case 2 are excluded from the final analysis and are used separately to compute the score, discussed further in Section 2.2.1.
Therefore, the p-value is adjusted using the Bonferroni-Adjusted method defined as:
where Target alpha level = overall alpha level (usually 0.05), n = number of tests.
The approach to answering the first research question involves finding user similarities based on their searching and sharing behavior and practices or generalizing user profiles as [37] indicated. In this research, unsupervised learning is used as it reflects the exploratory nature of the data. With no specific target in mind, unsupervised learning is best used in grouping datasets and labeling them based on the feature relationship. In addition, unsupervised learning offers clustering techniques that use feature similarity to form clusters. The similarity measure is a numeric representation of the closeness of objects and is calculated differently for different clustering techniques like K-Mean, Hierarchal, Spectral, etc., [38]. For this research, multiple methods are applied (Table SIV), and K-Mean is selected as the best model for capturing different groups of users.
2.2.1 Computing Feature Scores Using Weighted Feature
The data comprised binary features that reflected the user’s search, share, and verification behavior. Various research has used mathematical, statistical, and machine learning models to compute label or sample scores better to represent different data patterns. Reference [39] have added item-weighting scores to help the data model rank items that better represent features and samples, whereas [40] calculated user privacy scores by creating a mathematical model template that relates features such that correlation does not change. Authors in this study also used a probabilistic model to calculate scores. In this research, the first step is to identify the user characteristics and their level of involvement in the internet. Three new variables are introduced, computed as the sum of the weighted mean of features. The scores are termed SO, OE and IC.
Search Openness (SO) encapsulates searching behavior depicted from data. It includes search medium and browsing preferences. Online Extravert (OE) defines the sharing behavior based on sharing medium, preferences, and opinions based on cases 1 and 2. Information Conscientious (IC) summarizes information verification mediums and criteria and verification opinions in cases 1 and 2. The demographic features and the new computed scores are used to recognize user behavioral patterns. Case 1 and 2 features are also included in SE and IC since these cases explicitly target the share and verification behavior of the user.
The scores for SO, SE, and IC are calculated as follows:
where Sc = score, V = SO, SE and IC, k = total no. of categories.
The weighted mean (WM) is defined as:
where R = participant response on jth category, WMij = weighted mean at the ith response, and jth category.
The mean of the binary category is defined as:
where Fc = frequency of jth category, S = n number of samples, M = mean of jth category
The new score and demographic features are presented for cluster analysis. Since most clustering techniques work on numeric data sets, whereas this data had binary features, it needed to go through transformation to meet the format required by Clustering techniques.
2.2.2 Removing Outliers and Normalizing Data
Binary data does not require standardization or normalization; however, data with the new score features are normalized firstly to convert binary data to numeric, as most clustering techniques work on numeric data. The Z-score method is used for this purpose [41]. The Isolation Forest or I-Forest technique is used for removing outliers. The threshold was set to 20%. The resultant dataset is reduced to 201 rows.
2.2.3 Identifying User Groups by Employing Clustering Technique
Clustering is an unsupervised machine learning technique derived from Cluster analysis; a statistical method used in exploratory data analysis. Clustering aims to group data that exhibit similar patterns or characteristics. This is done by identifying feature similarities and forming clusters by organizing data in hierarchal structures or nested sequences [42]. Clustering learning was selected to investigate similarities in participants’ data and determine if the behavior observed in this data can be labeled.
Normalized data consisting of demographic data, SO, OE, and IC scores, mentioned in the previous section, is presented to K-Mean clustering. K-Mean is a partitioning unsupervised technique and a widely used clustering method. K-Mean finds centroids of K clusters closest to the samples [43]. The number of clusters K here is arbitrary, and different validation techniques are used to validate the quality of clusters. The K-Elbow curve is used to identify optimal clusters. Fig. 6 reflects on the optimal k = 5 (the point where the line curves), with a distortion score of 1136 (the sum of squared distances from the assigned centroids). Silhouette [44] is used to validate the cluster separation. Fig. 7 indicates that the average silhouette score of 0.3 shows the fair separation of clusters. The analysis also shows no negative score in clusters, indicating that all the data members are well-placed in clusters. Fig. 8 shows the 3D plot of clusters. Different outlier thresholds are tried to maximize outlier removal without decreasing the distance between clusters and the distribution of clusters. Other clustering techniques were also tried on data, including Hierarchal, Spectral, and Birch; however, K-Mean performed better. (Table SIV provides silhouette scores for different techniques using k = 5 and k = 4).

Figure 6: Elbow curve for optimal k clusters

Figure 7: Silhouette plot for cluster performance

Figure 8: 3D view of clusters
2.3 Mining User Intent Class Characteristics for Labelling
The User intention to seek information is projected by the User Intent Class (UIC) model as five classes. The characteristics of each class are extracted based on feature contribution. Based on the behavioral factors observed in the UIC, a labeling scheme is proposed in this research and summarized to represent the user profile.
Online User profiling is an active research domain that helps design effective filtering systems for enhancing user engagement online. Reference [23] used linguistic features to classify different types of Twitter users, and reference [18] used structured data and applied clustering techniques to group Instagram users on commerce activities. Similarly, reference [45] used Facebook user posts and other features to group users by personality. Reference [46] classified Facebook users’ frequency related to their activity, group membership likes shares, etc., to determine personality.
2.3.1 Labelling UIC by Computing Feature Average
The characteristics are summarized based on the average participation of features in clusters. The features fi where i = 1− n total features, the participation of fi in UICj where j = 0–4, is calculated as
i.e., the average participation of the feature is greater or equal to the total average participation of the feature in all UIC. Table SV–VIII show feature participation in clusters, whereas the total represents average cluster participation per feature.
UIC0, which includes adults, primarily males, with science and technology as the occupation sector, focuses on searching and sharing information but verifying selected content. UIC0 is labeled as Focused. UIC1 has a higher frequency of adult females of education, finance, and insurance occupations and use the internet for serious and casual activity but have a higher need to verify data. UIC1 is labeled as NetVenturer. UIC2 includes males who use the internet for targeted content and update information and use OSN for relaxation and staying connected to the world. UIC2 is labeled as Aware. UIC3 comprised late-age adult males who use the internet and social media to explore; however, they believe in investigating content before accepting or sharing. UIC3 is labeled as Committed. UIC4 consists of more female adults who are either unemployed or homemaker and uses the internet and social media for casual surfing and socializing and occasionally verify the information. UIC4 is labeled as Casual Surfer. The labels are proposed based on the average participation. The characteristics extracted based on Eq. (5) are presented as the user characteristics and cluster labels in Table 2.

The characteristics summarized in Table 2 are generalized to obtain ground truth or a template for labeling a new set of users.
2.4.1 UIC Feature Generalizing Criteria
The generalized rule for mapping UIC model features is outlined in Figs. 9a and 9b. The main categories are genderized based on the behavior identified in User Intent Classes. The names are proposed based on general characteristics, e.g., the new feature names under browsing preferences are inspired by the Google categorization of websites. However, each term is defined based on the research results and may differ from other generalizations.

Figure 9a: Schema for generalizing UIC SO and OE feature to Create UIC template

Figure 9b: Schema for generalizing UIC IC and demographic feature to create UIC template
2.4.2 Generating User Template
The User profile was shown to domain experts, who verified the transition process and generic translation. The expert validated the efficacy of the template on a random sample of user data and achieved a reliability of 75%. The sample data selected from user feedback data is mapped using the general scheme presented in Section 2.4.1. The template is further generalized based on the observation defined in Table SIX.
It is then presented to a domain expert, which computes Inter-Rater Reliability (IRR). The criterion for annotation is set to 50% coverage of rules. Inter-Rater Reliability (IRR) is the degree of agreement between independent observers or raters who assess the event or annotate the data based on ground truth or golden rules associated with the event [47]. Percentage is used as IRR and calculated as
whereas UICTIRR is the Inter-Rater Reliability of the UIC Template, UIC LabelM is an annotated label in the sample that matches UIC. The final UIC Template is presented in Table 3.

This research aims to identify users’ characteristics based on their search preferences, information-sharing intention, and trust in the information. The objective is to develop a machine learning framework to identify behavioral patterns and establish a ground truth based on their online behavior and practices. The user intent machine learning model uses the K-Mean clustering technique to identify user behavioral patterns, thus answering RQ1, grouping them into clusters, and extracting significant features that can be mapped into a generalized User Intent class template or ground truth with an IRR of 75%. The UIC template proposed answers the RQ2. The result shows that UIC2 appears to have male users with high search openness, online extravert, and information conscientiousness. On the other hand, UIC4 has mostly female adults with less searching and sharing engagement but not much in verifying content. The user profile is further discussed later in this section. The following section discusses the framework performance.
The clusters generated by K-Mean have a silhouette coefficient of 0.34, which suggests that clusters have overlapping membership. Fig. 7 shows clusters 2 and 4 have lower membership than other clusters, whereas clusters 4, 2, and 0, with silhouette score 0.5, are relatively well separated than clusters 1 and 3. The KMean model is tried with different k settings, while other clustering techniques are also tested (Table SIV). K-Mean model on k = 4 shows considerable overlapping and a decrease in silhouette score. Other clustering models, though, performed well with marginal differences in average silhouette score but presented more overlapping in some clusters; hence, K-Mean clustering with k = 5 is considered optimal. The model performance is also tested by changing the outlier threshold for better cluster separation and, finally, is set to 20%. The model stability is also tested and is further validated by manual annotation. It is inferred that the lower volume of data, outliers interfering in cluster density, and shifting cluster centroid may contribute to a lower silhouette coefficient. However, the cluster classification shows good results, increasing the performance of the entire model.
3.2 User Characteristics and UIC Labels
User characteristics captured by five clusters are used to label the cluster. The characteristics are summarized based on the average participation of categories in clusters. However, almost all the categories have contributed to some degree in clusters; some features show more influence than others. Tables SV–VIII illustrate feature participation in clusters. Fig. 9c presents proposed UIC labels with summarized characteristics. UIC0, which includes adults, primarily males, with science and technology as the occupation sector focuses on searching and sharing information but verifying selected content. UIC0 is labeled as Focused. UIC1 has a higher frequency of adult females of education, finance, and insurance occupations and use the internet for serious and casual activity but have a higher need to verify data. UIC1 is labeled as NetVenturer. UIC2 includes males who use the internet for targeted content and update information and use OSN for relaxation and staying connected to the world. UIC2 is labeled as Aware. UIC3 comprised late-age adult males who use the internet and social media to explore; however, they believe in investigating content before accepting or sharing. UIC3 is labeled as Committed. UIC4 consists of more female adults who are either unemployed or homemaker and uses the internet and social media for casual surfing and socializing and occasionally verify the information. UIC4 is labeled as Casual Surfer. Tables 2 and 3 present the user characteristics and cluster labels after consulting with a domain expert. It is observed that users (above 18 years) generally do like to have some degree of verification of information; however, their level differs. It is interesting that occupation also directs the user’s intentions and activities. User patterns of searching and sharing are concentrated in their area. This can also be seen in UIC4, where users are more into casual content, probably because they do not belong to a specific occupation.

Figure 9c: UIC propose labels
The IRR of 75% indicates that the UIC Template is generalized enough to act as ground truth and can be used for labeling new users. This is beneficial for developing customized searching, targeted marketing, and search engine optimization based on user preferences related to content consumption and production.
This research has targeted user searching behavior, information sharing, and verification intent to generate a generic user profile. The data was derived from user feedback rather than scrapped from the internet as privacy concerns have discontinued many social platforms for sharing data. Moreover, the review revealed that generic user profiles that model user behavior, interest, and intention are not covered, and user profiles are mostly context-based. Another objective of this research is to develop a machine-learning model that can summarize generic user profiles based on information searching, sharing, and verification behaviors.
This research is conducted to answer two questions: a) Can machine learning determine online user characteristics based on their behavior and practices in searching, sharing, and verifying information? b) Can user characteristics be generalized to generate a user intent template or ground truth? This research uses a hybrid machine learning approach to successfully cluster similar users based on their online search, share, and verification behavior. It proposes a new user profile ground truth that can be used to annotate users. The unsupervised K-Mean Clustering machine learning technique groups users based on similar features. The clustering resulted in five User Intent Classes (UIC) with a distortion score of 1120 and an average silhouette score of 0.34. Five different types of users are proposed based on their information-seeking behavior, and the characteristics are summarized. The Committed are those who balance work and leisure, the Casual Surfers search and share for leisure with minimal need to authenticate information, the NetVenturers uses the internet for all purpose but keep their eyes open, the Focused mainly seek information for serious work, and the Aware keep themselves up to date on information but use the internet wisely. A UIC template is also proposed, which is a generalized form obtained from the findings. The findings for Inter-Rater Reliability (IRR) of 75% show that the UIC template can successfully annotate user based on their information seeking behavior.
These findings can be used to tailor online services to use generic user profiles that can be securely used to increase the user experience on the internet by providing the information the user generally intends. The research contributed to developing a framework for profiling users based on unique three-dimensional data, i.e., user search intent, information dissemination needs, and content credibility criteria. This research proposes new variables to identify and generalize user intentions in seeking online information. User online intentions have been investigated previously in different contexts and perspectives. Information-seeking behavior and the use of social media to consume and produce information are a few areas explored under user intention. Studies like [9] and [10] were also conducted in social or psychological contexts to understand user trust in information consumed through the internet. This research argues that user intention in seeking information is a mixture of multiple behaviors and must be considered in knowing the full intent of the user in acquiring knowledge. The research shows a correlation between search and share, whereas verification adds weight to how much truth users desire. Better search filters can be designed based on such data. Search Engine Optimization (SEO), targeted advertising, and shopping experience for user services can also benefit from user profiling.
The research captured specific demographic data; therefore, more extensive, and diverse data is required for further generalization. Diversity was initially aimed for but was restricted by regional reachability and funding restrictions. Payment-based user platforms like Amazon Mechanical Turk can be used to enroll participants of diverse backgrounds. More sophisticated models, like neural nets, can be tried with a more extensive set. The research did not aim for a real-time model that can also be focused on in the future. In addition, further work can be done to capture live user actions and create a mapping framework to evaluate the current model.
Acknowledgement: The authors would like to thank the study participants and data Raters for their valuable services.
Funding Statement: This research is funded by the Ministry of Science and Technology (MoST) Endowment Fund governed under NED University of Engineering and Technology Pakistan. https://csrd.neduet.edu.pk/.
Author Contributions: The authors confirm their contribution to the paper as follows: Study Conception and Design: Moona Kanwal, Najeed A. Khan; Data Collection, Analysis and Interpretation of Results: Moona Kanwal, Najeed A. Khan, Aftab A. Khan; Draft Manuscript Preparation: Moona Kanwal. All authors reviewed the results and approved the final version of the manuscript.
Availability of Data and Materials: Data collected in this research is part of Ph.D. research and cannot be made available at this time. However, it can be made available upon reasonable request in the future.
Conflicts of Interest: The authors declare that they have no conflicts of interest to report regarding the present study.
Supplementary Materials: The supplementary material is available online at https://doi.org/10.32604/cmc.2024.047223.
1https://pycaret.readthedocs.io
References
1. C. Kofler, M. Larson, and A. Hanjalic, “User intent in multimedia search: A survey of the state of the art and future challenges,” ACM Comput. Surveys, vol. 49, no. 2, pp. 1–37, 2016. doi: 10.1145/2954930. [Google Scholar] [CrossRef]
2. J. Shi, P. Hu, K. Lai, and G. Chen, “Determinants of users’ information dissemination behavior on social networking sites: An elaboration likelihood model perspective,” Internet Res., vol. 28, no. 2, pp. 393–418, 2018. doi: 10.1108/IntR-01-2017-0038. [Google Scholar] [CrossRef]
3. M. Soleymani, M. Riegler, and P. Halvorsen, “Multimodal analysis of user behavior and browsed content under different image search intents,” Int. J. Multimed. Inf. Retr., vol. 7, pp. 29–41, 2018. doi: 10.1016/j.est.2021.103009. [Google Scholar] [CrossRef]
4. S. F. Tsao, H. Chen, T. Tisseverasinghe, Y. Yang, L. Li, and ZA. Butt, “What social media told us in the time of COVID-19: A scoping review,” Lancet Digit. Health, vol. 3, no. 3, pp. e175–e194, 2021. doi: 10.1016/S2589-7500(20)30315-0 [Google Scholar] [PubMed] [CrossRef]
5. H. Reza, S. Nezhad, R. Dolan, and M. R. Iraq, “The role of social media content format and platform in users’ engagement behavior,” J. Interact. Mark., vol. 53, pp. 41–65, Feb. 2021. doi: 10.1016/j.intmar.2020.05.001. [Google Scholar] [CrossRef]
6. K. Chouhan et al., “Sentiment analysis with tweets behaviour in Twitter streaming API,” Comput. Syst. Sci. Eng., vol. 45, no. 2, pp. 1113–1128, 2023. doi: 10.32604/csse.2023.030842. [Google Scholar] [PubMed] [CrossRef]
7. P. Bedi, S. B. Goyal, A. S. Rajawat, R. N. Shaw, and A. Ghosh, “A framework for personalizing a typical web search sessions with concept-based user profiles using selective machine learning techniques,” in Adv. Comput. Intell. Technol. Lecture Notes in Netw. Syst., vol. 218, 2022. [Google Scholar]
8. Z. Wu et al., “The influence of image search intents on user behavior and satisfaction,” in The Twelfth ACM Int. Conf. on Web Search and Data Mining (WSDM ’19), Melbourne, VIC, Australia, 2019. [Google Scholar]
9. D. Fraszczak, “Information propagation in online social networks–A simulation case study,” in Proc. 38th Int. Bus. Inf. Manage. Assoc. (IBIMA), Seville, Spain, Nov. 2021. [Google Scholar]
10. R. P. Yu, “How types of facebook users approach news verification in the mobile media age: Insights from the dual-information-processing model,” Mass Commun. Soc., vol. 24, no. 2, pp. 233–258, 2021. doi: 10.1080/15205436.2020.1839104. [Google Scholar] [CrossRef]
11. E. Stephanie, R. R. Mourão, E. Thorson, and S. M. Tham, “When do audiences verify? How perceptions about message and source influence audience verification of news headlines,” J. Mass Commun. Q., vol. 97, no. 1, pp. 52–71, 2020. doi: 10.1177/1077699019864680. [Google Scholar] [CrossRef]
12. X. Wang, F. Chao, G. Yu, and K. Zhang, “Factors influencing fake news rebuttal acceptance during the COVID-19 pandemic and the moderating effect of cognitive ability,” Comput. Hum. Behav., vol. 130, pp. 107–174, 2022. doi: 10.1016/j.chb.2021.107174 [Google Scholar] [PubMed] [CrossRef]
13. B. Schehl, J. Leukel, and V. Sugumaran, “Understanding differentiated internet use in older adults: A study of informational, social, and instrumental online activities,” Comput. Hum. Behav., vol. 97, pp. 222–230, 2019. doi: 10.1016/j.chb.2019.03.031. [Google Scholar] [CrossRef]
14. M. Parinaz and W. Stock, “Gender-specific information search behavior,” Webol., vol. 7, no. 2, 2010. [Google Scholar]
15. T. H. Le and N. T. Hang, “Identifying gender of internet users based on access history,” J. Univ. Shanghai Sci. Technol., vol. 23, no. 8, pp. 270, 2021. [Google Scholar]
16. J. M. Roos and A. Kazemi, “Personality traits and Internet usage across generation cohorts: Insights from a nationally representative study,” Curr. Psychol., vol. 40, pp. 1287–1297, 2021. doi: 10.1007/s12144-018-0033-2. [Google Scholar] [CrossRef]
17. X. Qin et al., “User OCEAN personality model construction method using a BP neural network,” Electron., vol. 11, no. 19, pp. 3022, 2022. doi: 10.3390/electronics11193022. [Google Scholar] [CrossRef]
18. S. H. Liao, R. Widowati, and C. J. Cheng, “Investigating Taiwan Instagram users’ behaviors for social media and social commerce development,” Entertain. Comput., vol. 40, pp. 100461, 2022. doi: 10.1016/j.entcom.2021.100461. [Google Scholar] [CrossRef]
19. M. Maia, J. Almeida, and V. Almeida, “Identifying user behavior in online social networks,” in Proc. 1st Workshop on Soc. Netw. Syst., Glasgow Scotland, UK, 2008, pp. 1–6. doi: 10.1145/1435497.1435498. [Google Scholar] [CrossRef]
20. X. L.Lin and X. Q. Wang, “Examining gender differences in people’s information-sharing decisions on social networking sites,” Int. J. Inform. Manage., vol. 50, pp. 45–56, Feb. 2020. doi: 10.1016/j.ijinfomgt.2019.05.004. [Google Scholar] [CrossRef]
21. M. Abdulalem and F. Alberto, “Factors influencing user participation in social media: Evidence from twitter usage during COVID-19 pandemic in Saudi Arabia,” Technol. Soc., vol. 66, pp. 101651, Aug. 2021. doi: 10.1016/j.techsoc.2021.101651. [Google Scholar] [CrossRef]
22. M. Zhuang, E. Toms, and G. Demartini, “The relationship between user perception and user behaviour in interactive information retrieval evaluation.,” in Lecture Notes in Comput. Sci., Italy: Spring International Publishing, 2016, pp. 293–305. [Google Scholar]
23. M. Heidari, J. H. Jones, and O. Uzuner, “Deep contextualized word embedding for text-based online user profiling to detect social bots on Twitter,” in 2020 Int. Conf. on Data Mining Workshops (ICDMW),Sorrento, Italy, 2020, pp. 480–487. [Google Scholar]
24. H. Kyungsik, “How do you perceive this author? Understanding and modeling authors’ communication quality in social media,” PLoS One, vol. 13, no. 2, pp. e0192061, 2018. doi: 10.1371/journal.pone.0192061 [Google Scholar] [PubMed] [CrossRef]
25. R. Fletcher and S. Park, “The impact of trust in the news media on online news consumption and participation,” Digit. J., vol. 5, no. 10, pp. 1281–1299, 2017. doi: 10.1080/21670811.2017.1279979. [Google Scholar] [CrossRef]
26. A. Apejoye, “Comparative study of social media, TV and newspapers news credibility,” in Int. Conf. on Media Commun.,Technol. Design, Dubai, UAE, Apr. 2015. [Google Scholar]
27. W. Hadiza, “Professional versus social media: News credibility and impact,” in 11th Int. RAIS Conf. on Soc. Sci., Scientia Moralitas Research Institute, 2018, pp. 252–256. [Google Scholar]
28. S. A. Alasadi and W. S. Bhaya, “Review of data preprocessing techniques in data mining,” J. Eng. Appl. Sci., vol. 12, no. 16, pp. 4102–4107, 2017. [Google Scholar]
29. A. Agresti, Categorial data analysis. New Jersey: John Wiley & Sons, 2013. [Google Scholar]
30. C. Seger, “An investigation of categorical variable encoding techniques in machine learning: Binary versus one-hot and feature hashing,” Accessed: Oct. 26, 2018. https://urn.kb.se/resolve?urn=urn:nbn:se:kth:diva-237426 [Google Scholar]
31. P. Cerda and G. Varoquaux, “Encoding high-cardinality string,” IEEE Trans. Knowl. Data Eng., vol. 32, no. 3, pp. 1164–1176, 2022. doi: 10.1109/TKDE.2020.2992529. [Google Scholar] [CrossRef]
32. A. Bommert, X. Sun, B. Bischl, and J. Rahnenführer, “Benchmark for filter methods for feature selection in high-dimensional classification data,” Comput. Stat. Data Anal., vol. 143, pp. 106839, 2020. doi: 10.1016/j.csda.2019.106839. [Google Scholar] [CrossRef]
33. U. Khaire and R. Dhanalakshmi, “Stability of feature selection algorithm: A review,” J. King Saud Univ. Comput. Inf. Sci., vol. 34, no. 4, pp. 1060–1073, 2022. doi: 10.1016/j.jksuci.2019.06.012. [Google Scholar] [CrossRef]
34. M. L. McHugh, “The chi-square test of independence,” Biochem. Med., vol. 23, no. 2, pp. 143–149, 2013. doi: 10.11613/BM.2013.018 [Google Scholar] [PubMed] [CrossRef]
35. P. S. Wright, “Adjusted p-values for simultaneous inference,” Biom, vol. 48, no. 3, pp. 1005–1013, 1992. doi: 10.2307/2532694. [Google Scholar] [CrossRef]
36. D. J. Mundfrom, J. J. Perrett, J. Schaffer, A. Piccone, and M. Roozeboom, “Bonferroni adjustments in tests for regression coefficients,” Multiple Linear Regression Viewpoints, vol. 32, no. 1, pp. 1–6, 2006. [Google Scholar]
37. C. I. Eke, A. A. Norman, L. Shuib, and H. F. Nweke, “A survey of user profiling: State-of-the-art, challenges, and solutions,” IEEE Access, vol. 7, pp. 144907–144924, 2019. doi: 10.1109/ACCESS.2019.2944243. [Google Scholar] [CrossRef]
38. M. Alloghani, D. Al-Jumeily, J. Mustafina, A. Hussain, and A. J. Aljaaf, “A systematic review on supervised and unsupervised machine learning algorithms for data science,” Superv. Unsuperv. Learn. Data Sci., pp. 3–21, 2020. doi: 10.1007/978-3-030-22475-2_1. [Google Scholar] [CrossRef]
39. H. Yin, B. Cui, L. Chen, Z. Hu, and Z. Huang, “A temporal context-aware model for user behavior modeling in social media systems,” in Proc. 2014 ACM SIGMOD Int. Conf. on Manage. Data, Snowbird, Utah, USA, 2014, pp. 1543–1554. [Google Scholar]
40. K. Liu and E. Terzi, “A framework for computing the privacy scores of users in online social networks,” ACM Trans. Knowl. Discov. Data, vol. 5, no. 1, pp. 1–30, 2010. doi: 10.1145/1870096.1870102. [Google Scholar] [CrossRef]
41. D. Singh and B. Singh, “Feature wise normalization: An effective way of normalizing data,” Pattern Recognit., vol. 122, pp. 108307, 2022. doi: 10.1016/j.patcog.2021.108307. [Google Scholar] [CrossRef]
42. A. E. Ezugwu et al., “A comprehensive survey of clustering algorithms: State-of-the-art machine learning applications, taxonomy, challenges, and future research prospects,” Appl. Artif. Intell., vol. 110, pp. 104743, 2022. doi: 10.1016/j.engappai.2022.104743. [Google Scholar] [CrossRef]
43. G. Oyewole and G. Thopil, “Data clustering: Application and trends,” Artif. Intell. Rev., vol. 56, no. 7, pp. 6439–6475, 2023. doi: 10.1016/j.engappai.2022.104743. [Google Scholar] [CrossRef]
44. J. O. Palacio-Niño and F. Berzal, “Evaluation metrics for unsupervised learning algorithms,” arXiv preprint arXiv:1905.05667, 2019. [Google Scholar]
45. M. M. Tadesse, H. Lin, B. Xu, and L. Yang, “Personality predictions based on user behavior on the Facebook social media platform,” IEEE Access, vol. 6, pp. 61959–61969, 2018. doi: 10.1109/ACCESS.2018.2876502. [Google Scholar] [CrossRef]
46. A. Souri, S. Hosseinpour, and A. M. Rahmani, “Personality classification based on profiles of social networks’ users and the five-factor model of personality,” Hum. Centric Comput. Inf. Sci., vol. 8, no. 1, pp. 1–15, 2018. doi: 10.1186/s13673-018-0147-4. [Google Scholar] [CrossRef]
47. N. McDonald, S. Schoenebeck, and A. Forte, “Reliability and inter-rater reliability in qualitative research: Norms and guidelines for CSCW and HCI practice,” Proc. ACM Hum. Comput. Interact., vol. 3, no. CSCW, pp. 1–23, 2019. doi: 10.1145/3359174. [Google Scholar] [CrossRef]
Cite This Article
 Copyright © 2024 The Author(s). Published by Tech Science Press.
This work is licensed under a Creative Commons Attribution 4.0 International License , which permits unrestricted use, distribution, and reproduction in any medium, provided the original work is properly cited.
 Downloads
 Citation Tools