
 Submit a Paper
 Propose a Special lssue
 Open Access
ARTICLE

IR-YOLO: Real-Time Infrared Vehicle and Pedestrian Detection
1 Department of Electrical Engineering and Automation, Jiangxi University of Science and Technology, Ganzhou, 341000, China
2 Jiangxi Provincial Key Laboratory of Maglev Technology, Ganzhou, 341000, China
3 Graduate School of Information, Production and Systems, Waseda University, Kitakyushu-shi, Fukuoka, 808-0135, Japan
* Corresponding Author: Hao Zhu. Email:
(This article belongs to the Special Issue: Deep Learning based Object Detection and Tracking in Videos)
Computers, Materials & Continua 2024, 78(2), 2667-2687. https://doi.org/10.32604/cmc.2024.047988
Received 24 November 2023; Accepted 28 December 2023; Issue published 27 February 2024
 View Full Text
 Download PDF
Abstract
Road traffic safety can decrease when drivers drive in a low-visibility environment. The application of visual perception technology to detect vehicles and pedestrians in infrared images proves to be an effective means of reducing the risk of accidents. To tackle the challenges posed by the low recognition accuracy and the substantial computational burden associated with current infrared pedestrian-vehicle detection methods, an infrared pedestrian-vehicle detection method A proposal is presented, based on an enhanced version of You Only Look Once version 5 (YOLOv5). First, A head specifically designed for detecting small targets has been integrated into the model to make full use of shallow feature information to enhance the accuracy in detecting small targets. Second, the Focal Generalized Intersection over Union (GIoU) is employed as an alternative to the original loss function to address issues related to target overlap and category imbalance. Third, the distribution shift convolution optimization feature extraction operator is used to alleviate the computational burden of the model without significantly compromising detection accuracy. The test results of the improved algorithm show that its average accuracy (mAP) reaches 90.1%. Specifically, the Giga Floating Point Operations Per second (GFLOPs) of the improved algorithm is only 9.1. In contrast, the improved algorithms outperformed the other algorithms on similar GFLOPs, such as YOLOv6n (11.9), YOLOv8n (8.7), YOLOv7t (13.2) and YOLOv5s (16.0). The mAPs that are 4.4%, 3%, 3.5%, and 1.7% greater than those of these algorithms show that the improved algorithm achieves higher accuracy in target detection tasks under similar computational resource overhead. On the other hand, compared with other algorithms such as YOLOv8l (91.1%), YOLOv6l (89.5%), YOLOv7 (90.8%), and YOLOv3 (90.1%), the improved algorithm needs only 5.5%, 2.3%, 8.6%, and 2.3%, respectively, of the GFLOPs. The improved algorithm has shown significant advancements in balancing accuracy and computational efficiency, making it promising for practical use in resource-limited scenarios.Keywords
Pedestrians and vehicles are major players on the road. However, at night or under low-visibility conditions, vehicle drivers’ field of vision can be limited, making it difficult to observe pedestrians and vehicles on the road, which may result in the inability to brake the vehicle in time, thereby increasing the risk of accidents. The traditional detection technology [1] avoids obstacles through the integration of advanced robot technology and sensor technology to conduct radar scanning of objects in front of the robot; however, this approach requires highly accurate sensors and cannot identify the specific object categories in front of the robot. Visual perception [2,3] is one of the key technological foundations for solving the problem of driving at night or under low-visibility conditions and can be utilized to monitor the surrounding environment in real time. Through an effective visual perception system, drivers can have a clearer understanding of the situation on the road and take actions such as braking in time to reduce the risk of accidents. However, the existing nighttime infrared image detection technology faces several problems:
(1) Nighttime infrared images typically exhibit relatively low resolution, and the image details are not clear enough, resulting in difficulties in accurately detecting and recognizing distant targets.
(2) The targets in nighttime infrared images are usually displayed in the form of heat, which can easily lead to difficulties in detecting, recognizing, and classifying the targets because the targets usually have a small temperature difference from the background environment.
(3) Complex image processing algorithms and computationally demanding tasks can hamper processing speed, jeopardizing real-time requirements.
Detection techniques for nighttime infrared images can be categorized into traditional infrared image target detection methods and deep learning approaches. The traditional methods mainly use image segmentation to obtain regions of interest in the original image; then, window sliding is used to extract features from these specific regions of the image, and The classifier is applied to the extracted features for the final result output. Li et al. [4] introduced the concept of weighted Histogram of Oriented Gradients (HOGs) algorithm for feature extraction of infrared pedestrian images; Xi et al. [5] proposed a Scale-Invariant Feature Transform (SIFT) based and Oriented fast and Rotated Brief (ORB) feature detection method for conducting common feature analysis between infrared and visible images, including feature point detection; and Xue et al. [6] proposed a multifeature fusion algorithm utilized in conjunction with a Support Vector Machine (SVM) for the extraction of features from pedestrians and vehicles in low-light nighttime environments to confirm the presence of pedestrians and vehicles within the extracted target area. Zheng et al. [7] proposed an SPD (symmetric positive definite) manifold hashing algorithm based on random projection and quantization in the extended data space to perform target detection tasks in low-dimensional space, which may accelerate the calculation process and improve the efficiency of detection. Although traditional target detection methods for infrared images can achieve target detection to a certain extent, manually designed feature extraction methods may be limited by the complexity and diversity of the images, resulting in limited detection performance.
In contrast, techniques utilizing deep learning have made remarkable advancements in infrared image target detection. In addition, two primary categories encompass target detection algorithms based on deep learning [8]: two-stage algorithms, which rely on candidate regions and are exemplified by the R-CNN [9] series, these algorithms, characterized by high detection accuracy, tend to exhibit slow detection speeds and poor real-time performance, which is not conducive to deployment in practical applications; and one-stage algorithms represented by the YOLO [10] series of algorithms, which have the characteristics of fast detection speed, good real-time performance, high accuracy, and other characteristics. In this paper, we detect vehicles and pedestrians on the road while the car is traveling, and there is a need to enhance both the detection speed and accuracy; therefore, we use YOLO series algorithms for detection. Qing et al. [11] and others used the improved YOLOv3 model for the identification of people and cars in infrared images to enhance the overall precision of the network model. Li [12] and others added category balancing in the YOLOv3 loss function, a solution to the issue of an imbalanced distribution among categories is addressed in infrared images during the nighttime driving process, and the accuracy has been significantly improved. Tao et al. [13] and others proposed an algorithm based on the YOLOv4 algorithm for infrared pedestrian detection, resulting in a notable improvement in detection accuracy. However, the above studies have problems such as low accuracy in small target recognition, difficulty in category classification, and large computational volume, this limitation hinders the application of deep learning in edge devices or resource-constrained environments.
To tackle the previously mentioned concerns opts for YOLOv5s [14] as the basic model and improves upon it to boost recognition accuracy while reducing computational overhead. The main objectives are to:
(1) optimize the small target detection head, and fully utilize shallow feature information, to more effectively capture subtle target features in infrared images and enhance the accuracy of small target information;
(2) optimize the loss function to tackle challenges associated with target overlap and category classification in infrared images and improve the ability to accurately classify and locate targets within infrared imagery;
(3) optimize the feature extraction operators, introduce lightweight feature extraction operators, minimize the computational workload in the model enhance its efficiency, and adapt to the requirements of actual application scenarios.
In Section 2.1, we present the fundamental YOLOv5 model, and in Section 2.2, we delve into the theoretical foundations of the Infrared-You Only Look Once (IR-YOLO) model design and key improvement points. In Section 3, experimental data processing is introduced, including experimental verification indicators, experimental environment settings, and experimental dataset processing. In Section 4.1, ablation treatment, experimental head optimization verification experiments, and optimization of the loss function are undertaken, and a distributed shift convolution DSConv verification experiment is performed. In Section 4.2, we evaluate the effectiveness of the proposed model and benchmark it against popular network models, and in Section 4.3, the experimental picture effect is tested. Finally, the article is summarized.
In this section, we present the methodology utilized, we present the YOLOv5s network model, and the IR-YOLO infrared target detection method. The details of these methods are described in each section.
Fig. 1 illustrates the network architecture of YOLOv5s. The structure comprises four main components: input, backbone, feature amalgamation layer, and detection layer. At the input end, the original image is preprocessed and converted into a 640 × 640 × 3 tensor for input into the network. The input tensor is first sliced by a 6 × 6 convolution module, which realizes the downsampling operation and increases the channel dimension. Second, the Cross Stage Partial Darknet-53 (CSPDarknet53) [15], the configuration of the backbone network in YOLOv5s serves for the retrieval of characteristics from the input. Third, the feature fusion layer is composed of the Spatial Pyramid Pooling-Fast (SPPF) module, feature pyramid network (FPA) module, and path aggregation network (PAN) [16] module, which completes the transmission and fusion of the extracted features within the backbone architecture. Finally, the features that have been extracted are predicted by a detection layer composed of a classification, regression complete intersection over union (CIoU) loss function, and non-maximum suppression (NMS) [17].

Figure 1: YOLOv5 network structure
Within the network architecture of YOLOv5s, the Convolution (Conv) module consists of traditional convolution, Batch Normalization-2d, and the Sigmoid Linear unit (SiLu) activation function. Traditional convolution is used for feature extraction and channel number adjustment, whereas batch normalization is employed to expedite network convergence and enhance network stability and generalizability. The SiLu activation function can improve the regularization effect and prevent network saturation and gradient disappearance. The SPPF module structure consists of a standard convolution module used to halve the input channel. After the fusion of local features and full moment features, to improve the feature map’s expression and enable better identification of size variations in the image, three maximum pooling operations of size 5 × 5 are utilized. There are two types of C3 modules in YOLOv5s, which are divided into C3(T) and C3 according to the presence or absence of residual edges. By introducing residual edges, the C3(T) module can better propagate gradients and promote network convergence and optimization. In contrast, the C3 module has no residual edges and is designed as a more lightweight module. The learning capability of the YOLOv5s network is strengthened by the integration of the C3 module, maintaining commendable accuracy in a lightweight manner, and concurrently reducing computing and memory costs.
For vehicle driving safety, early warning must be provided for remote pedestrians and vehicles. In infrared images, distant pedestrians and vehicles are not clear enough. During training, the YOLOv5s model is prone to problems such as a lack of obvious detection or disappearance of small target features. When employing infrared devices for nighttime or other scene pedestrian and vehicle detection, the background colors in infrared images frequently exhibit a close resemblance to the colors of pedestrians and vehicles. During the training phase, issues such as uneven distribution in the classification of detection samples arise in the YOLOv5s model. This calculation load of the YOLOv5 model is large, which may cause the processing speed to decrease, preventing it from meeting real-time requirements in practical applications.
2.2 Infrared Target Detection Based on IR-YOLO
Subsequently, we present a comprehensive overview of a novel infrared target detection method founded on the IR-YOLO structure. This method aims to solve a series of problems in the domain of object detection for automotive infrared images, including problems related to the overall frame, small target detection head optimization, loss function optimization, and feature extraction operator optimization.
Given the above problems in the target detection of automotive infrared images, this paper, Fig. 2 illustrates the architecture of IR-YOLO. First, the module specialized in small target detection undergoes optimization, and the original YOLOv5s model is enhanced by the addition of a small target detection head. The shallow feature information is extensively utilized to extract nuanced target features from the infrared image, thereby enhancing the precision of detecting small targets. Secondly, to enhance the loss function, we substituted the CIoU loss function with the focal Generalized Intersection over Union (GIoU) loss function, effectively addressing target overlap and sample imbalance issues in infrared images. Finally, the feature extraction operator is optimized, and the distributed shift convolution DSConv is employed as a replacement for traditional convolution (Conv), reducing the computational burden of the model without affecting the detection accuracy as much as possible and reducing the calculation pressure on automotive hardware.

Figure 2: IR-YOLO model structure diagram
2.2.2 Small Target Detection Head Optimization
The detection head aims to establish a relationship that enables the candidate target frame to approach the real target frame wirelessly. The approach involves dividing the original image into a grid of S × S units. Each grid predicts 3 prediction frames of different sizes and contains the position coordinate points (x, y) dimensions (width, height) is (w, h), and confidence degree c of each prediction box. The forecasted box is derived by translating and scaling the reference box. Fig. 3 illustrates the relationship between the predicted box and the reference box. When the midpoint coordinates of the real box are in a certain grid, the target is predicted from this grid. The confidence is determined by the probability associated with the predicted box and the Intersection over Union (IoU) value with the box that is currently present and the box that is anticipated. By setting the threshold of confidence, the irrelevant prediction box is filtered out. Ultimately, the NMS algorithm is applied to obtain the final predicted box without maximum suppression.

Figure 3: Relationships between a prior box and a prediction box
The previous frame is indicated by the dashed line, whereas the predicted frame is represented by the solid line. The coordinate calculation formula of the target prediction is as follows:
In the equation,
The small-scale detection head, equipped with a generous receptive field, is employed specifically for the detection of larger targets, while the large-scale detection head is used to detect small targets. In this paper, a detection head with a scale of 160 × 160 is incorporated into the shallow feature layer within the original YOLOv5s model designed for the detection of small targets. Table 1 outlines the associations in the four different scales, there exists a relationship between the sizes of the feature maps and the sizes of the reference frames.
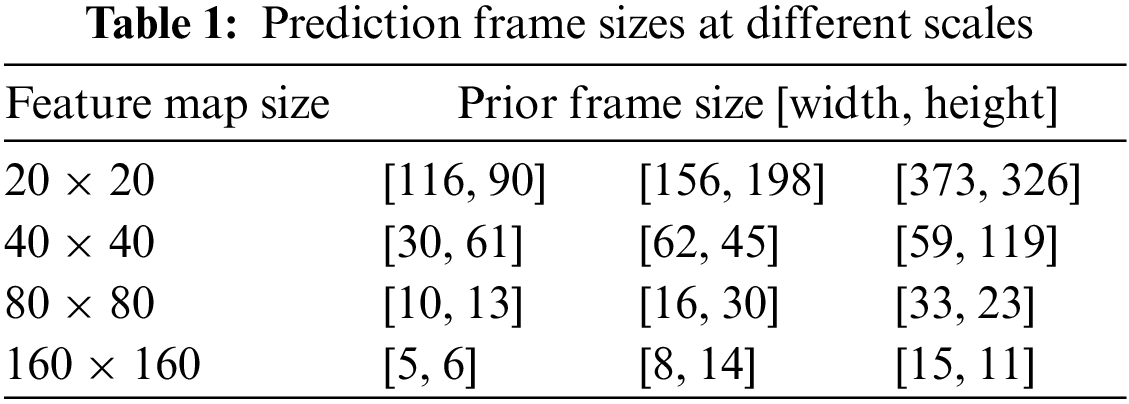
This small target detection header can be implemented by adding additional convolutional layers and pooling operations are introduced to the network to augment its receptive field and enhance feature extraction capabilities, which contributes to improving the precision of detection and the network’s ability to withstand small targets. The specific improvement method for the YOLOv5s basic model is shown in Fig. 4. First, a Conv module is added behind the 17th layer of the YOLOv5s basic structure. Second, An UpSample module is incorporated to perform upsampling and enlarge the feature map size by a factor of two. After the concatenation splicing module, tensor splicing is conducted using the shallow features from output layer 2. Ultimately, feature extraction is accomplished through a C3-False module, and the results are output to the detection layer.
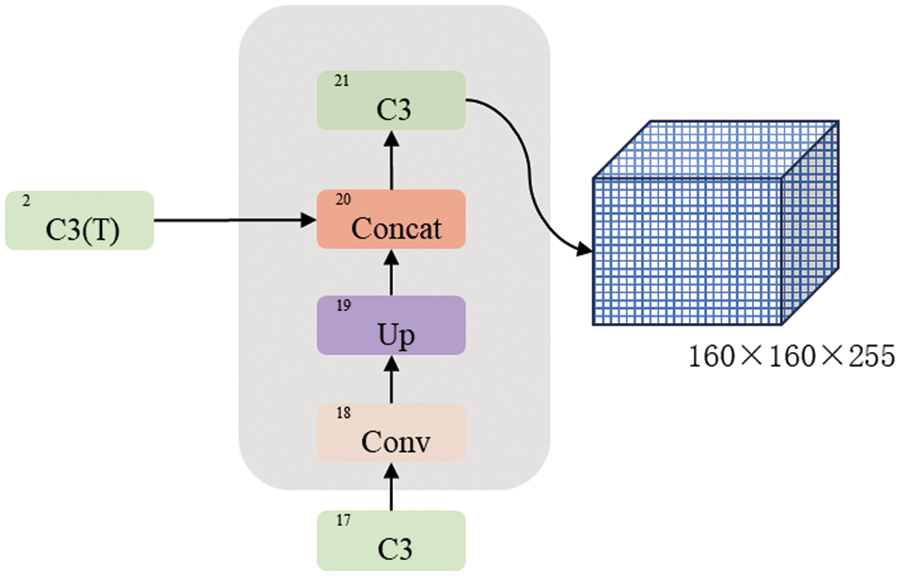
Figure 4: Integrating a small target detection head improves YOLOv5s
2.2.3 Loss Function Optimization
The core YOLOv5 model consists of three components: localization loss, confidence loss, and class loss. The computation of confidence and class losses involves the utilization of a binary cross-entropy loss function. The calculation formula of the positioning loss is shown in Eq. (2):
The CIoU is used in the YOLOv5 base model to calculate the positioning loss:
In the formula, a serves as an equilibrium parameter and does not contribute to gradient calculations; r denotes the Euclidean separation between the center points; and v serves as a parameter to assess the uniformity of the aspect ratio. d represents the distance between the midpoint of the real frame and the predicted frame, and e represents the diagonal length of the smallest enclosing frame. The CIoU comprehensively incorporates the overlap ratio, distance between center points, and aspect ratio comparison between the actual and predicted boxes; however, for boxes of different sizes, the IoU is the same, but the degree of overlap is different; that is, the CIoU is not sensitive to scale. In Fig. 5, A represents the real box, B signifies the predicted box, C denotes the minimum enclosing box, and IoU represents the overlapping area of the real box and the prediction box and the area and proportion between them.
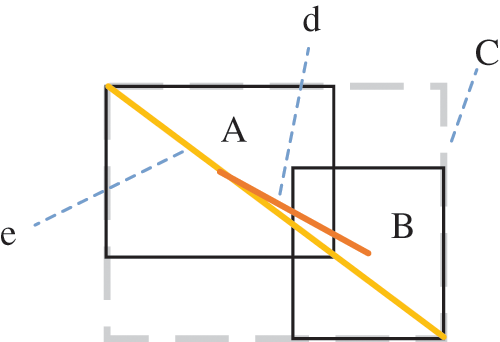
Figure 5: Actual box A coincides with predicted box B in our analysis
In this paper, GIoU is adopted as the positional loss function, replacing CIoU. The GIoU [18] is a target frame-matching metric commonly used in target detection. GIoU comprehensively considers the overlap degree, area difference, center of gravity distance, and other factors between two target frames and subtracts the proportion of the diagonal length spatial extent of the minimum convex polygon to the overlap spatial extent of the target frame. The offset and size difference between the target boxes are punished to more accurately measure the similarity between the two target boxes. Its calculation formula is as follows:
GIoU considers not solely the overlap between actual and predicted boxes but also non-overlapping regions; thus, the GIoU is more effective in representing the intersection degree between two regions than the original CIoU.
This study aims to the Focal Loss as the optimization function for both the confidence loss and category loss. Introduced by Lin et al. [19], the Focal loss acts as a primary loss function specifically designed to tackle the challenge of category disproportion in target detection by assigning higher weights to the cross-entropy loss. Through the adjustment of sample weights, emphasis is placed on difficult samples. Consequently, the model’s classification performance is enhanced, particularly for challenging samples.
Focal loss effectively mitigates the impact of easily classified samples by suppressing their weight while simultaneously increasing the weight of difficult samples. This strategic adjustment serves to heighten the model’s focus on challenging instances, ultimately improving its performance in scenarios characterized by category imbalance.
The focal loss formula can be represented as:
where
For binary classification problems,
where s represents the true label of the sample and
For multiple classification problems,
where the sample’s true class is represented by t and
2.2.4 Feature Extraction Operator Optimization
In the YOLOv5s model, traditional Conv is used for feature extraction, but traditional Conv requires a large number of multiplication and addition operations; in particular, when the convolutional filter and there is a considerable number of channels in the input feature map, the computational load increases exponentially, resulting in a slow calculation speed. In operation, a substantial amount of convolutional kernel parameters is required, especially when the convolution kernel size is large; more parameters are needed to capture more spatial information, resulting in an escalation of the model’s parameter count.
To address these issues, this paper introduced the distributed shift convolution DSConv method, which was proposed by Gennari et al. [20] of Oxford University in 2019, for extracting features within the YOLOv5s model. Leveraging the advantages of DSConv, which encompass:
1) It can replace traditional Conv well, and it can “plug and play” as an alternative.
2) The quantitative method significantly speeds up the network and minimizes memory usage.
The primary aim of DSConv is to emulate the convolution layer's behavior by employing quantization and distribution migration techniques, as shown in Fig. 6, which is the distributed shift convolution schematic. Initially, the input tensor transforms a mantissa tensor and an exponential tensor; then, the VQK tensor is a dot product of each piece of the mantissa tensor, and KDS is added to the exponential tensor value of the input convolution. Finally, the result obtained from KDS is a dot product with the result obtained from VQK to obtain the output of one of them.
Figure 6: Schematic of distributed shift convolution
Regarding the Variable Quantization Kernel (VQK), this tensor exclusively retains variable bit-length integer values and maintains the same size as the original convolution tensor (
Therefore, the original Conv can be equivalent to Fig. 7 below:
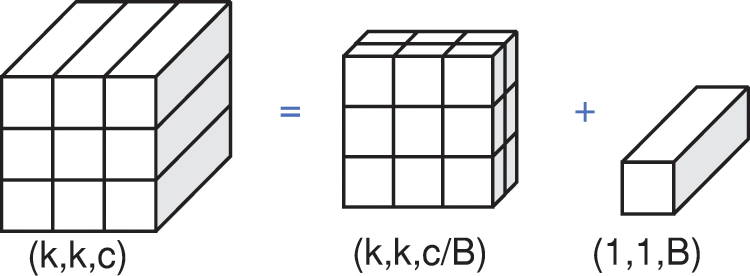
Figure 7: Original convolution Conv equivalent graph
Where k is the convolution kernel convolution kernel conv size, c denotes the channel count, and B signifies the number of channels within each block. Therefore, it can be seen from the figure that the formula for diminishing the convolutional parameter count in DSConv compared with traditional convolution Conv is shown in Eq. (8).
For example, when the convolution kernel k is 3 with a channel count of 128, it is subdivided into two coherent blocks., and the number of channels B in each block is 64. According to the calculation of Eq. (5), the number of convolution parameters of DSConv is only 7% of that of traditional Conv.
3 Experimental Data and Processing
The experimental data employed for training the network framework discussed in this study comes from the FLIR ADAS dataset collected and produced by the FLIR Company, Wilsonville, Oregon, USA. To fulfill deep learning’s demand for ample training samples and enhance model generalizability, this paper employs random scaling, flipping, brightness, contrast, and color adjustments, along with mosaic techniques to enhance the dataset through augmentation techniques. In order to enhance the variability of the datasets, and enhance model generalization, accuracy, and robustness.
To evaluate the effectiveness of the model in detecting pedestrians and vehicles in vehicle-mounted infrared images, this paper follows these steps:
(1) P represents the precision measure, which calculates the proportion of correctly recognized positive samples out of the total number of positive samples identified; The recall rate (R) is a measure that denotes the proportion of accurately identified positive samples to the overall number of truly positive samples within the dataset. The computation is presented in Eq. (9).
(2) AP represents the mean accuracy for each category, while mAP calculates the average of these mean values. The calculation is detailed in Eq. (10).
N indicates the number of detection target categories.
(3) Computation (GFLOPs): 1 billion floating-point operations per second, indicating the model’s complexity and influencing its detection speed.
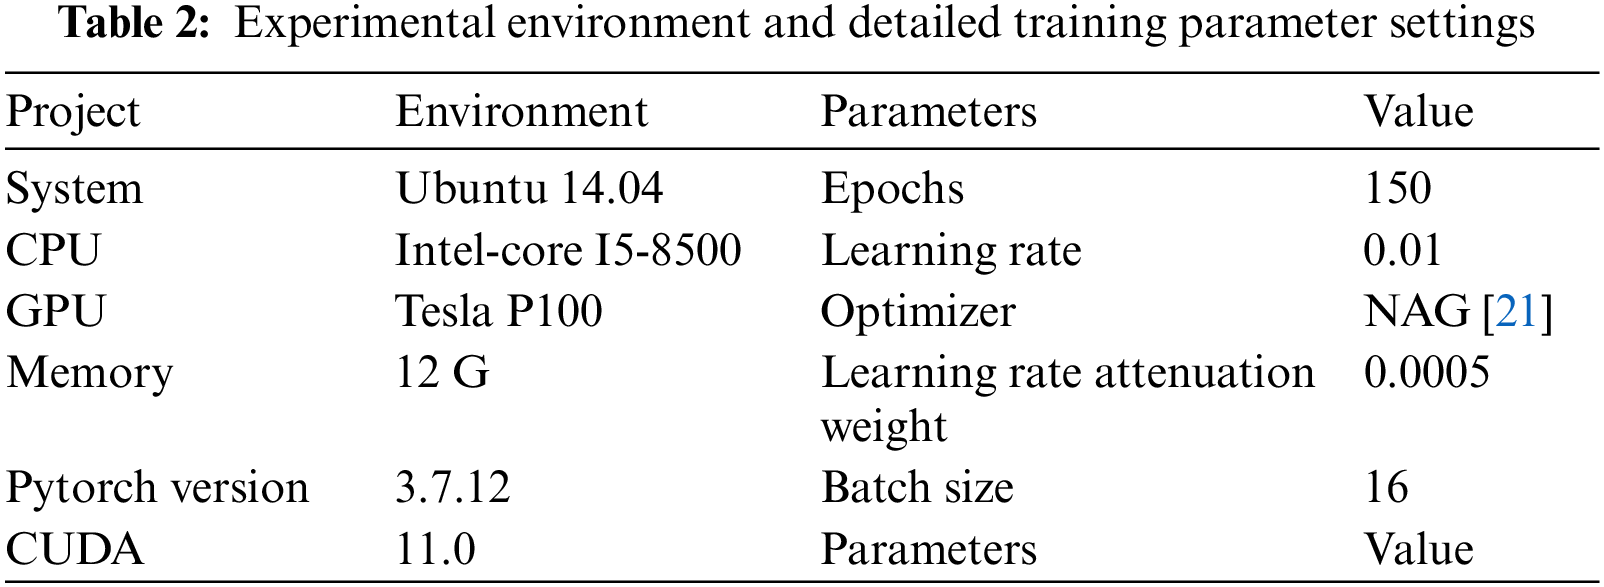
This paper outlines the experimental environment and specifies training parameters in Table 2.
The dataset for this experiment is sourced from FLIR Corporation’s FLIR ADAS dataset. The FLIR ADAS dataset uses video data from infrared cameras. This dataset contains images for training (5582 images) and validation (2418 images), covering two main categories: people (12161 samples) and cars (26511 samples). The dataset has the following characteristics: (1) The image background is complex and includes urban, rural, and highway data, and each scene has different road and weather conditions. (2) Infrared images can perceive heat that cannot be seen by the human eye; these images are presented as grayscale images or false color images, and their color information is relatively limited. (3) In urban scenes, pedestrians and vehicles are dense, there are more overlapping areas, and the targets are smaller.
Fig. 8 demonstrates the experiment’s robustness testing, involving comprehensive model performance evaluation through the introduction of Gaussian ambiguity, Gaussian noise, and Gaussian mass operations to the FLIR raw dataset. In the data preprocessing phase, a series of transformations are performed on the image of the FLIR original dataset, including Gaussian blur to simulate the blur effect of the image, incorporating Gaussian noise to emulate real-world image noise, and Gaussian quality manipulation to simulate changes in image quality. To verify the accuracy of the experiment on different datasets, we conducted an accuracy test and shifted the focus to the BDD100k and VisDrone datasets. By testing in this environment, which is different from previous datasets, we were able to more fully evaluate the model’s generalization performance and accuracy. This dataset has different scenarios, lighting conditions, and target categories than the original FLIR dataset, thus providing a more diverse set of test scenarios. We will ensure that the experimental setup is consistent with that of previous experiments on the FLIR raw dataset to maintain comparability of model performance.
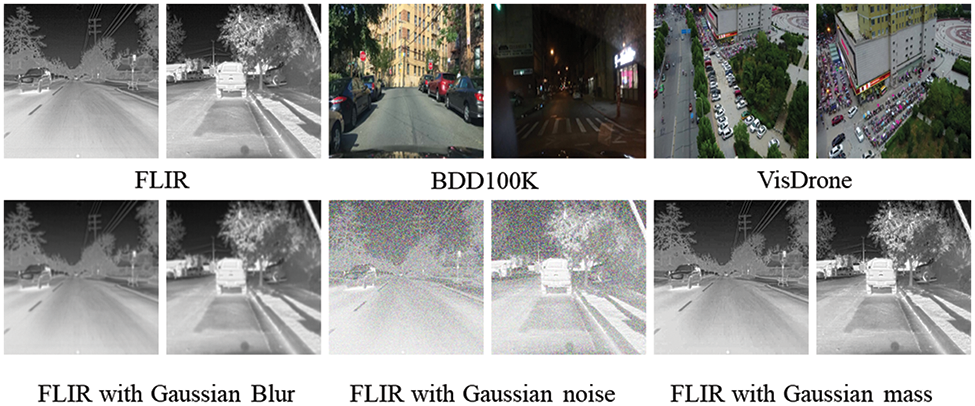
Figure 8: This experiment’s dataset and an example diagram of the comparison dataset are depicted
4 Experimental Results and Analysis
To confirm the efficacy of the proposed IR-YOLO model, experiments compare it with common target detection algorithms. To explore the contribution of each module to the whole algorithm, ablation experiments were carried out for small target detection head optimization, loss function optimization, and feature extraction operator optimization. The above experiments were conducted on the FLIR ADAS dataset for network model training. During the experiment, the experimental conditions, such as the control equipment, training hyperparameters, and number of iterations, were consistent.
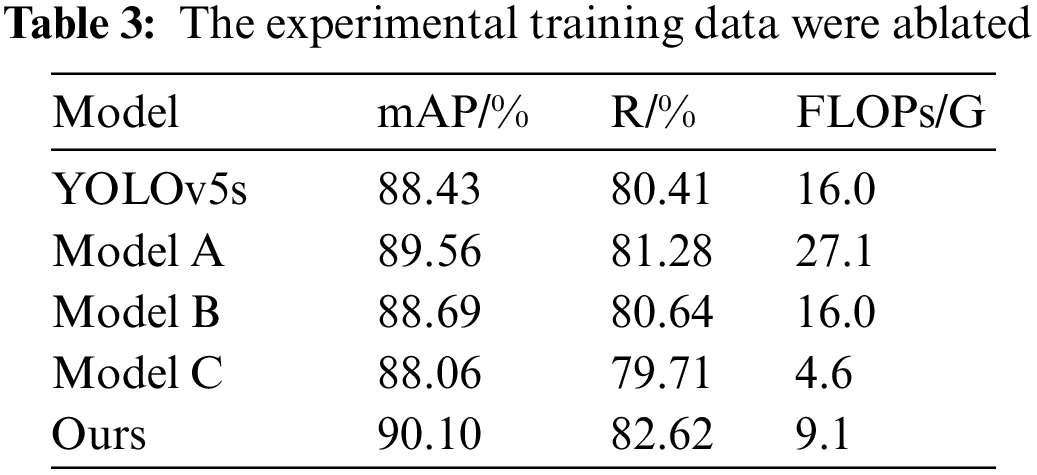
To verify the efficacy of the proposed enhancements in boosting the performance of the YOLOv5s model, a research study involving ablation was carried out. Model A: The basic YOLOv5s model is enhanced by incorporating a compact 160 × 160 target detection head; Model B: In the YOLOv5s base model, the Focal GIoU loss function replaces the CIoU loss function in this scenario; Model C: The traditional convolution Conv is replaced by the distributed shift convolution DSConv in the YOLOv5s basic model. Now, by adding different improvement strategies to the basic model of YOLOv5s, the detailed outcomes of the ablation experiment are presented in Table 3. As depicted in the table, with the addition of a compact target detection layer, the occurrence of undetected small targets is decreased, the model’s accuracy rate rises by 1.12%, with a corresponding increase of 0.83% in the recall rate. Small targets are often overlooked because of their small size, especially in traditional target detection models. Incorporating a specifically designed small target detection head allows the model to focus more on the features of small targets, thus reducing the missed detection rate. This ultimately leads to an improvement in the model’s precision and recall performance when detecting small targets. Substituting the CIoU loss function with the Focal GIoU results in a 0.26% increase in model accuracy and a 0.23% increase in recall rate. The CIoU loss function may be too sensitive to samples that are difficult to learn for target frame regression, while the Focal GIoU loss function can better address difficult cases and improve the model’s learning effect for key targets by introducing a focus mechanism. This helps improve the model’s accuracy and recall rates. By introducing the distribution-shifted convolution GSConv, the model’s computational cost is diminished to 28%, with a marginal sacrifice of only 0.37% in accuracy. Traditional convolution operations can be less effective when dealing with specific patterns and targets. The introduction of distributed migration convolutional DSConv can increase the sensitivity of the model to specific patterns, thus improving the model’s performance. Moreover, the introduction of DSConv reduces the computational cost and increases the model’s efficiency. In FLIR ADAS dataset experiments, our proposed algorithm achieves a 56.8% reduction in computational cost compared to the basic model, while enhancing accuracy by 1.67%.
Illustrated in Fig. 9, IR-YOLO outperformed the original YOLOv5s model on the native FLIR dataset, showcasing a 1.7% increase in accuracy mAP. This improvement is due to the combined effect of optimizing small targets, improving loss functions, and employing feature extraction operators. When processing images with Gaussian blur, IR-YOLO showed greater robustness than YOLOv5s, with the mAP improved by 2.6%. This shows that IR-YOLO, featuring a new small target detection head, excels in capturing blurred target contours for improved detection. Compared to YOLOv5s on images with Gaussian noise, IR-YOLO’s performance improved by 1.1% on maps. This shows that IR-YOLO’s target detection ability in noisy environments is more robust than that of other methods because of the special optimization for small targets and the refinement of the loss function. With the introduction of target mass changes, IR-YOLO improved the performance of the mAP by 1.8% relative to YOLOv5s, indicating that the model is more adaptable to different mass targets. This advantage is due to the optimization of the loss function, which enables IR-YOLO to better handle detection challenges caused by changes in the target mass. Together, these results highlight the robustness and performance benefits of IR-YOLO in multiple test scenarios.
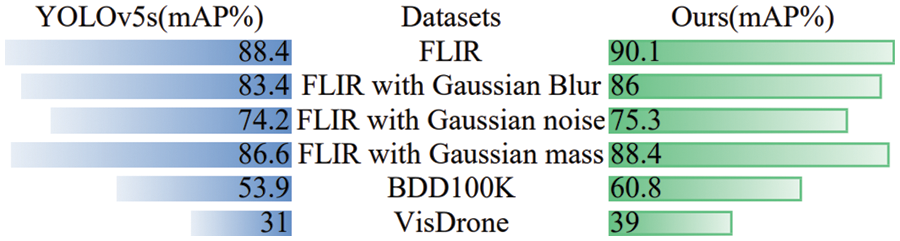
Figure 9: IR-YOLO and YOLOv5s robustness testing and different dataset testing
As shown in Fig. 9, on different datasets, the mAP comparison performances of YOLOv5s and the IR-YOLO model are shown. Compared with that of YOLOv5s on the BDD100K dataset, the IR-YOLO model achieved a significant 6.9% mAP improvement. By incorporating a dedicated small target detection head, the model can prioritize its attention on smaller targets, enhancing detection performance for this category. The focal loss function directs the model’s attention more towards challenging-to-classify samples, which may be more effective in complex scenarios in BDD100K. With large-scale images available in the BDD100K dataset, reduced computational effort can lead to performance improvements, and distributed shift convolution helps reduce the computational burden on the model without sacrificing detection accuracy as much as possible.” Compared with that of YOLOv5s, the mAP of our model on the VisDrone dataset increases by 8%. In drone images, the target size and visual complexity may vary greatly. The small target detection head introduced by Ours may be more sensitive for detecting small targets and adapting to changes in different scenes. Leveraging the Focal GIoU loss function may address issues related to target overlap and sample imbalance in the VisDrone dataset, and the use of the distributed shift convolution function DSConv may help to reduce the computational burden on the VisDrone dataset and improve the model’s adaptability to complex scenes.
4.1.1 Small Target Detection Head Optimization Verification Experiment
To comprehend the traits of sample targets in the FLIR ADAS dataset, Fig. 10 illustrates the distribution of the ratio within the dimensions of the targets. During the training phase, the majority of target width and height proportions concerning the image size are less than 0.4, with the aspect ratio being predominantly less than 0.1. A potential issue arises when utilizing only the three detection heads of the YOLOv5s model to detect distant pedestrians and vehicles. As the network depth increases, the features of smaller targets may become more challenging to extract or may even vanish. Additionally, information from shallow features might not be fully exploited, leading to reduced recognition accuracy or potential instances of missed detection.
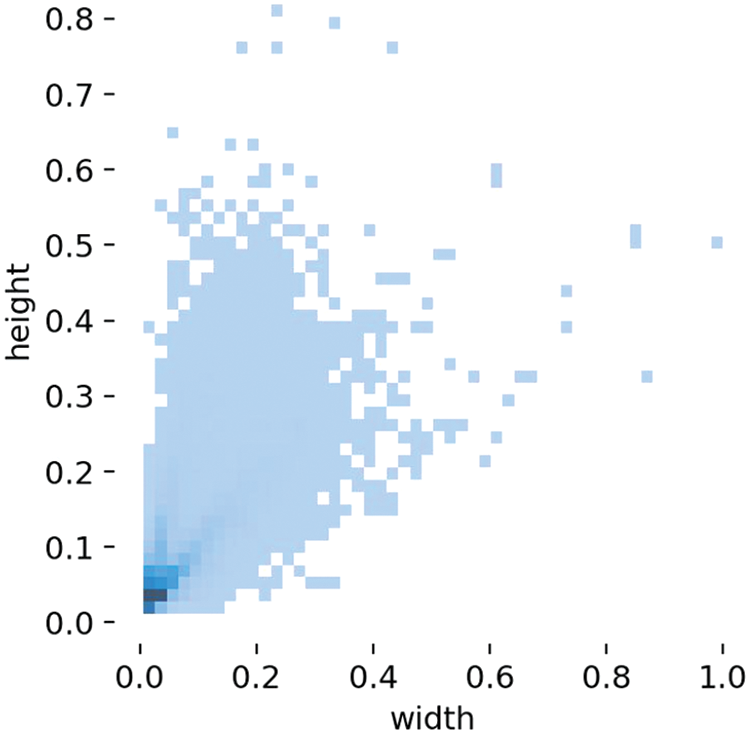
Figure 10: Dataset width–height ratio distribution
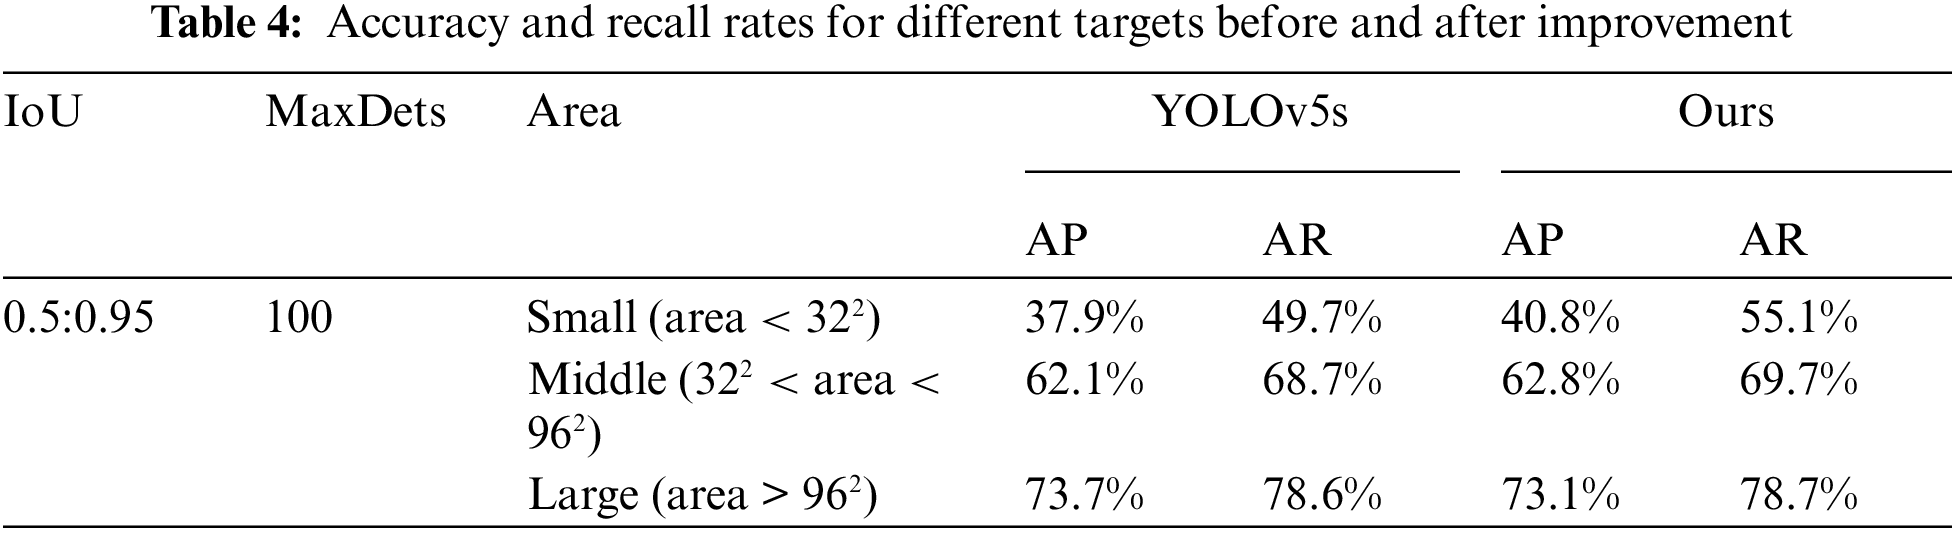
To achieve this, a smaller target detection layer with a scale of 160 * 160 is incorporated into the detection layer of YOLOv5s, and the IoU is set at 0.5 Within the interval of 0.9. Each image is limited to 100 prediction boxes, and the pixel area of (0, 322) is set as a small target, that of (322, 962) as a medium target, and that of (more than 962) as a large target. The objective is to validate the impact of the newly introduced small detection head on enhancing the model’s accuracy and dataset performance. Results before and after the enhancement are detailed in Table 4 for comparative analysis. The predicted value is denoted as AP, while the recall rate is represented by AR. After the improvement, the AP and AR of the small targets increased significantly, and compared with those of the small targets before the improvement, they increased by 2.9% and 5.4%, respectively. For medium and large targets, there is also a small increase. Experiments demonstrate that incorporating a smaller target detection head into YOLOv5s enhances the accuracy of detecting distant pedestrians and vehicles captured in thermal imagery during nighttime. The introduction of a small detection head serves to:
(1) Enhance the accuracy in detecting small targets. Small targets, typically challenging to detect in nighttime infrared images due to distance from the camera and limited light, benefit from this addition. The incorporation of a small target detection head directs the model’s focus toward learning small targets, resulting in a substantial improvement in the accuracy of detecting such targets.
(2) Impact on targets of medium and large sizes: Although the new small target detection head is mainly for small targets, the experimental results also show some small improvements in medium and large targets. This shows that the new design helps to improve target detection performance overall, not just for small targets.
4.1.2 Loss Function Optimization Verification Experiment
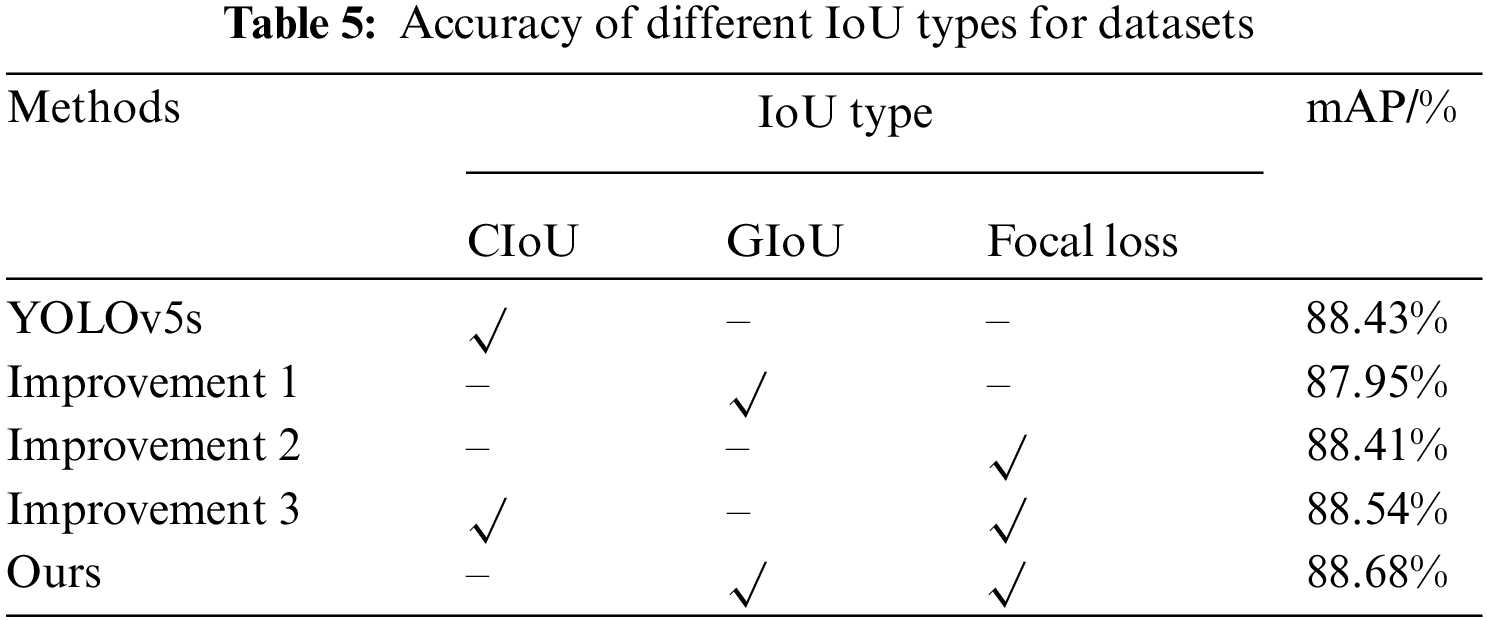
The YOLOv5s model was evaluated on the FLIR ADAS dataset, and comparative experiments were conducted. “√” indicates the use of the corresponding methods. Results are displayed in Table 5 for reference. Improvement 1: Implementation of GIoU loss function; Improvement 2: Integration of focal loss function; Improvement 3: Utilization of Focal CIoU loss function. Results from the experiments demonstrate that the mAP of Improvement 1 is 87.95%, which is slightly lower than the 88.43% mAP of YOLOv5s. This observation suggests that, in a specific scenario or data distribution, the GIoU loss function may not yield significant performance improvements compared to the CIoU loss function.; however, this does not necessarily mean that the GIoU has no advantages. The GIoU loss function is a measure of the matching degree of the target box; this function takes into account the shape difference and position change of the target box and is more robust in some cases. Can better adapt to changes in the target box, possibly depending on the specific dataset and task. The Focal Loss function addresses class imbalance by introducing a scaling factor, reducing the impact of easily classified samples and emphasizing challenging ones. The mAP of Improvement 2 was 88.41%, which was similar to that of YOLOv5. This indicates that there may be some class imbalance in infrared image target detection, but introducing the focal loss function successfully optimizes the model’s learning ability for challenging target classification. The Focal GIoU loss function merges features from both the loss functions, namely the GIoU loss and the focal loss. The GIoU loss function focuses on the shape and position of the target box, the Focal loss function effectively addresses the issue of class imbalance. By combining these two loss functions, the Focal GIoU loss functions effectively address the learning issue of difficulty classifying objects while balancing shape and position. For our improvement, compared with YOLOv5’s model using the Focal GIoU loss function, the overall performance improved to some extent.
4.1.3 Verification of the Distributed Shift Convolution DSConv
To evaluate the impact of distributed shift convolution (DSConv) on reducing model computations, the FLIR dataset was the subject of four conducted experiments.: Experiment 1: the DSConv module replaced the Conv module in YOLOv5s; Experiment 2: The YOLOv5s model now incorporates the DSC3 module in place of the C3 module.; Experiment 3: Only the Convolution module and C3 module located in the main layer were replaced; Experiment 4: Both the Conv module and C3 module within the feature fusion layer were replaced. The experimental results of the replacement strategies at different positions are shown in Fig. 11. DSConv lowers convolution operation complexity via distribution shift, which adopts the operation on a per-channel basis instead of a per-pixel basis. This characteristic enables the model to significantly reduce the computational burden when DSConv replaces traditional convolution operations, as shown in Experiments 1, 2, and 3. DSConv introduces the mechanism of distribution shift during the convolution operation, which is helpful for better information fusion. In Experiment 2, the DSC3 module replaces the C3 module, which may enhance the model’s capability to express the target through the information fusion mechanism of DSConv to maintain high detection performance. The distributed shift property of DSConv is friendly to residuals and helps to ensure better model stability during module replacement. In Experiment 3 and Experiment 4, the DSConv of the backbone layer and feature fusion layer were replaced, respectively, and experimental outcomes revealed that DSConv could maintain the model performance in different module applications. The final improved model achieves a significant reduction in computational effort, while the mAP is slightly sacrificed relative to the benchmark model. This shows that by globally replacing the DSConv module and the DSC3 module, the computational burden can be significantly reduced while maintaining high detection performance.
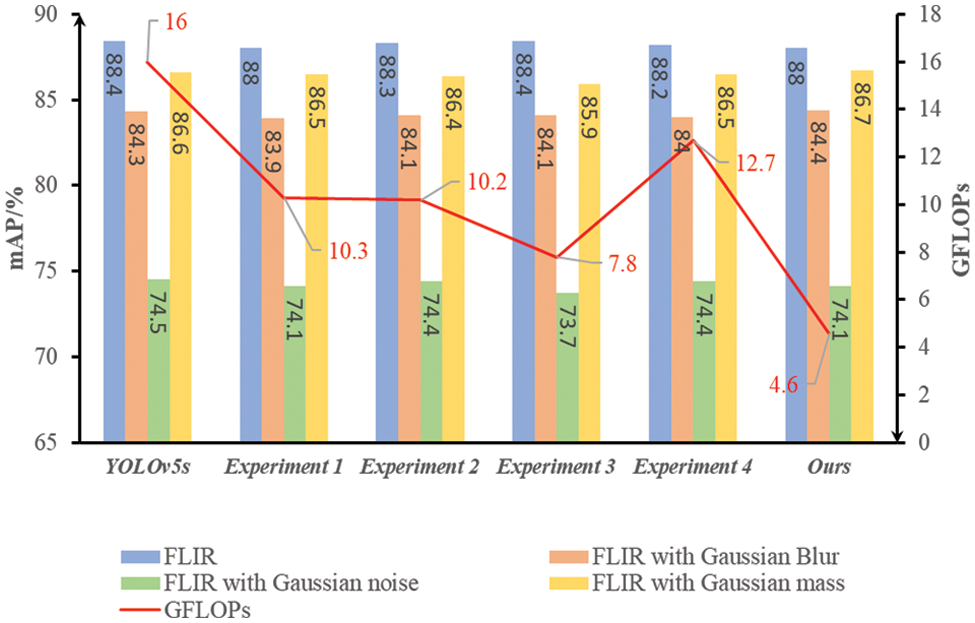
Figure 11: Different position replacement strategies used for the DSConv and DSC3 modules
4.2 Performance Comparison with Mainstream Network Models
Once the structure of the enhanced network is established, to demonstrate the efficacy of the enhanced algorithm put forward in this study, thorough experiments were performed on the FLIR ADAS dataset (Epoch = 150), current mainstream target detection models were selected from the same dataset for comparison experiments. The target detection algorithms for comparison include YOLOv3 [22], YOLOv6 [23], YOLOv7 [24], and YOLOv8. Table 6 displays the comprehensive results of the conducted experiments in great detail. (1) In terms of performance, YOLOv8l leads in 91.1% of the maps, while IR-YOLO also performs well in 90.1% of the maps. IR-YOLO has a slightly lower mAP than YOLOv8l does, but it has a large advantage in terms of computational resources and parameter count. (2) In terms of computing resource efficiency, IR-YOLO has relatively few GFLOPs and few parameters—9.1 and 7.3 M, respectively. This makes IR-YOLO more efficient in terms of computing resources, and YOLOv5n and YOLOv5s are also relatively small in terms of their GFLOPs and reference counts; however, IR-YOLO performs better on maps than on other methods. (3) Compared with the number of model parameters, IR-YOLO has a relatively small number of parameters, which is suitable for resource-constrained environments and boosts the efficiency of model training and inference. YOLOv3-tiny and YOLO7-tiny also have a small number of parameters, but their mAPs are lower, indicating that IR-YOLO has obvious advantages when it comes to performance.
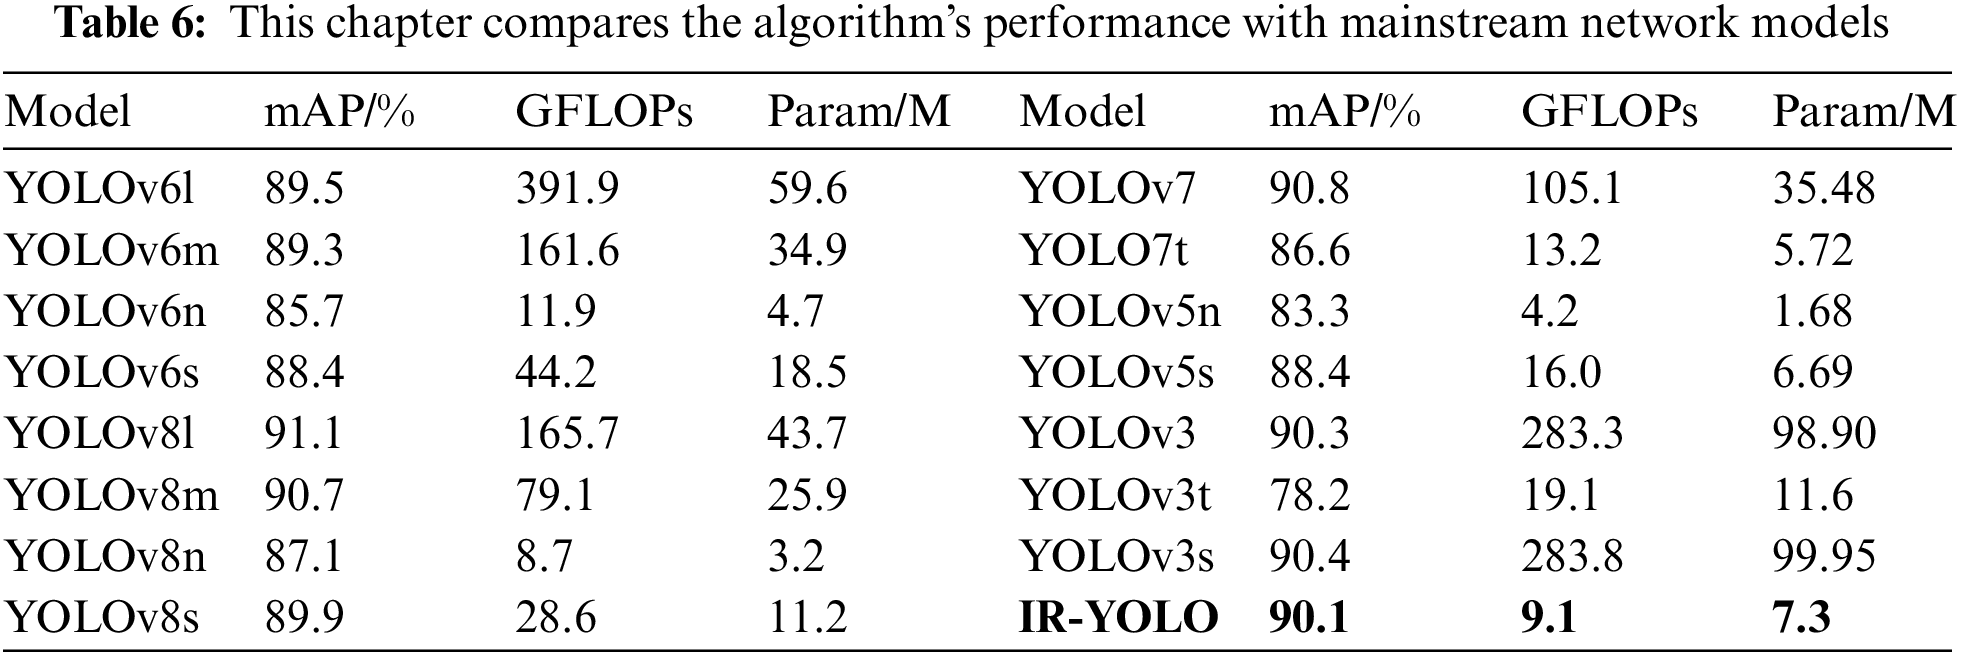
Overall, the exceptional performance of IR-YOLO can primarily be attributed to the subsequent stages: (1) IR-YOLO introduces a head specially used for small target identification, and refining the small target detection head improves the model’s ability to extract fine target features in infrared images, thus enhancing the accuracy in detecting small targets; (2) IR-YOLO uses the Focal GIoU to address the problems of target overlap and sample imbalance in infrared images. (3) The distributed shift convolution DSConv is introduced to substitute the traditional convolution (Conv) to lower the model’s complexity of computations. The use of DSConv helps to minimize the computational load while sustaining this detection accuracy to the maximum extent, enhancing the applicability of IR-YOLO for effective real-time detection in environments with limited resources. Therefore, IR-YOLO combines a high mAP with a low computational overhead and parameter count, making IR-YOLO a strong choice for deployment in resource-constrained environments, especially where high-performance detection is needed.
4.3 Test of the Effect on the Experimental Picture
To confirm the actual detection performance of the proposed algorithm., the weight file after training is called for testing, and the location of the detected object is marked. As shown in Fig. 12a, when the target is small and overlapping, the original YOLOv5s model is prone to missing detections, while the IR-YOLO model is better at handling such cases. As shown in Figs. 12b and 12d, when there is little difference between the background and foreground, the deeper the network depth is, the more likely the feature information is to be lost, and missing detection is likely to occur. The IR-YOLO model makes full use of shallow information to solve this problem. As depicted in Fig. 12c, IR-YOLO has greater confidence than the target before the improvement, which can effectively avoid the case of false detection.
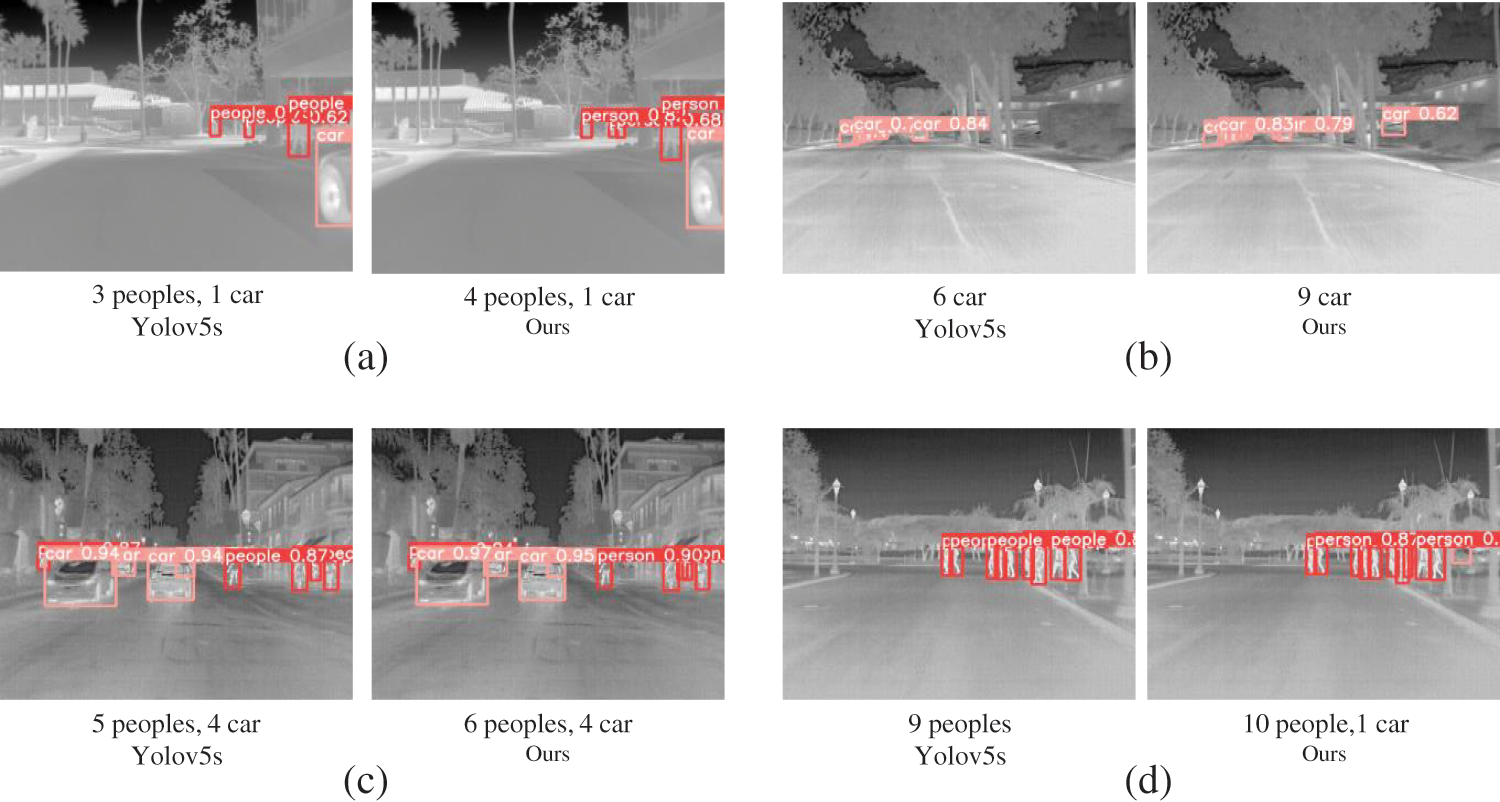
Figure 12: Comparison of actual test performance before and after improvement
The YOLOv5s model has been enhanced to tackle the challenges associated with reduced precision and a large number of calculations in the current infrared image pedestrian-vehicle detection algorithm. Results demonstrate that adding a small target detection head improves accuracy and recall for small targets. To tackle the problem of sample imbalance, the loss function was enhanced by integrating the Focal GIoU function and target overlap and increasing the convergence speed. Using distributed shift convolution DSConv to replace traditional Conv reduces the computational burden and improves the efficiency of infrared pedestrian and vehicle detection. Compared to the basic YOLOv5s model, the performance is improved, the IR-YOLO model’s average accuracy reached 90.1%, and the recall rate reached 82.6%. When comparing the basic YOLOv5s model, the accuracy and recall rate saw a 1.67% increase, and there was a 2.2% rise in the rate of recall. The calculation time was only 9.1 G, and the average processing time for a single image was just 8.3 ms, which realized infrared image pedestrian-vehicle detection with high accuracy, high speed, and low cost. This study concentrated on detecting pedestrians and vehicles in infrared images during driving. The next phase will involve extending the target detection to other road scenes.
Acknowledgement: The authors of this article would like to thank the following people for their important contributions to the article: Thanks to the tutors for their selfless support and professional guidance during the whole research process, which provided a solid academic foundation for the completion of this paper. Thanks to the school for providing us with the experimental platform and financial support. Special thanks to the editorial team for their hard work and professional guidance to make the article more rigorous and smooth in structure and language.
Funding Statement: The authors received no specific funding for this study.
Author Contributions: All the authors of this article have made important contributions to the manuscript. Below is a brief description of each author’s specific work and contributions: Xiao Luo: Conceptualization, Methodology, Writing-Original Draft, Validation. Hao Zhu: Software, Visualization, Investigation. Zhenli Zhang: Writing-Review & Editing, Supervision.
Availability of Data and Materials: Not applicable.
Conflicts of Interest: The authors declare that they have no conflicts of interest to report regarding the present study.
References
1. M. Alshraideh, B. A. Mahafzah, S. Al-Sharaeh, and M. Z. Hawamden, “A robotic intelligent wheelchair system based on obstacle avoidance and navigation functions,” J. Exp. Theor. Artif. Intell., vol. 27, no. 4, pp. 471–482, 2015. doi: 10.1080/0952813X.2014.971441. [Google Scholar] [CrossRef]
2. Z. Chen, J. Yang, L. Chen, and H. Jiao, “Garbage classification system based on improved ShuffleNet v2,” Resources, Conserv. Recycl., vol. 178, pp. 106090, 2022. doi: 10.1016/j.resconrec.2021.106090. [Google Scholar] [CrossRef]
3. Z. Chen et al., “Fast vehicle detection algorithm in traffic scene based on improved SSD,” Meas., vol. 201, pp. 111655, 2022. doi: 10.1016/j.measurement.2022.111655. [Google Scholar] [CrossRef]
4. Y. H. Li, S. S. Huang, C. H. Lu, and F. C. Chang, “Weighted HOG for thermal pedestrian detection,” in 2018 IEEE Int. Conf. Consum. Electron.-Taiwan (ICCE-TW), Taichung, Taiwan, IEEE, 2018, pp. 1–2. [Google Scholar]
5. S. Xi, W. Li, J Xie, and F. Mo, “Feature point matching between infrared image and visible light image based on SIFT and ORB operators,” Infrared Technol., vol. 42, no. 2, pp. 168–175, 2020. doi: 10.3724/SP.J.7100931203. [Google Scholar] [CrossRef]
6. T. Xue, Z. Zhang, W. Ma, Y. Li, A. Yang and T. Ji, “Nighttime pedestrian and vehicle detection based on a fast saliency and multifeature fusion algorithm for infrared images,” IEEE Trans. Intell. Transp. Syst., vol. 23, no. 9, pp. 16741–16751, 2022. doi: 10.1109/TITS.2022.3193086. [Google Scholar] [CrossRef]
7. L. Zheng and C. Song, “Fast near-duplicate image detection in riemannian space by a novel hashing scheme,” Comput. Mat. Contin., vol. 56, no. 3, pp. 529–539, 2018. doi: 10.3970/cmc.2018.03780. [Google Scholar] [CrossRef]
8. Z. Chen, J. Yang, and C. Yang, “BrightsightNet: A lightweight progressive low-light image enhancement network and its application in rainbow maglev train,” J. King Saud Univ.-Comput. Inf. Sci., vol. 35, no. 10, pp. 101814, 2023. doi: 10.1016/j.jksuci.2023.101814. [Google Scholar] [CrossRef]
9. X. H. Nan and L. Ding, “A review of typical target detection algorithms for deep learning,” Comput. Appl. Res., vol. 37, no. S2, pp. 15–21, 2020. doi: 10.54097/fcis.v4i3.10736. [Google Scholar] [CrossRef]
10. C. Geng., P. D. Song, and L. Cao, “Research progress of YOLO algorithm in target detection,” J. Arms Equip., vol. 43, no. 9, pp. 162–173, 2022. doi: 10.54254/2755-2721/6/20230833. [Google Scholar] [CrossRef]
11. P. Qing, C. M. Tang, and Y. F. Liu, “Infrared target detection method based on improved YOLOv3,” Comput. Eng., vol. 48, no. 3, pp. 211–219, 2022. doi: 10.19678/j.issn.1000-3428.0060518. [Google Scholar] [CrossRef]
12. W. Li, “Infrared image pedestrian detection via YOLO-V3,” in 2021 IEEE 5th Adv. Inf. Technol., Electron. Autom. Control Conf. (IAEAC), IEEE, vol. 5, 2021, pp. 1052–1055. [Google Scholar]
13. J. Tao, J. Shi, Y. Chen, and J. Wang, “Improved YOLOv4 infrared image pedestrian detection algorithm,” in Int. Conf. Machine Learn. Intell. Commun., Cham: Springer International Publishing, 2021, pp. 226–233. [Google Scholar]
14. P. Jiang, D. Ergu, F. Liu, and B. Ma, “A review of Yolo algorithm developments,” Procedia Comput. Sci., vol. 199, pp. 1066–1073, 2022. [Google Scholar]
15. C. Y. Wang, H. Y. Mark Liao, Y. H. Wu, P. Y. Chen, J. W. Hsieh and I. H. Yeh, “CSPNet: A new backbone that can enhance learning capability of CNN,” in 2020 IEEE/CVF Conf. Comput. Vis. Pattern Recognit. Workshops (CVPRW), Seattle, WA, USA, IEEE, 2020. [Google Scholar]
16. H. Li, P. Xiong, J. An, and L. Wang, “Pyramid attention network for semantic segmentation,” arXiv preprint arXiv:1805.10180, 2018. [Google Scholar]
17. A. Neubeck, and L. Gool, “Efficient non-maximum suppression,” in Int. Conf. Pattern Recognit., IEEE Computer Society, 2006. [Google Scholar]
18. H. Rezatofighi, N. Tsoi, J. Gwak, A. Sadeghian, I. Reid, and S. Savarese, “Generalized intersection over union: A metric and a loss for bounding box regression,” in 2019 IEEE/CVF Conf. Comput. Vis. Pattern Recognit. (CVPR), Long Beach, CA, USA, IEEE, 2019. [Google Scholar]
19. T. Y. Lin, P. Goyal, R. Girshick, K. He, and P. Dollar, “Focal loss for dense object detection,” IEEE Trans. Pattern Anal. Machine Intell., no. 99, pp. 2999–3007, 2017. doi: 10.1109/TPAMI.2018.2858826. [Google Scholar] [PubMed] [CrossRef]
20. M. Gennari, R. Fawcett, and V. A. Prisacariu, “DSConv: Efficient convolution operator,” arXiv preprint arXiv:1901.01928, 2019. [Google Scholar]
21. K. R. Mopuri, U. Ojha, U. Garg, and R. V. Babu, “NAG: Network for adversary generation,” in 2018 IEEE/CVF Conf. Comput. Vis. Pattern Recognit., Salt Lake City, UT, USA, IEEE, 2018. [Google Scholar]
22. J. Redmon, and A. Farhadi, “Yolov3: An incremental improvement,” arXiv preprint arXiv:1804.02767, 2018. [Google Scholar]
23. C. Li et al., “YOLOv6: A single-stage object detection framework for industrial applications,” arXiv preprint arXiv:2209.02976, 2022. [Google Scholar]
24. C. Y. Wang, A. Bochkovskiy, and H. Y. M. Liao, “YOLOv7: Trainable bag-of-freebies sets new state-of-the-art for real-time object detectors,” in Proc. IEEE/CVF Conf. Comput. Vis. Pattern Recognit., 2023, pp. 7464–7475. [Google Scholar]
Cite This Article
 Copyright © 2024 The Author(s). Published by Tech Science Press.
This work is licensed under a Creative Commons Attribution 4.0 International License , which permits unrestricted use, distribution, and reproduction in any medium, provided the original work is properly cited.
 Downloads
 Citation Tools