
 Submit a Paper
 Propose a Special lssue
 Open Access
REVIEW
A Systematic Literature Review of Machine Learning and Deep Learning Approaches for Spectral Image Classification in Agricultural Applications Using Aerial Photography
1 College of Computing and Information Sciences, Karachi Institute of Economics and Technology, Karachi, 75190, Pakistan
2 Faculty of Computing and Informatics (FCI), Multimedia University, Cyberjaya, 63100, Malaysia
3 Faculty of Computing, Riphah International University, Islamabad, 46000, Pakistan
4 Faculty of Engineering and Information Technology, School of Computer Science, University of Technology Sydney, Sydney, Australia
* Corresponding Authors: Muhammad Naveed. Email: ; Mazliham Mohd Su’ud. Email:
(This article belongs to the Special Issue: Machine Vision Detection and Intelligent Recognition)
Computers, Materials & Continua 2024, 78(3), 2967-3000. https://doi.org/10.32604/cmc.2024.045101
Received 17 August 2023; Accepted 10 November 2023; Issue published 26 March 2024
 View Full Text
 Download PDF
Abstract
Recently, there has been a notable surge of interest in scientific research regarding spectral images. The potential of these images to revolutionize the digital photography industry, like aerial photography through Unmanned Aerial Vehicles (UAVs), has captured considerable attention. One encouraging aspect is their combination with machine learning and deep learning algorithms, which have demonstrated remarkable outcomes in image classification. As a result of this powerful amalgamation, the adoption of spectral images has experienced exponential growth across various domains, with agriculture being one of the prominent beneficiaries. This paper presents an extensive survey encompassing multispectral and hyperspectral images, focusing on their applications for classification challenges in diverse agricultural areas, including plants, grains, fruits, and vegetables. By meticulously examining primary studies, we delve into the specific agricultural domains where multispectral and hyperspectral images have found practical use. Additionally, our attention is directed towards utilizing machine learning techniques for effectively classifying hyperspectral images within the agricultural context. The findings of our investigation reveal that deep learning and support vector machines have emerged as widely employed methods for hyperspectral image classification in agriculture. Nevertheless, we also shed light on the various issues and limitations of working with spectral images. This comprehensive analysis aims to provide valuable insights into the current state of spectral imaging in agriculture and its potential for future advancements.Keywords
An image constitutes an array of pixels originating from diverse sources, such as standard specialized cameras or mobile phones. The significance of imaging extends across various domains, particularly in detection and recognition tasks. Image processing techniques are the initial step for computational methods by extracting valuable information from the provided image. By utilizing this extracted information, computers can attain heightened intelligence in tackling real-world and intricate challenges [1]. One of the limitations commonly found in traditional image processing techniques is the inability to acquire spatial and spectral information for various objects [2]. Spectroscopy investigates the behavior of light within an object, enabling the identification of materials through their distinct spectral signatures.
Nevertheless, traditional imaging methods face limitations in covering a large volume since they cannot extract spectral information from such images. As a result, there is an ongoing demand for novel technologies and sensors to facilitate the automatic detection and recognition of diverse objects [3]. Over the past two decades, notable progress has been made in the application and enhancement of image sensors and imaging techniques, with particular emphasis on the fields of agriculture and food [4]. Technological advancements have enabled researchers to classify food products based on color, quality, size, and weight [1]. An interesting feature of spectral cameras is that they are capable of seeing more than “just” colors. They capture the image within the selective wavelength ranges through the electromagnetic spectrum.
Furthermore, they can also measure light in a small number of spectral bands and a large number of spectral bands, typically between three and several hundred. The separation of wavelengths can be done by filters or using instruments that measure specific wavelengths, including light from different frequencies above or below the visible light range, such as infrared. Some cameras can capture hundreds of spectral bands, and this phenomenon is known as hyper-spectral imaging [5,6].
The human eye can perceive electromagnetic waves with wavelengths ranging from 380 to 780 nanometers in the visible spectrum. Any electromagnetic waves with wavelengths beyond this range, such as infrared, remain invisible to humans [7,8]. Therefore, spectral imaging enables acquiring additional information that surpasses the human eye’s capabilities. There are three feasible methods for collecting spectral image information: (i) A camera with optical elements, (ii) A continuous filter like the filter wheel, and (iii) A complementary metal oxide (CMOS) sensor with a filter. The spectrum essentially characterizes the amount of light in each wavelength, providing valuable insights into the emission, transmission, or reflection of light from an object. Over the past two decades, various image-sensing technologies have emerged, with hyperspectral and multispectral imaging being two highly effective methods [9,10]. The primary distinction between hyperspectral and multispectral imaging is the number of distinct wavebands they capture. Multispectral imaging typically involves fewer than 15 bands, while hyperspectral imaging can encompass hundreds of bands. Additionally, hyperspectral imaging offers a complete spectrum for each pixel, whereas multispectral imaging provides only isolated data points [11–15]. Spectral cameras with optical elements consist of a prism, a sensor, gratings, and lenses. The light enters the camera through a slit. The prism and gratings refract the light. The line scan sensor can then generate a multispectral image, line by line. The filter wheel must be moved to the desired filter. This results in a reduced scanning speed, so UAVs are not usable for moving targets. Moreover, there are also CMOS sensors with band filters integrated into the sensor’s layout. Compared with the other scanning types, cameras with spectral filters on CMOS sensors have no optical parts that require alignment. They can capture objects with different wavelengths in one single shot. A snapshot spectral camera captures multiple ultra-violet, visible, and infrared images. Each image with a multispectral camera is passed through a filter to keep light to a specific wavelength or colour. Spectral imaging can extract features for additional information that the human eye cannot recognize with its receptors for RGB. Spectral images are one of the most critical images attained by remote sensing. Remote sensing radiometers categorized the spectrum into various bands. Recent research trends with the help of Multispectral Images are in the fields of Printed Circuit Board (PCB), counterfeit detection on banknotes [12–14], skin characterization in dermatology [15], food inspection in the agriculture sector, etc. [16–20]. The existing systematic literature review on multispectral and hyperspectral imagery provides the details related to the specific domain. A review is done by Recetin et al. [21] on anomaly detection-related studies using remote sensing applications with the help of hyperspectral while Aloupogianni et al. [22] focused on the main area of tumor diseases using both images, hyper and multispectral imagery. The health sector is again the point of attention by Ortega et al. [23], where digital and computation pathology and hyper and multispectral imagery are reviewed. The spectral resolution can be increased with the help of a new pan-sharpening technique for multispectral images. Different pan-sharpening techniques are reviewed for multispectral images in [20]. The comparison of SVM and convolutional neural networks is studied by Kaul et al. [24]. They also reviewed the most popular dataset for the same type of problems. Datta et al. [25], discussed the challenges and future scope using hyperspectral along with the benefits of using machine learning and deep learning. Deep learning using hyperspectral is studied by Ozdemir et al. [26] with future directions. This study offers a wealth of detailed information, encompassing comprehensive answers to all the research questions. For a summarized overview of the relevant systematic literature review, please refer to Table 1.

The research questions formulated for this study are structured to comprehensively address all inquiries about multispectral and hyperspectral images and their applications in the agriculture industry. Moreover, the study concentrates on elucidating the methodologies and various techniques employed to address agricultural challenges effectively through the utilization of hyperspectral or multispectral images. The addressed research questions (RQ) for this study are:
RQ1. In what diverse research areas within agriculture have Multispectral or Hyperspectral images found applications?
RQ2. Which Machine Learning and Deep Learning Techniques have been employed to tackle agricultural problems using Multispectral and Hyperspectral images?
RQ3. What are the prevalent datasets extensively utilized for spectral classification purposes?
RQ4. What are the challenges, limitations, and potential future developments concerning Hyperspectral and Multispectral images in conjunction with Deep Learning and Machine Learning Models?
The systematic literature review methodology was selected to categorize studies that explore the convergence of spectral images and agriculture fields. This study comprehensively classifies the research questions concerning multispectral and hyperspectral images. The exponential advancement of spectral images has significantly enhanced the accuracy of classification problems. The primary goal of this paper is to review the wide-ranging applications of spectral images and the frequently employed techniques alongside them. Additionally, we focus on the commonly used datasets in spectral applications, their limitations, and potential areas for future research.
The paper is structured as follows: Section 2 delves into the background of Multispectral imaging, Hyperspectral imaging, Machine Learning, and Deep Learning. In Section 3, we explain the materials and methods used for the systematic literature review. In Section 4, we present the results, offering comprehensive and in-depth answers to all the research questions posed, and Section 5 presents the challenges and future directions of our study. Finally, in Section 6, we conclude the paper by summarizing our findings and suggesting potential areas for future research.
Multispectral imaging is a new and emerging area with diverse application domains such as agriculture, health and sciences, geo monitoring, and environmental changes. Recent research trends indicate that the synergy of multispectral images with other fields has generally proven effective in urban and regional planning [27]. This section discusses some of the recent research around multispectral images. One crucial problem is soil analysis, particularly soil salinization, where soil degradation is a prime issue. Hu et al. [6] attempted to solve this problem with an unmanned aerial vehicle (UAV) borne multispectral imager. Remote sensing is very useful for collecting data for agriculture applications. Zheng et al. [3] used different modeling algorithms, including parametric and non-parametric algorithms, for estimating leaf nitrogen content (LNC) in winter wheat. This was done with the help of multispectral images using UAVs. With the help of classification algorithms, including linear regression (LR), random forests (RF), and support vector machine (SVM) alongside UAV multispectral images, the prediction of canopy nitrogen weight in Corn was discussed by Lee et al. [28]. They reported that RF and SVM are better than LR for the problem. In weed monitoring, the main issue is determining weed amount and location. For this problem, three methods are proposed by Osorio et al. [29] using deep learning and multispectral images with the comparison of visual estimations from the experts. The proposed methods are SVM, You Only Look Once Version 3 (YOLOV3), and Region-based convolutional neural network (R-CNN). The F1 scores were 88%, 94%, and 94%, respectively. Another area where multispectral images are used is related to oil pollution, a severe environmental issue. Ozigis et al. [30] worked on detecting oil pollution and its impact on biological elements. They used multispectral and multi-frequency images, fuzzy logic, and RF methods. An overall accuracy of 75% for dense areas of vegetation was obtained. Furthermore, the Cropland and grassland areas had an accuracy of 59.4% and 65% respectively. Lima et al. [31] developed a system for early-stage supervision of the status of organic fertilization on tomato plants. The proposed system was developed using a multispectral camera with five lenses including green, red, red edge, near-infrared, and RGB alongside with computation image processing mechanism. One of the successful mechanisms of monitoring the characteristics of vegetation by exploiting the Normalized Difference Vegetation Index (NDVI). With the help of multispectral images, Cao et al. [32] identified that using wide-dynamic-range vegetation index (WDRVI) derived from UAV multispectral image monitoring of sugar beet growth indicator is very useful as sugar beet has very large ground biomass.
Monitoring several crops (cultivated areas) is very challenging since identifying different tops is very costly. Sicre et al. [33] attempted to find different ways to use satellite images (both optical and radar) to classify the land covers. Their suggested method was dependent on the wavelength and penetration depth of the signal providing the images. Lei Ma et al. [23] reviewed the land cover object-based classification in different research publications. The findings indicate that remote sensing-based imagery was the dataset most frequently used.
UAV can monitor leaf area index (LAI). Qi et al. [34] proposed new ways to find the high-precision LAI prediction system with the help of multispectral images. Multispectral images are also useful in classifying potato defects [35–37]. In addition, detecting bruises on apples is also a very challenging classification task when using multispectral images. Additionally, classifying bruises is very important when discussing the automatic apple classification system. With the help of principal component analysis (PCA), hyperspectral imaging and multispectral imaging systems for selective bands were developed by Huang et al. [16], which achieved 90% accuracy. Powdery mildew (PM) is a fungal disease that can cause powdery growth on the surface of plants, leaves, and fruits. Early detection of powdery mildew is very crucial. Chandel et al. [17] studied using multispectral images for PM detection and mapping, achieving 77% accuracy. Bhargava et al. proposed a binary classifier [18] for sorting mono and bi-color apples. They achieved different accuracy on different datasets using multispectral imaging. Feng et al. showed the results in [19] that indicate that fruit recognition using multispectral images can be very effective. The current state of the art and new applications of remote sensing in agriculture were discussed by Khanal et al. [38]. Applications related to plant disease detection, yield estimation, water stress monitoring, etc., were discussed.
The hyperspectral image consists of several bands that have unique classifications. Each segment of the pixel can be treated as a unique label that identifies a specific target class. After image acquisition, a hypercube is formed, which contains information regarding both spectral and spatial data. As the hypercube has three dimensions, the image’s resolution helps in two dimensions, while several bands assist in-depth, which is the 3rd dimension. Ranjan et al. [39] used principal component analysis (PCA) for feature extraction for hyperspectral image classification, and with the help of K-means clustering, they formed different clusters. After that, all clusters were trained using SVM. The accuracy of this approach was recorded to be 90%, 77%, and 88% for three different types of classes. They concluded that accuracy was better when data was initially divided into different groups before classification. Research on crop height for maize biomass by Zhang [40] used UAV hyperspectral imagery. Prediction of Aboveground biomass (ABG) using stepwise regression and XGBoost regression model with the highest accuracy of R-Squared (R2) of 0.81 and Root Mean Square Error (RMSE) of 0.27 was obtained, showing that hyperspectral imagery can play a vital role in the estimation of maize aboveground biomass with better accuracy. Rubio-Delgado et al. [41] proved that hyperspectral images effectively estimate the determination coefficient between spectral data and leaf nitrogen content. They used a full spectrum range for vegetation indices (VI) and Partial Least Square Regression (PSLR) models and achieved a large R2 value. Results can be improved by using temporal information on leaf nitrogen content. Messina et al. provided a comprehensive research summary of remote sensing’s contribution to the growth of olive farm management in the last two decades [42].
Yao et al. provided a complete review of remote sensing applications using UAVs [43]. Selected applications were from precision agriculture and vegetation, urban environment and management, and disaster hazards and rescue. The advantages and selected areas were also highlighted in the conclusion. Gautam et al. studied the water status of horticultural crops using different remote sensing applications [44]. Remote measurements of water status, such as soil moisture, canopy 3D structure, etc., remote sensing is the best tool for planning and managing different applications for larger areas. Yang et al. [45] found that airborne hyperspectral imagery is used in mapping cotton yield. With stepwise regression’s help, 61% and 69% variability for two yield fields were observed. They concluded that due to narrow bands, hyperspectral imagery is much better than multispectral imagery, which uses broad bands. Zhang et al. [46] used hyperspectral images to observe water quality and proposed that a deep learning model could monitor water quality concentration. Mean absolute percentage error (MAPE) was 8.78% and 12.36%, and R2 was 0.81 to 0.93. They suggested using cloud stations for a reduction in time and costs. Coverage using UAVs can also be much broader so that more data can be collected quickly. It is very important to use an optical sensor to detect crop stress, which can specifically find spectral wavelength affected by stress factors. It is also essential to consider which spectral resolution is required to prevent it. Mewes et al. [47] discovered that the problem is reducing the spectral resolution and spectrum angle mapper. The proposed method for this problem was SVM. The results show that only a few hyperspectral bands are enough to detect fungal infection in wheat. In contrast, the authors also suggested using the derived result for feature selection in agriculture. Cen et al. [48] examined the internal defects of pickling cucumbers using hyperspectral images. The performance measure was minimum redundancy–maximum relevance (MRMR) with 95% and 94% accuracy on two different conveyor belt speeds. They primarily worked on identifying several optimal wavebands for PCA for fast and efficient algorithms and light sources. Further study can be done in discrimination between slightly and severely defective labels.
Machine Learning is a branch of Artificial Intelligence that deals with problems related to prediction and classification. The phrase ‘learning’ relates to the amount of data given to an algorithm, and more data would mean more learning. For any task (T), if the algorithm’s performance (P) increases with respect to experience (E), then the algorithm is said to be a machine learning algorithm. Machine Learning is fundamentally classified into three types: (1) Supervised Learning, (2) Unsupervised Learning, and (3) Reinforcement Learning. In supervised learning, the model is trained with labelled data and predicts the labels from new data. In supervised learning, learning is done from a dataset, making predictions iteratively, and with each iteration, the parameters of the algorithms are adjusted accordingly. Supervised learning includes LR, Logistic Regression, Nearest Neighbors, Decision Tree, RF, SVM, etc. In unsupervised learning, the model is trained with unlabeled data and groups the data based on feature similarity. Unsupervised learning tries to find the patterns in the dataset without any pre-existing target labels. It helps in finding insights into data. Sometimes, unsupervised learning performs complex tasks better than supervised learning. Clustering, association, and dimensional reduction are the main approaches that use unsupervised learning [49]. In reinforcement learning, the algorithm performs actions that maximize performance in particular conditions. Fig. 1 shows the three types of machine learning and their differences.

Figure 1: An overview of types of machine learning algorithms
Fig. 2 explains the overall flow of a machine-learning algorithm. In the first phase, the training phase, the data or training examples go to the feature extractor for feature extraction.

Figure 2: An overview of machine learning model flow
After getting features from training examples, the model for machine learning is trained; once the training model is ready for the prediction, the system takes a new test example and classifies/predicts the output.
Deep learning is a subset of machine learning inspired by the human brain, consisting of billions of neurons. Deep learning uses Artificial Neural Network algorithms. The word deep refers to the number of layers in a network. If the number of layers is unknown, the system automatically adjusts the weights using an optimization function. The layer consists of several neurons. Since it mimics the human brain, deep learning also requires much data for better accuracy [50]. Although deep learning evolved from machine learning, the two have some differences. The main difference is that deep learning requires large amounts of data, and features are not extracted before applying the deep learning model. Deep learning can automatically extract the features that further process the data for classification. The concept of deep learning is illustrated in Fig. 3 for further clarification.

Figure 3: Deep learning model flow showing feature extraction and model prediction
A systematic literature review (SLR) was carried out according to the approach suggested by Kitchenham [51]. We performed the following steps to get the answers to our research questions: (1) Search, (2) Exclusion and Inclusion Criteria, (3) Publisher Selection, (4) Study Selection, and (5) Search Strategy.
The databases used in the search were Springer, Science Direct, IEEE Xplore, and ACM. The timeline for the manuscripts was between 2017 and 2022 because of the most recent publication in multispectral and hyperspectral images. We have used four search strings for the survey.
Search String 1. (Multispectral Images) AND (Agriculture) AND (Deep Learning)
Search String 2. (Multispectral Images) AND (Agriculture) AND (Machine Learning)
Search String 3. (Hyperspectral Images) AND (Agriculture) AND (Deep Learning)
Search String 4. (Hyperspectral Images) AND (Agriculture) AND (Machine Learning)
3.2 Exclusion and Inclusion Criteria
The exclusion and inclusion criteria were straightforward. We selected the research from 2017 onwards and did not include any articles before 2017 in our primary studies. The reason for selecting the last five years is to provide the recent developments in hyperspectral and multispectral images. All the selected articles are peer-reviewed, and all articles are searched using the mentioned string. All articles were written in English, and articles in other languages that appeared during the search were not considered. Fig. 4 depicts the inclusion and exclusion criteria.

Figure 4: Exclusion and inclusion criteria for the selection of primary studies
We search the articles from the following databases: SPRINGER, SCIENCEDIRECT, IEEE XPLORE, and ACM. Surprisingly, we did not find papers in IEEE Xplore despite trying the search with each of the four strings. Fig. 5 shows the well-known publishers from where articles are selected.

Figure 5: Selected databases for this research
Fig. 6 shows the initial frequency comparison of all the research articles from selective publishers. We found that Google scholars have comparatively large numbers of papers compared to other databases.

Figure 6: Search string result comparison
The search strategy involved an automated search, as depicted in Fig. 7. The automated search proved instrumental in locating and providing us with 30,100 research articles for the study, out of which 27,900 papers were obtained from Google Scholar. Consequently, we excluded the articles sourced from Google Scholar to avoid redundancy.

Figure 7: Preferred reporting items for systematic reviews and meta-analysis (PRISMA)
Following the exclusion process, we extracted 2,200 articles for this study. Subsequently, we applied inclusion and exclusion criteria based on titles, abstracts, year of publication, and keywords, resulting in 185 articles remaining after the screening process. In the next phase, we applied the selection criteria to the full-text studies, and we were left with 44 primary studies. Our selection criteria aim to include multispectral or hyperspectral images or images with deep learning or machine learning in agriculture.
Fig. 8 shows the distribution of selected/primary studies for selected years after applying all the mentioned criteria and selection mechanisms.

Figure 8: Articles year-wise number count
This section provides a concise and precise description of the experimental results, their interpretation, and the experimental conclusions that can be drawn. The distribution of all the number of primary studies is given in Table 2. We can see that in 2020, the number of articles increased comparatively compared to others. The overall number of articles was found to be 44. We have presented the analysis of results corresponding to the research questions outlined in the Introduction section at the beginning of this paper. In Fig. 9, we have provided a detailed analysis of the articles, including their respective publishers, to enhance clarity and understanding. Additionally, we present a comparison of yearly articles based on publishers.
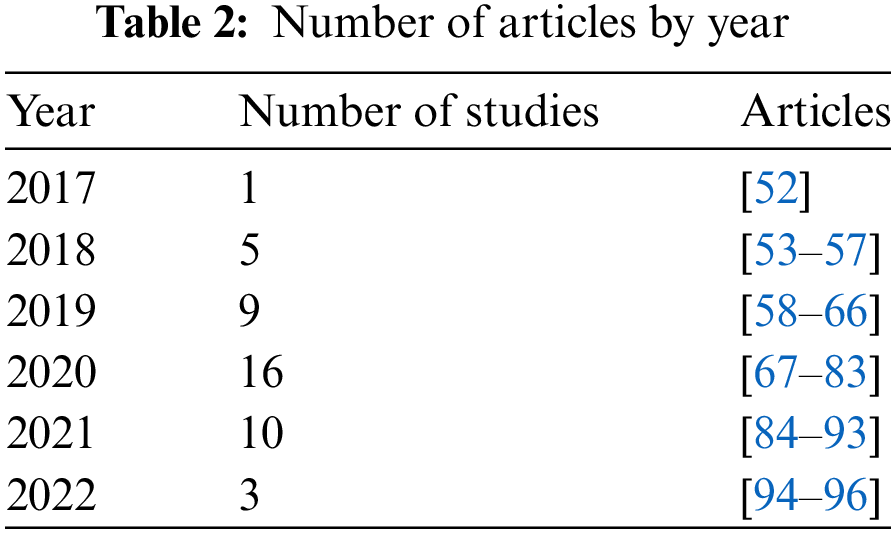
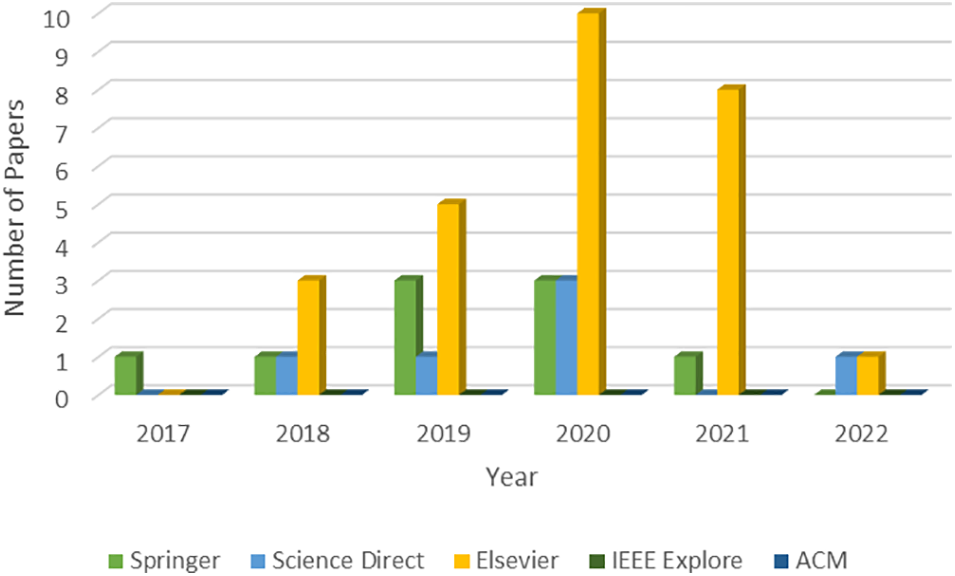
Figure 9: Yearly distribution of articles categorized by publishers
4.1 Analytical Findings Corresponding to RQ1
RQ1. In what diverse research areas within agriculture have Multispectral or Hyperspectral images found applications?
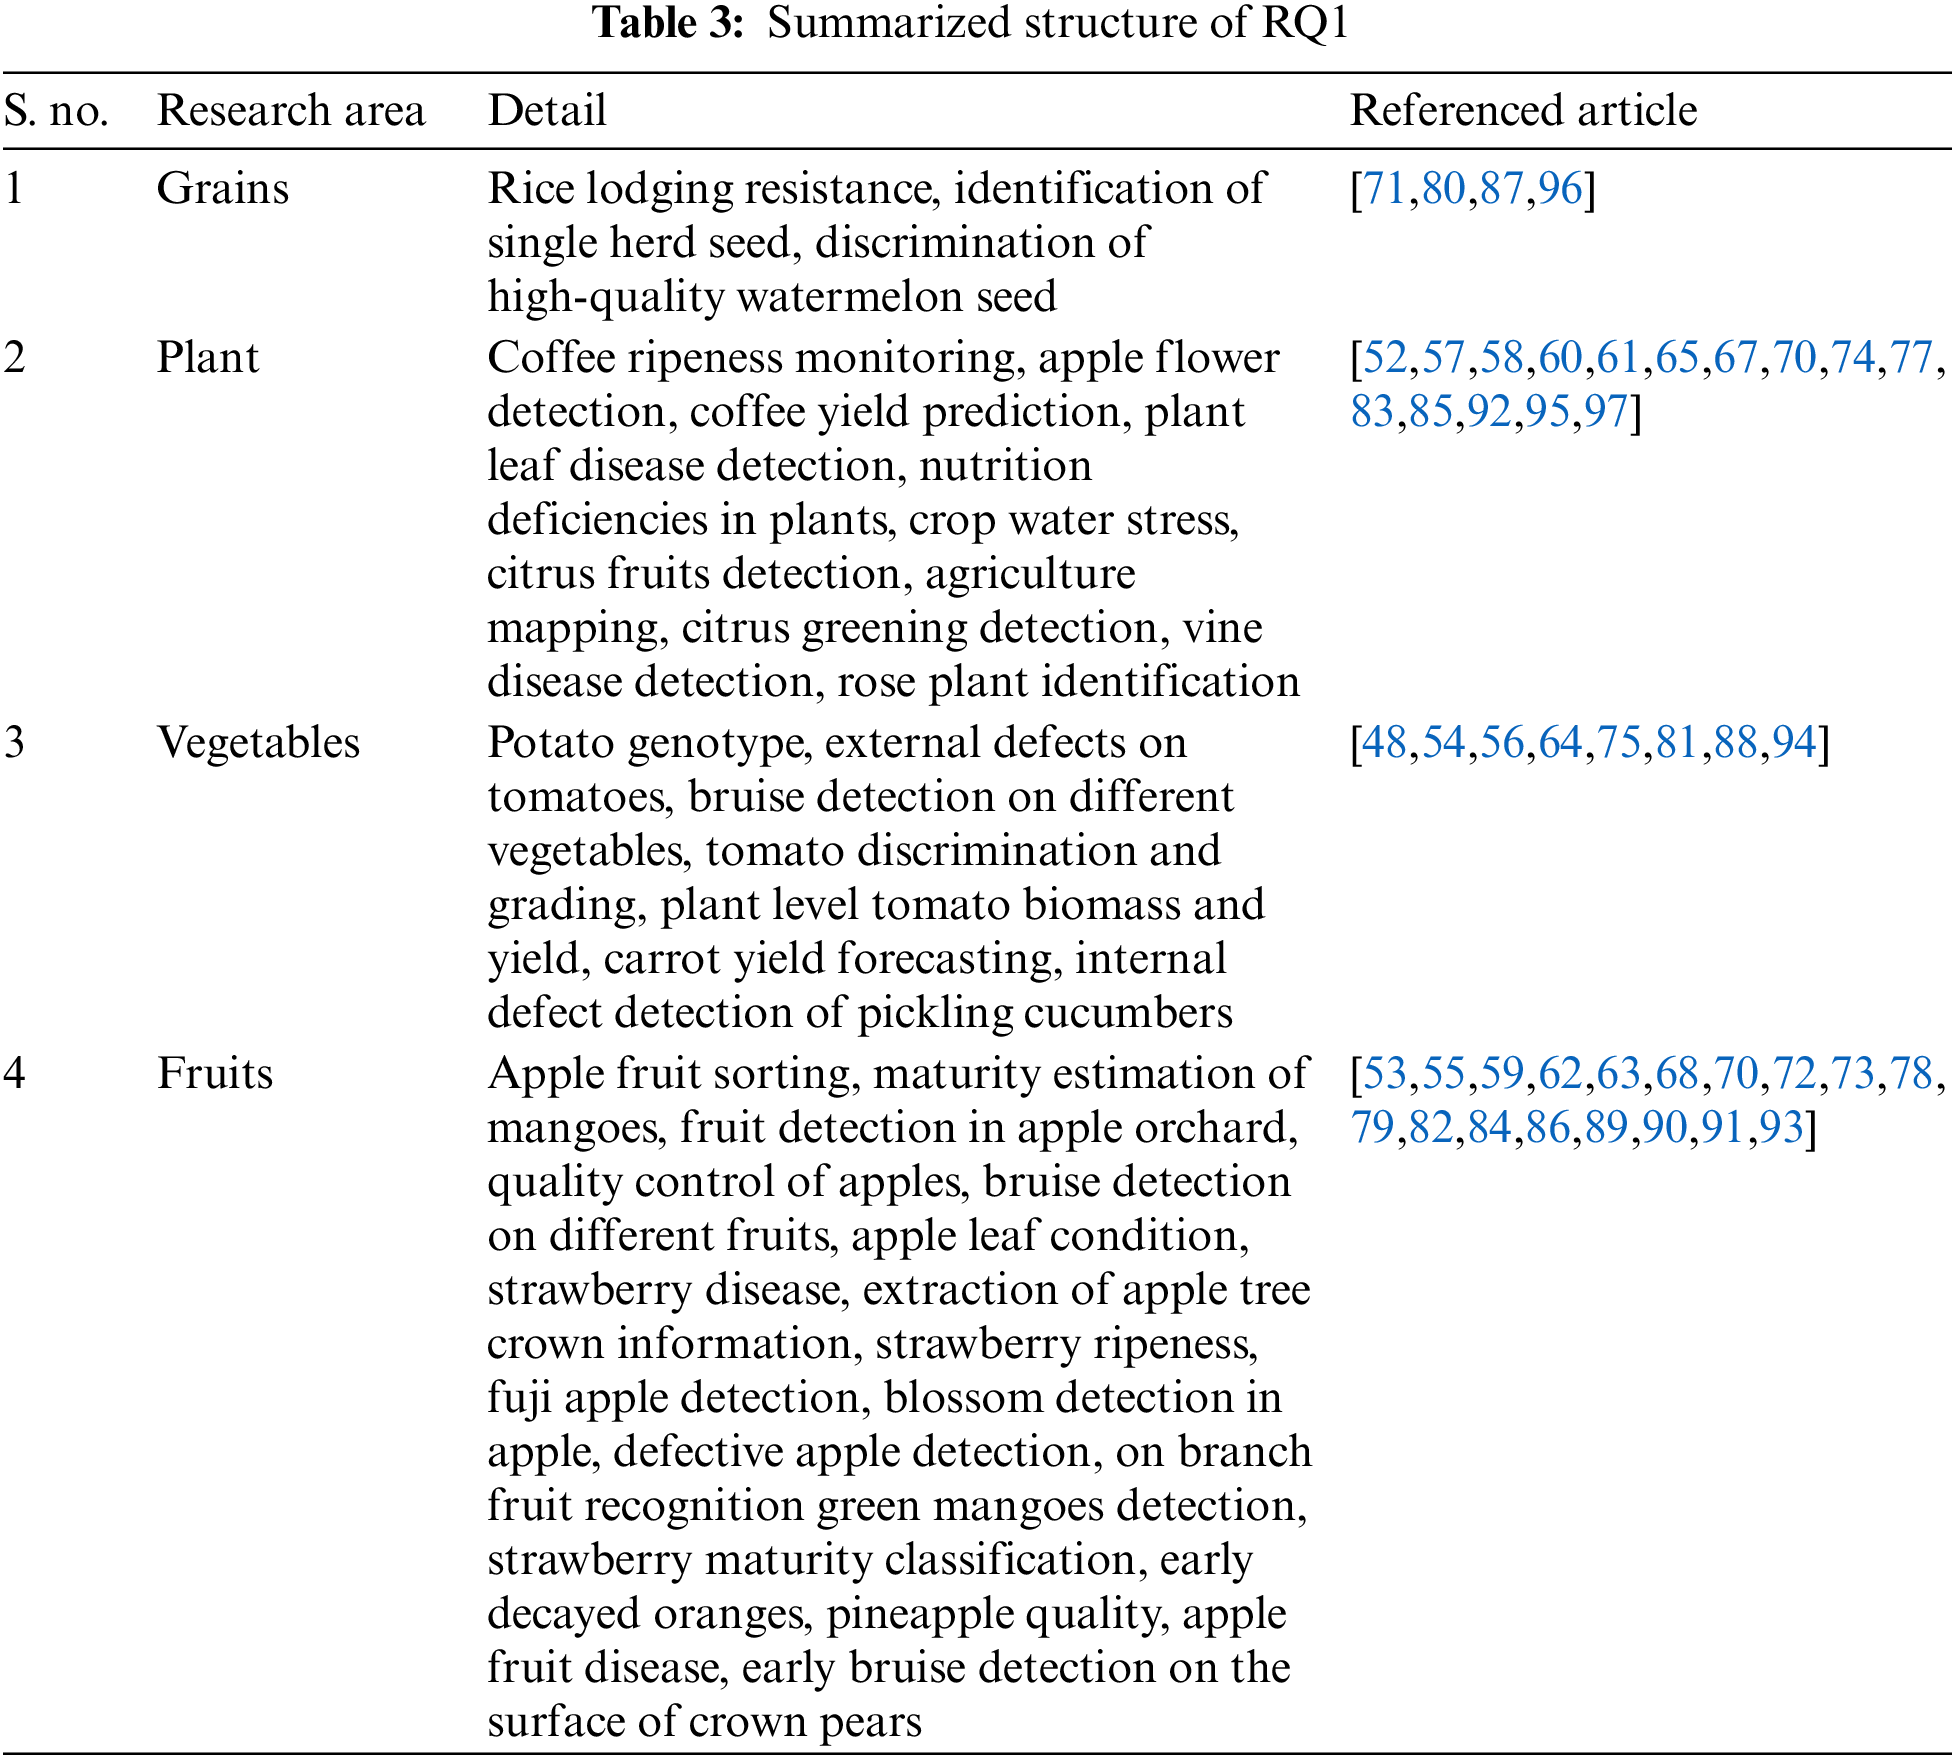
The selection of primary studies focused on hyperspectral and multispectral applications in agriculture. To address our first research question (RQ1), we categorized all relevant agricultural works into four main classes: grains, fruits, vegetables, and plant issues. The distribution of these classes is illustrated in Fig. 10 using a Pie chart, revealing that 43% of the selected studies were related to fruits.

Figure 10: Classification of studies for major agriculture classes
These classes encompass a range of diverse subclasses. Under the grains class, we included research studies on rice and various types of seeds. In the plant class, we focused on issues such as citrus greening detection, coffee ripeness, and yield monitoring, identification of apple and rose flowers, detection of different leaf diseases and deficiencies, crop water detection, mapping of agriculture, and vine disease detection. The summarized structure is presented in Table 3. The vegetable class comprised primary studies on defect detection and grading of potatoes and tomatoes and yield forecasting of carrots and cucumbers. However, our primary emphasis was on fruits, which involved the detection and grading of apples, estimation of mangoes’ maturity, identification of strawberry diseases and ripeness, early detection of decayed oranges, assessment of pineapple quality, and detection of pears crown bruises, along with bruise detection of various fruits and recognition of on-branch fruits.
4.2 Analytical Findings Corresponding to RQ2
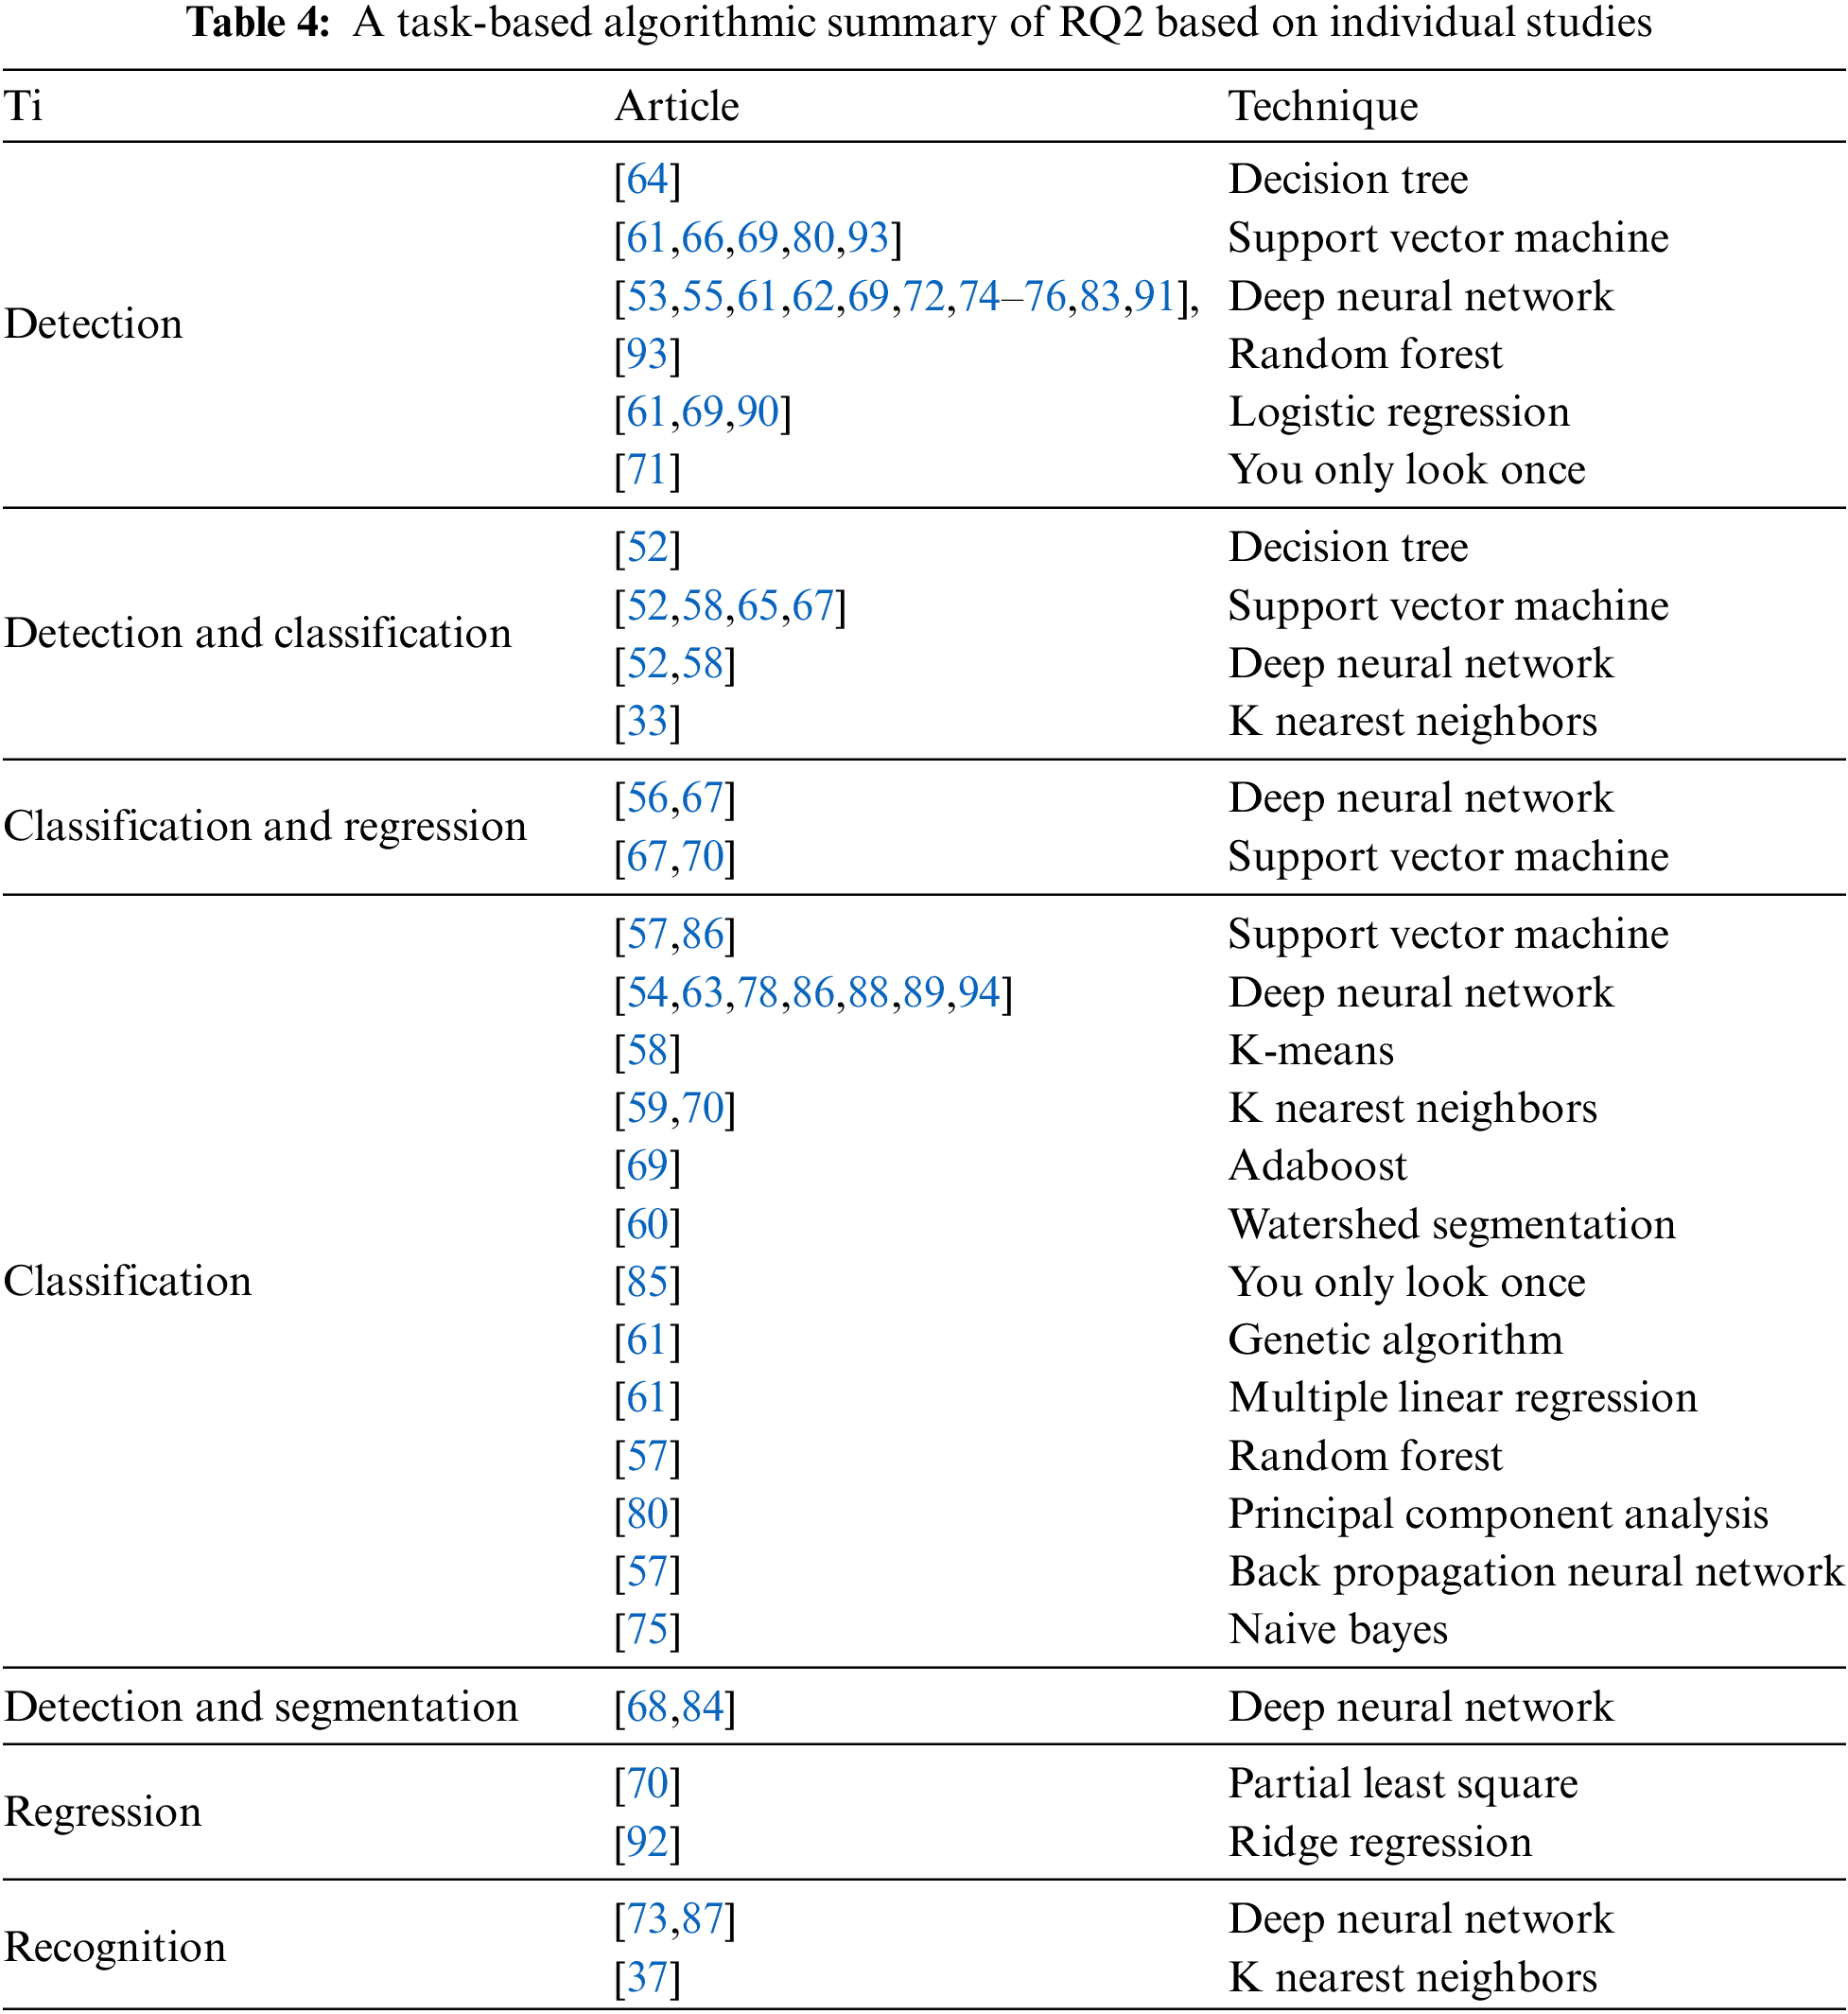
RQ2.Which Machine Learning and Deep Learning Techniques have been employed to tackle agricultural problems using Multispectral and Hyperspectral images? To address RQ2, we thoroughly examined all the selected articles, which involved 17 distinct algorithms. Notably, the most frequently employed techniques were from deep learning, utilized in 27 instances, followed by SVM, used 13 times.
Fig. 11 illustrates all the machine learning and deep learning techniques employed with multispectral and hyperspectral images. Certain techniques were applied to address specific agricultural problems, and researchers recommended their continued use for similar challenges due to algorithmic and data limitations. We have categorized these techniques into five groups: Deep Learning techniques, SVM, K Nearest Neighbors, and Logistic Regression, and the remaining methods were grouped under “Other.” Fig. 12 illustrates the occurrence frequency of each technique in our selected studies. Additionally, Table 4 provides a study-wise classification of Machine and Deep Learning algorithms.

Figure 11: An overview and classification of machine and deep learning techniques

Figure 12: Machine learning and deep learning techniques for RQ2
Deep Learning, particularly Convolutional Neural Networks, has shown remarkable performance in various spectral classification problems [53,55,61,62]. Studies suggested that Convolutional Neural Networks are very well-suited for spectral image classification because they can automatically learn discriminative features directly from the input data without the need for explicit feature engineering [74–76,83,88–92]. They can capture complex patterns and relationships in spectral images, leading to accurate classification results. Deep Learning models can handle large amounts of data and effectively learn from diverse spectral bands, making them suitable for hyperspectral and multispectral image analysis [52,58].
Conversely, in chosen studies, SVMs are extensively employed owing to their capacity to manage high-dimensional feature spaces and effectively handle nonlinear data [57]. SVMs seek to find the optimal hyperplane that maximally separates different classes in the feature space [69,70]. They can handle the curse of dimensionality by utilizing the kernel trick, which implicitly maps the input data to a higher-dimensional feature space, allowing for better separation of classes. SVMs have a strong theoretical foundation, work well with small to medium-sized datasets, and have been successfully applied to spectral image classification tasks [93]. Deep Learning was the most preferred choice of researchers when working with multispectral and hyperspectral images in the agriculture domain.
Regarding different types of tasks, classification is the most widespread problem while working with spectral images. We find that there are several reasons for the popularity. One of the primary objectives in agricultural applications is to identify and classify different plants, diseases, or crops. Classification provides specific interpretable results so agriculture experts can easily understand and treat them accordingly. While regression techniques can be used for crop yield estimation, classification can be a precursor to yield prediction. Identification of weeds and their management are essential parts of agriculture. Weed detection can reduce its competition with crops. Thus, different classification models on spectral images can be trained to assess the health of crops. The health of crops can include stress signs, different deficiencies, or any disease that can affect crop growth. We have already stated that SVMs and deep learning models have proven more effective while working in spectral image analysis in the agriculture sector.
4.3 Analytical Findings Corresponding to RQ3
RQ3: What are the prevalent datasets extensively utilized for spectral classification purposes?
Since multispectral and hyperspectral imagery is an emerging field, many datasets can be found in the literature. Here are some of the most extensively utilized datasets. The Xuzhou dataset was collected in 2014 at the Xuzhou peri-urban site. This dataset consists of 500 × 260 pixels with 9 available classes. The Salinas dataset is a widely used benchmark dataset for hyperspectral image analysis. It represents an agricultural area in Salinas Valley, California, and contains hyperspectral imagery acquired by an airborne sensor. The dataset consists of 512 × 217 pixels with 224 spectral bands of 16 classes. The Pavia Centre imagery dataset is collected at the University of Pavia, Italy, using a reflective optics system imaging spectrometer (ROSIS). Nine distinct land cover classes are accessible, with a spatial resolution of 1096 × 1096. The Pavia University dataset was also captured in the University of Pavia in 2001, having a spatial resolution of 610 × 640 and a total of 9 classes of urban environmental construction. Houston dataset consists of 380–1050 nm spectral wavelength with 48 bands. This data was provided by the IEEE GRSS data fusion contest and captured by the University of National Center of Airborne Laser mapping on the premises of the University of Houston. The Kennedy Space Centre dataset was collected in 1996 at Kennedy Space Center, Florida. In Table 5, we have compiled a summary of the dataset, including the number of available classes, spectral size, and spatial size.
This data is collected with the help of JPL’s Airborne imaging spectrometer, which has 13 classes and a spatial resolution of 512 × 614. The Hekla dataset has a spatial resolution of 2084 × 614 and a spectral size of 157. There are t22 classes available in this dataset. The Trento dataset was collected with the help of the AISA eagle sensor. The total number of classes is six, and the spatial resolution is 600 × 166. Botswana data was collected using a Hyperion sensor over the Okavango Delta in Botswana, South Africa, in 2001. This consists of 14 land cover labels with a spatial resolution of 1476 × 256. Indian Pines dataset was obtained by AVIRIS sensor in northwest Indiana, United States of America. This dataset has 16 labels of land covers and 220 spectral bands in the range of 0.2 to 2.4 µm, having a spatial resolution of 145 × 145 pixels [95–97].
Indian Pines, Salinas, and Houston datasets are commonly utilized in various studies. Additionally, the Pavia University dataset and the Pavia Centre and Kennedy Centre datasets hold a prominent position among the most widely employed datasets in spectral imagery [98–100].
4.4 Analytical Findings Corresponding to RQ4
RQ4: What are the challenges, limitations, and potential future developments concerning Hyperspectral and Multispectral images in conjunction with Deep Learning and Machine Learning Models?
Some primary studies suggest employing the same images with alternative classification algorithms to compare results. Within our selected primary studies, various issues were addressed using limited data, prompting the recommendation for larger datasets to achieve improved accuracy. However, due to environmental and camera bandwidth constraints, certain limitations persist. Interestingly, some research asserts that multispectral images are suitable for classifying various types of fruits and vegetables, while others advocate their use for flowers. To provide a comprehensive overview, we have summarized these findings, including limitations and challenges, in Table 6. These findings pave the way for future research in the expansive domain of multispectral and hyperspectral imagery.
Some models display consistent errors across all features, emphasizing the necessity for improving feature selection techniques. When conducting a comparative analysis of classification algorithms for a particular problem, it becomes evident that the learning process tends to be sluggish. However, this can be accelerated by isolating the feature selection process and applying the method to other fruits. Enriching the dataset with additional disease samples and testing it on various deep-learning architectures can help overcome the challenge of limited training samples.
5 Challenges and Future Directions
Multispectral and hyperspectral images offer data spanning multiple bands or narrow spectral channels, enabling the capture of extensive spectral information about the Earth’s surface or other observed targets. However, the analysis and interpretation of such data can be daunting due to its high dimensionality noise and artifacts. Machine learning and deep learning algorithms have demonstrated promising outcomes in addressing these challenges. They efficiently tackle spectral data’s computational complexity and high dimensionality, facilitating automated analysis and interpretation. A crucial aspect of hyperspectral image analysis is feature extraction and machine learning algorithms excel in automatically learning and performing this task. This ability becomes particularly significant due to the large number of spectral bands in hyperspectral data. Here are some challenges that we find in our primary studies.
The small size of datasets is indeed a standard limitation when working with spectral images in the context of agricultural fruits [68,77,87]. Obtaining and annotating large-scale datasets specific to agricultural fruits can be challenging due to various factors [73]. Here are some of the few reasons why the datasets related to spectral images were often small.
5.1.1 Data Collection and Annotation
Acquiring high-quality spectral images of agriculture requires specialized equipment, such as hyperspectral sensors or multispectral cameras. Conducting field data collection campaigns can be time-consuming and resource-intensive [69]. Additionally, accurately label and annotate the collected images with ground truth information, such as fruit type, ripeness, or disease status.
5.1.2 Variability and Diversity
Spectral images exhibit significant variability in size, shape, colour, and texture. Capturing this variability across different cultivars, growing conditions, and stages of development requires a diverse dataset [84,85]. However, collecting a representative sample of this variability is challenging, leading to relatively small datasets that may not fully capture the entire agricultural population’s variation.
5.1.3 Privacy and Proprietary Concerns
Agricultural datasets are sometimes limited due to privacy concerns or proprietary reasons. Agricultural companies or research institutions may hesitate to share their proprietary datasets due to intellectual property protection or competitive advantages [62,64]. This can limit the availability of large-scale datasets for public use. Cost constraints: Collecting and maintaining large-scale datasets can be costly. The equipment, human resources, and infrastructure required for data collection, storage, and annotation can impose financial constraints, particularly for research projects or organizations with limited resources. We can employ techniques such as semi-supervised learning or transfer learning. Semi-supervised learning leverages both labelled and unlabeled data for training. Transfer learning involves pre-training a model on a related dataset with more data and then fine-tuning it on the target dataset with limited labelled samples. We can also implement data augmentation techniques to artificially increase the training dataset’s diversity. This can involve applying transformations such as rotation, scaling, and brightness adjustment to account for variability.
5.2 Limited Environment and Camera Bandwidth
These factors can impact the quality and representativeness of the datasets. Here is a closer look at these limitations.
5.2.1 Limited Environment of Data Collection
Spectral imaging in agricultural settings is often conducted in specific environments, such as controlled greenhouse conditions or selected field sites [72]. This limited data collection environment can affect the generalizability of the models trained on these datasets. Agricultural conditions, such as lighting, soil types, weather patterns, and cultivation practices, can vary across different regions and seasons, making it challenging to capture the full range of environmental factors that influence fruit characteristics.
5.2.2 Camera Bandwidth Limitations
Spectral cameras for capturing multispectral or hyperspectral images have specific bandwidth ranges for each spectral band. These bandwidth limitations can affect the spectral resolution and accuracy of the captured images [78]. Narrow bandwidths may limit the ability to capture subtle spectral variations and nuances related to fruit properties, such as ripeness, disease, or nutritional content. This can lead to incomplete or less precise spectral information, which may impact the performance of analysis and classification algorithms. Researchers often employ strategies such as data augmentation to mitigate these limitations. By applying transformations or modifications to the available dataset, data augmentation techniques can help increase the diversity and size of the training data. This can help to some extent in compensating for the limited environment of data collection by introducing variations that mimic different environmental conditions or scenarios.
Cross-validation and external validation can be employed to assess the generalizability of models trained on limited datasets. This involves partitioning the dataset into subsets for training and validation, ensuring that the models are evaluated on data they have not seen during training. Additionally, external validation on independent datasets collected in different environments or by different research groups can provide a better understanding of the model’s performance and robustness.
Collaborative data collection among researchers, institutions, and stakeholders in the agricultural domain can help overcome the limitations of limited data collection environments. By pooling resources, sharing expertise, and conducting multi-site data collection campaigns, more extensive and diverse datasets can be obtained, capturing a wider range of environmental conditions and fruit characteristics. Camera and sensor advancements in spectral imaging technology, including camera bandwidth and resolution improvements, can help mitigate the limitations imposed by limited camera capabilities. Higher spectral resolution and broader bandwidths can provide more detailed and accurate spectral information, enabling better discrimination of fruit properties and improving the overall performance of analysis [56].
To overcome these, we can consider fusing spectral data with higher-resolution spatial data, such as RGB or multispectral imagery, to combine the spectral richness of the data with the spatial detail of higher-resolution imagery. Alternatively, explore super-resolution techniques to enhance spatial resolution.
Data scarcity can pose significant challenges, particularly in machine learning. These are some major aspects and issues that arise while facing data scarcity.
Data scarcity can make it challenging to train robust models [74], leading to overfitting (where the model fits the training data too closely [87] and performs poorly on new data) or underfitting (where the model cannot capture the underlying patterns in the data).
5.3.2 Reduced Model Performance
With limited data, it is often challenging to achieve high model performance. Models trained on small datasets may not capture the complexities of the underlying problem, resulting in suboptimal results [55,95].
Data scarcity can arise due to privacy concerns and regulations in sensitive domains, such as healthcare or finance. Access to sufficient data for research or analysis may be restricted to protect individuals’ privacy.
5.3.4 Transfer Learning Challenges
Machine learning techniques like transfer learning and domain adaptation are often used to leverage knowledge from related domains. Data scarcity can limit the effectiveness of these techniques, as they rely on having at least some data available in both the source and target domains [73,92].
Different strategies can be implemented to avoid data scarcity issues.
Data Augmentation: We can implement different data augmentation techniques to expand the dataset through translation and rotation by adding some noise to the existing data.
Transfer Learning: Adapt models on larger, related datasets to the target task with limited data.
Active Learning: Choose those queries and label the most informative data.
Semi-Supervised Learning: Combine labelled data with unlabeled data to make the most available information.
Domain Adaptation: Adapt models to perform well in the target domain by mitigating domain shift issues.
Data Synthesis: Use generative models to create synthetic data resembling the target domain.
Ultimately, addressing data scarcity requires careful consideration of the specific domain and problem at hand and creative solutions to make the most of the available data and resources.
5.4 Machine Learning and Deep Learning: Promises and Limitations
KNN was used for the classification of the rose plant in [59] and citrus greening detection in [69] and in [70] for the regression assessment of ready-to-eat pineapple quality. The classification accuracy was 65% and 81%, and the R-square value was 0.42, respectively. The challenge is to test different algorithms on the same type of problems at different stages of growth of the particular plant.
Citrus greening detection [66–69], pineapple quality [70], strawberry ripeness [77], tomato grading [65], and high-quality watermelon seeds classification were done by SVM with accuracy ranging from 79% to 98%. Testing new algorithms, refining feature selection, and more diverse sample images at various ripeness stages can enhance results. It is noted that accuracy may decrease as the number of target classes increases. Nevertheless, SVM holds potential for broader applications, including analyzing different seeds and crops, making it a promising avenue for future research and development.
Deep Learning and different types of neural networks were used for the detection of fruit diseases [83], vine disease detection [68], detection of green vegetation cover [84], detection of growth stages of rice [72], fruit recognition [73], apple defects [74], blossom detection in apple trees [75], tomato’s external defects [76] and strawberry disease classification [94]. The accuracy achieved was in the range of 65% to 99%. One of the main issues was the slow learning process, which can be enhanced by choosing the meta-heuristic techniques for feature selection. The other main challenge is adaptability. We can test the same model on the new dataset. We can enhance the adaptability by updating the dataset with new models on different agriculture problems.
This paper investigates a wide range of applications based on spectral images. It focuses on relevant studies from reputable databases, which were carefully chosen to address the four main research questions of the study. The study examined various applications utilizing spectral images, particularly agriculture. The findings reveal that Deep Learning is the most prevalent technique for spectral image classification, followed by SVM as the second optimal approach. Furthermore, the study identified popular datasets relevant to agricultural fruits, with Indian pines, Salinas, and Houston being the most widely used.
Additionally, the Pavia University and Kennedy Centre datasets were frequently employed in certain research. The study also acknowledged the limitations of the restricted data collection environment and camera bandwidth. Despite the constraints of small datasets, researchers have made notable strides in developing effective machine learning and deep learning models for agricultural fruit analysis. As the availability and quality of spectral image datasets increase, the potential for more accurate and robust analysis and applications in the agricultural sector also improves. Indeed, the limited environment of data collection and camera bandwidth represents additional challenges when working with spectral images in agricultural fruit analysis. Nevertheless, ongoing research and technological advancements in spectral imaging and agricultural fruit analysis aim to address these issues and enhance the dataset’s quality, diversity, and representativeness for machine learning and deep learning applications.
Acknowledgement: We express our gratitude to the upper management of the Karachi Institute of Economics and Technology (KIET) for furnishing the technical resources necessary for the execution of this research. Additionally, we extend our appreciation to Multimedia University for their generous financial backing of this research.
Funding Statement: The authors received no specific funding for this study.
Author Contributions: The authors confirm their contribution to the paper as follows: study conception and design: Usman Khan, Muhammad Khalid Khan; data collection: Muhammad Ayub Latif; analysis and interpretation of results: Usman Khan, Muhammad Khalid Khan; draft manuscript preparation: Usman Khan, Muhammad Khalid Khan, Muhammad Ayub Latif, Muhammad Naveed, Salman A. Khan, Muhammad Mansoor Alam, Mazliham Mohd Su’ud. All authors reviewed the results and approved the final version of the manuscript.
Availability of Data and Materials: Data available within the article. The authors confirm that the data supporting the findings of this study are available within the article.
Conflicts of Interest: The authors declare that they have no conflicts of interest to report regarding the present study.
References
1. A. Vibhute and S. K. Bodhe, “Applications of image processing in agriculture: A survey,” Int. J. Comput. Appl., vol. 52, no. 2, pp. 34–40, Aug. 2012. doi: 10.5120/8176-1495 [Google Scholar] [CrossRef]
2. W. Gong et al., “Investigating the potential of using the spatial and spectral information of multispectral LiDAR for object classification,” Sens., vol. 15, no. 9, pp. 21989–22002, Sep. 2015. doi: 10.3390/s150921989. [Google Scholar] [PubMed] [CrossRef]
3. H. Zheng et al., “A comparative assessment of different modeling algorithms for estimating leaf nitrogen content in winter wheat using multispectral images from an unmanned aerial vehicle,” Remote Sens., vol. 10, no. 12, pp. 2026, 2018. doi: 10.3390/rs10122026. [Google Scholar] [CrossRef]
4. H. Tian, T. Wang, Y. Liu, X. Qiao, and Y. Li, “Computer vision technology in agricultural automation—A review,” Inf. Process. Agric., vol. 7, no. 1, pp. 1–19, Mar. 2020. doi: 10.1016/j.inpa.2019.09.006. [Google Scholar] [CrossRef]
5. T. Adão et al., “Hyperspectral imaging: A review on UAV-based sensors, data processing and applications for agriculture and forestry,” Remote Sens., vol. 9, no. 11, pp. 1110, 2017. doi: 10.3390/rs9111110. [Google Scholar] [CrossRef]
6. J. Hu et al., “Quantitative estimation of soil salinity using UAV-borne hyperspectral and satellite multispectral images,” Remote Sens., vol. 11, no. 7, pp. 736, 2019. doi: 10.3390/rs11070736. [Google Scholar] [CrossRef]
7. J. Vargas, S. Alsweiss, O. Toker, R. Razdan, and J. Santos, “An overview of autonomous vehicles sensors and their vulnerability to weather conditions,” Sens., vol. 21, no. 16, pp. 5397, Aug. 2021. doi: 10.3390/s21165397. [Google Scholar] [PubMed] [CrossRef]
8. M. Himmler, D. W. Schubert, and T. A. Fuchsluger, “Examining the transmission of visible light through electrospun nanofibrous PCL scaffolds for corneal tissue engineering,” Nanomaterials, vol. 11, no. 12, pp. 3191, Nov. 2021. doi: 10.3390/nano11123191. [Google Scholar] [PubMed] [CrossRef]
9. K. J. Fan, and W. H. Su, “Applications of fluorescence spectroscopy, RGB- and multispectral imaging for quality determinations of white meat: A review,” Biosens., vol. 12, no. 2, pp. 76, Jan. 2022. doi: 10.3390/bios12020076. [Google Scholar] [PubMed] [CrossRef]
10. J. Nataprawira, Y. Gu, I. Goncharenko, and S. Kamijo, “Pedestrian detection using multispectral images and a deep neural network,” Sens., vol. 21, no. 7, pp. 1–17, 2021. doi: 10.3390/s21072536. [Google Scholar] [PubMed] [CrossRef]
11. M. D. Iordache, V. Mantas, E. Baltazar, K. Pauly, and N. Lewyckyj, “A machine learning approach to detecting pine wilt disease using airborne spectral imagery,” Remote Sens., vol. 12, no. 14, pp. 2280, Jul. 2020. doi: 10.3390/rs12142280. [Google Scholar] [CrossRef]
12. S. Baek, E. Choi, Y. Baek, and C. Lee, “Detection of counterfeit banknotes using multispectral images,” Digit Signal Process., vol. 78, no. 2, pp. 294–304, Jul. 2018. doi: 10.1016/j.dsp.2018.03.015. [Google Scholar] [CrossRef]
13. A. Mukundan, Y. M. Tsao, W. M. Cheng, F. C. Lin, and H. C. Wang, “Automatic counterfeit currency detection using a novel snapshot hyperspectral imaging algorithm,” Sens., vol. 23, no. 4, pp. 2026, Feb. 2023. doi: 10.3390/s23042026. [Google Scholar] [PubMed] [CrossRef]
14. K. Kang and C. Lee, “Fake banknote detection using multispectral images,” in 2016 7th Int. Conf. Inf., Intelli., Syst. Appli. (IISA), Chalkidiki, Greece, IEEE, Jul. 2016, pp. 1–3. doi: 10.1109/IISA.2016.7785338. [Google Scholar] [CrossRef]
15. S. L. P. Aggarwal and F. A. Papay, “Applications of multispectral and hyperspectral imaging in dermatology,” Exp. Dermatol., vol. 31, no. 8, pp. 1128–1135, Aug. 2022. doi: 10.1111/exd.14624. [Google Scholar] [PubMed] [CrossRef]
16. W. Huang, C. Zhao, Q. Wang, J. Li, and C. Zhang, “Development of a multi-spectral imaging system for the detection of bruises on apples,” Sens. Agric. Food Qual. Saf., vol. 8721, pp. 872105, May 2013. doi: 10.1117/12.2015579. [Google Scholar] [CrossRef]
17. A. K. Chandel, L. R. Khot, and C. S. Bernardita, “Apple powdery mildew infestation detection and mapping using high-resolution visible and multispectral aerial imaging technique,” Sci Hortic, vol. 287, no. 6, pp. 110228, Sep. 2021. doi: 10.1016/j.scienta.2021.110228. [Google Scholar] [CrossRef]
18. A. Bhargava and A. Bansal, “Quality evaluation of mono & bi-colored apples with computer vision and multispectral imaging,” Multimed. Tools Appl., vol. 79, no. 11–12, pp. 7857–7874, 2020. doi: 10.1007/s11042-019-08564-3. [Google Scholar] [CrossRef]
19. J. Feng, L. Zeng, and L. He, “Apple fruit recognition algorithm based on multi-spectral dynamic image analysis,” Sens., vol. 19, no. 4, pp. 949, Feb. 2019. doi: 10.3390/s19040949. [Google Scholar] [PubMed] [CrossRef]
20. I. Amro, J. Mateos, M. Vega, R. Molina, and A. K. Katsaggelos, “A survey of classical methods and new trends in pansharpening of multispectral images,” Eurasip. J. Adv. Sig. Process., vol. 2011, no. 1, pp. 1–22, 2011. doi: 10.1186/1687-6180-2011-79. [Google Scholar] [CrossRef]
21. I. Racetin and A. Krtalić, “Systematic review of anomaly detection in hyperspectral remote sensing applications,” Applied Sciences, vol. 11, no. 11, pp. 4878, 2021. doi: 10.3390/app11114878. [Google Scholar] [CrossRef]
22. E. Aloupogianni, M. Ishikawa, N. Kobayashi, and T. Obi, “Hyperspectral and multispectral image processing for gross-level tumor detection in skin lesions: A systematic review,” J. Biomed. Opt., vol. 27, no. 6, pp. 1–28, 2022. doi: 10.1117/1.JBO.27.6.060901. [Google Scholar] [PubMed] [CrossRef]
23. S. Ortega, M. Halicek, H. Fabelo, G. M. Callico, and B. Fei, “Hyperspectral and multispectral imaging in digital and computational pathology: A systematic review [Invited],” Biomed. Opt. Exp., vol. 11, no. 6, pp. 3195, 2020. doi: 10.1364/BOE.386338. [Google Scholar] [PubMed] [CrossRef]
24. A. Kaul and S. Raina, “Support vector machine versus convolutional neural network for hyperspectral image classification: A systematic review,” Concurr. Comput.: Pract. Exp., vol. 34, no. 15, pp. e6945, 2022. doi: 10.1002/cpe.6945. [Google Scholar] [CrossRef]
25. D. Datta et al., “Hyperspectral image classification: Potentials, challenges, and future directions,” Comput. Intelli. Neurosci., vol. 2022, no. 11, pp. 1–36, 2022. doi: 10.1155/2022/3854635. [Google Scholar] [PubMed] [CrossRef]
26. A. Ozdemir and K. Polat, “Deep learning applications for hyperspectral imaging: A systematic review,” J. Inst. Electron. Comput., vol. 2, no. 1, pp. 39–56, 2020. doi: 10.33969/JIEC.2020.21004. [Google Scholar] [CrossRef]
27. D. Lu and Q. Weng, “A survey of image classification methods and techniques for improving classification performance,” Int. J. Remote Sens., vol. 28, no. 5, pp. 823–870, 2007. doi: 10.1080/01431160600746456. [Google Scholar] [CrossRef]
28. H. Lee, J. Wang, and B. Leblon, “Using linear regression, random forests, and support vector machine with unmanned aerial vehicle multispectral images to predict canopy nitrogen weight in corn,” Remote Sens., vol. 12, no. 13, pp. 2071, 2020. doi: 10.3390/rs12132071. [Google Scholar] [CrossRef]
29. K. Osorio, A. Puerto, C. Pedraza, D. Jamaica, and L. Rodríguez, “A deep learning approach for weed detection in lettuce crops using multispectral images,” AgriEng., vol. 2, no. 3, pp. 471–488, Sep. 2020. doi: 10.3390/agriengineering2030032. [Google Scholar] [CrossRef]
30. M. S. Ozigis, J. D. Kaduk, C. H. Jarvis, P. da Conceição Bispo, and H. Balzter, “Detection of oil pollution impacts on vegetation using multi-frequency SAR, multispectral images with fuzzy forest and random forest methods,” Environ. Pollut., vol. 256, no. 2, pp. 113360, Jan. 2020. doi: 10.1016/j.envpol.2019.113360. [Google Scholar] [PubMed] [CrossRef]
31. M. C. F. Lima, A. Krus, C. Valero, A. Barrientos, J. Del Cerro and J. J. Roldán-Gómez, “Monitoring plant status and fertilization strategy through multispectral images,” Sens., vol. 20, no. 2, pp. 435, 2020. doi: 10.3390/s20020435. [Google Scholar] [PubMed] [CrossRef]
32. Y. Cao, G. L. Li, Y. K. Luo, Q. Pan, and S. Y. Zhang, “Monitoring of sugar beet growth indicators using wide-dynamic-range vegetation index (WDRVI) derived from UAV multispectral images,” Comput. Electron. Agric., vol. 171, pp. 105331, 2020. doi: 10.1016/j.compag.2020.105331. [Google Scholar] [CrossRef]
33. C. M. Sicre, R. Fieuzal, and F. Baup, “Contribution of multispectral (optical and radar) satellite images to the classification of agricultural surfaces,” Int. J. Appl. Earth Obs., vol. 84, pp. 101972, Jul. 2019. doi: 10.1016/j.jag.2019.101972. [Google Scholar] [CrossRef]
34. H. Qi et al., “Estimation of peanut leaf area index from unmanned aerial vehicle multispectral images,” Sens., vol. 20, no. 23, pp. 1–15, 2020. doi: 10.3390/s20236732. [Google Scholar] [PubMed] [CrossRef]
35. W. Zhang, Q. Zhu, M. Huang, Y. Guo, and J. Qin, “Detection and classification of potato defects using multispectral imaging system based on single shot method,” Food Anal. Method, vol. 12, no. 12, pp. 2920–2929, 2019. doi: 10.1007/s12161-019-01654-w. [Google Scholar] [CrossRef]
36. J. C. Noordam, W. H. van den Broek, and L. M. Buydens, “Perspective of inline control of latent defects and diseases on French fries with multispectral imaging,” Monitoring Food Safety, Agric. Plant Health, vol. 5271, pp. 85, 2004. doi: 10.1117/12.515371. [Google Scholar] [CrossRef]
37. Y. Yang, X. Zhao, M. Huang, X. Wang, and Q. Zhu, “Multispectral image based germination detection of potato by using supervised multiple threshold segmentation model and Canny edge detector,” Comput. Electron. Agric., vol. 182, no. 7, pp. 106041, 2021. doi: 10.1016/j.compag.2021.106041. [Google Scholar] [CrossRef]
38. S. Khanal, J. Fulton, and S. Shearer, “An overview of current and potential applications of thermal remote sensing in precision agriculture,” Comput. Electron. Agric., vol. 139, pp. 22–32, Jun. 2017. doi: 10.1016/j.compag.2017.05.001. [Google Scholar] [CrossRef]
39. S. Ranjan, D. R. Nayak, K. S. Kumar, R. Dash, and B. Majhi, “Hyperspectral image classification: A k-means clustering based approach,” in 2017 4th Int. Conf. Adv. Comput. Commun. Syst., ICACCS 2017, 2017, pp. 6. doi: 10.1109/ICACCS.2017.8014707. [Google Scholar] [CrossRef]
40. Y. Zhang et al., “Estimating the maize biomass by crop height and narrowband vegetation indices derived from UAV-based hyperspectral images,” Ecol. Indic., vol. 129, no. 12, pp. 107985, 2021. doi: 10.1016/j.ecolind.2021.107985. [Google Scholar] [CrossRef]
41. J. Rubio-Delgado, C. J. Pérez, and M. A. Vega-Rodríguez, “Predicting leaf nitrogen content in olive trees using hyperspectral data for precision agriculture,” Precis. Agric., vol. 22, no. 1, pp. 1–21, 2021. doi: 10.1007/s11119-020-09727-1. [Google Scholar] [CrossRef]
42. G. Messina and G. Modica, “The role of remote sensing in olive growing farm management: A research outlook from 2000 to the present in the framework of precision agriculture applications,” Remote., vol. 14, no. 23, pp. 5951, Nov. 2022. doi: 10.3390/rs14235951. [Google Scholar] [CrossRef]
43. H. Yao, R. Qin, and X. Chen, “Unmanned aerial vehicle for remote sensing applications—A review,” Remote Sens., vol. 11, no. 12, pp. 1443, Jun. 2019. doi: 10.3390/rs11121443. [Google Scholar] [CrossRef]
44. D. Gautam and V. Pagay, “A review of current and potential applications of remote sensing to study the water status of horticultural crops,” Agron., vol. 10, no. 1, pp. 140, Jan. 2020. doi: 10.3390/agronomy10010140. [Google Scholar] [CrossRef]
45. C. Yang, J. H. Everitt, J. M. Bradford, and D. Murden, “Airborne hyperspectral imagery and yield monitor data for mapping cotton yield variability,” Precis. Agric., vol. 5, no. 5, pp. 445–461, 2004. doi: 10.1007/s11119-004-5319-8. [Google Scholar] [CrossRef]
46. Y. Zhang, L. Wu, L. Deng, and B. Ouyang, “Retrieval of water quality parameters from hyperspectral images using a hybrid feedback deep factorization machine model,” Water Res., vol. 204, no. 3, pp. 117618, 2021. doi: 10.1016/j.watres.2021.117618. [Google Scholar] [PubMed] [CrossRef]
47. T. Mewes, J. Franke, and G. Menz, “Spectral requirements on airborne hyperspectral remote sensing data for wheat disease detection,” Precis. Agric., vol. 12, no. 6, pp. 795–812, 2011. doi: 10.1007/s11119-011-9222-9. [Google Scholar] [CrossRef]
48. H. Cen, R. Lu, D. P. Ariana, and F. Mendoza, “Hyperspectral imaging-based classification and wavebands selection for internal defect detection of pickling cucumbers,” Food Bioprocess Tech., vol. 7, no. 6, pp. 1689–1700, 2014. doi: 10.1007/s11947-013-1177-6. [Google Scholar] [CrossRef]
49. P. Langley,“Machine learning and concept formation,” Mach. Learn., vol. 2, no. 2, pp. 99–102, Sep. 1987. doi: 10.1007/BF00114263. [Google Scholar] [CrossRef]
50. M. Cui and D. Y. Zhang, “Artificial intelligence and computational pathology,” Lab. Invest., vol. 101, no. 4, pp. 412–422, Apr. 2021. doi: 10.1038/s41374-020-00514-0. [Google Scholar] [PubMed] [CrossRef]
51. B. Kitchenham et al., “Systematic literature reviews in software engineering—A tertiary study,” Inf. Software Tech., vol. 52, no. 8, pp. 792–805, 2010. doi: 10.1016/j.infsof.2010.03.006. [Google Scholar] [CrossRef]
52. A. Lowe, N. Harrison, and A. P. French, “Hyperspectral image analysis techniques for the detection and classification of the early onset of plant disease and stress,” Plant Methods, vol. 13, no. 1, pp. 1–12, 2017. doi: 10.1186/s13007-017-0233-z. [Google Scholar] [PubMed] [CrossRef]
53. H. Gan, W. S. Lee, and V. Alchanatis, “An active thermography method for immature citrus fruit detection,” Biosyst. Eng., vol. 198, pp. 291–303, 2018. [Google Scholar]
54. K. Park, Y. K. Hong, G. H. Kim, and J. Lee, “Classification of apple leaf conditions in hyperspectral images for diagnosis of Marssonina blotch using mRMR and deep neural network,” Comput. Electron. Agric., vol. 148, no. 3, pp. 179–187, 2018. doi: 10.1016/j.compag.2018.02.025. [Google Scholar] [CrossRef]
55. P. A. Dias, A. Tabb, and H. Medeiros, “Apple flower detection using deep convolutional networks,” Comput. Ind., vol. 99, no. 1, pp. 17–28, 2018. doi: 10.1016/j.compind.2018.03.010. [Google Scholar] [CrossRef]
56. A. Wendel, J. Underwood, and K. Walsh, “Maturity estimation of mangoes using hyperspectral imaging from a ground based mobile platform,” Comput. Electron. Agric., vol. 155, no. 1, pp. 298–313, 2018. doi: 10.1016/j.compag.2018.10.021. [Google Scholar] [CrossRef]
57. W. Liu, X. Xu, C. Liu, and L. Zheng, “Rapid discrimination of high-quality watermelon seeds by multispectral imaging combined with chemometric methods,” J. Appl. Spectrosc., vol. 85, no. 6, pp. 1044–1049, 2019. doi: 10.1007/s10812-019-00757-w. [Google Scholar] [CrossRef]
58. S. Kaur, S. Pandey, and S. Goel, “Plants disease identification and classification through leaf images: A survey,” Arch. Comput. Method Eng., vol. 26, no. 2, pp. 507–530, 2019. doi: 10.1007/s11831-018-9255-6. [Google Scholar] [CrossRef]
59. M. Malik, A. Ikram, S. N. Batool, and W. Aslam, “A performance assessment of rose plant classification using machine learning,” in INTAP 2018: Intelligent Technologies and Applications, 2019, pp. 745–756. doi: 10.1007/978-981-13-6052-7_64. [Google Scholar] [CrossRef]
60. J. Li et al., “Detection of early decayed oranges based on multispectral principal component image combining both bi-dimensional empirical mode decomposition and watershed segmentation method,” Postharvest Biol. Technol., vol. 158, no. 4, pp. 110986, 2019. doi: 10.1016/j.postharvbio.2019.110986. [Google Scholar] [CrossRef]
61. J. G. A. Barbedo, “Detection of nutrition deficiencies in plants using proximal images and machine learning: A review,” Comput. Electron. Agric., vol. 162, no. 7, pp. 482–492, 2019. doi: 10.1016/j.compag.2019.04.035. [Google Scholar] [CrossRef]
62. J. Gené-Mola, V. Vilaplana, J. R. Rosell-Polo, J. R. Morros, J. Ruiz-Hidalgo and E. Gregorio, “Multi-modal deep learning for Fuji apple detection using RGB-D cameras and their radiometric capabilities,” Comput. Electron. Agric., vol. 162, pp. 689–698, 2019. doi: 10.1016/j.compag.2019.05.016. [Google Scholar] [CrossRef]
63. J. Steinbrener, K. Posch, and R. Leitner, “Hyperspectral fruit and vegetable classification using convolutional neural networks,” Comput. Electron. Agric., vol. 162, no. 6, pp. 364–372, Oct. 2018. doi: 10.1016/j.compag.2019.04.019. [Google Scholar] [CrossRef]
64. J. Gené-Mola et al., “Fruit detection in an apple orchard using a mobile terrestrial laser scanner,” Biosyst. Eng., vol. 187, no. 34, pp. 171–184, 2019. doi: 10.1016/j.biosystemseng.2019.08.017. [Google Scholar] [CrossRef]
65. D. Ireri, E. Belal, C. Okinda, N. Makange, and C. Ji, “A computer vision system for defect discrimination and grading in tomatoes using machine learning and image processing,” Artif. Intelli. Agric., vol. 2, no. 1, pp. 28–37, 2019. doi: 10.1016/j.aiia.2019.06.001. [Google Scholar] [CrossRef]
66. F. DadrasJavan, F. Samadzadegan, S. H. S. Pourazar, and H. Fazeli, “UAV-based multispectral imagery for fast citrus greening detection,” J. Plant Dis. Protect., vol. 126, no. 4, pp. 307–318, 2019. doi: 10.1007/s41348-019-00234-8. [Google Scholar] [CrossRef]
67. S. S. Chouhan, U. P. Singh, and S. Jain, “Applications of computer vision in plant pathology: A survey,” Arch. Comput. Method Eng., vol. 27, no. 2, pp. 611–632, 2020. doi: 10.1007/s11831-019-09324-0. [Google Scholar] [CrossRef]
68. M. Kerkech, A. Hafiane, and R. Canals, “Vine disease detection in UAV multispectral images using optimized image registration and deep learning segmentation approach,” Comput. Electron. Agric., vol. 174, no. 1, pp. 105446, 2020. doi: 10.1016/j.compag.2020.105446. [Google Scholar] [CrossRef]
69. Y. Lan et al., “Comparison of machine learning methods for citrus greening detection on UAV multispectral images,” Comput. Electron. Agric., vol. 171, no. 5, pp. 105234, 2020. doi: 10.1016/j.compag.2020.105234. [Google Scholar] [CrossRef]
70. E. Manthou et al., “Application of spectroscopic and multispectral imaging technologies on the assessment of ready-to-eat pineapple quality: A performance evaluation study of machine learning models generated from two commercial data analytics tools,” Comput. Electron. Agric., vol. 175, pp. 105529, 2020. doi: 10.1016/j.compag.2020.105529. [Google Scholar] [CrossRef]
71. J. Xiong et al., “Visual detection of green mangoes by an unmanned aerial vehicle in orchards based on a deep learning method,” Biosyst. Eng., vol. 194, no. 4, pp. 261–272, 2020. doi: 10.1016/j.biosystemseng.2020.04.006. [Google Scholar] [CrossRef]
72. Q. Yang, L. Shi, J. Han, J. Yu, and K. Huang, “A near real-time deep learning approach for detecting rice phenology based on UAV images,” Agric. Forest Meteorol., vol. 287, pp. 107938, 2020. doi: 10.1016/j.agrformet.2020.107938. [Google Scholar] [CrossRef]
73. S. I. Saedi and H. Khosravi, “A deep neural network approach towards real-time on-branch fruit recognition for precision horticulture,” Exp. Syst. Appl., vol. 159, no. 4, pp. 113594, 2020. doi: 10.1016/j.eswa.2020.113594. [Google Scholar] [CrossRef]
74. S. Fan et al., “On line detection of defective apples using computer vision system combined with deep learning methods,” J. Food Eng., vol. 286, no. 5, pp. 110102, 2020. doi: 10.1016/j.jfoodeng.2020.110102. [Google Scholar] [CrossRef]
75. U. Bhattarai, S. Bhusal, Y. Majeed, and M. Karkee, “Automatic blossom detection in apple trees using deep learning,” Int. Fed. Automatic Control-PapersOnLine, vol. 53, no. 2, pp. 15810–15815, 2020. doi: 10.1016/j.ifacol.2020.12.216. [Google Scholar] [CrossRef]
76. A. Z. da Costa, H. E. H. Figueroa, and J. A. Fracarolli, “Computer vision based detection of external defects on tomatoes using deep learning,” Biosyst. Eng., vol. 190, no. 3, pp. 131–144, 2020. doi: 10.1016/j.biosystemseng.2019.12.003. [Google Scholar] [CrossRef]
77. Z. Gao, Y. Shao, G. Xuan, Y. Wang, Y. Liu and X. Han, “Real-time hyperspectral imaging for the in-field estimation of strawberry ripeness with deep learning,” Artif. Intelli. Agric., vol. 4, no. 6, pp. 31–38, 2020. doi: 10.1016/j.aiia.2020.04.003. [Google Scholar] [CrossRef]
78. J. Wu et al., “Extracting apple tree crown information from remote imagery using deep learning,” Comput. Electron. Agric., vol. 174, no. 4, pp. 105504, 2020. doi: 10.1016/j.compag.2020.105504. [Google Scholar] [CrossRef]
79. Z. Du, X. Zeng, X. Li, X. Ding, J. Cao and W. Jiang, “Recent advances in imaging techniques for bruise detection in fruits and vegetables,” Trends Food Sci. Technol., vol. 99, no. 1, pp. 133–141, 2020. doi: 10.1016/j.tifs.2020.02.024. [Google Scholar] [CrossRef]
80. X. Hu, L. Yang, and Z. Zhang, “Non-destructive identification of single hard seed via multispectral imaging analysis in six legume species,” Plant Methods, vol. 16, no. 1, pp. 1–13, 2020. doi: 10.1186/s13007-020-00659-5. [Google Scholar] [PubMed] [CrossRef]
81. L. A. Suarez, A. Robson, J. McPhee, J. O’Halloran, and C. van Sprang, “Accuracy of carrot yield forecasting using proximal hyperspectral and satellite multispectral data,” Precis. Agric., vol. 21, no. 6, pp. 1304–1326, 2020. doi: 10.1007/s11119-020-09722-6. [Google Scholar] [CrossRef]
82. P. Chithra and M. Henila, “Apple fruit sorting using novel thresholding and area calculation algorithms,” Soft Comput., vol. 25, no. 1, pp. 431–445, 2021. doi: 10.1007/s00500-020-05158-2. [Google Scholar] [CrossRef]
83. H. Jiang, X. Li, and F. Safara, “IoT-based agriculture: Deep learning in detecting apple fruit diseases,” Microprocess. Microsyst., vol. 143, no. 2, pp. 104321, 2021. doi: 10.1016/j.micpro.2021.104321. [Google Scholar] [CrossRef]
84. L. El Hoummaidi, A. Larabi, and K. Alam, “Using unmanned aerial systems and deep learning for agriculture mapping in Dubai,” Heliyon, vol. 7, no. 10, pp. e08154, 2021. doi: 10.1016/j.heliyon.2021.e08154. [Google Scholar] [PubMed] [CrossRef]
85. X. Zhou, W. S. Lee, Y. Ampatzidis, Y. Chen, N. Peres and C. Fraisse, “Strawberry maturity classification from UAV and near-ground imaging using deep learning,” Smart Agric. Technol., vol. 1, no. 16, pp. 100001, 2021. doi: 10.1016/j.atech.2021.100001. [Google Scholar] [CrossRef]
86. Z. Zhou, Y. Majeed, G. D. Naranjo, and E. M. T. Gambacorta, “Assessment for crop water stress with infrared thermal imagery in precision agriculture: A review and future prospects for deep learning applications,” Comput. Electron. Agric., vol. 182, no. 5, pp. 106019, 2021. doi: 10.1016/j.compag.2021.106019. [Google Scholar] [CrossRef]
87. J. Gao, J. C. Westergaard, E. H. R. Sundmark, M. Bagge, E. Liljeroth and E. Alexandersson, “Automatic late blight lesion recognition and severity quantification based on field imagery of diverse potato genotypes by deep learning,” Knowl-Based Syst., vol. 214, pp. 106723, 2021. doi: 10.1016/j.knosys.2020.106723. [Google Scholar] [CrossRef]
88. D. Wu et al., “A deep learning-integrated micro-CT image analysis pipeline for quantifying rice lodging resistance-related traits,” Plant Commun., vol. 2, no. 2, pp. 100165, 2021. doi: 10.1016/j.xplc.2021.100165. [Google Scholar] [PubMed] [CrossRef]
89. G. Sachdeva, P. Singh, and P. Kaur, “Plant leaf disease classification using deep convolutional neural network with Bayesian learning,” Mater. Today: Proc., vol. 45, pp. 5584–5590, 2021. doi: 10.1016/j.matpr.2021.02.312. [Google Scholar] [CrossRef]
90. B. D. S. Barbosa et al., “UAV-based coffee yield prediction utilizing feature selection and deep learning,” Smart Agric. Technol., vol. 1, no. 17, pp. 100010, 2021. doi: 10.1016/j.atech.2021.100010. [Google Scholar] [CrossRef]
91. J. D. Arango, B. Staar, A. M. Baig, and M. Freitag, “Quality control of apples by means of convolutional neural networks—Comparison of bruise detection by color images and near-infrared images,” Proc. CIRP, vol. 99, no. 7, pp. 290–294, 2021. doi: 10.1016/j.procir.2021.03.043. [Google Scholar] [CrossRef]
92. K. Tatsumi, N. Igarashi, and X. Mengxue, “Prediction of plant-level tomato biomass and yield using machine learning with unmanned aerial vehicle imagery,” Plant Methods, vol. 17, no. 1, pp. 1–17, 2021. doi: 10.1186/s13007-021-00761-2. [Google Scholar] [PubMed] [CrossRef]
93. X. Fu and M. Wang, “Detection of early bruises on pears using fluorescence hyperspectral imaging technique,” Food Anal. Method, vol. 15, no. 1, pp. 115–123, 2022. doi: 10.1007/s12161-021-02092-3. [Google Scholar] [CrossRef]
94. G. F. Yang, Y. Yang, Z. K. He, X. Y. Zhang, and Y. He, “A rapid, low-cost deep learning system to classify strawberry disease based on cloud service,” J. Integr. Agric., vol. 21, no. 2, pp. 460–473, 2022. doi: 10.1016/S2095-3119(21)63604-3. [Google Scholar] [CrossRef]
95. J. T. F. Rosas, F. de A. de Carvalho Pinto, D. M. de Queiroz, F. M. de Melo Villar, D. S. Magalhães Valente and R. Nogueira Martins, “Coffee ripeness monitoring using a UAV-mounted low-cost multispectral camera,” Precis. Agric., vol. 23, no. 1, pp. 300–318, 2022. doi: 10.1007/s11119-021-09838-3. [Google Scholar] [CrossRef]
96. F. DadrasJavan, F. Samadzadegan, S. H. S. Pourazar, and H. Fazeli, “UAV-based multispectral imagery for fast citrus greening detection,” J. Plant Dis. Prot., vol. 126, no. 4, pp. 307–318, Aug. 2019. doi: 10.1007/s41348-019-00234-8. [Google Scholar] [CrossRef]
97. Q. Gao, S. Lim, and X. Jia, “Hyperspectral image classification using convolutional neural networks and multiple feature learning,” Remote Sens., vol. 10, no. 2, pp. 299, Feb. 2018. doi: 10.3390/rs10020299. [Google Scholar] [CrossRef]
98. A. Samat, P. Du, S. Liu, J. Li, and L. Cheng, “Ensemble extreme learning machines for hyperspectral image classification,” IEEE J. Sel. Top. Appl. Earth Obs. Remote Sens., vol. 7, no. 4, pp. 1060–1069, Apr. 2014. doi: 10.1109/JSTARS.2014.2301775. [Google Scholar] [CrossRef]
99. F. Luo, Y. Huang, W. Tu, and J. Liu, “Local manifold sparse model for image classification,” Neurocomput., vol. 382, no. 6, pp. 162–173, Mar. 2020. doi: 10.1016/j.neucom.2019.11.084. [Google Scholar] [CrossRef]
100. Z. Chen, J. Jiang, X. Jiang, X. Fang, and Z. Cai, “Spectral-spatial feature extraction of hyperspectral images based on propagation filter,” Sens., vol. 18, no. 6, pp. 1978, Jun. 2018. doi: 10.3390/s18061978. [Google Scholar] [PubMed] [CrossRef]
Cite This Article
 Copyright © 2024 The Author(s). Published by Tech Science Press.
This work is licensed under a Creative Commons Attribution 4.0 International License , which permits unrestricted use, distribution, and reproduction in any medium, provided the original work is properly cited.
 Downloads
 Citation Tools