
 Submit a Paper
 Propose a Special lssue
 Open Access
ARTICLE

The Effect of Key Nodes on the Malware Dynamics in the Industrial Control Network
1 College of Computer Science and Technology, Shenyang University of Chemical Technology, Shenyang, 110142, China
2 College of Computer Science and Engineering, Northeastern University, Shenyang, 110169, China
* Corresponding Author: Jun Wang. Email:
(This article belongs to the Special Issue: Recent Advances in Ensemble Framework of Meta-heuristics and Machine Learning: Methods and Applications)
Computers, Materials & Continua 2024, 79(1), 329-349. https://doi.org/10.32604/cmc.2024.048117
Received 28 November 2023; Accepted 25 January 2024; Issue published 25 April 2024
 View Full Text
 Download PDF
Abstract
As industrialization and informatization become more deeply intertwined, industrial control networks have entered an era of intelligence. The connection between industrial control networks and the external internet is becoming increasingly close, which leads to frequent security accidents. This paper proposes a model for the industrial control network. It includes a malware containment strategy that integrates intrusion detection, quarantine, and monitoring. Based on this model, the role of key nodes in the spread of malware is studied, a comparison experiment is conducted to validate the impact of the containment strategy. In addition, the dynamic behavior of the model is analyzed, the basic reproduction number is computed, and the disease-free and endemic equilibrium of the model is also obtained by the basic reproduction number. Moreover, through simulation experiments, the effectiveness of the containment strategy is validated, the influence of the relevant parameters is analyzed, and the containment strategy is optimized. In other words, selective immunity to key nodes can effectively suppress the spread of malware and maintain the stability of industrial control systems. The earlier the immunization of key nodes, the better. Once the time exceeds the threshold, immunizing key nodes is almost ineffective. The analysis provides a better way to contain the malware in the industrial control network.Keywords
Nomenclature
| Total number of PLCs | |
| Total number of honeypots | |
| Number of susceptible PCs whose degree is | |
| Number of infected PCs whose degree is | |
| Number of quarantined PCs whose degree is | |
| Number of susceptible industrial control equipment whose degree is | |
| Number of infected industrial control equipment whose degree is | |
| Number of monitored industrial control equipment whose degree is | |
| Number of recovered industrial control equipment whose degree is | |
| Infection rate of PCs that are infected by PCs | |
| Infection rate of PCs that are infected by industrial control equipment | |
| Infection rate of industrial control equipment that are infected by PCs | |
| Quarantine rate of susceptible PCs | |
| Quarantine rate of infected PCs | |
| Monitored rate of infected industrial control equipment | |
| Recovered rate of PCs | |
| Recovered rate of industrial control equipment | |
| Rate of recovered PCs losing immunity | |
| Rate of industrial control equipment losing immunity |
In the past decade, the number of industrial control security incidents has been increasing. In 2010, the Stuxnet worm targeted the Bushehr nuclear power plant in Iran [1]. Since then, there have been many malware targeting Industrial Control System (ICS) networks, such as Night Dragon [2], Flame [3], Duqu/Duqu2.0 [4], Blaster [5], and BlackEnergy [6]. The typical Programmable Logic Controller (PLC) worm Blaster can only exist in PLC, and it has the potential to propagate via Siemens SIMATIC S7-1200’s control system. PLC Blaster can scan the ICS networks to find new targets, then it will attack PLCs and replicate in the infected PLCs. Some new types of malware can spread not only in Personal Computer (PC) networks but also in industrial control networks. In 2012, Russian security experts discovered the Flame virus spreading widely in the energy industry in the Middle East [7]. In 2016, the Mirai botnet attack occurred, and in 2020 [8], Israel’s water supply system was invaded by malware [9]. Malware plays an important role in frequent industrial control security incidents, posing a huge threat to the security of industrial infrastructure. The industrial control network is generally composed of industrial control equipment with different characteristics, and it is often coupled and connected with other networks to form a complex network. Therefore, establishing a propagation model to describe the propagation behavior of malware in industrial control networks and proposing effective containment strategies have become an urgent problem that needs to be solved.
At present, the vulnerabilities are used to spread the PLC worm in Supervisory Control and Data Acquisition (SCADA). Fovino et al. used the MalSim simulator to conduct similar attack experiments and achieved obvious attack effects [10]. It is evident that defending against this malware variant poses greater challenges, and its potential for harm is considerably more severe. Some malware can spread across the network through the interaction of the subnets. Therefore, a coupled network can better describe the actual propagation behavior of malware. The industrial control coupled network is composed of two layers of subnets, and the network topology is shown in Fig. 1. The upper subnet is a PC network composed of PCs and servers (the blue nodes), and the lower subnet is an ICS network composed of industrial control equipment (the purple nodes) such as SCADA, Object Linking and Embedding (OLE), OLE for Process Control (OPC), Human Machine Interface (HMI), and PLC. Different nodes in the network have different degrees, and a server host in the upper network will be connected to many PC hosts. Similarly, in the lower ICS network, the SCADA control center will collect data from a lot of PLCs for analysis and monitoring. The PLCs may be distributed in different sites, which means that SCADA will have a connection relationship with many PLCs. When the industrial controller communicates with equipment, it must pass through the OPC server, so the OPC server will also have a connection relationship with many industrial control equipment. An HMI is often connected to many industrial control equipment such as PLCs and displays the operating status of these PLCs. The general layout of an ICS has been summarized by Kheddar et al., as it is shown in Fig. 2 [11]. In other words, for an industrial control coupled network, the characteristics of different nodes are different. Certain nodes exhibit a high degree, whereas others possess a low degree.
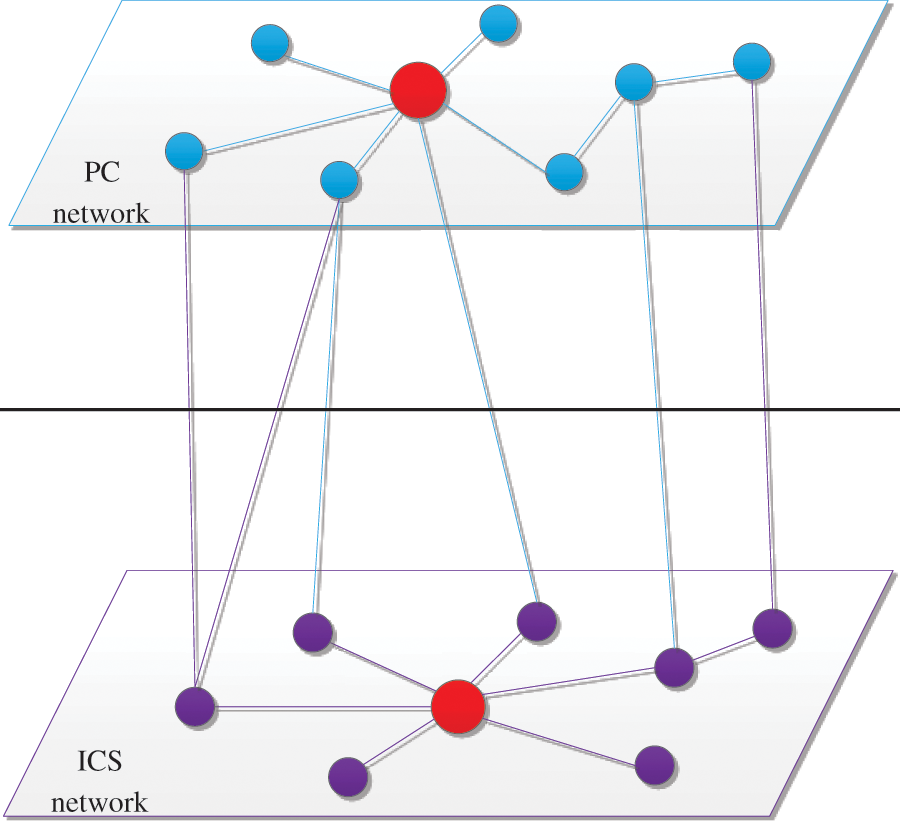
Figure 1: Topology of industrial control coupled network
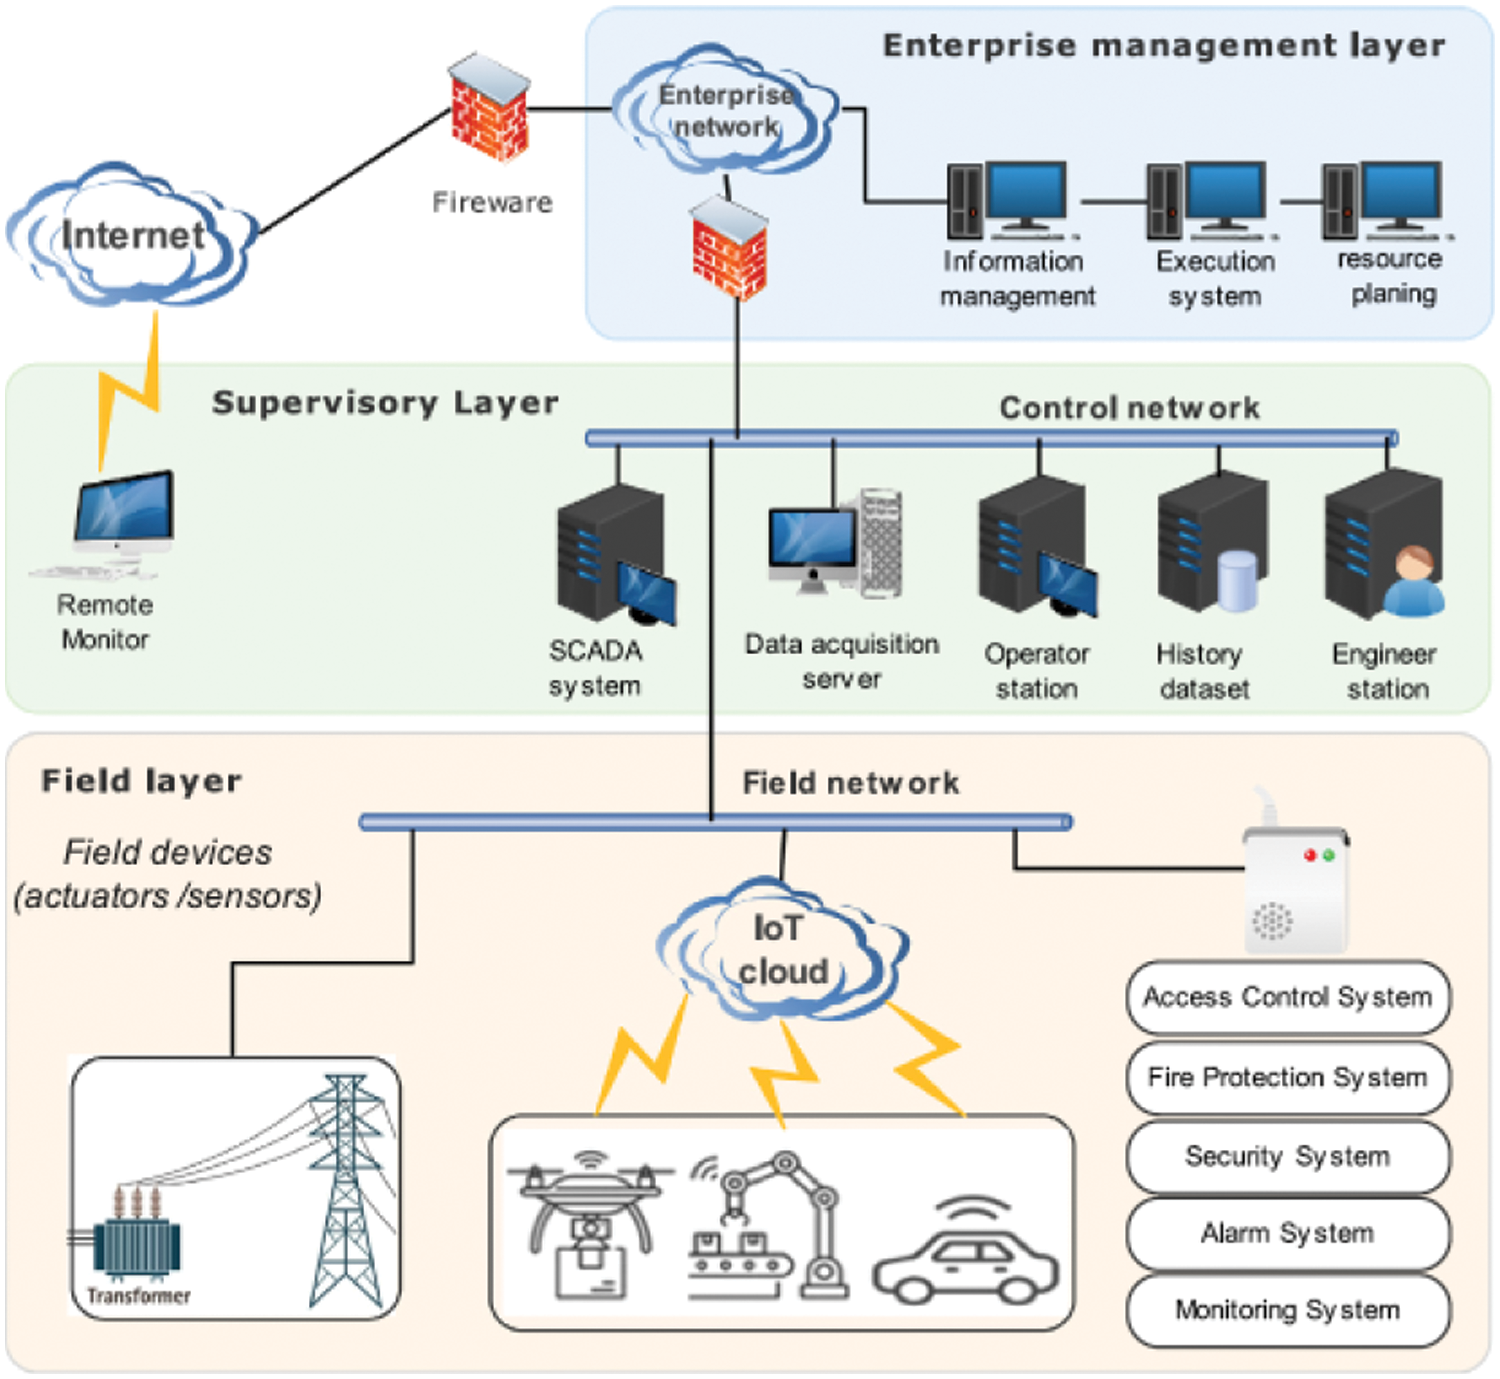
Figure 2: General layout of an ICS [11]
The amount of connected edges of different nodes in the network is different, such as the red nodes in Fig. 1 are connected to more edges. Different hosts in the PC network have different degrees, and the Server will connect to a large number of hosts. For the industrial control equipment in the ICS network, SCADA will control the operation of many PLCs, and OPC and HMI will have a connection relationship with many PLCs. These characteristics make the coupled network look like a complex network. Some researchers have studied the attributes of pivotal nodes within intricate networks [12–14]. This research considers the differences in the characteristics of nodes in the coupled network, group the nodes with degrees, and define some of the nodes with the highest degree as the key nodes. That is to say, when the malware spreads in the coupled network, the ability of different nodes to spread the malware is different. For example, in Fig. 3, both node A and node B are infected, and the other nodes are susceptible. Node A is connected to seven susceptible nodes, and node B is connected to three susceptible nodes. Node A has a greater impact on malware propagation than node B. This research will discuss the effect of the key nodes on malware propagation in detail in Section 5.

Figure 3: The key nodes in the network
To study the effect of the key nodes on the malware dynamics in the industrial control coupled network, a dynamic model is proposed in the coupled network. The epidemic model is a method of quantitative research on the spread of infectious diseases because the spread of malware is very similar to the spread of infectious diseases [15], the epidemic model is used to study the propagation of malware. In the complex network, Rey et al. propose a malware propagation model based on random complex networks and cellular automata [16]. Hosseini et al. establish a theoretical model for the spread of malware on scale-free networks and propose an ABM version of the model [17]. Yuan simulate the propagation of worms in complex industrial networks based on the NS2 simulation system [18]. Viswalingam et al. perform a new analysis of the SIR model in a two-layer coupled network [19]. Dickison et al. study the SIR model in a two-layer coupled network and find that if the two subnets are strongly coupled, the malware can spread throughout the network, and if the network is weakly coupled, then the malware will only exist in one subnet [20]. Masood et al. describe the characteristics of Stuxnet, and they investigate the spread of the virus in the regime of isolated industrial networks [21]. Based on the difference between an intelligent device’s dissemination capacity and discriminant ability, Li et al. propose a dynamic malware propagation model in cyber physics systems [22]. Shen et al. propose a two-layer malware model based on a hybrid patches distribution method [23]. Based on an epidemic theory’s analysis framework and individual-group game theory, Wu et al. propose a virus spread model (STSIR) [24]. Shen et al. present evolutionary privacy preservation learning strategies for an edge computing-based Internet of Things (IoT) data sharing scheme [25]. Yu et al. propose an open-set solution called DC-IDS for Industrial Internet of Things (IIoT) based on deep reinforcement learning, and Deep Q-Network (DQN) is employed [26]. Similarly, Shen et al. propose a heuristic learning intrusion detection system with DQN for edge-based Social Internet of Things (SIoT) networks [27], in addition, they propose a privacy-preservation signaling game for edge-computing-based IoT networks [28]. The above studies provide an effective reference for getting deeper insights into the propagation of malware in the coupled network. However, most studies did not take into account the differences in characteristics between different nodes in the network.
Building upon the aforementioned studies, a dynamic model is proposed in the industrial control network. The model includes a malware containment strategy that integrates detection, quarantine, and monitoring. On this basis, the role of key nodes in malware propagation is studied. By conducting comparative experiments on key nodes, it is concluded that infecting key nodes can significantly accelerate the speed of malware propagation. Therefore, immunizing key nodes is a more effective containment strategy. Based on detection, quarantine, and monitoring, selective immunity to key nodes can effectively suppress the spread of malware and maintain the stability of industrial control systems. The paper is organized as follows: Section 1 is the introduction; Section 2 is model formulation which describes how the model is proposed; Section 3 is the dynamics of the model, in this section, the basic reproduction number is obtained, and the dynamics of the model is analyzed; Section 4 shows the results of the simulation experiments; Section 5 shows the role of key nodes in malware propagation; Section 6 is Conclusion.
To analyze the effect of the key nodes, an epidemic model within a coupled is proposed in a coupled network that combines both PC and ICS networks. It is assumed that the industrial control equipment (PLC, SCADA, OPC, and HMI) and in the coupled network, the proposed model considers PCs as the nodes, where the links depict communication connections between these nodes. The network size remains constant, and the nodes are categorized into two groups: PCs and industrial control equipment, with their respective network sizes being
2.1 Intrusion Detection System
In the proposed model, an Intrusion Detection System (IDS) is used as a containment strategy. Different from passive defense methods, an IDS can actively discover abnormal intrusion behaviors in the network and give warnings, and it has been widely used in network security. With the development of intrusion detection technology, many different intrusion detection methods have emerged, which can be roughly divided into two categories: Misused intrusion detection and anomaly intrusion detection.
Misused detection is also called feature-based intrusion detection [29]. This method maintains a signature database that describes various known intrusions. It will extract the feature value of the data to be detected, and match the extracted feature value with the signature database. If the matching is successful, it is determined that an intrusion has occurred, otherwise, it is considered that no attack event has occurred. The advantage of this detection method is high detection accuracy, but it cannot detect unknown worm attacks. Anomaly detection is also called behavior-based intrusion detection. It uses the idea of contradiction. This method does not depend on a specific system, it can be flexibly adjusted according to the actual situation, and it can detect worm attacks that have never occurred before. However, this behavior also has deficiencies. It is easy to define normal network activities as intrusions, which means that there is a false alarm.
Considering the effects of the intrusion detection methods, the dual intrusion detection method is used to detect worm attacks in the network. For the host in the PC network, anomaly intrusion detection is first used. If no abnormal behavior is found, it is considered that the host is not infected by the worm. If abnormal behavior is found, a second detection is performed. During the second detection, the frequency of abnormal behaviors is recorded. When the frequency is greater than the specified threshold, it is considered that worm attacks have occurred. For the industrial control equipment in the ICS network, the proposed model adopts anomaly intrusion detection to detect the traffic at first. If no abnormal behavior is found, it is considered that the industrial control equipment is not infected by the worm. If abnormal behavior is found, then it checks the operating status of the industrial control equipment. If the relevant value of the operating status of the equipment is within the legal range, it is considered that no attack event has occurred. Otherwise, it is determined that the device has been infected by malware. Thus the proposed model can ensure the normal operation of industrial control equipment to the greatest extent, and effectively detect malware attacks.
To suppress the spread of the malware, the general approach is to identify the hosts and industrial control equipment that have been infected, and then immunize the infected hosts and equipment. However, with the continuous increase of network bandwidth and the improvement of hacker technology, the spread of malware is getting faster and faster. A malware suppression strategy is proposed that integrates detection, quarantine, and monitoring to limit the spread of malware in ICS coupled network.
Based on the IDS, the hosts and industrial control equipment infected by the worm can be discovered. For the hosts in the PC network, when the infected hosts are detected, they will be immediately quarantined from the network by powering off, which can effectively prevent it from continuing to infect other hosts. At the same time, it provides advanced protection for hosts in a susceptible state. When the hosts are quarantined, immediately patch it and install anti-virus software to make it immune.
For the industrial control equipment, quarantine may cause a shutdown, which in turn affects the normal operation of the industrial production process. So the model filters the port traffic of industrial control equipment by a whitelist, which produces a similar quarantine effect. The specific method is to set up a whitelist for the industrial control equipment when the IDS finds that the port of the industrial control equipment generates abnormal traffic and determines that it is infected. The whitelist is set with strict filtering rules, and the generation rules are extracted from the historical traffic of the industrial control equipment. The rules only allow the normal part of the traffic in the industrial production process to pass, and filter out all other traffic. Although it will cause part of the normal traffic to be blocked and filtered, it effectively prevents the spread of malware in the industrial control network, and it can ensure the normal progress of the industrial production process, then the industrial control equipment will be patched to make them immune.
2.3 Intrusion Detection System
Based on the proposed malware containment strategy, the SIQMR model is proposed to analyze the dynamic of malware. Within the PC network, the proposed model categorizes PCs into four compartments based on their conditions during malware attacks: susceptible state (
In the ICS network, the equipment can be segregated into four compartments based on their states: susceptible state (
The model is assumed into a heterogeneous coupled network, the node degree distribution follows a power law (
Then the following equations can be found:
The assumption here is that node connectivity is independent, and the probability for susceptible PCs to interact with infected PCs is:
and the probability of communicating with infected industrial control equipment is:
Similarly, the probability for susceptible industrial control equipment to communicate with infected industrial control equipment is:
and the probability of communicating with infected PCs is:
According to the previously established transition relationships and formulations, the diagram depicting the states of nodes in the two-layer connected network is presented in Fig. 4, and the model can be expressed as the model (8). In the proposed model, the total number of PCs and industrial control equipment remains constant. The symbols utilized in the model are detailed in the nomenclature.
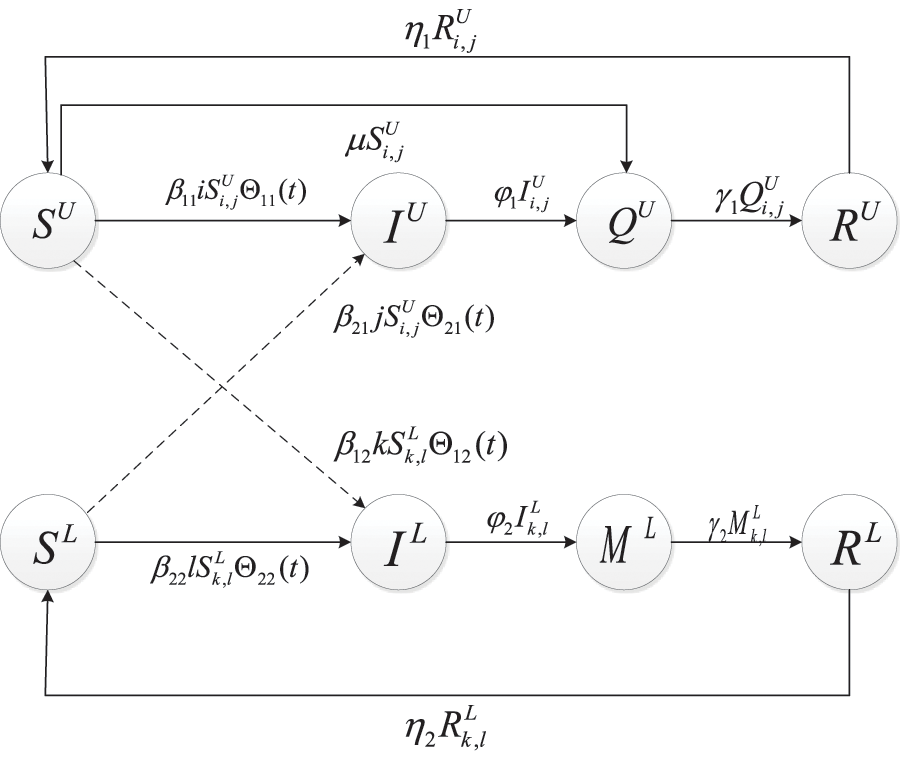
Figure 4: The transition diagram
3 Equations and Mathematical Expressions
In this section, the dynamic behaviors of model (8) are analyzed, and two important equilibria are identified: The disease-free equilibrium and the endemic equilibrium, which can indicate malware remains in epidemics or become extinct. This research then proceed to assess the local and global stability of these equilibria using the basic reproduction number, denoted as
The model Eq. (8) is set to be zero with
The disease-free equilibrium is
The concept of an endemic equilibrium signifies a stable state with no further state changes. From this, it can derive the endemic equilibrium point, denoted as
The independence in the joint degree distributions is assumed as:
For briefness, it denotes
Let
Due to the independence of joint degree distributions in the model, matrix (13) can undergo further simplification to:
then it can get the characteristic equation,
The eigenvalues of the matrix are:
Because
Since
Theorem. 1 If the basic reproduction number
Proof. For a constant differential autonomous system,
where
To test the efficacy of critical nodes and containment strategies, this research performs simulation experiments to simulate the malware propagation process within the industrial control network. In a discrete-time framework, simulation experiments are executed to collect a dataset representing the number of PCs (ICS equipment) in each state within the network, and the experimental results are drawn using MATLAB.
The experiments are divided into three parts: Disease-free equilibrium, endemic equilibrium, and the effectiveness of key nodes. The coupled network is assumed to exhibit a scale-free structure, with node degrees following a power-low distribution. The power-law index is set
Fig. 5 shows the trend of the number of infected hosts in the PC network, and the parameters for the disease-free equilibrium are listed in Table 1. In the initial phase of the simulation, due to the rapid spread of the malware, the number of infected hosts increases rapidly and reaches a peak at
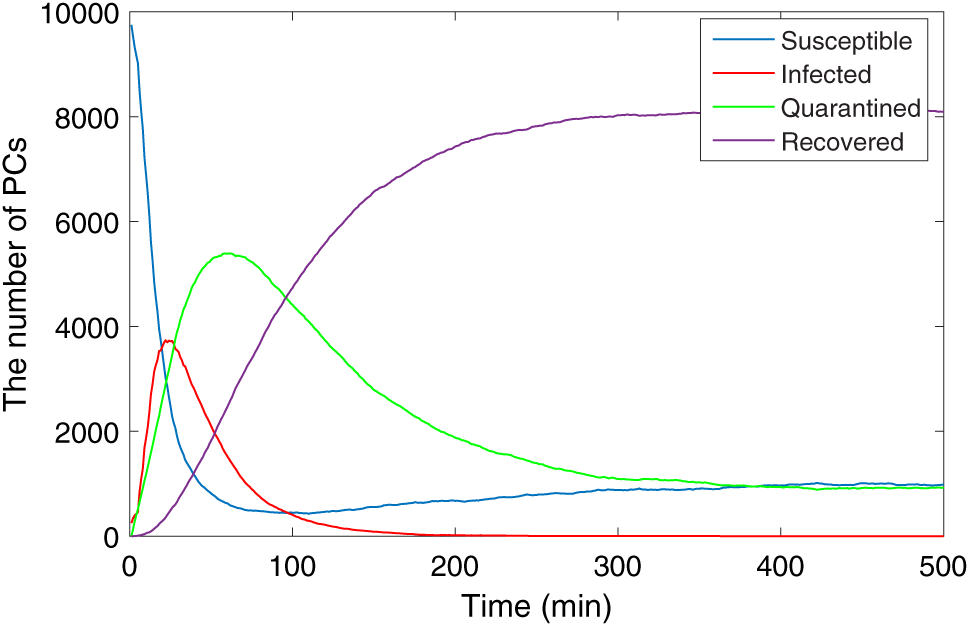
Figure 5: The propagation of PCs (disease-free equilibrium)
Next, an experimental analysis of the malware propagation is conducted in the ICS network. In Fig. 6, it is shown the propagation trend of the infected industrial control equipment. The number of monitored and recovered industrial control equipment increased and then decreased, and finally, the number became zero. The number of susceptible industrial control equipment reaches the minimum value of 800 at
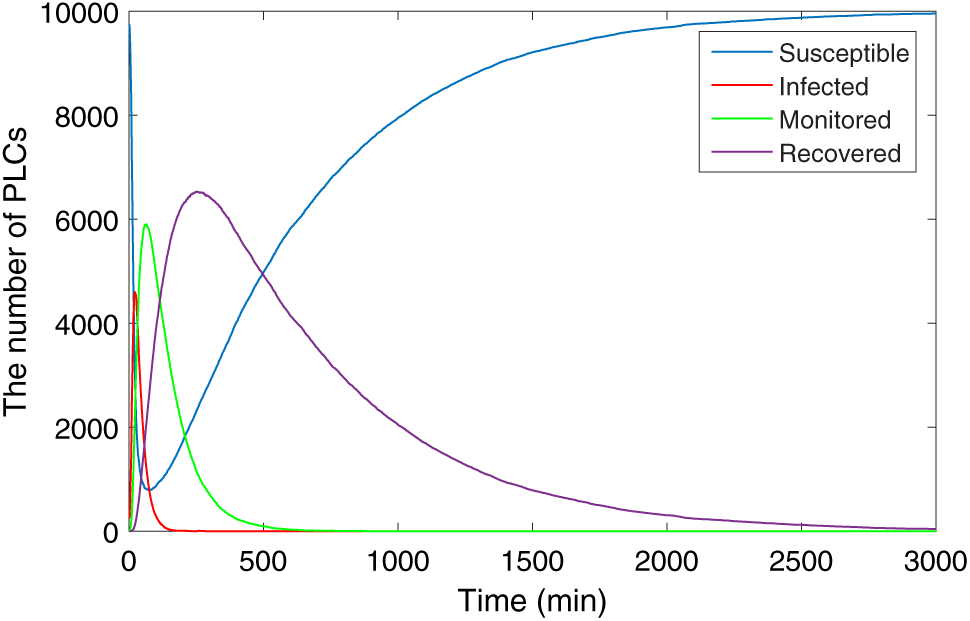
Figure 6: The propagation of industrial control equipment (disease-free equilibrium)
The parameters corresponding to the endemic equilibrium are presented in Table 2. Fig. 7 shows the curves of PC hosts in the PC network. In the beginning, a large number of susceptible PC hosts are infected, leading to a rapid rise in the number of infected hosts, reaching a peak around
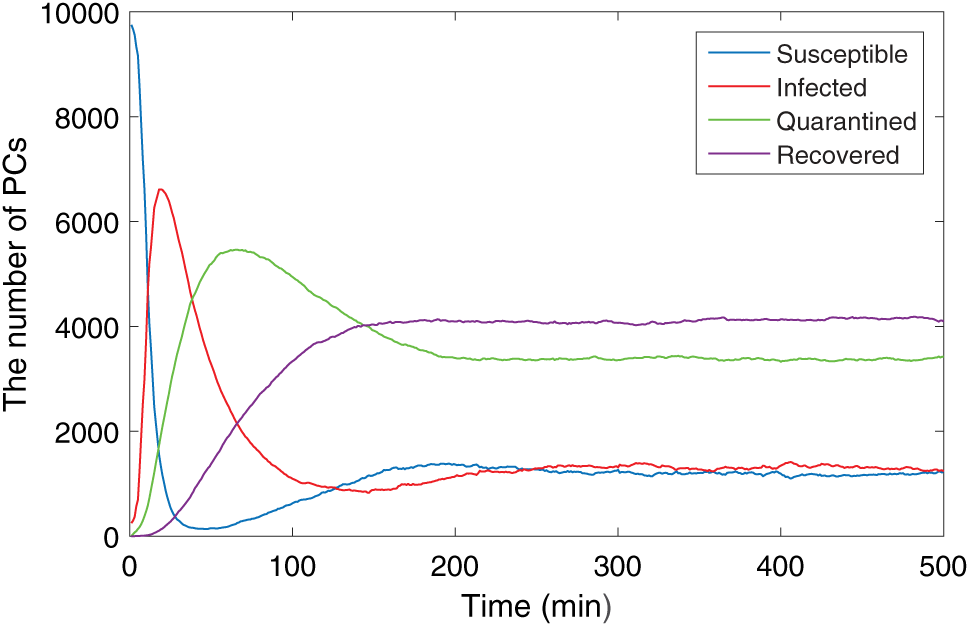
Figure 7: The propagation of PCs (endemic equilibrium)
Fig. 8 shows the propagation of the industrial control equipment in the ICS network. In the beginning, the susceptible industrial control equipment is quickly infected, the number increases rapidly and reaches a peak soon. Subsequently, the number of monitored and recovered industrial control equipment gradually increases, and the number of infected industrial control equipment begins to decrease. Finally, the industrial control equipment reaches a stable state. The figure illustrates that after the system is stabilized to an endemic equilibrium state, 22% of the industrial control equipment is infected, while the proportion of monitored and recovered equipment is 35% and 30%, respectively. The simulation experiments have proved that the SIQMR model has a noteworthy inhibitory effect on the spread of malware in the industrial control network.
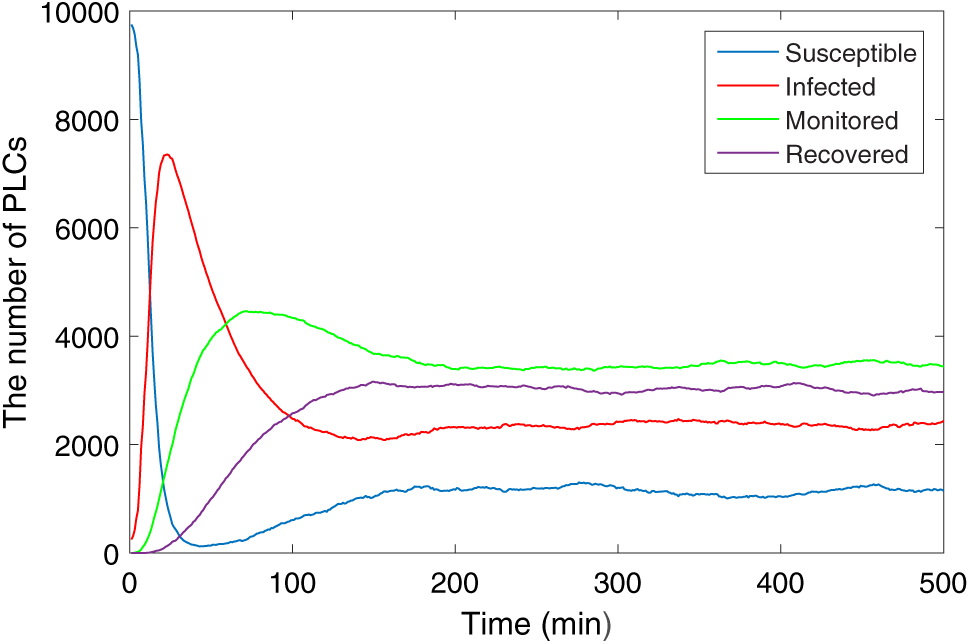
Figure 8: The propagation of industrial control equipment (endemic equilibrium)
4.3 Comparisons of Relevant Parameters
To examine the impact of the parameters on malware propagation, some parameter comparative experiments are conducted on these parameters. Fig. 9 shows the influence of
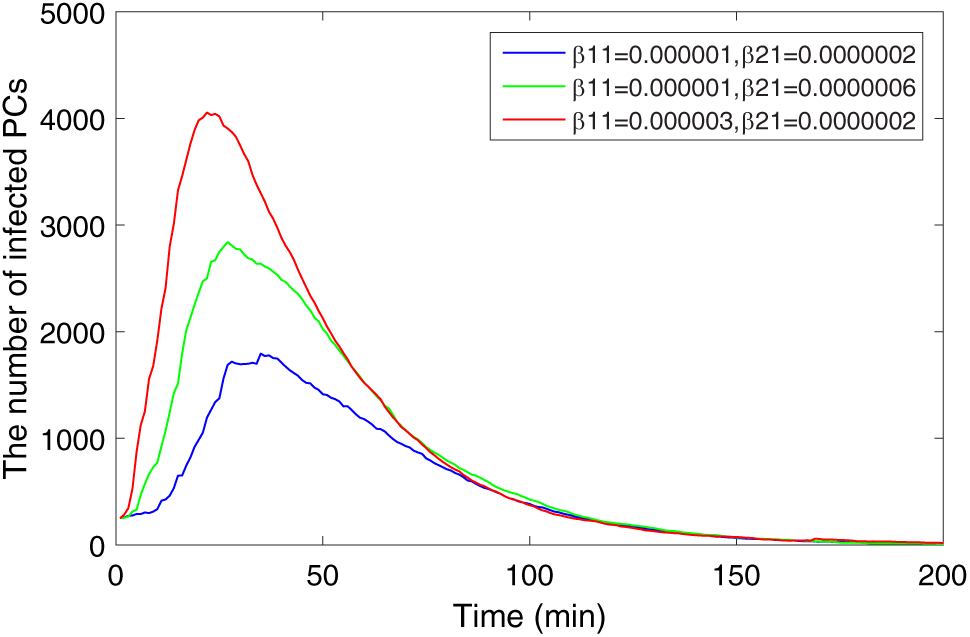
Figure 9: Comparison of infected PCs with different infection rates
Fig. 10 shows the influence of the quarantine rate
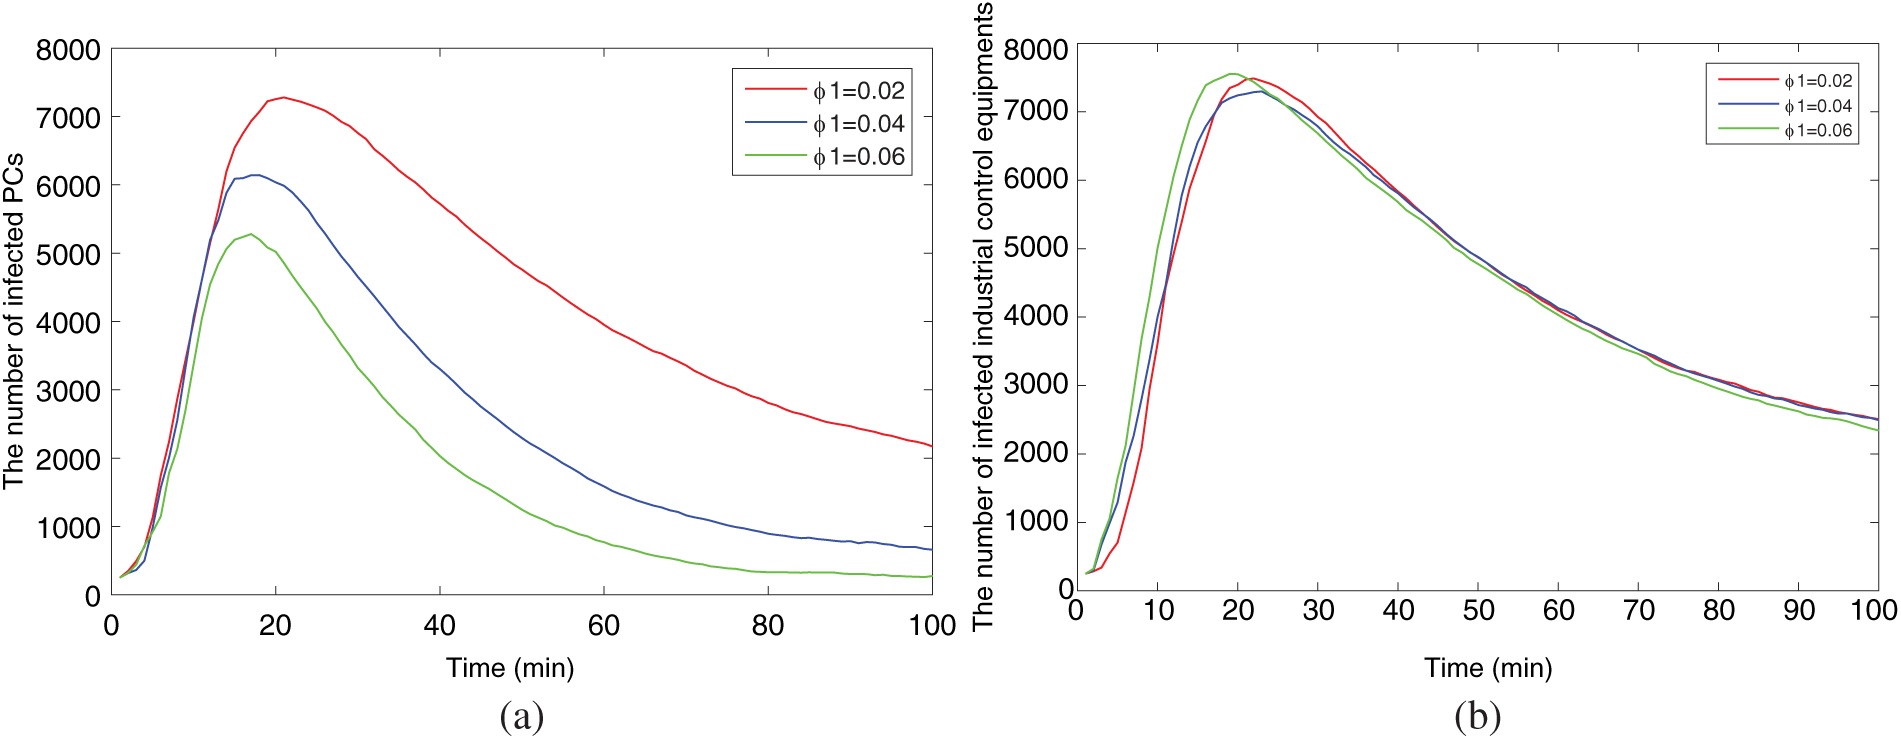
Figure 10: Comparison of infected hosts with different quarantine rates
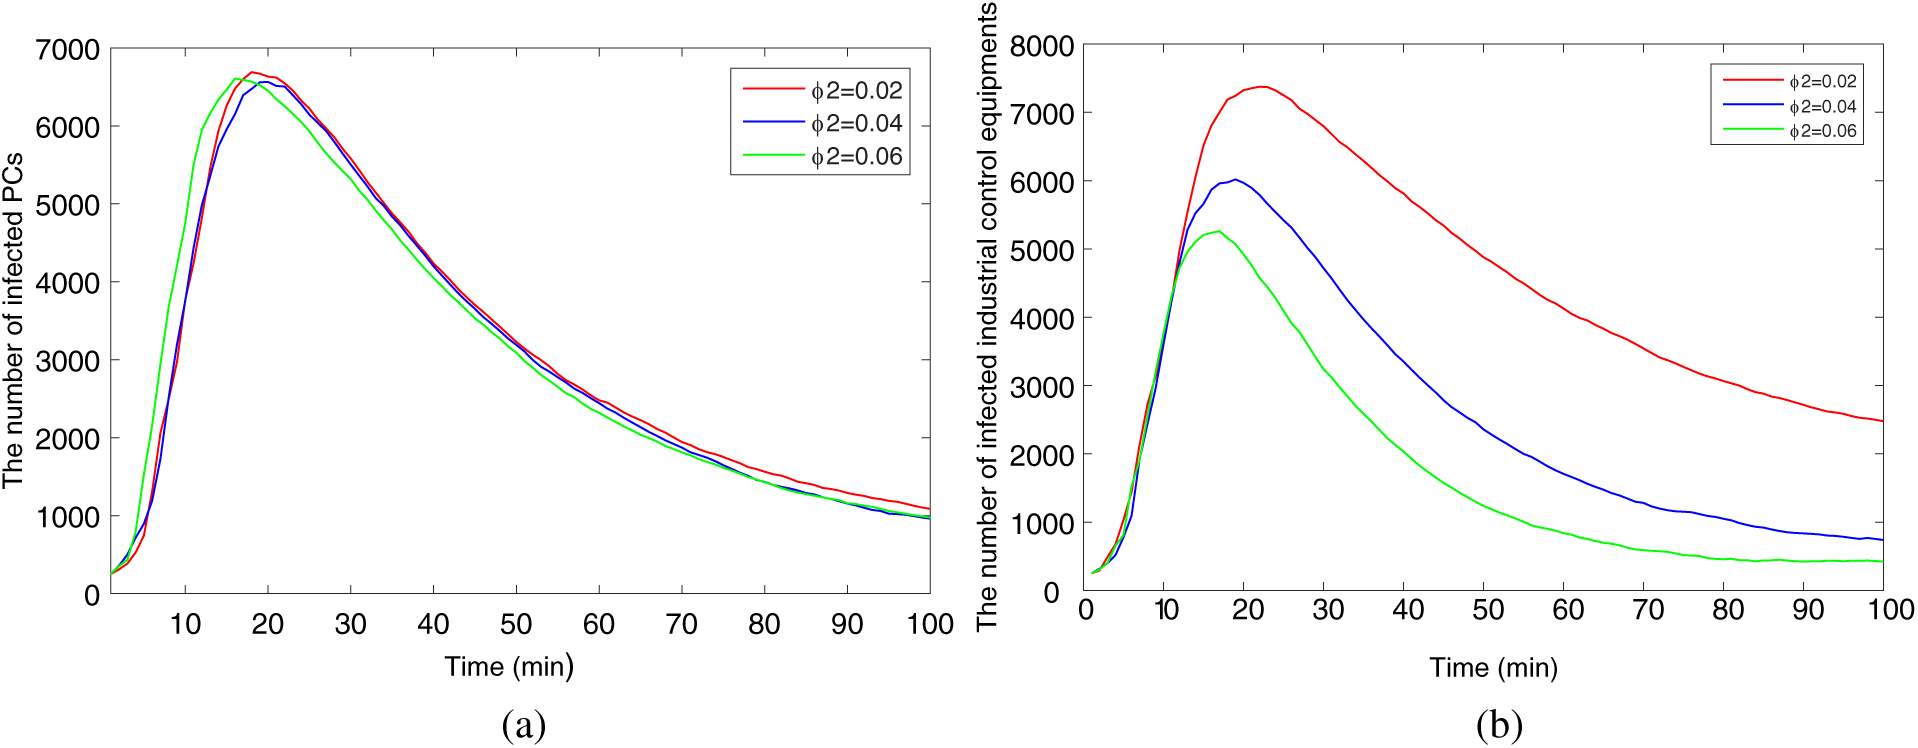
Figure 11: Comparison of infected hosts with different monitored rates
5 Discussion about the Key Nodes
To verify the duty of key nodes in the malware propagation, an experimental analysis is conducted on key nodes in the coupled network. The connection matrix of the industrial control coupled network is shown in Fig. 12. The number “1” in the matrix means that two nodes are connected. Firstly, the degree of each node in the network is calculated according to the connection matrix and then sort all the nodes according to the degree. In this paper, the key nodes are the nodes with the larger degree value, and the sequence count of the key nodes in the network can be easily obtained according to the sorting result.
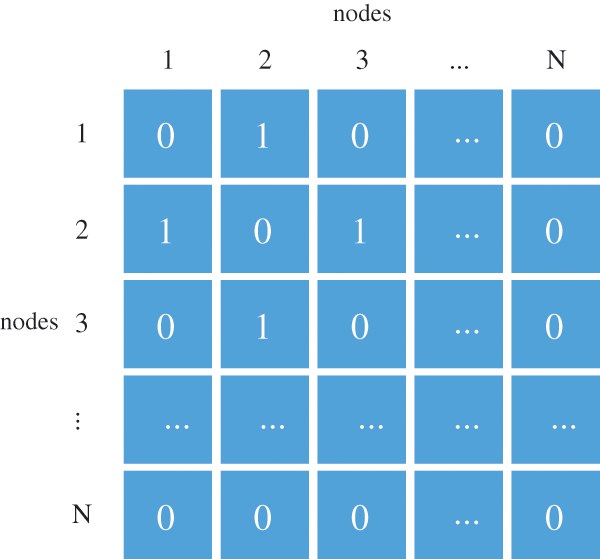
Figure 12: Connection matrix of coupled network
According to the theoretical analysis in Section 3, the greater the degree of a node, the more other nodes it can infect per unit time. The critical network node has a higher degree value. If the critical node is infected, the malware will erupt more quickly. Firstly, the key nodes in the two subnets are infected by malware. The experiment assumes that the number of key nodes in the PC network and the ICS network are both 20. Then in another experiment, 40 nodes are randomly selected for infection, and compared the results of the two simulation experiments.
So it can be concluded that infecting key nodes will cause the malware to infect the network at a faster rate. If a hacker obtains the topology data and attacks the key nodes (such as SCADA and HMI), then the malware will rapidly spread within the network and very little reaction time will be left for security personnel. Once a key node is infected, it will instantly infect many susceptible hosts and equipment, it is like a “superinfected node”. However, if the pivotal role of key nodes is used in the network, it can get a more effective malware containment strategy. The experimental analysis is conducted about the inhibitory effect of recovered key nodes.
In Fig. 13, the key nodes in the PC network and the ICS network are selectively immunized at t = 1, that is, implement measures such as early protection and patching on the key nodes. Then the same number of nodes are randomly selected for early protection and patching, and the outcomes of both experiments are contrasted. Fig. 14 displays the comparative experimental consequences, it becomes evident that vaccinating pivotal nodes can lead to a further reduction in the count of infected nodes, effectively curbing malware propagation.
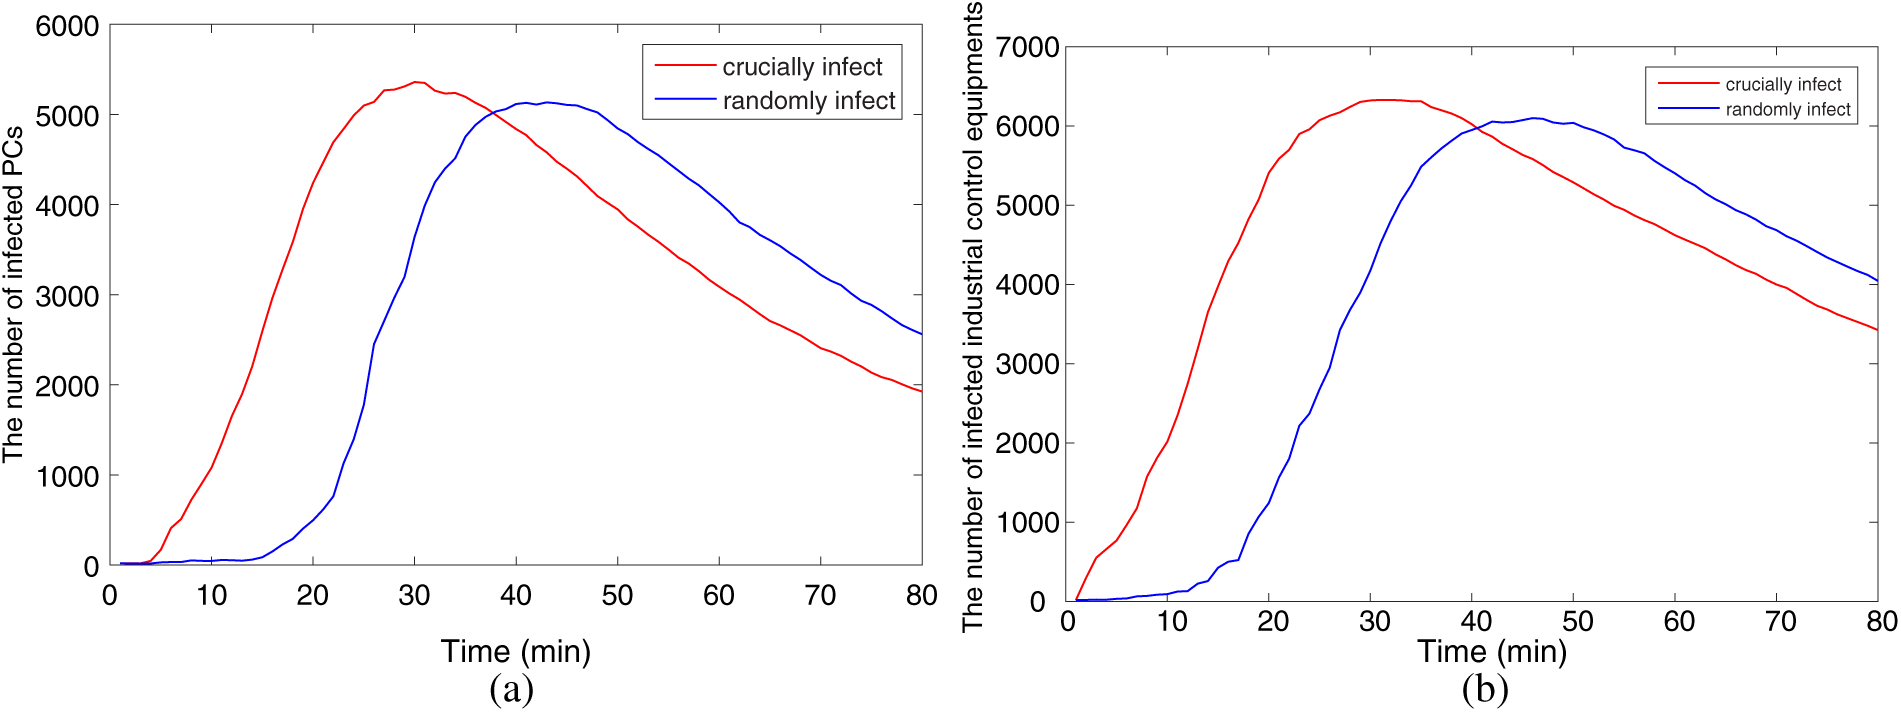
Figure 13: Crucial infection and random infect
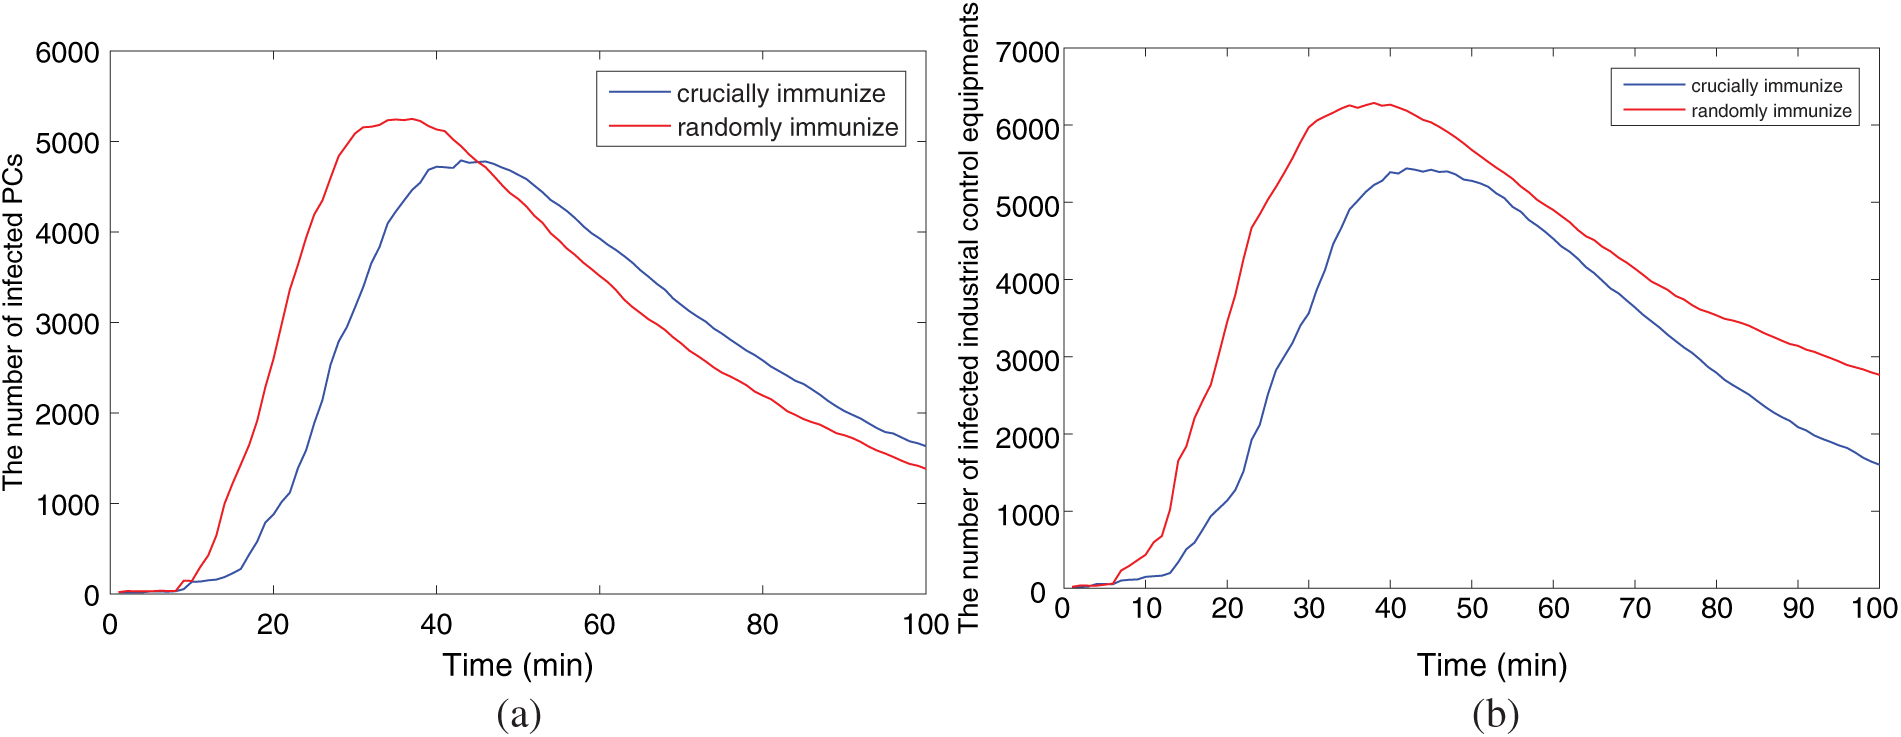
Figure 14: Crucial immune and random immune
Fig. 15 shows the effect of immunizing key nodes at different times. It is clear that the earlier the key node immunization is adopted, the lower the count of infected hosts. After t = 10, the sum of infected hosts remains nearly the same. It shows that t = 10 is a threshold, before t = 10, the earlier key node immunization is carried out, the more effective.
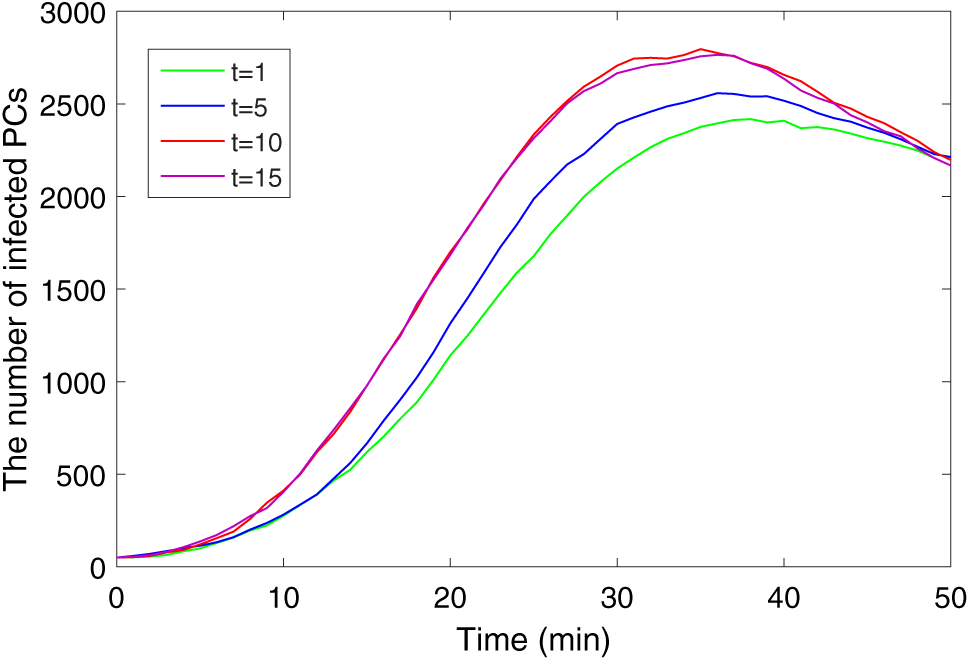
Figure 15: Impact of the immune time
To further verify this result, the crucial immune and random immune are compared at t = 10, the result is shown in Fig. 16. It can be seen that at t = 10, there is no obvious difference between the effects of crucial immune and random immune. Therefore, the earlier the immunization of key nodes, the better. After the malware spreads in the network, selecting key nodes for immunization will not have a significant effect.
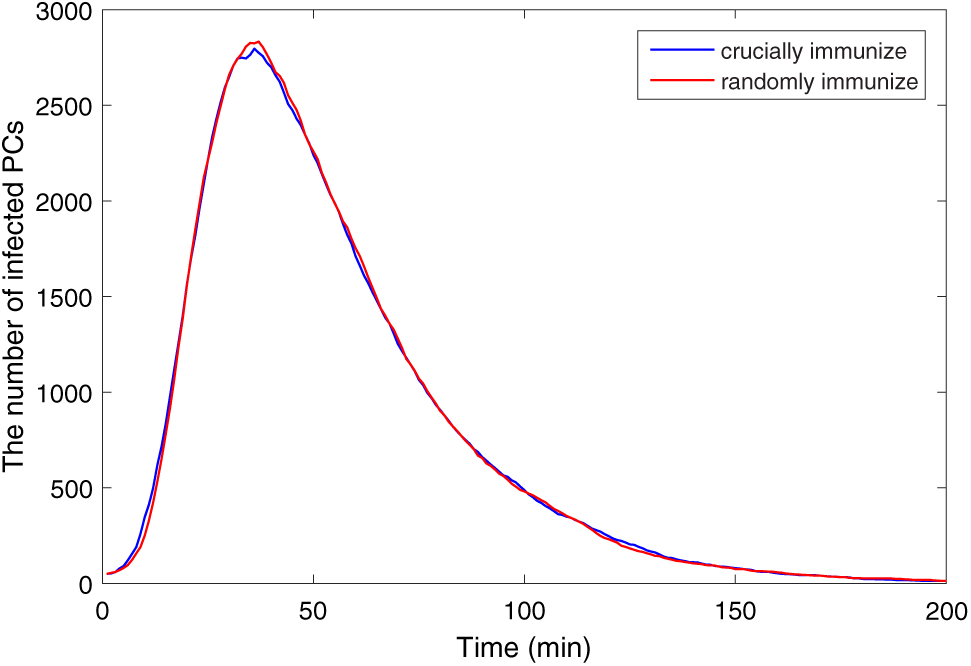
Figure 16: Crucial immune and random immune at t = 10
In addition, a comparison experiment is conducted to validate the impact of the containment strategy, the SIQMR model is compared with the classic SIR model. The experimental findings are depicted in Fig. 17. The number of infected equipment in the SIQMR model has been significantly reduced. Therefore, it can be proved that the containment strategy has an effective inhibitory effect on the spread of malware.
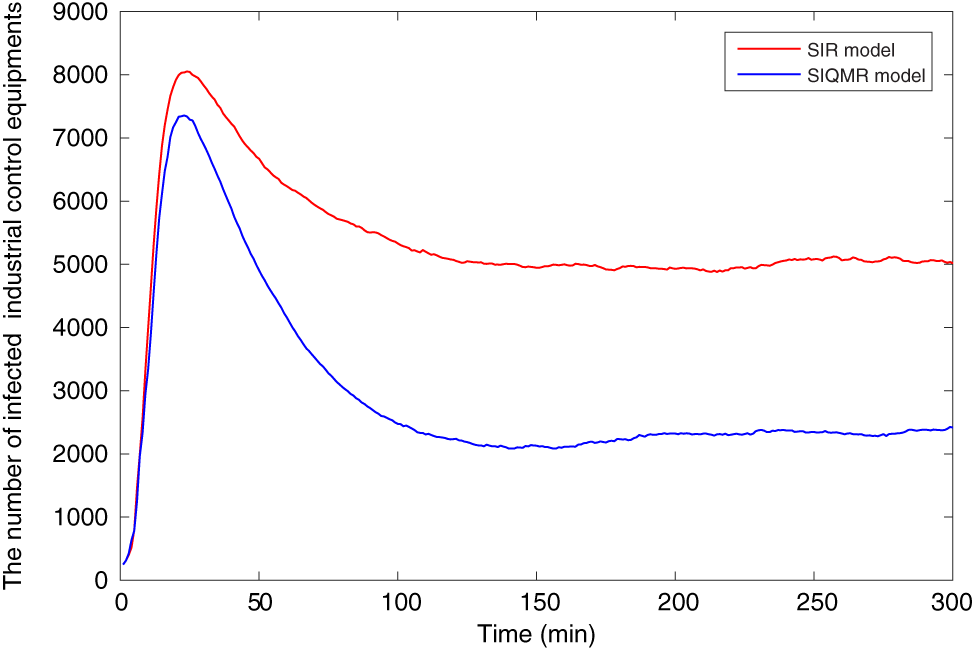
Figure 17: Comparison between SIR model and SIQMR model
In industrial environments, the industrial control network is often connected to other networks. To understand how malware spreads in this network, this research proposes a malware propagation model with a containment strategy. This strategy involves quarantining PCs and monitoring industrial control equipment. By analyzing the dynamics of the malware system, the proposed model identifies a disease-free equilibrium and an endemic equilibrium and calculate the basic reproduction number. Then simulation experiments are conducted to study the spread of malware and analyze the impact of various parameters. Additionally, this research examines the role of key nodes in the interconnected network. The findings lead to the following conclusions:
1. Key nodes are crucial in the network. If attackers target and infect these key nodes, the malware can rapidly propagate to numerous PC hosts and industrial control equipment.
2. Key nodes can be effectively utilized to suppress malware. Immunizing key nodes in advance can effectively inhibit the spread of malware.
3. Timely immunization of key nodes is crucial. Once the threshold is exceeded, immunizing key nodes becomes almost ineffective.
The analysis provides valuable insights for suppressing malware in industrial control networks, highlighting the importance of quarantine and monitoring as containment strategies. This research also recommends leveraging key nodes for defense against malware. Comparative experiments validate the viewpoints. The future research is to incorporate dynamic network topology structures and parameters that align better with real-world scenarios. Furthermore, actual industrial datasets will be used to verify the reliability of the proposed model.
Acknowledgement: This paper was supported by Scientific Research Project of Liaoning Province Education Department, and Liaoning Province Nature Fund Project. The authors also acknowledge with thanks to the “Ditecting Laboratory” of Northeastern University.
Funding Statement: This paper was supported by Scientific Research Project of Liaoning Province Education Department, Code: LJKQZ20222457 & LJKMZ20220781, and Liaoning Province Nature Fund Project, Code: No. 2022-MS-291.
Author Contributions: The authors confirm contribution to the paper as follows: Study conception and design: Q. Fu, J. Wang; analysis and interpretation of results: C. Si, J. Wang; draft manuscript preparation: Q. Fu, J. Liu.
Availability of Data and Materials: This article does not involve data availability and this section is not applicable.
Conflicts of Interest: The authors declare that they have no conflicts of interest to report regarding the present study.
References
1. L. J. Trautman and P. C. Ormerod, “Industrial cyber vulnerabilities: Lessons from stuxnet and the Internet of Things,” U. Miami L. Rev., vol. 72, no. 2, pp. 761, 2017. doi: 10.2139/ssrn.2982629. [Google Scholar] [CrossRef]
2. D. Gewirtz, “Night dragon: Cyberwar meets corpoiate espionage,” J. Counterter Homeland Secur. Int., vol. 17, no. 2, pp. 6, 2011. [Google Scholar]
3. B. Bencsáth, G. Pék, L. Buttyán, and M. Felegyhazi, “The cousins of Stuxnet: Duqu, flame, and gauss,” Future Int., vol. 4, no. 4, pp. 971–1003, 2012. doi: 10.3390/fi4040971. [Google Scholar] [CrossRef]
4. P. Maynard, K. Mclaughlin, and S. Sezer, “Modelling Duqu 2.0 malware using attack trees with sequential conjunction,” in 2nd ICISSP, Rome, Italy, 2016, pp. 465–472. [Google Scholar]
5. R. Spenneberg, M. Brüggemann, and H. Schwartke, “PLC-Blaster: A worm living solely in the PLC,” in Black Hat Asia 16, Las Vegas, NV, USA, Jul. 30–Aug. 4, 2016. [Google Scholar]
6. S. Raval, “Blackenergy a threat to industrial control systems network security,” Int J. Adv. Res. Eng. Sci. Technol, vol. 2, no. 12, pp. 120–125, 2015. [Google Scholar]
7. K. Munro, “Deconstructing flame: The limitations of traditional defences,” Comput. Fraud Secur., vol. 2012, no. 10, pp. 8–11, 2012. doi: 10.1016/S1361-3723(12)70102-1. [Google Scholar] [CrossRef]
8. M. Antonakakis et al., “Understanding the mirai botnet,” in USENIX Security 17, Vancouver, BC, Canada, 2017, pp. 1093–1110. [Google Scholar]
9. B. Brentan, P. Rezende, D. Barros, G. Meirelles, E. Luvizotto Jr and J. Izquierdo, “Cyber-attack detection in water distribution systems based on blind sources separation technique,” Water, vol. 13, no. 6, pp. 795, 2021. doi: 10.3390/w13060795. [Google Scholar] [CrossRef]
10. I. N. Fovino, M. Masera, L. Guidi, and G. Carpi, “An experimental platform for assessing SCADA vulnerabilities and countermeasures in power plants,” in 3rd ICHSI, Rzeszow, Poland, 2010, pp. 679–686. [Google Scholar]
11. H. Kheddar, Y. Himeur, and A. I. Awad, “Deep transfer learning for intrusion detection in industrial control networks: A comprehensive review,” J. Netw. Comput. Appl., vol. 220, no. 10, pp. 103760, 2023. doi: 10.1016/j.jnca.2023.103760. [Google Scholar] [CrossRef]
12. Y. Hui, “Key nodes in complex networks identified by multi-attribute decision-making method,” Acta Physica Sinica, vol. 62, no. 2, pp. 020204, 2013. doi: 10.7498/aps.62.020204. [Google Scholar] [CrossRef]
13. M. Kitsak et al., “Identifification of influential spreaders in complex networks,” Nature Phys., vol. 6, no. 11, pp. 888–893, 2010. doi: 10.1038/nphys1746. [Google Scholar] [CrossRef]
14. H. Liu, X. Xu, J. A. Lu, G. Chen, and Z. Zeng, “Optimizing pinning control of complex dynamical networks based on spectral properties of grounded laplacian matrices,” IEEE Trans. Syst., Man, Cybernet.: Syst., vol. 51, no. 2, pp. 786–796, 2021. doi: 10.1109/TSMC.2018.2882620. [Google Scholar] [CrossRef]
15. A. L. Lloyd and R. M. May, “Epidemiology: How viruses spread among computers and people,” Sci., vol. 292, no. 5, pp. 1316–1317, 2001. doi: 10.1126/science.1061076 [Google Scholar] [PubMed] [CrossRef]
16. A. M. D. Rey, G. Hernández, A. B. Tabernero, and A. Q. Dios, “Advanced malware propagation on random complex networks,” Neurocomputing, vol. 423, no. 29, pp. 689–696, 2020. [Google Scholar]
17. S. Hosseini, M. A. Azgomi, and A. R. Torkaman, “Agent-based simulation of the dynamics of malware propagation in scale-free networks,” Simul., vol. 92, no. 7, pp. 709–722, 2016. doi: 10.1177/0037549716656060. [Google Scholar] [CrossRef]
18. L. Yuan, “The research on control strategy of worms spread in complex network in industry,” Adv. Mater. Res., vol. 487, pp. 758–763, 2012. doi: 10.4028/www.scientific.net/AMR.487.758. [Google Scholar] [CrossRef]
19. K. Viswalingam and E. E. Solomon, “Mining user profile exploitation cluster from computer program logs,” Int. J. Ph.Technol., vol. 8, no. 4, pp. 23855–23861, 2016. [Google Scholar]
20. M. Dickison, S. Havlin, and H. E. Stanley, “Epidemic on interconnected networks,” Phys. Rev. E, vol. 85, no. 6, pp. 066109, 2012. doi: 10.1103/PhysRevE.85.066109 [Google Scholar] [PubMed] [CrossRef]
21. Z. Masood, M. A. Z. Raja, N. I. Chaudhary, K. M. Cheema, and A. H. Milyani, “Fractional dynamics of stuxnet virus propagation in industrial control systems,” Math., vol. 9, no. 17, pp. 2160, 2021. doi: 10.3390/math9172160. [Google Scholar] [CrossRef]
22. L. Li, J. Cui, R. Zhang, H. Xia, and X. Cheng, “Dynamics of complex networks: Malware propagation modeling and analysis in industrial internet of things,” IEEE Access, vol. 8, pp. 64184–64192, 2020. doi: 10.1109/ACCESS.2020.2984668. [Google Scholar] [CrossRef]
23. S. Shen, L. Xie, Y. Zhang, G. Wu, H. Zhang and S. Yu, “Joint differential game and double deep Q-networks for suppressing malware spread in industrial Internet of Things,” IEEE Trans. Inf. Forens. Secur., vol. 18, pp. 5302–5315, 2023. doi: 10.1109/TIFS.2023.3307956. [Google Scholar] [CrossRef]
24. G. Wu, L. Xie, H. Zhang, J. Wang, S. Shen and S. Yu, “STSIR: An individual-group game-based model for disclosing virus spread in social Internet of Things,” J. Netw. Comput. Appl., vol. 214, no. 3, pp. 103608, 2023. doi: 10.1016/j.jnca.2023.103608. [Google Scholar] [CrossRef]
25. Y. Shen, S. Shen, Q. Li, H. Zhou, Z. Wu and Y. Qu, “Evolutionary privacy-preserving learning strategies for edge-based IoT data sharing schemes,” Dig. Commun. Netw., vol. 9, no. 4, pp. 906–919, 2023. doi: 10.1016/j.dcan.2022.05.004. [Google Scholar] [CrossRef]
26. S. Yu et al., “Deep Q-network-based open-set intrusion detection solution for industrial Internet of Things,” IEEE Internet Things J., Early Access, 2023. doi: 10.1109/JIOT.2023.3333903. [Google Scholar] [CrossRef]
27. S. Shen et al., “Deep Q-network-based heuristic intrusion detection against edge-based SIoT zero-day attacks,” Appl. Soft Comput., vol. 150, pp. 111080, 2024. doi: 10.1016/j.asoc.2023.111080. [Google Scholar] [CrossRef]
28. S. Shen, X. Wu, P. Sun, H. Zhou, Z. Wu and S. Yu, “Optimal privacy preservation strategies with signaling Q-learning for edge-computing-based IoT resource grant systems,” Expert Syst. Appl., vol. 225, no. 3, pp. 120192, 2023. doi: 10.1016/j.eswa.2023.120192. [Google Scholar] [CrossRef]
29. D. E. Denning, “An intrusion-detection model,” IEEE T. Software Eng., vol. 13, no. 2, pp. 222–232, 1987. [Google Scholar]
30. L. Wang, G. Zhu, H. Kang, and X. Fu, “Epidemic spreading on three-layer interdependent networks,” J. Biol. Syst., vol. 24, no. 4, pp. 469–494, 2016. doi: 10.1142/S0218339016500248. [Google Scholar] [CrossRef]
31. O. Diekmann, J. Heesterbeek, and J. Metz, “On the definition and the computation of the basic reproduction ratio R0 in models for infectious diseases in heterogeneous populations,” J. Math. Biol, vol. 28, pp. 365–382, 1990 [Google Scholar] [PubMed]
32. X. Fu, M. Small, and G. Chen, “Epidemic threshold analysis,” in Propagation Dynamics on Complex Networks: Models, Methods and Stability Analysis, 1st ed. Beijing, China: Higher Education Press, 2014, pp. 63–66. [Google Scholar]
33. P. Dreessche and J. Watmough, “Reproduction numbers and sub-threshold endemic equilibria for compartmental models of disease transmission,” Math. Biosci., vol. 180, no. 1–2, pp. 29–48, 2002. doi: 10.1016/S0025-5564(02)00108-6 [Google Scholar] [PubMed] [CrossRef]
34. A. E. Motter, C. S. Zhou, and J. Kurths, “Networks synchronization, diffusion, and the paradox of heterogeneity,” Phys. Rev. E., vol. 71, no. 1, pp. 1–10, 2005. doi: 10.1103/PhysRevE.71.016116 [Google Scholar] [PubMed] [CrossRef]
35. Q. Fu, Y. Yao, C. Sheng, and W. Yang, “Interplay between malware epidemics and honeynet potency in industrial control system network,” IEEE Access, vol. 8, pp. 81582–81593, 2020. doi: 10.1109/ACCESS.2020.2989612. [Google Scholar] [CrossRef]
36. C. C. Chavez, Z. Feng, and W. Huang, “On the computation of R0 and its role on global stability,” Inst. Math. Appl., vol. 125, pp. 31–65, 2002. [Google Scholar]
Cite This Article
 Copyright © 2024 The Author(s). Published by Tech Science Press.
This work is licensed under a Creative Commons Attribution 4.0 International License , which permits unrestricted use, distribution, and reproduction in any medium, provided the original work is properly cited.
 Downloads
 Citation Tools