
 Submit a Paper
 Propose a Special lssue
 Open Access
ARTICLE

U-Net Inspired Deep Neural Network-Based Smoke Plume Detection in Satellite Images
1 Centre for Cyber Physical Systems, Vellore Institute of Technology (VIT), Chennai, Tamil Nadu, 600127, India
2 School of Computer Science and Engineering, Vellore Institute of Technology (VIT), Chennai, Tamil Nadu, 600127, India
* Corresponding Author: Ayesha Shaik. Email:
(This article belongs to the Special Issue: Machine Vision Detection and Intelligent Recognition)
Computers, Materials & Continua 2024, 79(1), 779-799. https://doi.org/10.32604/cmc.2024.048362
Received 05 December 2023; Accepted 30 January 2024; Issue published 25 April 2024
 View Full Text
 Download PDF
Abstract
Industrial activities, through the human-induced release of Green House Gas (GHG) emissions, have been identified as the primary cause of global warming. Accurate and quantitative monitoring of these emissions is essential for a comprehensive understanding of their impact on the Earth’s climate and for effectively enforcing emission regulations at a large scale. This work examines the feasibility of detecting and quantifying industrial smoke plumes using freely accessible geo-satellite imagery. The existing system has so many lagging factors such as limitations in accuracy, robustness, and efficiency and these factors hinder the effectiveness in supporting timely response to industrial fires. In this work, the utilization of grayscale images is done instead of traditional color images for smoke plume detection. The dataset was trained through a ResNet-50 model for classification and a U-Net model for segmentation. The dataset consists of images gathered by European Space Agency’s Sentinel-2 satellite constellation from a selection of industrial sites. The acquired images predominantly capture scenes of industrial locations, some of which exhibit active smoke plume emissions. The performance of the above-mentioned techniques and models is represented by their accuracy and IOU (Intersection-over-Union) metric. The images are first trained on the basic RGB images where their respective classification using the ResNet-50 model results in an accuracy of 94.4% and segmentation using the U-Net Model with an IOU metric of 0.5 and accuracy of 94% which leads to the detection of exact patches where the smoke plume has occurred. This work has trained the classification model on grayscale images achieving a good increase in accuracy of 96.4%.Keywords
The degree of Green House Gas (GHG) emissions that result from industrial activities and their contribution to global warming is a noteworthy and concerning environmental issue. Extensive research has been conducted to evaluate the scope of these emissions and their hazardous influence on the Earth’s climate system. A Keynote address by the Intergovernmental Panel on Climate Change (IPCC) Chair Hoesung Lee at the opening of the First Technical Dialogue of the Global Stocktake conducted on June 10, 2022, provided reports that prove that climate change poses a grave danger to our planet. According to the findings of the climate change mitigation report, the progress in curbing global warming to 1.5°C falls short of expectations. Over the past twenty years the average annual greenhouse gas (GHG) emissions have reached unprecedented levels in human history and gradually it is becoming increasingly difficult to control it [1]. The current situation demands to be acted upon immediately and effectively to save this planet and the well-being of its inhabitants.
There are so many limitations and issues in existing methods that are being addressed in this work in detecting the smoke plumes using satellite images. Firstly, current tools lack the performance and accuracy needed to accurately identify smoke plumes in the industrial area. Sometimes, it misclassified the clouds and other things as smoke plumes. This causes false alarms while deploying the emergency teams for rescue, that is why existing methods are less reliable. Small forest fires or those hidden by a dense canopy are difficult to find with satellite imagery [2].
Secondly, the primary method for detecting smoke plumes of existing technologies is based on colored images. However, by using color images, it is more difficult for a model to give correct predictions with good accuracy because there are so many colors in color images that make it difficult to distinguish between smoke plumes and other colors, especially in climate situations. Hence the smoke plume detection accuracy is affected. Furthermore, real-time or almost real-time detection and tracking capabilities might not be offered by the current technologies.
The algorithms and techniques of smoke plume detection and its identification have evolved over the years. There are several methods including deep learning models like Convolutional Neural Networks (CNN) or computer vision algorithms. The CNN approaches often make use of approaches like optical flow analysis or frame differencing to detect smoke plumes and accurately delineate smoke patches. Smoking plumes are recognized as the target class in a huge collection of labeled photos on which the network is developed [3].
The proposed system leverages ResNet-50 to achieve precise smoke region detection and incorporates a powerful processor for fast real-time image processing [4]. The motivation factor for doing this work is that there is an urgent need to understand the effect of these smoke plumes in industrial areas. Wildfires are becoming increasingly destructive and devastating. Wildfires are frequently discovered after they are out of control due to their rapid spread, and as a result, they have billion-scale consequences in a very short period [5]. In this study, the objective is to develop a model for accurately identifying the smoke plumes in industrial areas and see what effect they are making in the increase of global warming. It is well known that there is an impact of industrial activities on global warming. This study aims to contribute to a better understanding of how much impact these industrial activities have on global warming by developing an accurate and good performance model to detect and quantify the amount of smoke using freely available geo-satellite data.
The three main objectives of this work are to investigate the possibility of detecting and quantifying the amount of smoke plumes present in a single image by using freely available geo-satellite multi-band images. First, the classification is done to classify the images from the images that do not have the smoke plumes in them. The second objective is to utilize the effectiveness of grayscale images over colored images for the detection of smoke plumes. In this study, both types of methods are used to train the model and by using the grayscale imagery, it is clearly shown that there is a notable increase in accuracy and performance in the results. The third objective is to accurately detect and quantify the smoke plumes and smoke plumes area for the contribution towards understanding the effect and impact of industrial activities in the increase of global warming. This last objective shows the broader perspective of this research work. Additionally, this work aims to support the enforcement of fire regulations by developing an improved working model for them to monitor wildfires and identify their sources so that they can be stopped as soon as possible.
The key highlights of this work include the detection of smoke plumes in the industrial area using freely available geo satellite multi-band images, the use of grayscale images over colored images to improve the accuracy and performance of the work, the contribution in understanding the impact of industrial fire on global warming and to provide improved tools to the professionals to monitor the smoke plumes through the clouds to identify the fire in its early stage so that it can be stopped early without doing much damage. The importance of the research’s findings resides in their potential to improve the measurement and monitoring of industrial smoke plumes. The study provides a low-cost and widely applicable method to identify and measure smoke plumes, assisting early warning systems and emergency response planning. This method makes use of Sentinel-2 satellite data. Grayscale picture analysis sheds light on a detection technique that could be more precise. The results ultimately assist the implementation of emission restrictions and attempts to lessen the negative consequences of climate change, addressing the critical need for improved understanding and control of industrial emissions.
This work proposed in [6] uses an algorithm called the Scattering-Based Smoke Detection Algorithm (SSDA) to overcome obstacles. It primarily relies on the visible and infrared imaging radiometer suite (VIIRS) blue and green bands. In [7], an automated detection model uses a deep learning approach to detect smoke plumes by obtaining shortwave reflectance data from the Geostationary Operational Environmental Satellite R series. The study in [8] discusses the feasibility of detecting industrial smoke plumes was explored using satellite images on a global scale and applying ResNet-50 and U-Net models. An affordable solution using images from NASA’s Aqua and Terra satellites is presented in [9] with an overview of the latest innovations and advancements in neural network-based techniques for object detection. The work [10] implemented a Gradient-weighted Class Activation Mapping (Grad-CAM) to verify whether the detected regions corresponded to the actual smoke areas in the image. The evaluation algorithms included ResNet and EfficientNet models.
A two-stage smoke detection (TSSD) algorithm has been implemented on a lightweight detection algorithm in [11] to monitor the effect of real-time factory smoke. The work discussed in [12] involves a combination of deep learning and dynamic background modeling to mitigate false alarms. It employed a Single Shot MultiBox Detector (SSD) deep learning network for initial smoke detection and ViBe dynamic background modeling technique to identify dynamic regions within the video. The study [13], presented an innovative technique for smoke characterization by employing wavelets and support vector machines and raising minimal false alarms. In [14], a masking technique in the HSV color space is implemented to identify smoke-colored pixels and to apply temporal frame differencing. The optical flow of smoke is determined using texture information obtained from a Gabor filter bank with preferred orientations. The work proposed in [15] introduces a novel neural architecture called W-Net to address the highly ill-posed nature of smoke where multiple stacked convolutional encoder-decoder structures define the model.
The work [16] uses deep learning techniques and methods to detect fire and smoke. It aims to develop a model which can keep learning and adapting new information without forgetting past information. The work discussed in [17] contains all the methods and algorithms to detect smoke and fire in the air that depend on visual data. In [18], a deep learning model is suggested that uses a self-attention network. The work proposed in [19] can distinguish smoke plumes from aerial photographs. CNN is used to extract information and distinguish each image into two categories containing smoke and not containing smoke. The work discussed in [20] uses an end-to-end structured network to detect fire and smoke areas. Deep learning algorithms are used to develop an end-to-end structured network to extract important information related to fire and smoke from the input images.
The work discussed in [21] has two main components: Dynamic feature model and smoke object segmentation. The model can spot and detect the smoke present in the images and can accurately segment the smoke area with high accuracy. The work [22] model uses deep learning methods for performance and accurate detection of smoke in between clouds and other misleading things. It aims to improve forest fire surveillance using a learning-based system. The work proposed in [23] can detect fire and smoke in visual-colored images using image processing and machine learning algorithms. The approach of computer vision includes many intermediate and crucial steps such as feature extraction, classification, and image preprocessing. In [24], the model Deep Smoke detects the smoke in smoke areas in the images dataset. To extract the features of images, the study uses convolutional neural networks (CNNs) for smoke detection. The work discussed in [25] suggests a system for early forest fire detection using these two hardware’s capabilities, a DJI M300 drone and an H20T camera.
The steps involved in detecting smoke plumes are depicted in Fig. 1. The first step is to obtain the images via satellite. The images are then preprocessed, which includes grayscale conversion and histogram equalization. The preprocessed images are then fed into a ResNet-50 model for image classification. The classified images are then fed into a U-Net model for image segmentation. The U-Net model produces a segmentation mask that shows where the smoke plumes are in the image.
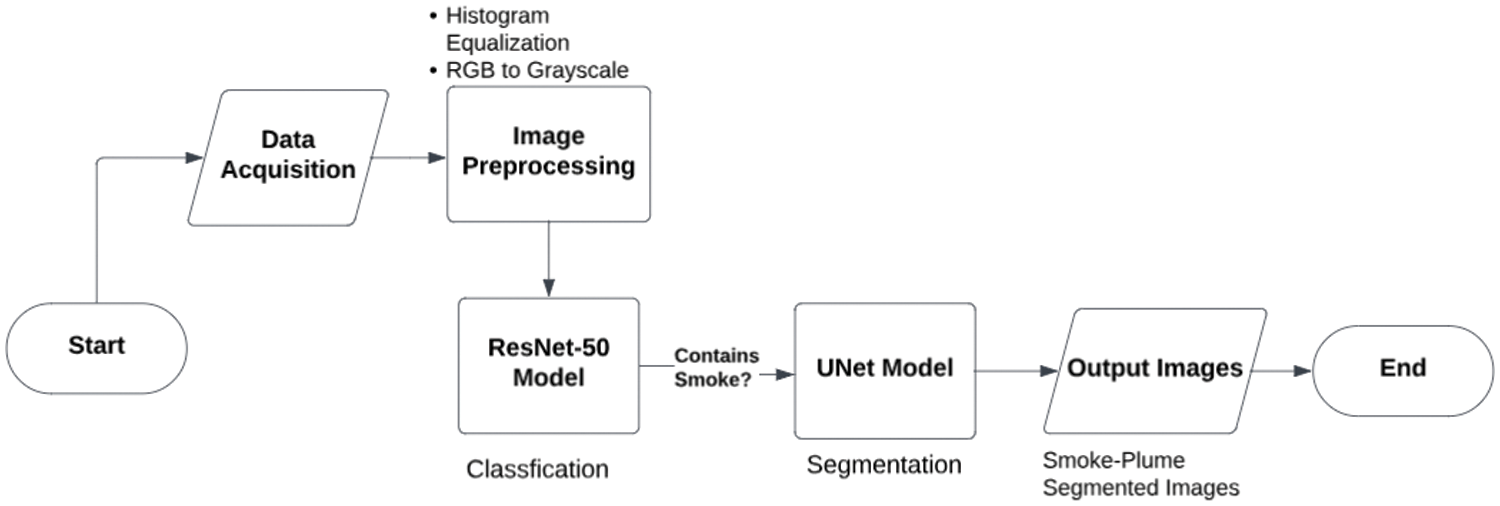
Figure 1: Flow of the proposed method
Four important blocks make up the block diagram shown in Fig. 2, which depicts the various phases of a smoke plume’s detection and segmentation. Every block is important to the overall process. Each block is briefly described below.
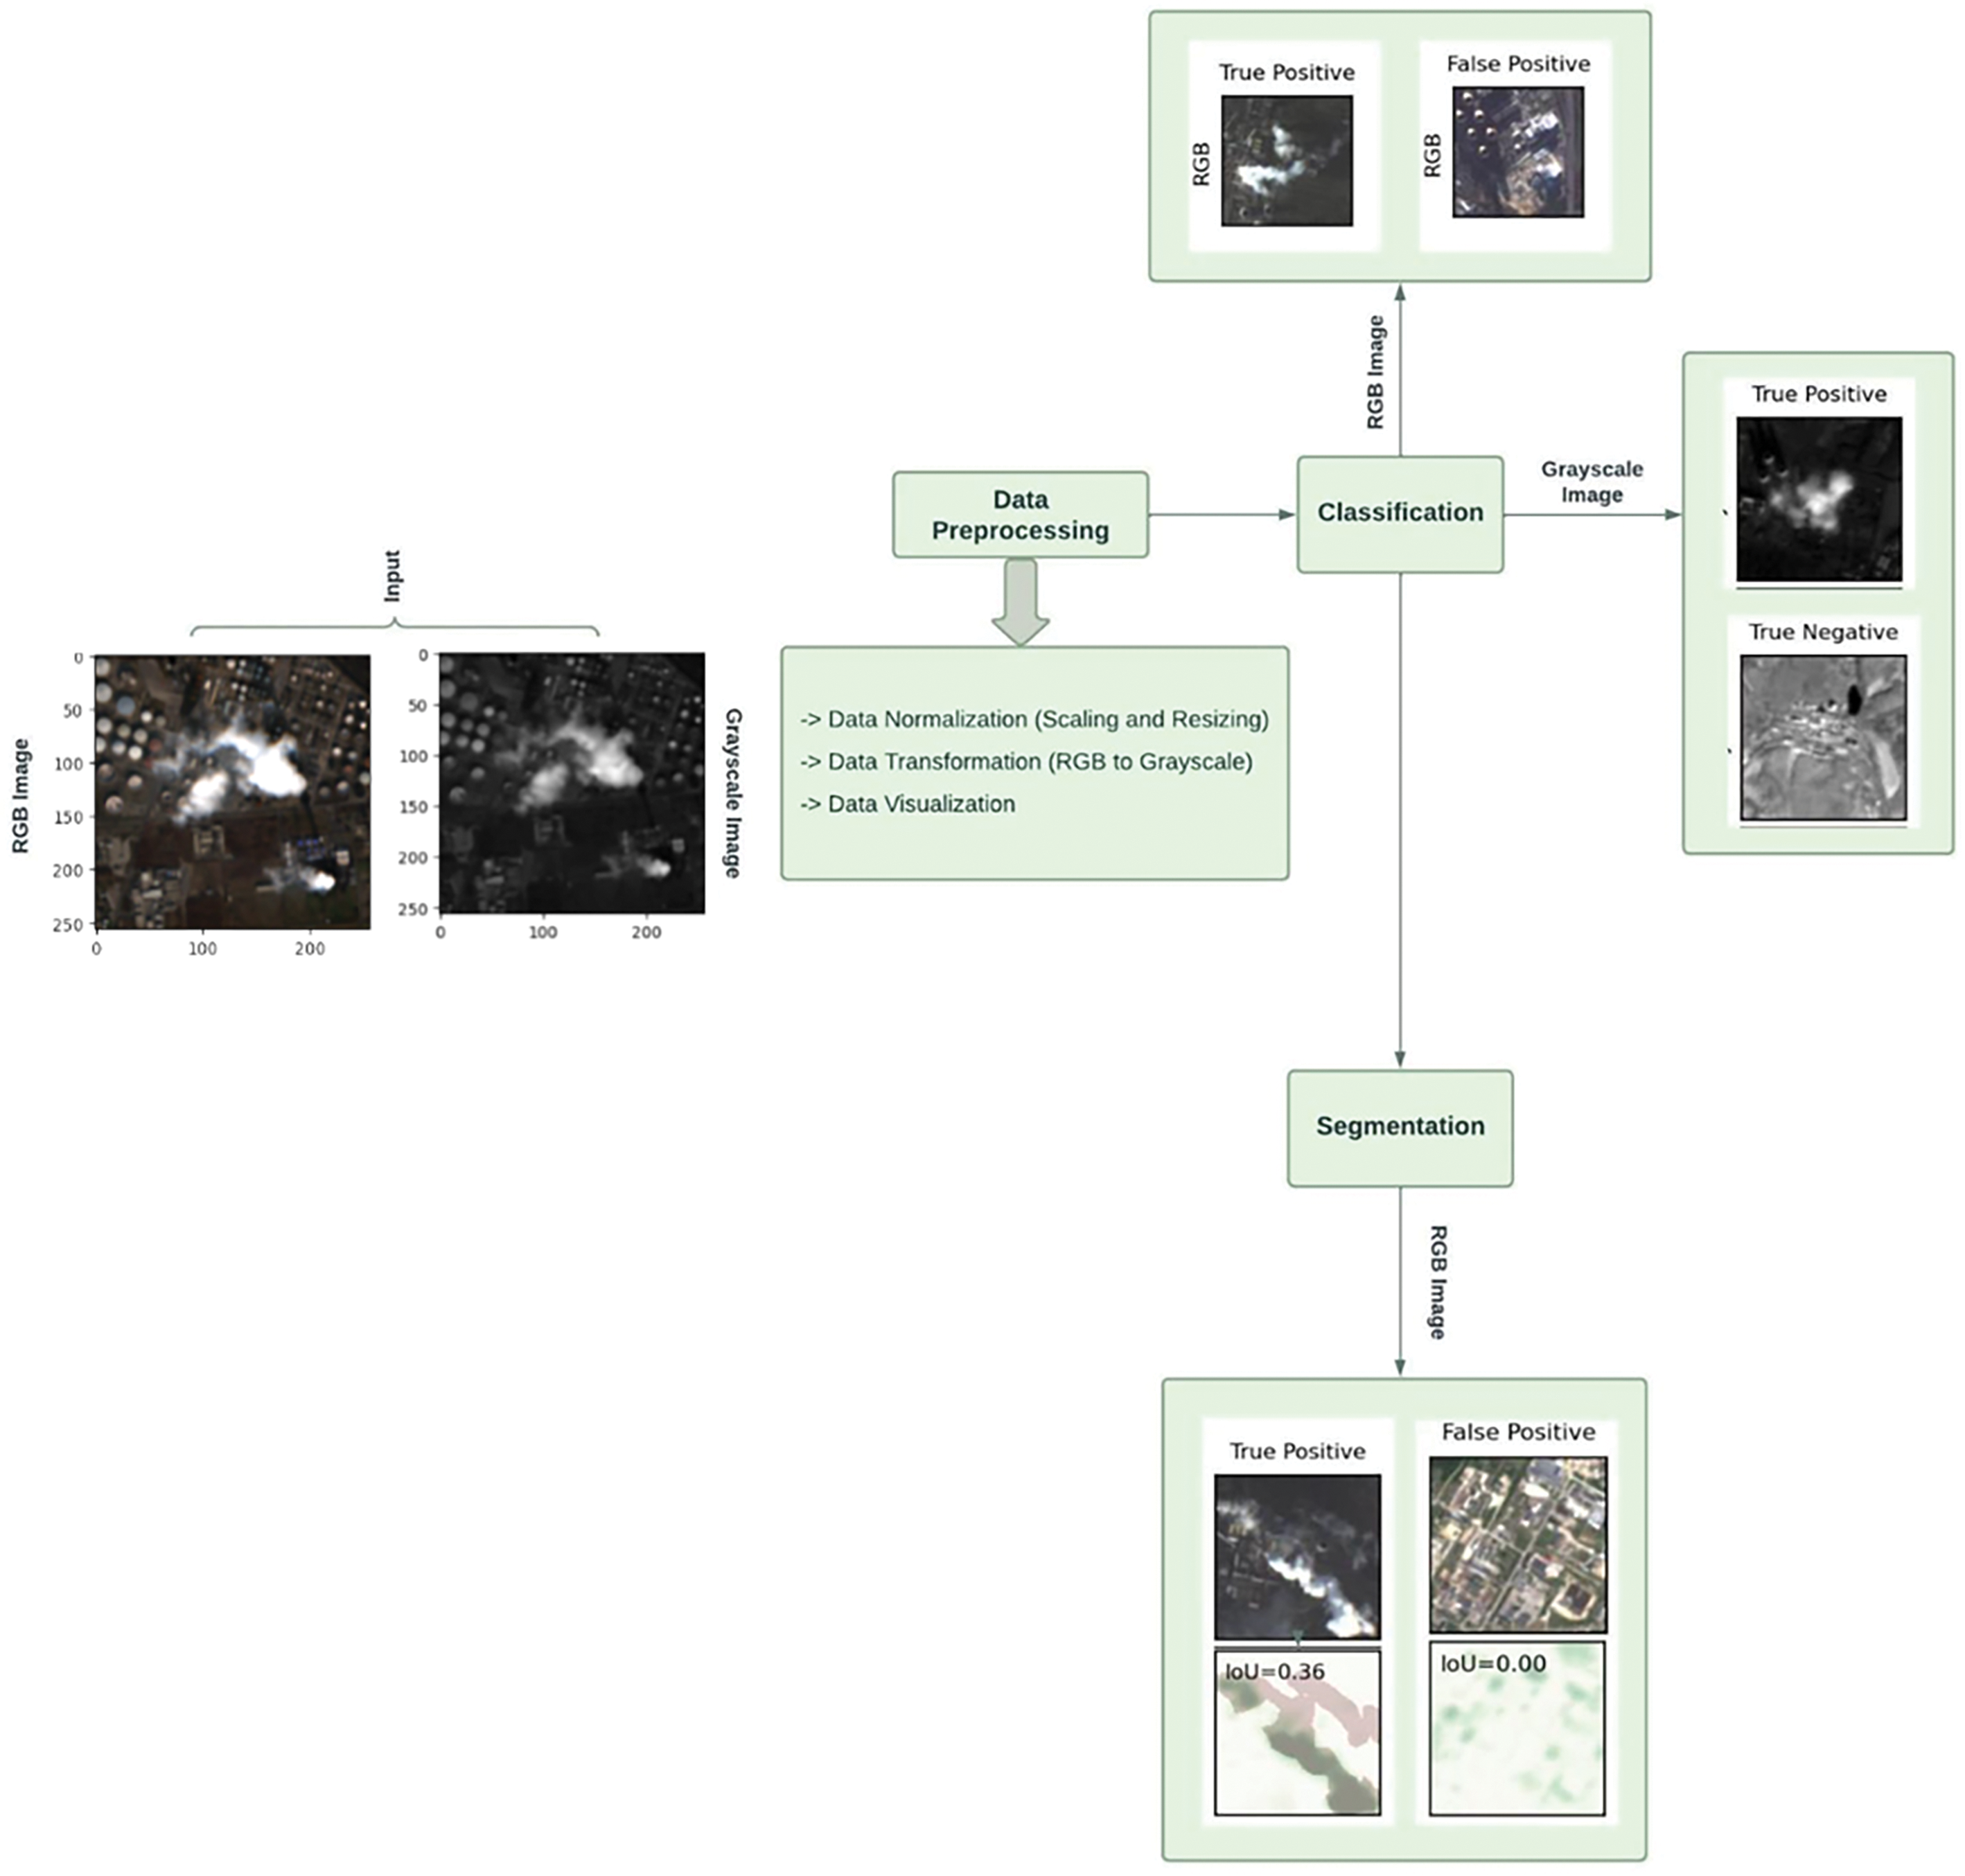
Figure 2: Block diagram of the proposed system
The first block of the block diagram is input, in this, the colored images that may or may not contain smoke plumes are used as input in the initial block. The ensuing blocks take this input block as the main source of image data for training, preprocessing, and evaluation. In this work, a dataset of geo satellite-colored images is used, and some images contain smoke plumes and the rest do not contain them. So, classification needs to be done with good accuracy to distinguish images containing smoke plumes from images without smoke plumes.
In this block, some crucial steps are performed on the loaded data before feeding into the classification and segmentation models. The steps are as follows.
In this step, the data need to be normalized to get good accuracy of the model. Major steps of normalization of image data include scaling the image pixel value from 0 to 1 for consistency in the data which can be seen in Eq. (1). Data normalization can also happen by standardizing the images using mean and standard deviation.
In the image dataset, two classes are there. One is an image with smoke plumes and the other is an image without smoke plumes. This is a binary classification, but the class distribution is not balanced. The data is transformed using data up-sampling to make the class distribution balanced. The second data transformation that is happening is RGB images to grayscale images. This transformation might help in increasing the model’s performance and accuracy.
To improve the contrast and visibility of key details in the grayscale photos, use histogram equalization. By redistributing the pixel intensities, histogram equalization improves the quality of the image and makes it easier to distinguish between important elements.
This is a binary classification problem, in this work the ResNet-50 pre-trained model is used to distinguish smoke plumes containing images from the other one. After training the model on train data, evaluation is done on the test data to evaluate the model on unseen image data. This block returns classified images as a result by using those images, accuracy and other key parameters can be calculated. Fig. 3 shows the implemented architecture for the ResNet-50 Model. Here is a general formula for the ResNet-50 model as shown in Eq. (2).
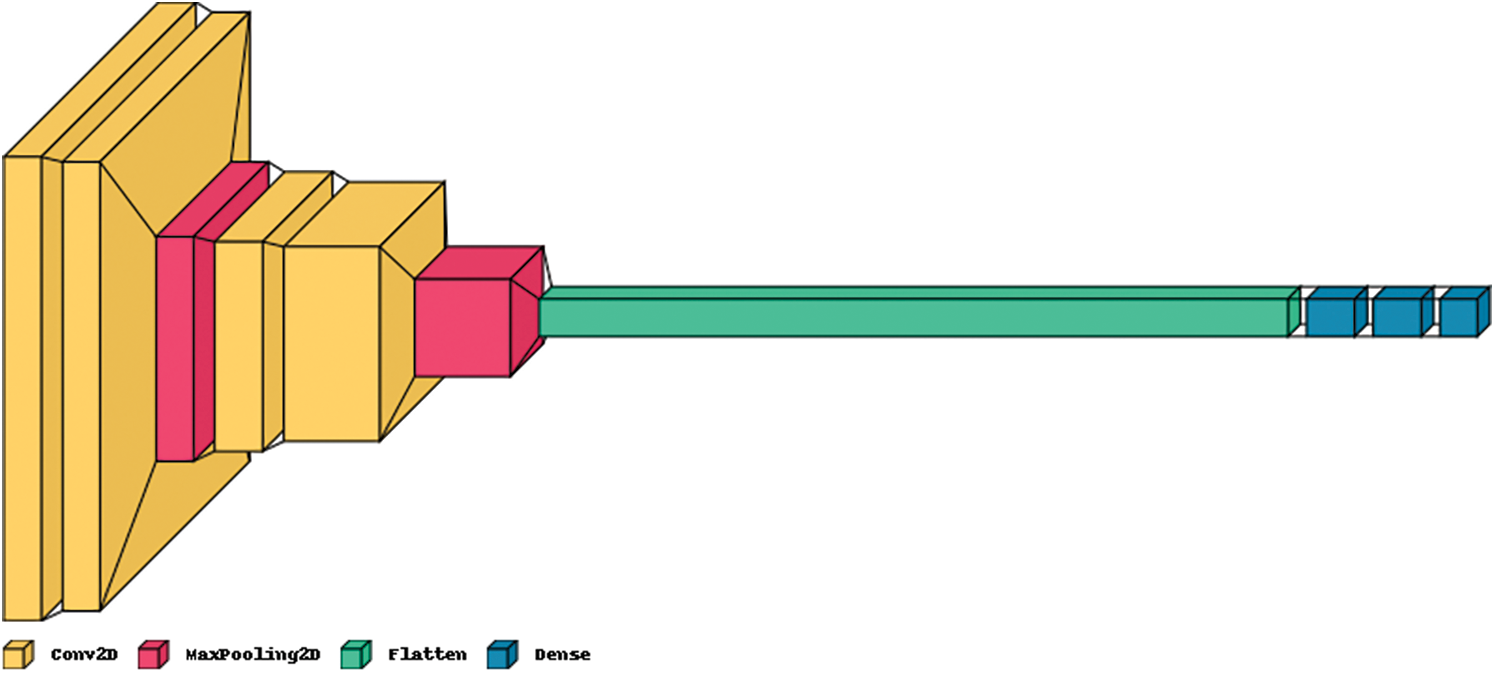
Figure 3: Architecture of ResNet-50 model
Here FC_K describes the Kth fully connected layer, BN_M describes the Mth bottleneck layer and ConvN describes the Nth convolutional layer.
After classifying the images, to segment the smoke area of an image, a pre-trained model U-Net is used. The training and evaluation of a UNet model for smoke segmentation are the main topics of this block. The dataset contains images with smoke plumes and segmentation labels to feed to the U-Net model to create a segmentation boundary.
After training the U-Net model, evaluation of the U-Net model is done using test image data that the model has not seen before. To evaluate the precision and performance of the model, measures like Intersection-over-Union (IoU), and Jaccard accuracy are used.
The proposed system takes RGB images gathered by ESA’s Sentinel-2 satellite constellation from a selection of industrial sites. The collected data is loaded onto the system for further manipulation. As shown in Fig. 4, the collected RGB images require some standardization procedure to bring them all to a uniform and usable format, therefore, we perform Data Normalization on the entire dataset.
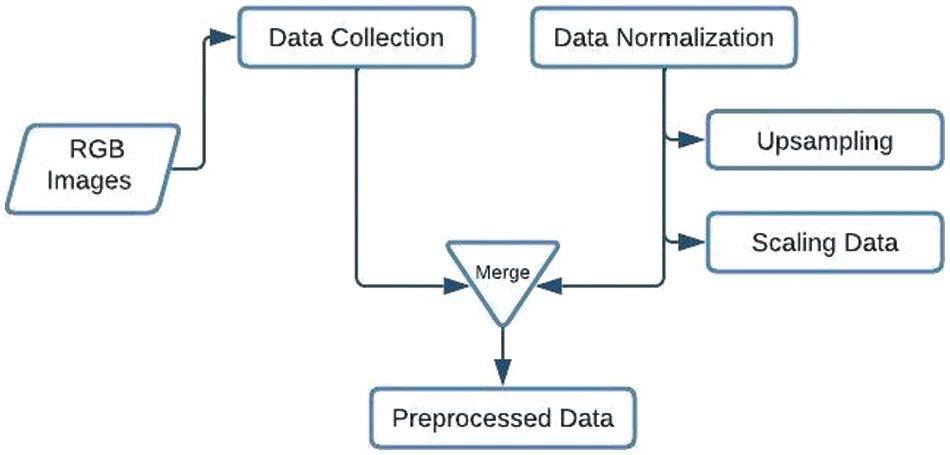
Figure 4: Workflow for processing RGB images
In Fig. 5, it is depicted how RGB images are collected from the satellite imagery and then normalized for further processing. To improve accuracy and enhance model performance, this paper took a novel approach to convert RGB images to grayscale which led to better results, and it was also able to overcome the challenges faced by the limitation of RGB images.
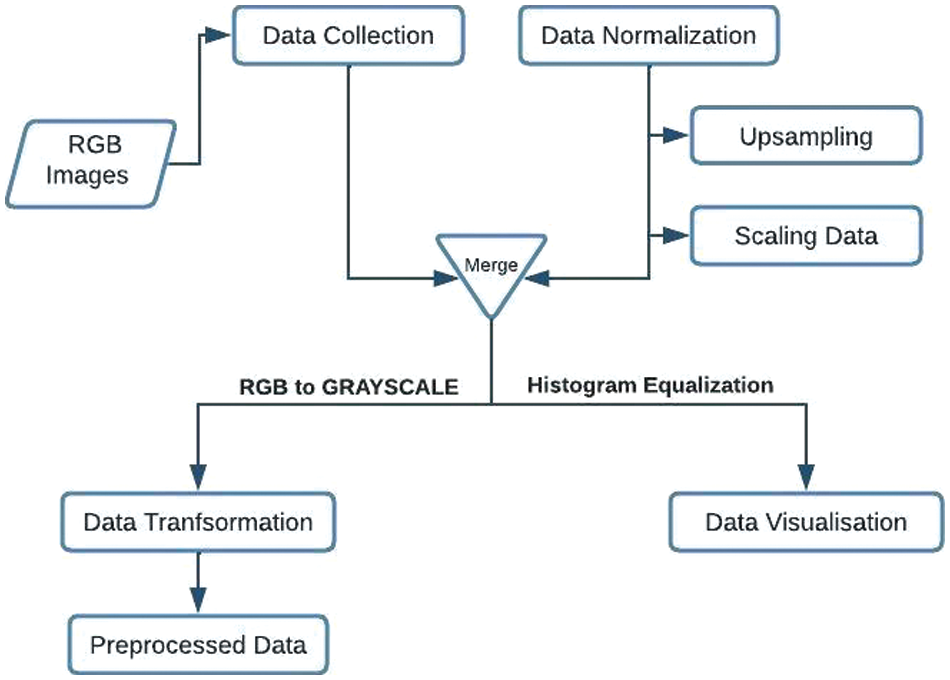
Figure 5: Workflow for processing grayscale images
Eq. (3) shows the manipulation required for converting each RGB image to a grayscale image, where the pixels of the images are stored in the form of an array. The pixels are averaged out to convert them into grayscale. Grayscale images reduce the number of false interpretations and complexities. In addition to it, in this approach, Histogram Equalization is also performed to visualize the image dataset. Fig. 6 shows a sample representation of an image containing a smoke plume.

Figure 6: Smoke density visualized via histogram equalization
The peak in Fig. 6 depicts the intensity of the smoke plume and the width of the peak demonstrates how far the smoke plume spread is across a specific area in the given image. Fig. 7 depicts the major and final steps that settle the entire model and architecture. Once the data is processed it undergoes two modeling processes—Classification via ResNet-50 and Segmentation via U-Net.
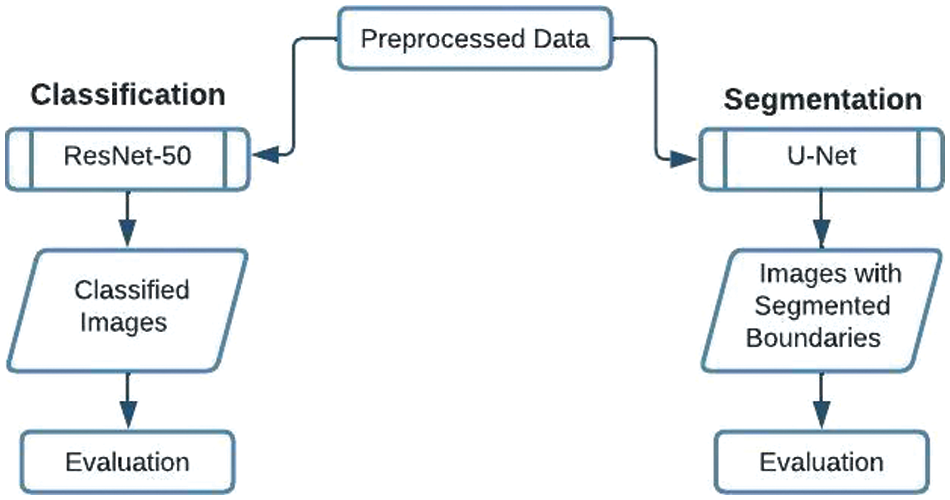
Figure 7: Sequential flow depicting classification and segmentation
Initially, the preprocessed RGB images are trained via a customized ResNet-50 architecture. The purpose of this step is to first train the images and classify them into two categories to distinguish whether or not the images contain any smoke plume. The model is thoroughly trained and saved for evaluation purposes. This algorithm was able to achieve a decent accuracy of 94.3% on the training set and an accuracy of 94% against the test data set.
Next, the innovative method of applying this algorithm to grayscale images led to a significant increase in accuracy. During the model training, an accuracy of 96.4% was obtained and during the evaluation of the model, it could obtain an accuracy of 96.6%. This approach not only achieved a higher percentage of accuracy but also performed lesser computations with more precise and valid results.
This process involves the segmentation of both RGB and grayscale images individually. Once the dataset was loaded, initially the focus was to identify patches of smoke plume against manually computed segmented labels. This step was a foundation to observe and ideate further stages. Moving forward, the image dataset was trained through a custom U-Net model along with the segmented labels to achieve more precise results and better efficiency. The overall accuracy attained was 94.0% where the model can identify smoke plume patches and the IoU (Intersection-over-Union) metric justifies the intensity by comparing the percentage of overlap of smoke detected, i.e., the predicated mask in the trained image to that which appears in the original image or ground truth mask. Eq. (4) shows how IoU can be mathematically represented.
It is observed that IoU can be calculated as a ratio of the Area of Overlap (overlapped area between the predicted region and the ground truth region) to the Area of Union (The total area covered by the predicted region and the ground truth region), where |A ∩ B| denotes the cardinality (number of elements) of the intersection of sets A and B and |A ∪ B| denotes the cardinality of the union of sets A and B.
4 Experimental Results and Discussion
The Google Colab platform, which offered GPU acceleration for effective training on huge datasets, was used to create and run the models U-Net and ResNet-50. Several Python modules were used to improve the modeling process and optimize performance. Notably, TensorFlow and Keras were important in the model’s development, compilation, and training. NumPy was used to manage arrays effectively, and OpenCV made reading and processing images easier. The results obtained from the experimental analysis are presented and analyzed and a comprehensive discussion has been done on the findings.
The hardware and software requirements for the work are as follows.
Any Operating System Windows/Linux/MacOS, python programming language for deep learning algorithms, necessary deep learning frameworks such as PyTorch and TensorFlow. If using an NVIDIA GPU, CUDA, and cuDNN libraries to leverage GPU acceleration for model training.
As a tester or developer, a high-performance computing system is needed for running deep learning algorithms and a high-speed internet connection for model training and evaluation. As a user, just a computer with an operating system and internet connection is enough to use this system.
For data loading, data transformation, model training, and evaluation, Google Collab is used in this work. PyTorch is a widely used deep learning framework and in this work, PyTorch is used to load pre-trained models such as ResNet-50 for image classification and U-Net for image segmentation. In this work, scikit-learn, NumPy, and matplotlib are used for the basic functionality that is needed in this project.
4.1.4 Dataset and Its Description
The dataset used for the implementation of this paper consists of imaging data captured by ESA’s Sentinel-2 satellite constellation, which focuses on observing the Earth. The selection of industrial sites included in the dataset was based on emission data sourced from the European Pollutant Release and Transfer Register. The images, to a great degree, showcase industrial locations, with a particular focus on those that exhibit active smoke plumes.
Each image provided in the dataset is in the GeoTIFF file format consisting of 13 bands, along with their respective geo-referencing information. Each image represents a square area with a ground edge length of 1.2 km. The bands are derived from Sentinel-2 Level-2A products, with the exception of band 10, which originates from the corresponding Level-1C product. A noteworthy point is that band 10 has not been utilized in the underlying work. The bands are derived from within this repository, and a total of 21,350 images can be found here. After diligent manual annotation, the image sample was partitioned into distinct subsets, resulting in 3,750 positively classified images portraying the presence of industrial smoke plumes, while a staggering 17,600 negatively classified images showcased the absence of any smoke plumes. Moreover, this repository is a comprehensive collection of carefully crafted JSON files that await manual segmentation labels that precisely identify the boundaries and details of the smoke plumes detected within the 1,437 images.
Due to the variations in smoke patterns, clouds, lighting conditions, rain, and background clutter, smoke detection and segmentation are difficult problems to solve. To distinguish smoke from clouds or other catastrophic entities, current solutions widely use convolutional rule-based or heuristic techniques. Deep learning algorithms and models such as ResNet-50 for classification and U-Net for segmentation have shown promising results in the detection and segmentation of the smoke using GeoTIFF images.
In Fig. 8, the output images are shown after feeding the color images to the ResNet50 model. Each output image is a collection of three images stacked on top of each other. There are four different types of possible outcomes from the classification model, in Fig. 8a, the image is classified as true positive by model. True positive means that the image contains smoke plumes, and the model is also predicting the same. In Fig. 8b, the image is classified as false positive because the image does not contain smoke but the model is predicting the opposite. Fig. 8c does not contain any smoke plumes and the model is also predicting the same that is why it is classified as a true negative. Fig. 8d shows that the image does contain some quantity of smoke plumes but the model is predicting the opposite so it is classified as false negative. The accuracy of the model can be easily calculated by the formula given in Eq. (5).

Figure 8: RGB images after classification via ResNet-50 (a) True positive; (b) False positive; (c) True negative; (d) False negative
The segmentation model U-Net gives the output in the form of images shown in Fig. 9. It also has 3 outcomes discussed earlier in this study. Each output image contains two images inside it. The first part is the original input image that the model receives and trains itself. The second part shows the segmentation boundaries of smoke if present in the original photo and also calculates the IoU value. IoU (Intersection-over-Union) depicts the intensity and the amount of smoke present in the input image. IoU value varies from 0 with no smoke to 1 being 100% smoke in the image. In Fig. 9a, the image contains smoke and it is classified as true positive, it has the IoU value of 0.72. It shows that approximately 72% of the pixels in the predicted segmentation mask align with the corresponding pixels in the ground truth mask which is a considerable overlap and therefore it can be concluded that the segmentation result is relatively valid.
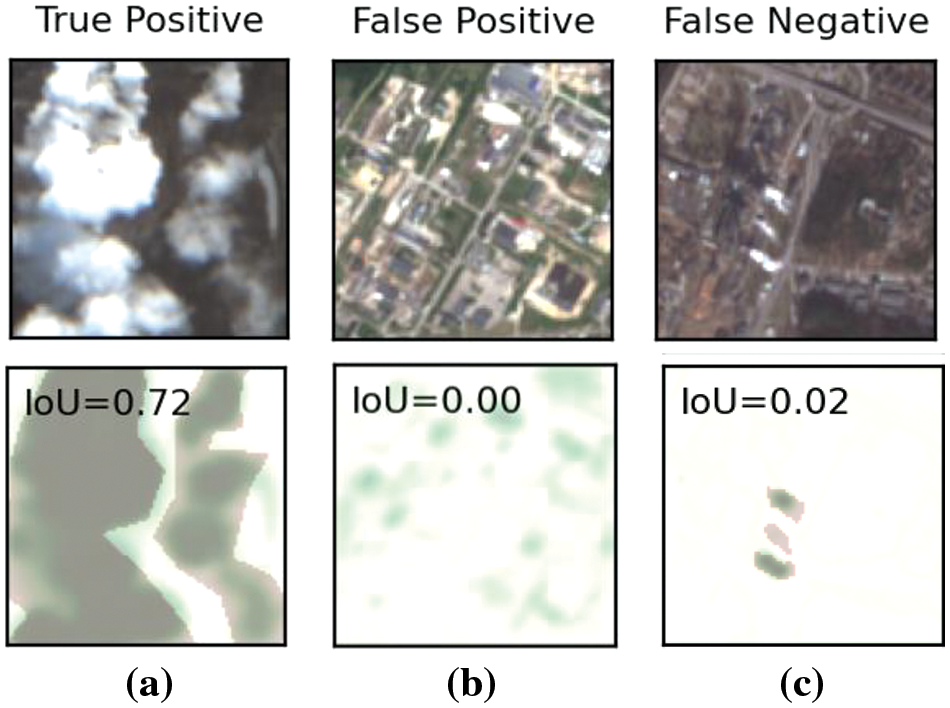
Figure 9: RGB images after segmentation via U-Net (a) True positive with 0.72 IoU value; (b) False positive with 0 IoU; (c) False negative with 0.02 IoU value
Fig. 10 shows the output images after feeding the grayscale images to the ResNet-50 model. Fig. 10a shows that the image contains smoke and the model is also predicting the same, thus it is classified as true positive. Fig. 10b shows that the image contains smoke but the model is not predicting it, that is why it is classified as a false negative. Fig. 10c shows that the image contains clouds, not smoke, and the model also predicted that the image does not have smoke which is why it is classified as a true negative.
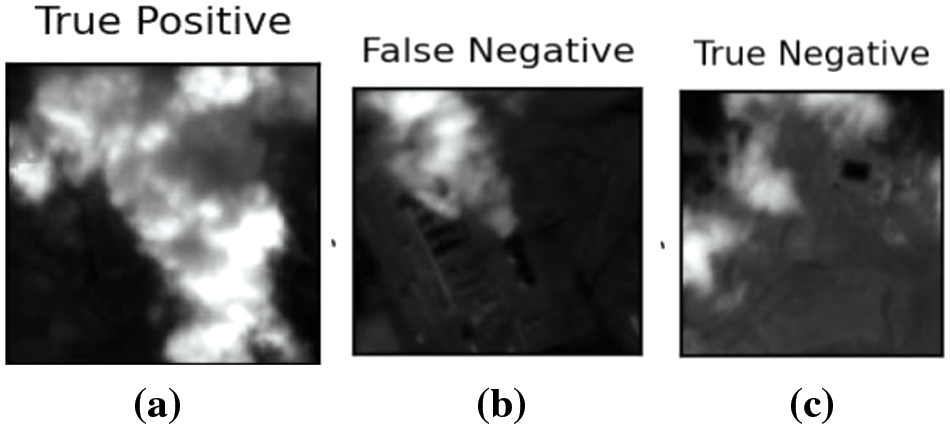
Figure 10: Grayscale images after classification via ResNet-50 (a) The image contains smoke and the model predicted the same; (b) The image contains smoke, but the model predicts it wrong; (c) The image contains clouds, and the model is also predicted that the image contains clouds do not smoke
One of the advantages of ResNet-50 is when compared to convolutional rule-based or heuristic techniques, deep learning models and algorithms increase the accuracy and performance of the model in detecting smoke plumes in the air. Compared to colored images, when grayscale images are used, it increases the accuracy, precision, and effectiveness of the model in detecting smoke images [26]. Some techniques can be applied to segment the boundaries of smoke in smoke-containing images. In this project, the U-Net model is being used to segment the boundaries of smoke and it also calculates the IoU value for each image.
This IoU value shows how much of the smoke is present in the image. This can help fire safety forces determine the level of fire by just analyzing the IoU value. This method of using deep learning models seeks to enhance the precision, accuracy, effectiveness, and reliability of smoke detection and segmentation systems. This work has considerable potential in many areas, including emergency response management, environmental monitoring, and fire safety.
Fig. 11 shows the training accuracy vs. validation accuracy of colored GeoTiff images against the number of epochs for (a) the ResNet-50 Model and (b) for U-Net Model. Fig. 11a is a representation of the ResNet-50 model’s performance while classifying color images–the blue line represents training accuracy which is approximately 94.3% and the validation accuracy of approximately 93% is represented by the orange line. Fig. 11b is a representation of the U-Net model’s performance while executing segmentation on color images—the blue line represents training accuracy which is approximately 94.0% and the validation accuracy of 93.4% is represented by the orange line. In these figures, the blue line shows how well the model performs on the training data over time. On the other hand, the orange line represents validation accuracy, which indicates how well the model performs on a separate validation dataset that it was not exposed to during training.
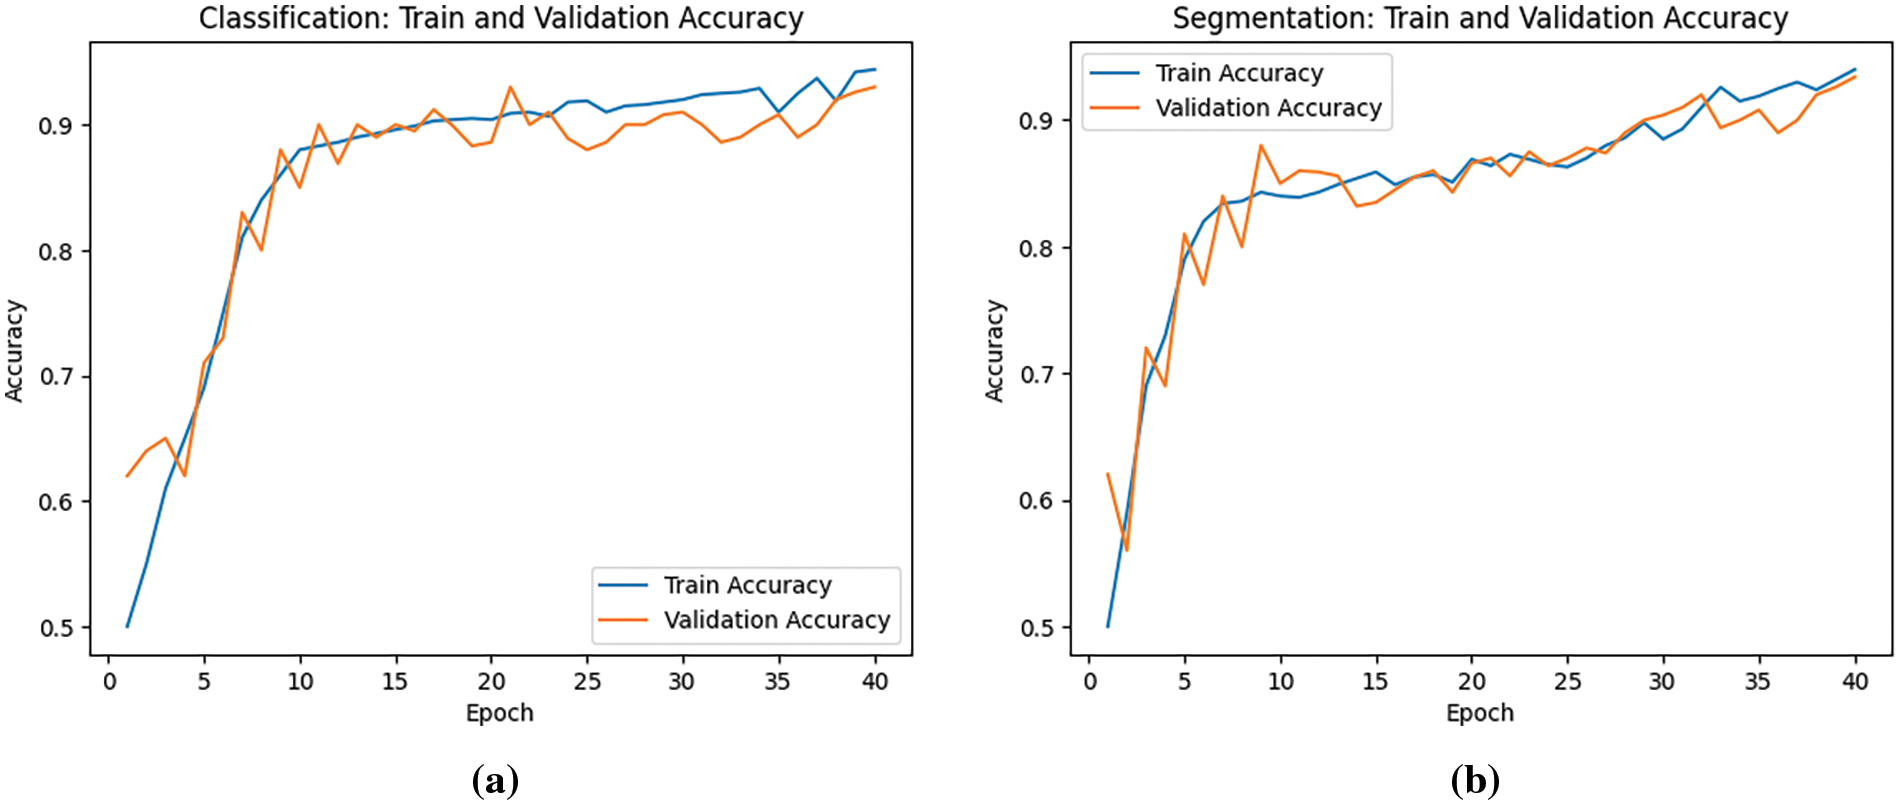
Figure 11: Accuracy graphs of (a) ResNet-50 model; (b) U-Net Model; trained on colored GeoTIFF image dataset
Fig. 12 shows the training loss vs. validation loss of colored GeoTiff images against the number of epochs for (a) the ResNet-50 Model and (b) for U-Net Model. Fig. 12a is a representation of the ResNet-50 model’s performance while classifying color images—the blue line represents training loss which is approximately 0.043 and the validation loss of 0.05 is represented by the orange line. Fig. 12b is a representation of the U-Net model’s performance while executing segmentation on color images—the blue line represents train loss which is approximately 0.043 and the validation loss of 0.05. The blue line in the figure corresponds to the training loss, which evaluates the model’s fit to the training data throughout the training process. On the other hand, the orange line represents the validation loss, which measures how well the model fits a distinct validation dataset that was not used for training.
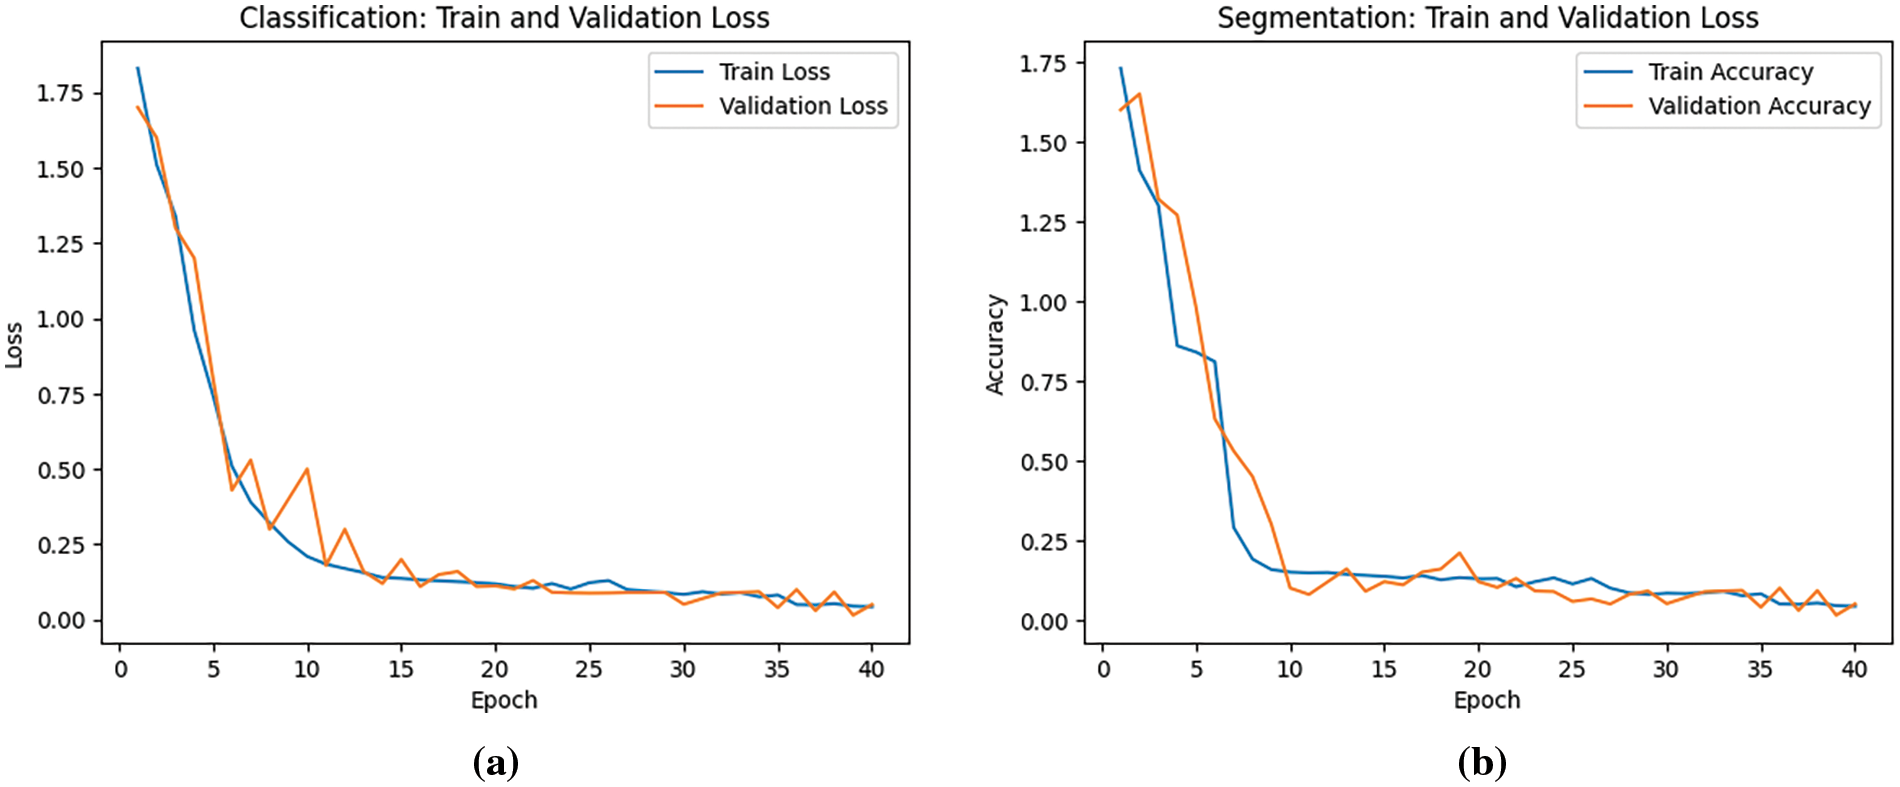
Figure 12: Loss graphs of (a) ResNet-50 model; (b) U-Net Model; trained on colored GeoTIFF image dataset
Fig. 13 shows the training accuracy vs. validation accuracy of grayscale GeoTiff images against the number of epochs for (a) the ResNet-50 Model and (b) for U-Net Model. Fig. 13a is a representation of the ResNet-50 model’s performance while classifying grayscale images–the blue line represents training accuracy which is approximately 96.4% and the validation accuracy which is approximately 96% is represented by the orange line. Fig. 13b is a representation of the U-Net model’s performance while executing segmentation on grayscale images–the blue line represents training accuracy which is approximately 94.0% and the validation accuracy is represented by the orange line. In these figures, by comparing the blue (training accuracy) and orange (validation accuracy) lines, insights can be gained into how well the model is learning and generalizing. Since the two lines closely follow each other and have similar values, it suggests that the model is generalizing well.

Figure 13: Accuracy graphs of (a) ResNet-50 model; (b) U-Net model; trained on grayscale GeoTIFF image dataset
Fig. 14 shows the training loss vs. validation loss of grayscale GeoTiff images against the number of epochs for (a) the ResNet-50 Model and (b) for U-Net Model. Fig. 14a is a representation of the ResNet-50 model’s performance while classifying grayscale images—the blue line represents training loss which is approximately 0.097, and the validation loss of 0.077 is represented by the orange line. Fig. 14b is a representation of the U-Net model’s performance while executing segmentation on color images–the blue line represents train loss which is approximately 0.047, and the validation loss of 0.1.
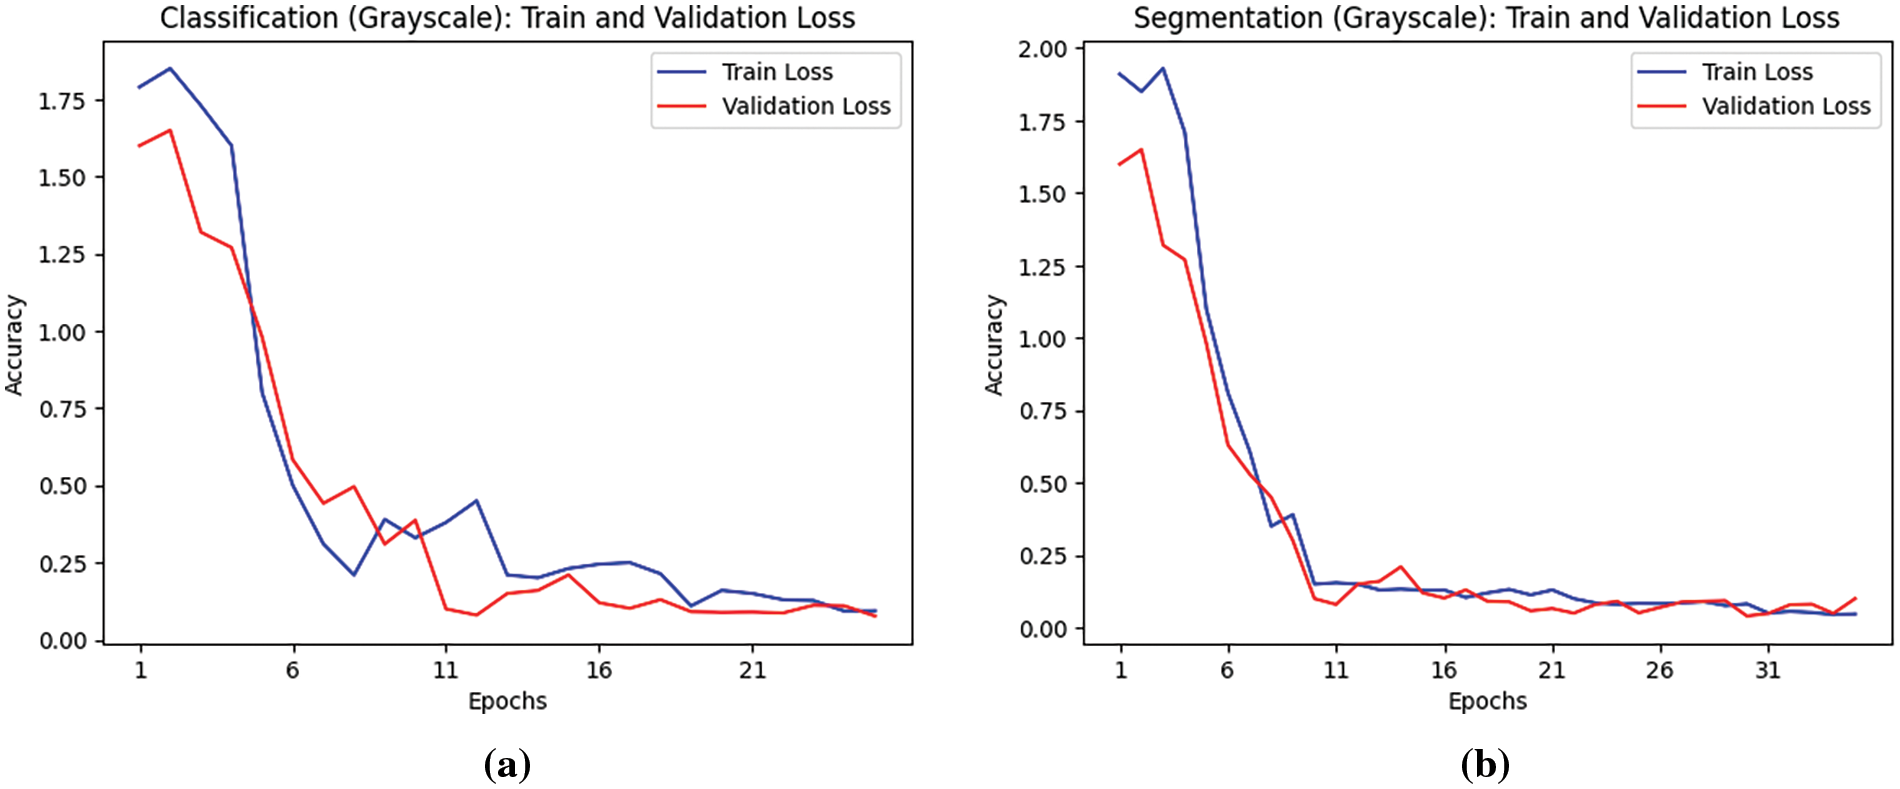
Figure 14: Loss graphs of (a) ResNet-50 model; (b) U-Net model; trained on grayscale GeoTIFF image dataset
4.3 Comparison of Various Approaches
This paper reviewed two major approaches, i.e., Classification and Segmentation for identifying smoke plumes from industrial units to monitor the Greenhouse gas emissions and their effect on Earth’s climate. Further, these approaches were divided into two categories–RGB images and Grayscale images. Satellite remote sensing data offers a practical means to routinely detect and monitor these plumes across extensive regions [27].
Initially, RGB images were trained through a custom layered architecture of Residual Network (ResNet-50) to classify images into two types—images containing smoke plumes and images not containing any smoke plumes and through U-Net for segmentation and marking the boundaries. It was observed that with RGB images, the accuracy attained was approximately 94.3% but there were certain limitations while processing RGB images such as color variations and complex dimensions. RGB images capture color information, which can vary depending on the lighting or atmospheric conditions. Smoke plumes can exhibit different colors depending on the combustion process or environmental conditions. Moreover, smoke illustrates a nature of dispersion which can lead to areas with translucent smoke patches with the patterns and colors of the surrounding environment [28–32]. Because of these variations, it becomes quite difficult to set a threshold for smoke detection. In the work carried out in [33], an adaptive weighted direction algorithm has been proposed for fire and smoke detection with reduced loss and false alarm.
To overcome this challenge even better, an innovative approach of using grayscale and binary images was taken into consideration. Grayscale images reduce the dimensionality which makes it easier for the model and it becomes more efficient as there are fewer parameters to be learned. Besides, grayscale images can appropriately capture the varying levels of brightness caused by smoke, making it easier for CNN to learn relevant features associated with smoke detection. This method of using grayscale images for training the ResNet-50 model not only proved to be efficient in computing but also resulted in a higher accuracy of 96.4%.
During Segmentation, initially, the images were compared against the manually created segmented labels to obtain a founding idea regarding the patches of smoke plumes and contours being formed. Following this, a U-Net model is fed with both the images and the manually computed segmented labels to achieve an automated function for getting precise contours and patches for each image containing smoke plumes. The automated process is more efficient and results in more precise segmented boundaries.
In Figs. 15a and 15b, it is clearly shown that by using grayscale images over RGB-colored images for classification and segmentation training, there is a noticeable difference in the accuracy. In each epoch, the accuracy for grayscale images is much higher than the accuracy for RGB images. Using grayscale images for both model’s training does not only increase the accuracy but also increases the model performance as the test accuracy for grayscale images is also higher.
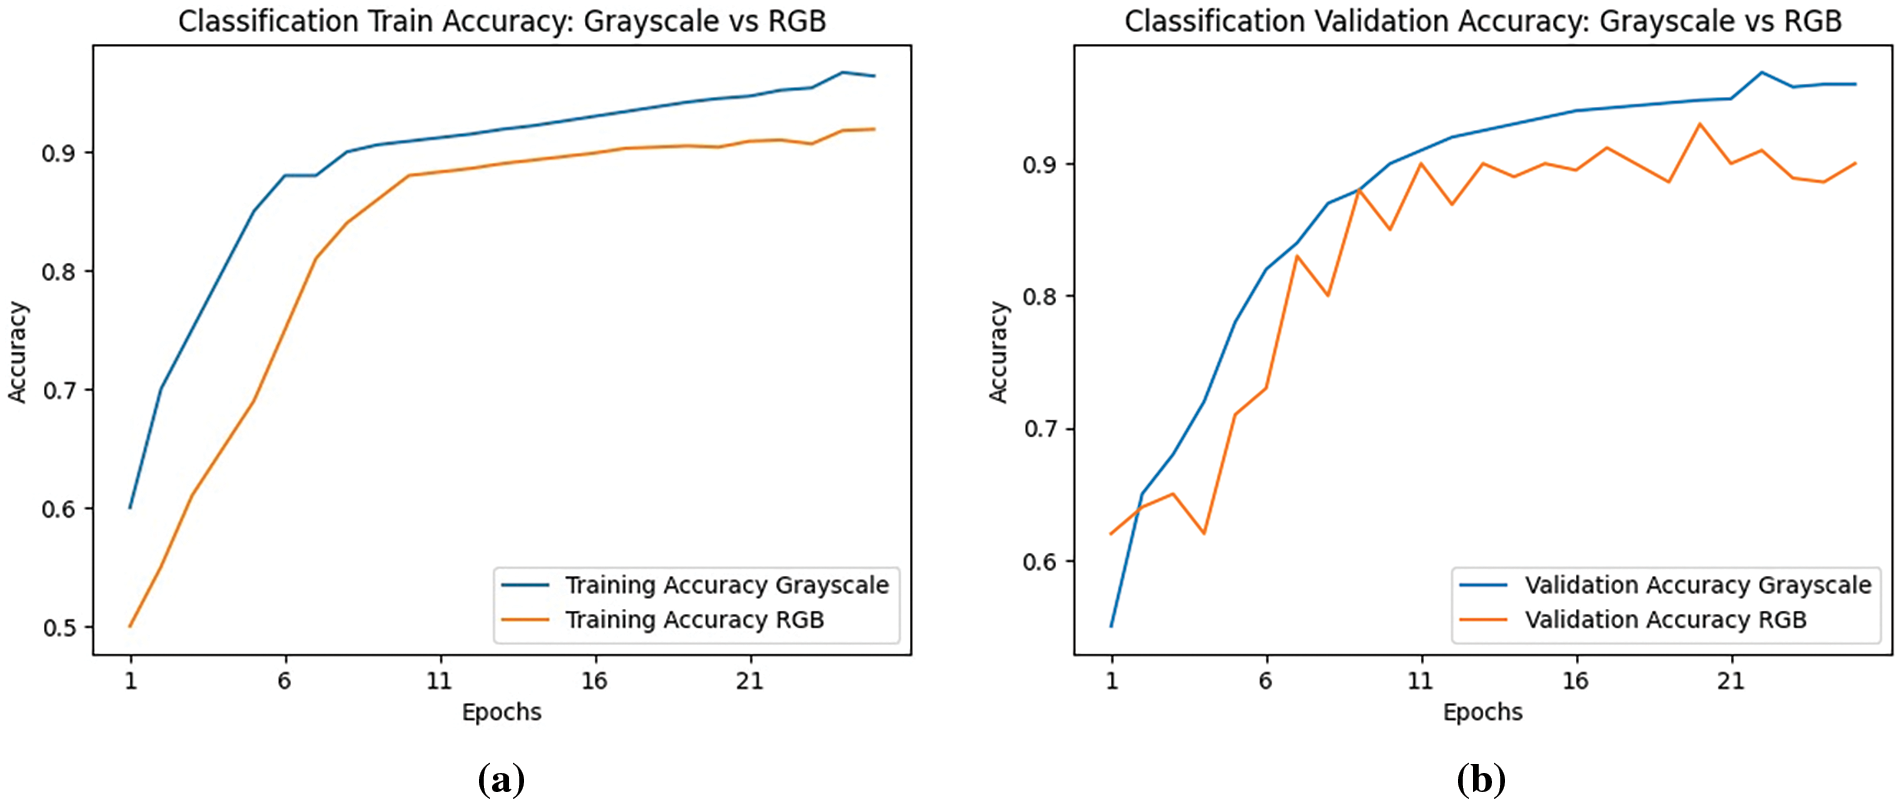
Figure 15: Comparison graphs (a) Classification train accuracy: grayscale vs. RGB; (b) Classification validation accuracy: grayscale vs. RGB
Although a decent rise in accuracy was observed when instead of RGB images, grayscale images were trained, it is observed that there is not much difference between the segmentation of RGB and grayscale images. Fig. 16 shows the comparison graphs (a) Segmentation Training accuracy of Grayscale vs. RGB and (b) Segmentation Validation accuracy of Grayscale vs. RGB. In these figures, the blue line represents the grayscale, and the orange line represents the RGB images. It can be observed that in both the figures, the lines almost travel along together, and the results obtained are almost the same for both cases.
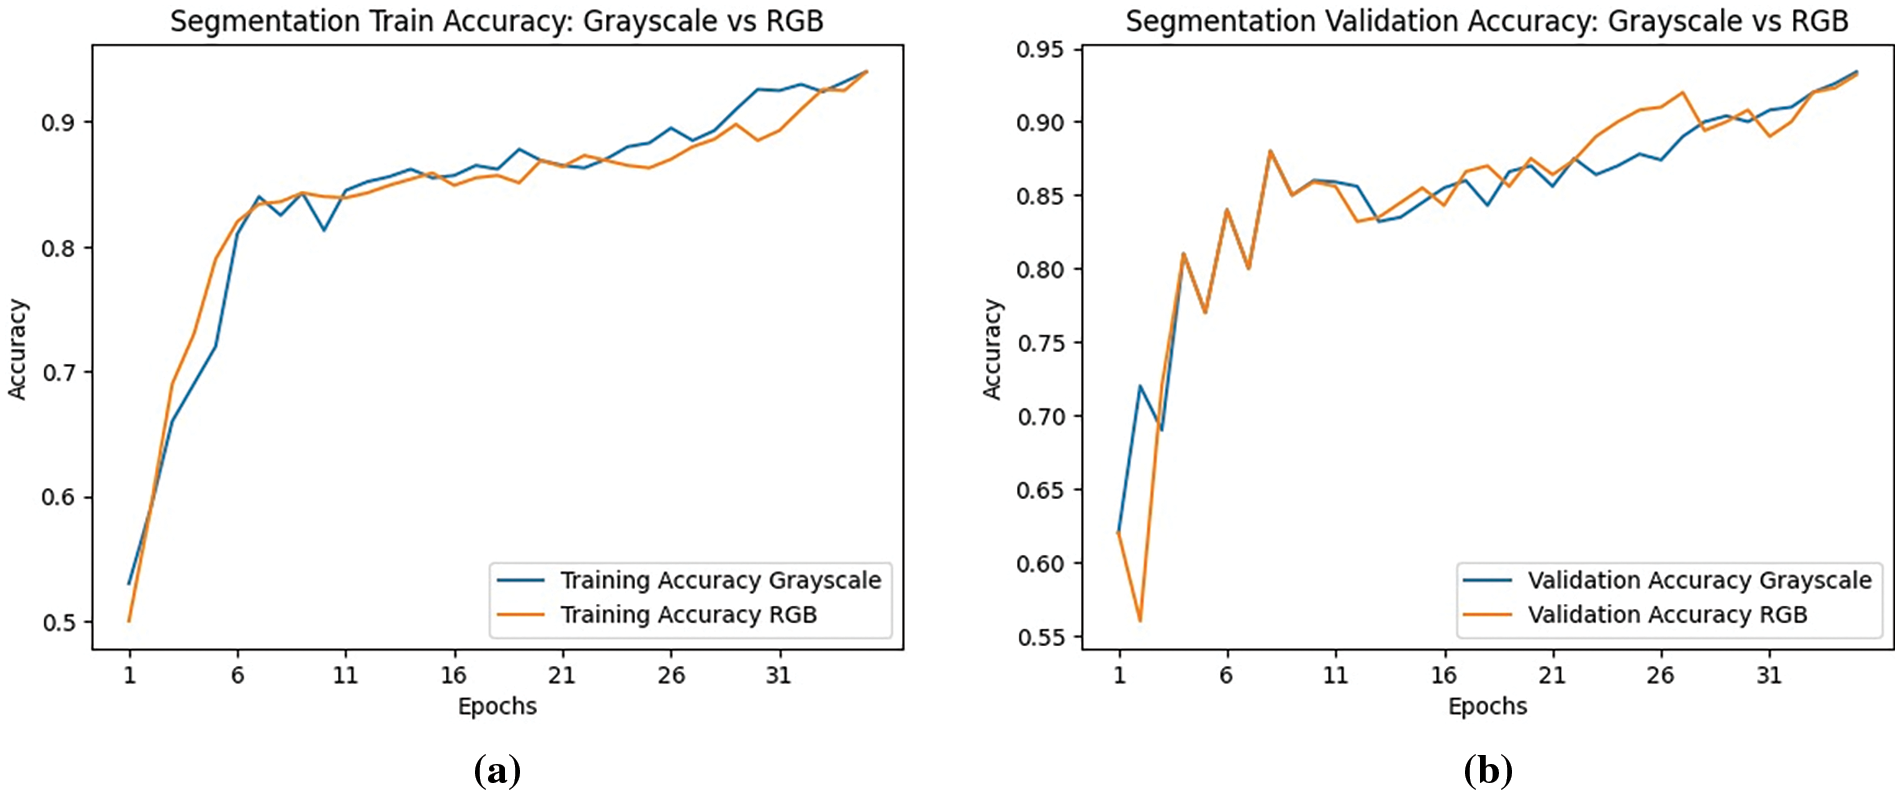
Figure 16: Comparison graphs (a) Segmentation train accuracy: grayscale vs. RGB; (b) Segmentation validation accuracy: grayscale vs. RGB
Fig. 17 depicts the comparison between IoU values of segmentation performed on RGB images to grayscale images over the last 5 epochs where Fig. 17a shows the comparison between the values of Train IoU and Fig. 17b shows the comparison between Segmentation IoU values. The blue line depicts the Intersection-over-Union values of RGB images whereas the Intersection-over-Union values of grayscale images are represented by an orange line. The graph can be used to observe the performance of the U-Net model on two different types of image datasets. Fig. 17a indicates that IoU values remain stable throughout for RGB images whereas for grayscale images, the values seem to increase initially but end up converging with the result of RGB. Similarly, in Fig. 17b, it seems that the validation IoU is initially higher for grayscale images but the result of both the image datasets is nearly the same. Overall, a quick comparison can be performed between the model performance of two different image datasets and can also assist in analyzing the model performance on unseen data while detecting patterns over a while.

Figure 17: IoU comparison graphs (a) Segmentation train IoU: RGB vs. grayscale; (b) Segmentation validation IoU: RGB vs. grayscale
The ROC curve shown in Fig. 18 is the trade-off between true positive rate (TPR) and false positive rate (FPR) at the different thresholds shown by the ROC curves. This shows how well the model can differentiate between smoke-containing and containing images. The diagonal baseline shows a random classifier, and the depicted points on the curves reflect various threshold values. The model’s performance can be evaluated for geoTIFF images, enabling it to analyze its efficiency in identifying smoke plumes in both RGB and grayscale images, by comparing the RGB and grayscale curves.

Figure 18: ROC curve for CNN model-ResNet-50; applied on RGB and grayscale images
In this work, the metric that is used to compare the results of RGB image training and grayscale image training is Accuracy. Since the data in this study is balanced, with each class having the same significance, accuracy is a reliable metric to use. Accuracy is calculated as shown in Eq. (5).
Table 1 is a compilation of the two types of methods used for classification along with their respective accuracies. It can be observed that converting images to grayscale resulted in a noteworthy increase in the accuracy of the ResNet-50 Model.
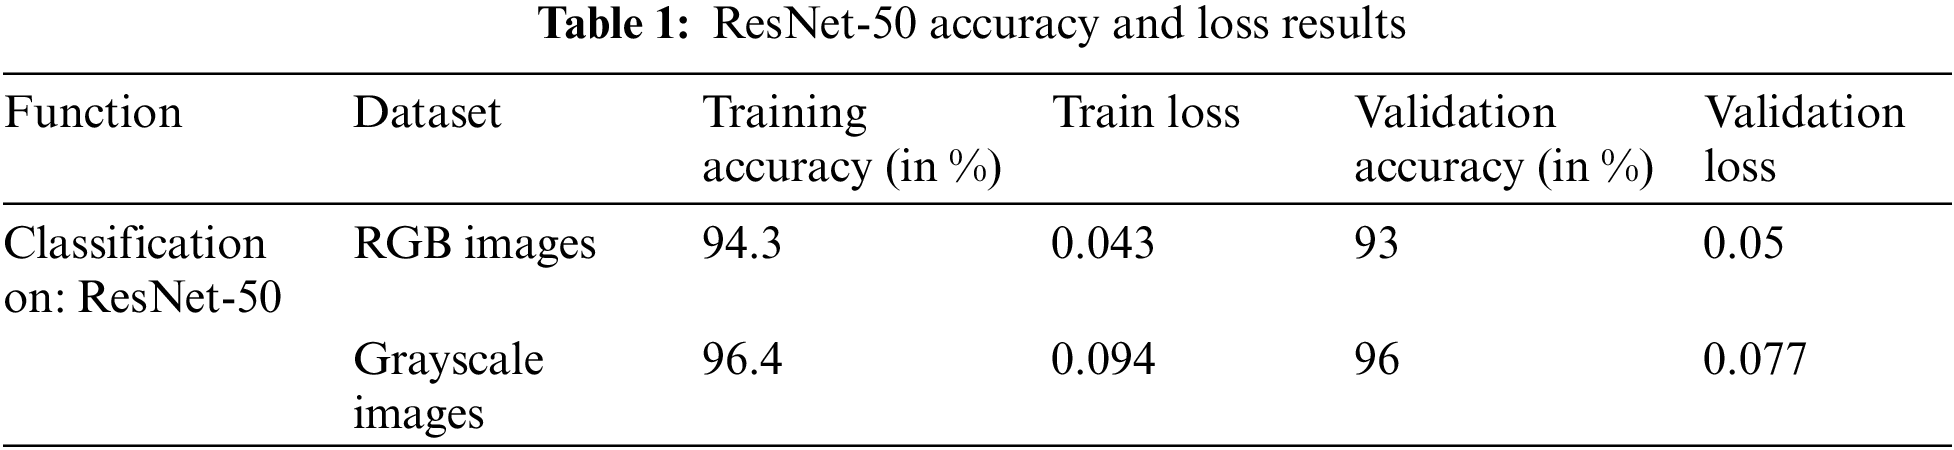
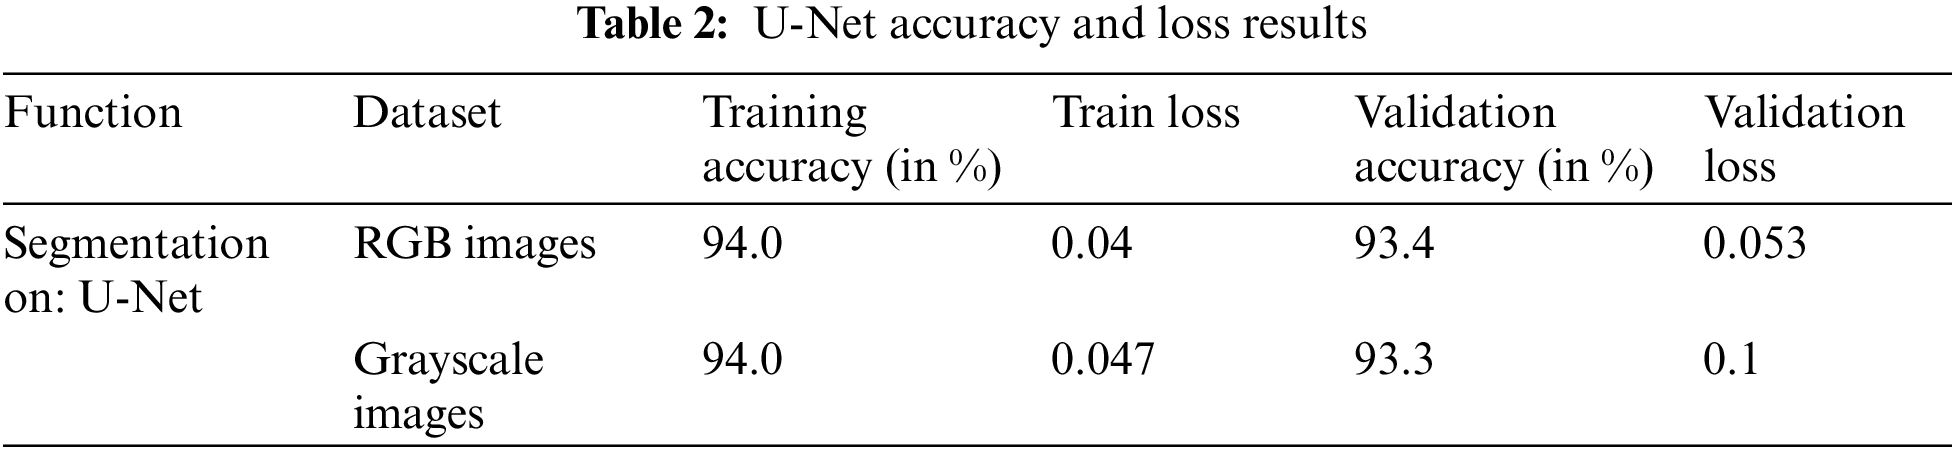
Table 2 is a compilation of the two types of methods used for segmentation along with their respective accuracies. It can be observed that converting images to grayscale did not portray any significant difference in the accuracy of the U-Net model. It was observed that during classification, grayscale images performed extremely well with a higher accuracy of 96.4%. Additionally, it was faster and more efficient due to reduced noises and dimensionality of grayscale images. This work addressed the challenges that are encountered during the detection and segmentation of smoke. The process gets further complicated due to varying smoke patterns, the presence of clouds, lighting conditions, and background clutter.
The work utilized a three-step process: Classifying RGB images, converting RGB to grayscale images re-training them through the classification model, and segmenting RGB images. This work employed the concept of Intersection-over-Union (IoU) as a measure of smoke intensity in an image. By analyzing the IoU value, the level of smoke can be conveniently assessed. By taking advantage of a pre-trained ResNet-50 model on a large dataset of GeoTIFF images, this study was successfully able to distinguish smoke plumes and employed the UNet model to identify the patches and perform smoke boundary segmentation. This method holds promise for various fields such as managing emergency responses, monitoring the environment, and ensuring fire safety. It provides improved precision, accuracy, and reliability in systems for detecting and segmenting smoke. The deep learning models can accurately distinguish smoke from non-smoke with an accuracy of 96.4%. High performance and accuracy, robustness of the model under various environmental circumstances are also among the top results of the project. Taking into account future work, there are several realistic points for future research and development. By exploring the potential of transfer learning and fine-tuning techniques, the performance of the model can be enhanced on limited labeled data. The integration of multi-modal data sources such as thermal imaging or air quality measurements, can enhance the accuracy and reliability of smoke detection. Furthermore, the extension of this project to real-time monitoring is also realistic. Overall, this work has established the framework for precise smoke segmentation and detection utilizing deep learning methods. To further improve the effectiveness, accuracy, and usefulness of smoke detection and analysis systems, future studies can concentrate on the integration of multi-modal data, transfer learning, real-time applications, and sophisticated deep learning models.
Acknowledgement: The authors wish to express their thanks to VIT management for their extensive support during this work.
Funding Statement: The authors received no specific funding for this work.
Author Contributions: The authors confirm their contribution to the paper as follows:study conception and design: Ananthakrishnan Balasundaram, data collection: Ananthakrishnan Balasundaram, Ayesha Shaik, Japmann Kaur Banga and Aman Kumar Singh, analysis and interpretation of results: Ananthakrishnan Balasundaram, Ayesha Shaik, Japmann Kaur Banga and Aman Kumar Singh, draft manuscript preparation: Ananthakrishnan Balasundaram, Ayesha Shaik, Japmann Kaur Banga and Aman Kumar Singh. All authors reviewed the results and approved the final version of the manuscript.
Availability of Data and Materials: Industrial Smoke Plume Data Set, 2020, [online] https://zenodo.org/records/4250706 (accessed on 01 December 2023).
Conflicts of Interest: The authors declare that they have no conflicts of interest to report regarding the present work.
References
1. H. Lee, “Intergovernmental panel on climate change,” in First Tech. Dialog. Global Stocktake, IPCC, Bonn, Germany, 2022, pp. 1–4. [Google Scholar]
2. X. Li, W. Song, L. Lian, and X. Wei, “Forest fire smoke detection using back-propagation neural network based on MODIS data,” Remote Sens., vol. 7, no. 4, pp. 4473–4498, 2015. doi: 10.3390/rs70404473. [Google Scholar] [CrossRef]
3. A. Larsen et al., “A deep learning approach to identify smoke plumes in satellite imagery in near-real time for health risk communication,” J. Expo. Sci. & Environ. Epidemiol., vol. 31, no. 1, pp. 170–176, 2021. doi: 10.1038/s41370-020-0246-y [Google Scholar] [PubMed] [CrossRef]
4. M. Mukhiddinov, A. B. Abdusalomov, and J. Cho, “A wildfire smoke detection system using unmanned aerial vehicle images based on the optimized YOLOv5,” Sens., vol. 22, no. 23, pp. 9384–9409, 2022. doi: 10.3390/s22239384 [Google Scholar] [PubMed] [CrossRef]
5. N. T. Toan, P. T. Cong, N. Q. V. Hung, and J. Jo, “A deep learning approach for early wildfire detection from hyperspectral satellite images,” in 7th Int. Conf. Robot Intell. Technol. Appl. (RiTA), Daejeon, Korea, 2019, pp. 38–45. [Google Scholar]
6. X. Lu, X. Zhang, F. Li, M. A. Cochrane, and P. Ciren, “Detection of fire smoke plumes based on aerosol scattering using VIIRS data over global fire-prone regions,” Remote Sens., vol. 13, no. 2, pp. 196–218, 2021. doi: 10.3390/rs13020196. [Google Scholar] [CrossRef]
7. M. Ramasubramanian et al., “Pixel level smoke detection model with deep neural network,” in Image Signal Process. Remote Sensing XXV, Strasbourgh, France, 2019, pp. 376–386. [Google Scholar]
8. M. Mommert, M. Sigel, M. Neuhausler, L. Scheibenreif, and D. Borth, “Characterization of industrial smoke plumes from remote sensing data,” in Tackling Clim. Change Mach. Learn. Workshop at NeurIPS 2020, St. Gallen, Switzerland, 2020, pp. 1–5. [Google Scholar]
9. C. L. C. Huang and T. Munasinghe, “Exploring various applicable techniques to detect smoke on the satellite images,” in IEEE Int. Conf. Big Data (Big Data), Atlanta, GA, USA, 2020, pp. 5703–5705. [Google Scholar]
10. A. M. Fernandes, A. B. Utkin, and P. Chaves, “Automatic early detection of wildfire smoke with visible light cameras using deep learning and visual explanation,” IEEE Access, vol. 10, pp. 12814–12828, 2022. doi: 10.1109/ACCESS.2022.3145911. [Google Scholar] [CrossRef]
11. Z. Wang, D. Yin, and S. Ji, “Real-time factory smoke detection based on two-stage relation-guided algorithm,” Sci. Rep., vol. 12, no. 1, pp. 1786–1801, 2022. doi: 10.1038/s41598-022-05523-1 [Google Scholar] [PubMed] [CrossRef]
12. G. Wang, J. Li, Y. Zheng, Q. Long, and W. Gu, “Forest smoke detection based on deep learning and background modeling,” in IEEE Int. Conf. Power, Intell.Comput. Syst. (ICPICS), Shenyang, China, 2020, pp. 112–116. [Google Scholar]
13. J. Gubbi, S. Marusic, and M. Palaniswami, “Smoke detection in video using wavelets and support vector machines,” Fire Safety J., vol. 44, no. 8, pp. 1110–1115, 2009. doi: 10.1016/j.firesaf.2009.08.003. [Google Scholar] [CrossRef]
14. D. K. Appana, R. Islam, S. A. Khan, and J. M. Kim, “A video-based smoke detection using smoke flow pattern and spatial-temporal energy analyses for alarm systems,” Inform. Sci., vol. 418, pp. 91–101, 2017. doi: 10.1016/j.ins.2017.08.001. [Google Scholar] [CrossRef]
15. F. Yuan, L. Zhang, X. Xia, Q. Huang, and X. Li, “A wave-shaped deep neural network for smoke density estimation,” IEEE Trans. Image Process, vol. 29, pp. 2301–2313, 2019. doi: 10.1109/TIP.2019.2946126 [Google Scholar] [PubMed] [CrossRef]
16. V. E. Sathishkumar, J. Cho, M. Subramanian, and O. S. Naren, “Forest fire and smoke detection using deep learning-based learning without forgetting,” Fire Ecol., vol. 19, no. 1, pp. 1–17, 2023. doi: 10.1186/s42408-022-00165-0. [Google Scholar] [CrossRef]
17. S. Chaturvedi, P. Khanna, and A. Ojha, “A survey on vision-based outdoor smoke detection techniques for environmental safety,” ISPRS J. Photogramm. Remote Sens., vol. 185, no. 14, pp. 158–187, 2022. doi: 10.1016/j.isprsjprs.2022.01.013. [Google Scholar] [CrossRef]
18. M. Jiang, Y. Zhao, F. Yu, C. Zhou, and T. Peng, “A self-attention network for smoke detection,” Fire Safety J., vol. 129, no. 1, pp. 103547–103556, 2022. doi: 10.1016/j.firesaf.2022.103547. [Google Scholar] [CrossRef]
19. G. Perrolas, M. Niknejad, R. Ribeiro, and A. Bernardino, “Scalable fire and smoke segmentation from aerial images using convolutional neural networks and quad-tree search,” Sens., vol. 22, no. 5, pp. 1701, 2022. doi: 10.3390/s22051701 [Google Scholar] [PubMed] [CrossRef]
20. Y. Li, W. Zhang, Y. Liu, R. Jing, and C. Liu, “An efficient fire and smoke detection algorithm based on an end-to-end structured network,” Eng. Appl. Artif. Intel., vol. 116, no. 5, pp. 105492, 2022. doi: 10.1016/j.engappai.2022.105492. [Google Scholar] [CrossRef]
21. M. R. Islam, M. Amiruzzaman, S. Nasim, and J. Shin, “Smoke object segmentation and the dynamic growth feature model for video-based smoke detection systems,” Symmetry, vol. 12, no. 7, pp. 1075, 2020. doi: 10.3390/sym12071075. [Google Scholar] [CrossRef]
22. C. Yuan, Z. Liu, and Y. Zhang, “Learning-based smoke detection for unmanned aerial vehicles applied to forest fire surveillance,” J. Intell. Robot Syst., vol. 93, pp. 337–349, 2019. doi: 10.1007/s10846-018-0803-y. [Google Scholar] [CrossRef]
23. J. P. Dukuzumuremyi, B. Zou, and D. Hanyurwimfura, “A novel algorithm for fire/smoke detection based on computer vision,” Int. J. Hybrid Inform. Technol., vol. 7, no. 3, pp. 143–154, 2014. doi: 10.14257/ijhit.2014.7.3.15. [Google Scholar] [CrossRef]
24. S. Khan et al., “Deepsmoke: Deep learning model for smoke detection and segmentation in outdoor environments,” Expert. Syst. Appl., vol. 182, no. 1, pp. 115125, 2021. doi: 10.1016/j.eswa.2021.115125. [Google Scholar] [CrossRef]
25. S. Li, L. Qiao, Y. Zhang, and J. Yan, “An early forest fire detection system based on DJI M300 drone and H20T camera,” in Int. Conf. Unmanned Aircr. Syst. (ICUAS), Dubrovnik, Croatia, 2022, pp. 932–937. [Google Scholar]
26. D. Ojdanić, C. Naverschnigg, A. Sinn, and G. Schitter, “Deep learning-based long-distance optical UAV detection: Color versus grayscale,” in Pattern Recognit. Track. XXXIV, Orlando, Florida, FL, USA, 2023, pp. 80–84. [Google Scholar]
27. N. Chrysoulakis, I. Herlin, P. Prastacos, H. Yahia, J. Grazzini and C. Cartalis, “An improved algorithm for the detection of plumes caused by natural or technological hazards using AVHRR imagery,” Remote Sens. Environ., vol. 108, no. 4, pp. 393–406, 2007. doi: 10.1016/j.rse.2006.11.024. [Google Scholar] [CrossRef]
28. Z. Ding, Y. Zhao, A. Li, and Z. Zheng, “Spatial-temporal attention two-stream convolution neural network for smoke region detection,” Fire, vol. 4, no. 4, pp. 66, 2021. doi: 10.3390/fire4040066. [Google Scholar] [CrossRef]
29. J. K. Bhamra et al., “Multimodal wildland fire smoke detection,” Remote Sens., vol. 15, no. 11, pp. 2790, 2023. doi: 10.3390/rs15112790. [Google Scholar] [CrossRef]
30. J. S. Almeida, S. K. Jagatheesaperumal, F. G. Nogueira, and V. H. C. de Albuquerque, “EdgeFireSmoke++: A novel lightweight algorithm for real-time forest fire detection and visualization using internet of things-human machine interface,” Expert. Syst. Appl., vol. 221, no. 1, pp. 119747, 2023. doi: 10.1016/j.eswa.2023.119747. [Google Scholar] [CrossRef]
31. D. Sheng, J. Deng, and J. Xiang, “Automatic smoke detection based on SLIC-DBSCAN enhanced convolutional neural network,” IEEE Access, vol. 9, pp. 63933–63942, 2021. doi: 10.1109/ACCESS.2021.3075731. [Google Scholar] [CrossRef]
32. D. Sheng et al., “A statistical image feature-based deep belief network for fire detection,” Complex., vol. 2021, no. 1, pp. 1–12, 2021. doi: 10.1155/2021/5554316. [Google Scholar] [CrossRef]
33. X. Wu, X. Lu, and H. Leung, “An adaptive threshold deep learning method for fire and smoke detection,” in IEEE Int. Conf. Syst., Man Cybern. (SMC), Banff, AB, Canada, 2017, pp. 1954–1959. [Google Scholar]
Cite This Article
 Copyright © 2024 The Author(s). Published by Tech Science Press.
This work is licensed under a Creative Commons Attribution 4.0 International License , which permits unrestricted use, distribution, and reproduction in any medium, provided the original work is properly cited.
 Downloads
 Citation Tools