
 Submit a Paper
 Propose a Special lssue
 Open Access
ARTICLE

Perpendicular-Cutdepth: Perpendicular Direction Depth Cutting Data Augmentation Method
1 Anhui Provincial Engineering Laboratory of Big Data Technology Application for Urban Infrastructure, School of Artificial Intelligence and Big Data, Hefei University, Hefei, 230601, China
2 Institute of Applied Optimization, School of Artificial Intelligence and Big Data, Hefei University, Hefei, 230601, China
* Corresponding Author: Xiaofeng Wang. Email:
Computers, Materials & Continua 2024, 79(1), 927-941. https://doi.org/10.32604/cmc.2024.048889
Received 21 December 2023; Accepted 28 February 2024; Issue published 25 April 2024
 View Full Text
 Download PDF
Abstract
Depth estimation is an important task in computer vision. Collecting data at scale for monocular depth estimation is challenging, as this task requires simultaneously capturing RGB images and depth information. Therefore, data augmentation is crucial for this task. Existing data augmentation methods often employ pixel-wise transformations, which may inadvertently disrupt edge features. In this paper, we propose a data augmentation method for monocular depth estimation, which we refer to as the Perpendicular-Cutdepth method. This method involves cutting real-world depth maps along perpendicular directions and pasting them onto input images, thereby diversifying the data without compromising edge features. To validate the effectiveness of the algorithm, we compared it with existing convolutional neural network (CNN) against the current mainstream data augmentation algorithms. Additionally, to verify the algorithm’s applicability to Transformer networks, we designed an encoder-decoder network structure based on Transformer to assess the generalization of our proposed algorithm. Experimental results demonstrate that, in the field of monocular depth estimation, our proposed method, Perpendicular-Cutdepth, outperforms traditional data augmentation methods. On the indoor dataset NYU, our method increases accuracy from 0.900 to 0.907 and reduces the error rate from 0.357 to 0.351. On the outdoor dataset KITTI, our method improves accuracy from 0.9638 to 0.9642 and decreases the error rate from 0.060 to 0.0598.Keywords
Computer vision, as a pivotal branch in the realm of modern technology, spans a diverse array of applications [1–5]. Nevertheless, with the escalating complexity of tasks, we encounter a myriad of challenges when training deep learning models, prominently featuring limited data, overfitting issues, and the imperative need for model generalization across diverse scenarios. In this context, data augmentation emerges as a pivotal strategy to counter these challenges. Data augmentation, by introducing diversity, exposes the model to a broader spectrum of scenes and variations during training, thereby augmenting its ability to generalize to unseen data. By learning representations adaptable to various scenarios, the model becomes more adept at accommodating novel, real-world inputs. Simultaneously, data augmentation aids in mitigating the risk of overfitting, as the model experiences a more diverse set of inputs during training, reducing its reliance on specific data distributions. This enhances the model’s resilience when confronted with unknown data, ensuring robust performance. Moreover, data augmentation can introduce various transformations such as rotation, scaling, flipping, and optical transformations, imparting greater robustness to the neural network model. This robustness signifies that the model is more resistant to subtle changes and noise in the input, contributing to a more reliable execution of tasks in the real world.
These data augmentation methods have been widely applied in research for advanced tasks such as abnormal detection [1], personalized diagnosis [3–7], simulation enlargement and Transfer learning combined with fault sample augment [8]. In the field of abnormal detection and diagnosis, obtaining real fault samples can be challenging or limited in availability. Data augmentation can generate more diversified fault samples through transformations, rotations, scaling, and other methods, aiding the model in better learning and understanding different types of faults. For personalized diagnosis, differences exist between individuals, necessitating more samples to better adapt to personalized requirements. Data augmentation can generate additional samples with personalized scenarios, assisting the model in better adapting to individual differences and improving the accuracy of personalized diagnosis.
However, there has been relatively less research in the domain of low-level tasks, particularly when dealing with pixel-wise transformations, as seen in tasks like monocular depth estimation. Effective data augmentation methods for these lower-level tasks have not received sufficient attention and in-depth investigation. The challenges of data augmentation [9–13] in pixel-wise tasks are more intricate, given the need to maintain precise pixel-level label information.
Monocular depth estimation is a critical research focus in the field of computer vision, primarily aiming to predict depth information of objects in a scene from a single image. It finds extensive applications in areas such as 3D reconstruction, virtual reality, and autonomous driving. The input for monocular depth estimation typically consists of a set of images along with their corresponding depth maps. Depth maps are commonly acquired through depth cameras and laser scanners. However, obtaining accurate depth information can be challenging in certain scenarios, such as underwater environments or objects with transparent and glass-like properties. In such cases, data augmentation becomes an indispensable step in monocular depth estimation tasks. Currently, widely used data augmentation methods include random rotation [14], random cropping [15], and optical transformations [16] (color and brightness variations), among others. Random rotation involves rotating the image by a certain angle to simulate different capture perspectives. Random cropping entails selecting a region of the image as input, mimicking different viewpoints. Optical transformations alter the brightness and contrast of the input image, enhancing data diversity. These augmentation techniques contribute to the robustness and generalization ability of monocular depth estimation models, enabling them to handle diverse and challenging real-world scenarios effectively.
Although these methods have improved the generalization ability of neural networks, they mainly focus on altering the global environment rather than modifying the geometric structure within the scene. Many studies have attempted to modify the geometric structure within the scene to encourage the network to learn more complex scenes and thereby improve the accuracy of the model [14–16]. Ishii et al. [15] observed similarities in edge positions between depth and RGB images, especially in low-level features. They introduced the Cutdepth algorithm for monocular depth estimation networks, aiming to normalize the images using the provided depth information and reduce the gap between RGB images and depth maps in the latent space. This not only increases visual diversity, but also restricts excessive geometric changes within the scene, causing the neural networks to focus more on high-frequency regions. Dijk et al. [17] investigated how neural networks perceive depth from single images, primarily using the vertical position of objects in images. In response, Kim et al. [16] argued that the vertical viewpoint in a single image is more important than the horizontal viewpoint, leading to the proposal of a variant of Cutdepth called Vertical-Cutdepth. This algorithm performs Cutdepth cuts in the vertical direction of the input images, encouraging the network to capture vertical long-range correlations. However, Vertical-Cutdepth overlooks the importance of both horizontal and vertical correlations for depth information, since in human vision the positional structure of an object is determined by the intersection of horizontal and vertical directions. A single vertical correlation can determine the height of an object, but not its width.
To encourage the network to focus on the correlation between the horizontal and vertical directions, we propose “Perpendicular-Cutdepth”. This method aims to simultaneously reduce the horizontal and vertical distances between RGB images and their corresponding depth maps in the latent space, enhancing the network’s ability to learn from both horizontal and vertical directions within the scene. Perpendicular-Cutdepth involves randomly cropping horizontal and vertical regions from real depth maps and replacing them with corresponding areas in RGB images. By doing so, this effectively promotes the learning of both horizontal and vertical correlations in the scene. We conducted extensive quantitative and qualitative experiments on publicly available datasets, including the indoor dataset NYU [18] and the outdoor dataset KITTI [19], to validate the effectiveness of our proposed Perpendicular-Cutdepth. We will provide a detailed introduction to our method in Section 3.
The contributions of our work are as follows:
• We compared the impact of data methods with different geometric structures on the network.
• We propose a new data augmentation method to improve model performance.
• Compared to previous data augmentation methods, our proposed method can improve depth estimation performance in both indoor and outdoor scenes.
2.1 Monocular Depth Estimation
Depth estimation, as a critical problem in the field of computer vision, has demonstrated vast potential in various applications. With the decreasing cost and widespread availability of monocular cameras, researchers have increasingly turned their attention to monocular depth estimation methods due to their simplicity and practicality. Traditional geometry-based methods rely on texture, corners, and edge information in images to compute depth. These approaches often require additional sensors or strict scene assumptions, limiting their applicability in complex environments. In recent years, with the advancement of deep learning, deep learning-based methods have made significant strides in this field. In monocular depth estimation, neural network-based approaches have proven capable of producing satisfactory depth estimates in many scenarios [20–23]. Common architectures for depth estimation networks include Convolutional Neural networks (CNNs) [24–27] and Transformers [28–31]. For instance, Lee et al. [20] introduced the concept of mask3D to predict local normal for obtaining depth information, encouraging the network to learn structural information within the scene. Li et al. [21] convert the 360° image to low degree distorted perspective patches, then obtain patch wise predictions based on CNN, and finally merge them to obtain the final prediction result, solving the problem of CNN structure being difficult to handle spherical distortions. Wang et al. [23] proposed Probability and Geometric Depth (PGD), which estimates depth by utilizing probability depth uncertainty and geometric relationships between instances. Patil et al. [27] designed a network with two heads. The first input outputs pixel plane level coefficients, while the second head outputs a dense offset vector field that identifies the position of seed pixels. The vector field then uses the sparsity of the seed pixel’s plane to predict the depth of each position. The prediction results are fused with the initial prediction of the first head through learning confidence adaptation. Bhat et al. [28] employed a CNN as an encoder, introduced the self-adaptive regression unit Adabins, and used a Transformer module to capture global information. Kim et al. used Segformer [29] as a feature extractor and proposed a selective local and global fusion network to enhance feature fusion. Bhat et al. [31] proposed a new architecture (LocalBins) for depth estimation from a single image. The architecture itself is based on the popular encoder decoder architecture. Firstly, the network predicts the depth distribution of the local neighborhood for each pixel, rather than predicting the global depth distribution. Secondly, the network is not only predicting the depth distribution at the end of the decoder, but also involving all layers of the decoder. Agarwal et al. [32] extended Adabins with Transbins to incorporate global information, yielding more detailed depth maps. Jun et al. [33] introduced a novel monocular depth estimation algorithm that decomposes depth maps into normalized depth maps and scale features. This method can utilize datasets without depth labels to improve monocular depth estimation performance.
When neural networks reach a performance bottleneck, data augmentation is an effective method to improve their performance without introducing additional computational burden. In the field of computer vision, several data augmentation techniques have been developed. As mentioned in the introduction, common data augmentation methods, such as rotation, cropping, and optical transformations, primarily alter the overall scene environment, which has inherent limitations in boosting network performance. To address this issue, some studies have attempted to modify the geometric structure of input images to further enhance network generalization [9,11–14]. Fig. 1 shows some data enhancement methods, where Figs. 1a and 1b are RGB images and corresponding depth maps. as shown in Fig. 1c, Devries et al. [12] introduced a regularization method called CutOut to prevent CNN overfitting. During network training, CutOut randomly selects a region of the input image and sets the pixel values within that region to 0 or adds random noise. Zhong et al. [13] introduced a lightweight data augmentation method called random erasure, as shown in Fig. 1d. This method randomly selects a rectangular region and erases the pixel values within that region using random values. Yoo et al. [9] proposed a data augmentation method called CutBlur, which is specifically designed for image restoration tasks. It involves cutting out low-resolution regions and pasting them onto corresponding high-resolution regions. This approach teaches the model not only how to reconstruct, but also where to reconstruct. Ghiasi et al. [14] presented a simple yet efficient copy-paste data augmentation method that improves the accuracy of instance segmentation. The authors believed that this technique encourages the network to use information from the entire image rather than relying on specific small regions. Yun et al. [11] improved on CutOut and proposed CutMix, a method that fills the CutOut portion with parts of another image. This approach retains the advantages of CutOut, allowing the model to learn features from different parts of the target, including less discriminative areas. Additionally, it is more efficient than CutOut, enabling the model to simultaneously learn features from two targets. The specific procedure for CutMix is illustrated in Fig. 1e.
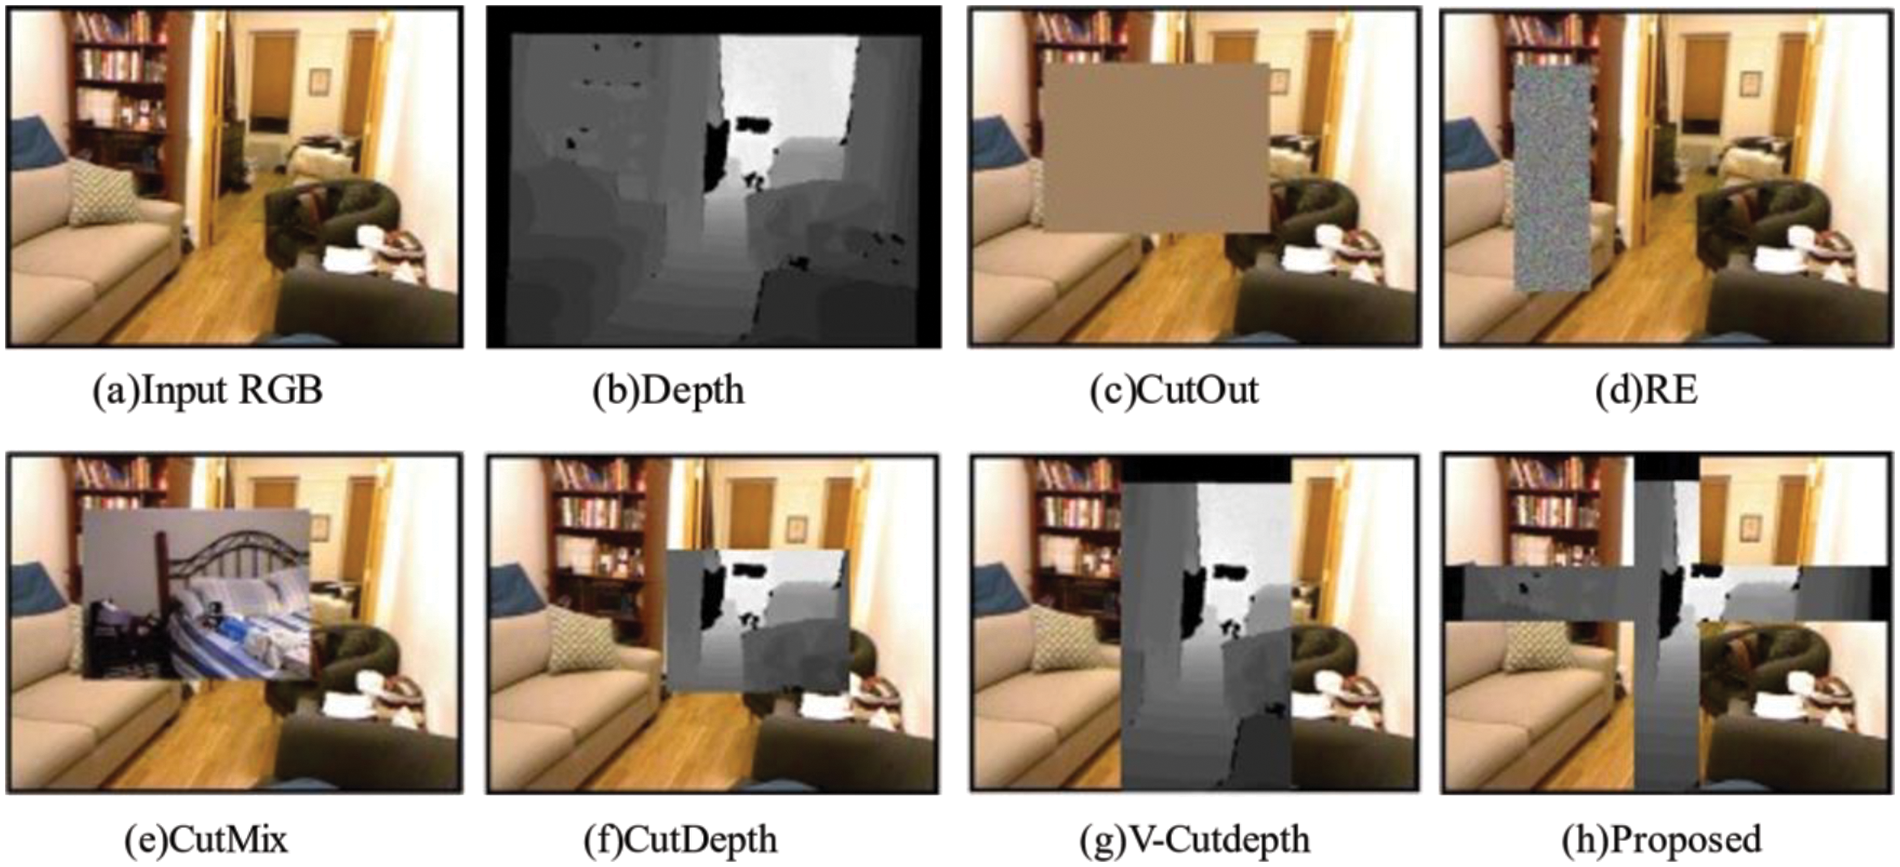
Figure 1: Examples of data augmentation
In the field of monocular depth estimation, Ishii et al. [15] introduced the Cutdepth method to address geometric variations in scenes. This method replaces a portion of the RGB image with real depth map information, thereby enhancing visual diversity while suppressing irrelevant geometric features in the image. Building on this concept, Kim et al. [16] proposed a variant of Cutdepth called Vertical-Cutdepth, which aims to strengthen the network’s ability to capture depth cues by preserving the vertical information in the image. These two methods are depicted in Figs. 1f and 1g. As mentioned in the introduction, although Vertical-Cutdepth motivates the network to learn cues in the vertical aspect, it fails to establish the correlation between the horizontal and vertical directions, and to alleviate this problem, we propose Perpendicular-Cutdepth, as shown in Fig. 1h. We present the specific algorithm in Section 3.3.
Our main motivation comes from neural networks for deep understanding of scenes. For real-world scenes, there will be a lot of texture information in the same plane, such as patterns, wall paintings, etc., which is depth independent. However, the boundary information in the scene is crucial for understanding depth. The network considers the areas where color changes occur as the boundaries of objects, but this part of information also includes texture information. Our motivation for this is to randomly reduce texture information while retaining useful boundary information during the learning process of neural networks. Because RGB and its corresponding depth images have similar edge information. Our idea is to replace some scenes in the real world with corresponding depth scenes. So the main problem is how to replace it. In previous work, Cutdepth [15] randomly cropped a rectangular area of the depth image and pasted it at the corresponding position of the RGB image. However, horizontal and vertical information should not be considered equally important. Dijk et al. [17] found that neural networks ignored the size of known occlusions in the process of depth cognition and chose the vertical position on the image, that is to say, the network only needs to know the location of the ground contact points of the object to infer approximate depth information. Kim et al. [16] proposed an improved method (Vertical-Cutdepth), which enables the network incentive network to focus on the vertical geometric information in the scene. Although this method does improve accuracy, we believe that focusing only on vertical information in the scene is far from enough. If only Vertical-Cutdepth is used, it can easily lead to incomplete plane of the object. The plane integrity of the object and the correlation between horizontal and vertical are crucial [34,35]. Therefore, we propose orthogonal cutting, which can guide the network to focus on vertical information in the scene, this has further deepened the network’s understanding of the plane of objects in the scene.
Our method is used in the data preprocessing process, but not throughout the entire dataset. In order to enhance the generalization ability of the network, we randomly select different scenes for data augmentation. Specifically, for the selected RGB image and corresponding depth map, we will randomly select a coordinate (l, u) in the image. Next, we will randomly select a cross-shaped region within the entire image. This enables the network to simultaneously consider correlations in both horizontal and vertical directions while preserving the vertical geometric structure in the image. For a given set of RGB images and their corresponding depth maps, the specific approach is shown in Algorithm 1, and Fig. 2 is data augmentation using the Perpendicular-Cutdepth method.
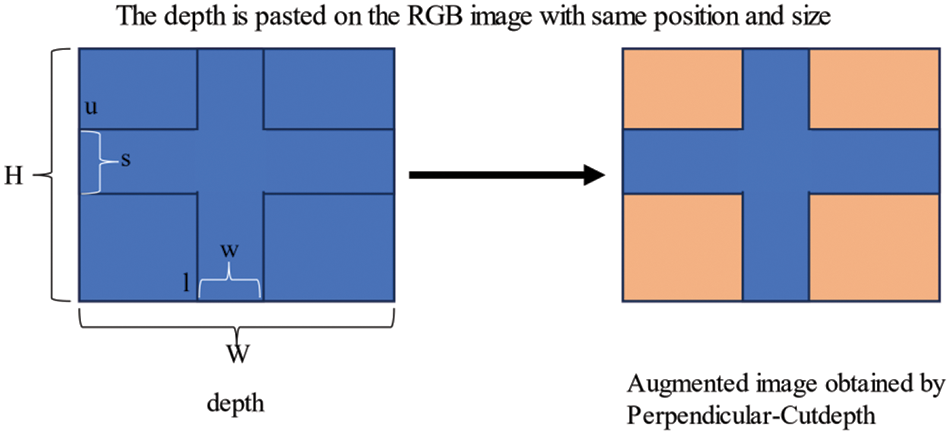
Figure 2: Data augmentation using Perpendicular-Cutdepth
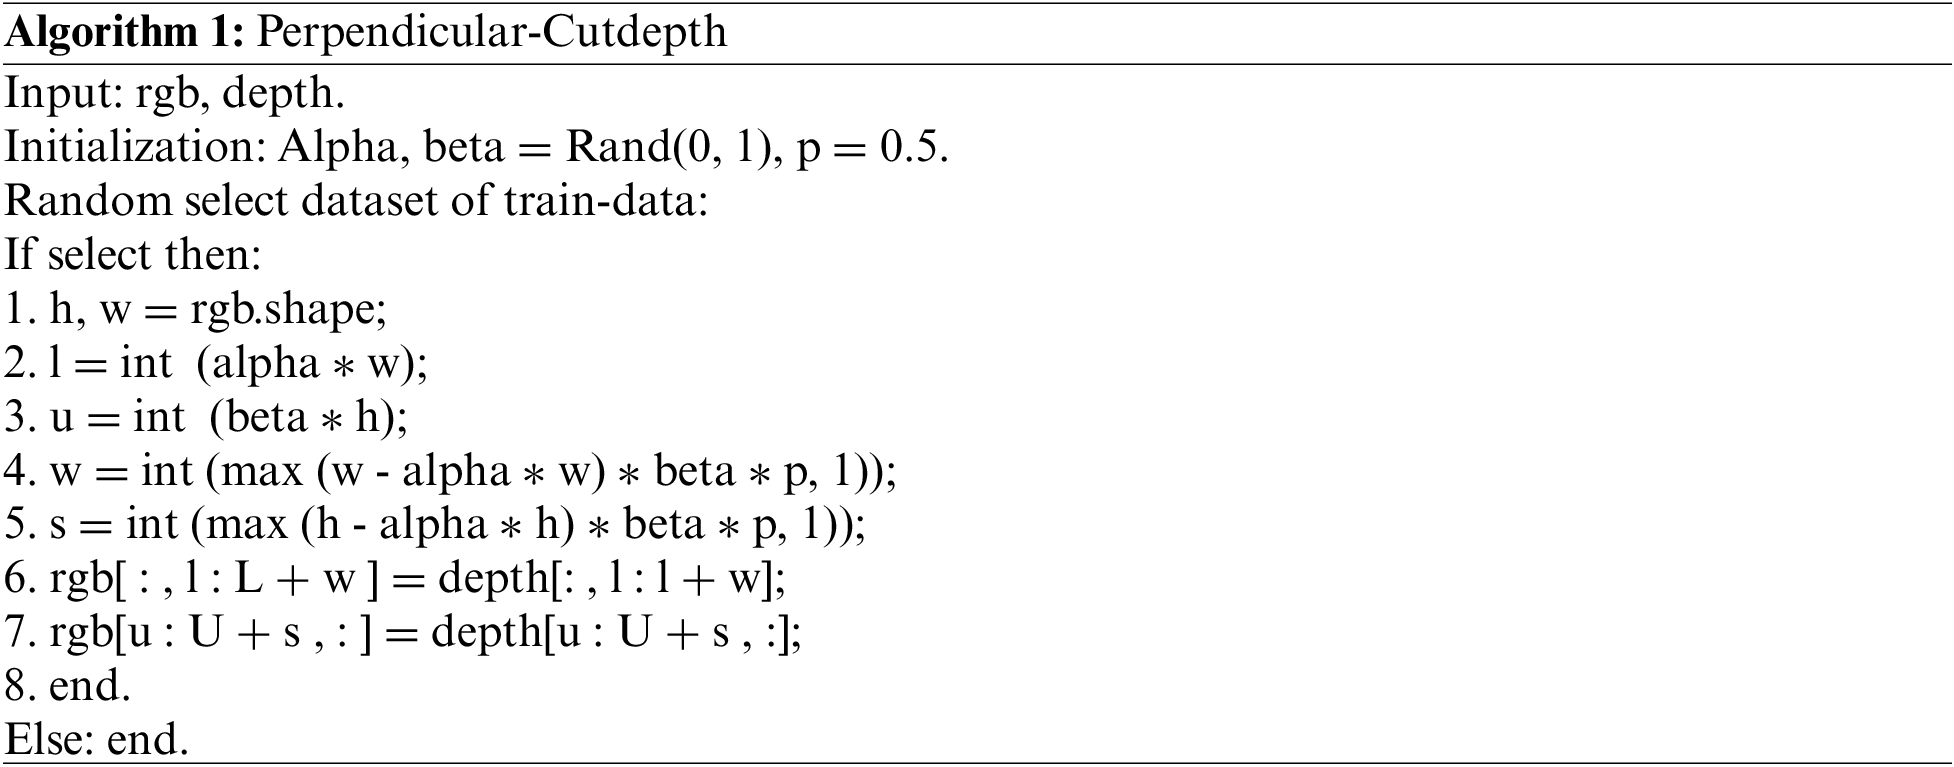
In Algorithm 1, alpha and beta represent random numbers ranging from 0 to 1, and p denotes a specified hyperparameter. Essentially, we randomly select a subset of data from the entire training data set for data augmentation. For the selected subset, we ensure that at least one pixel-wide region is cropped both horizontally and vertically. The start and end points of this region are chosen randomly to increase the generalization ability of the network.
To validate the effectiveness of the algorithm, we constructed a simple network architecture TransUnet. The Transformer serves as the encoder of the network, and we stack several upsampling layers. Then, layer-wise concatenation is used as the decoder. As shown in the Fig. 3, before inputting into the network, we apply various data augmentation methods to compare the final prediction results.
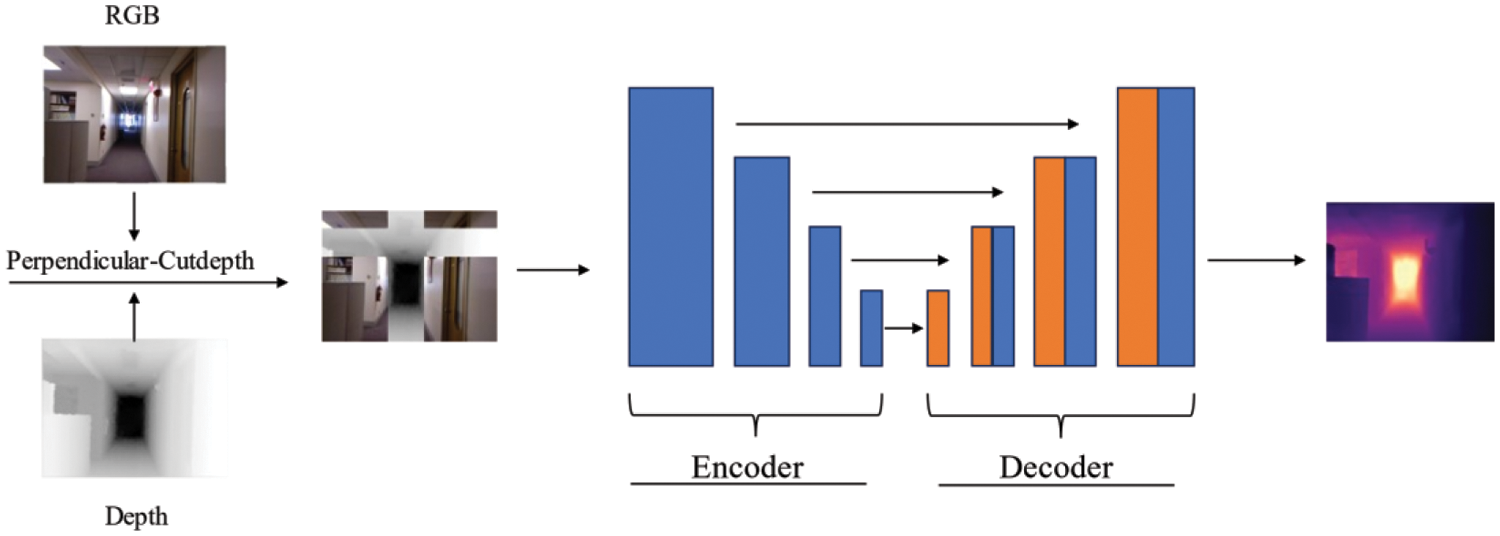
Figure 3: TransUnet network architecture
3.4 Accuracy Measures for Depth Estimation
We use the RMSE, REL,
RMSE: Root mean square error. Lower is better.
REL: Mean relative error. Lower is better.
We employed Transformer [29], and DenseNet161 [36] as the backbones for our experiments, both of which were pretrained on ImageNet. During the training process, we used the PyTorch framework and selected Adam as the optimizer for our network. The learning rate was decayed using a polynomial decay strategy, starting at 1e-4 and gradually decreasing to 1e-5. We set the values of
Our experiments were conducted on public datasets, namely the NYU dataset [18] and the KITTI dataset [19]. The NYU dataset comprises 464 color images from indoor scenes, each accompanied by corresponding depth maps. The valid depth range for this dataset is from 0.5 to 10 m. To train on the NYU dataset, we used a dataset of 20 k samples as the training set and 654 image-depth pairs for testing. During training, we randomly cropped images to the size of 576 × 448 pixels. The KITTI dataset contains images and corresponding depth maps captured using LiDAR sensors. It includes 61 outdoor scenes with distances ranging from 50 to 80 m. Similarly, we used a training dataset of 20 k samples and randomly cropped the data to the size of 375 × 1241 pixels. For evaluation, we employed the official 697 images provided by the KITTI dataset for depth assessment.
4.2 Comparation to the State-of-the-Art
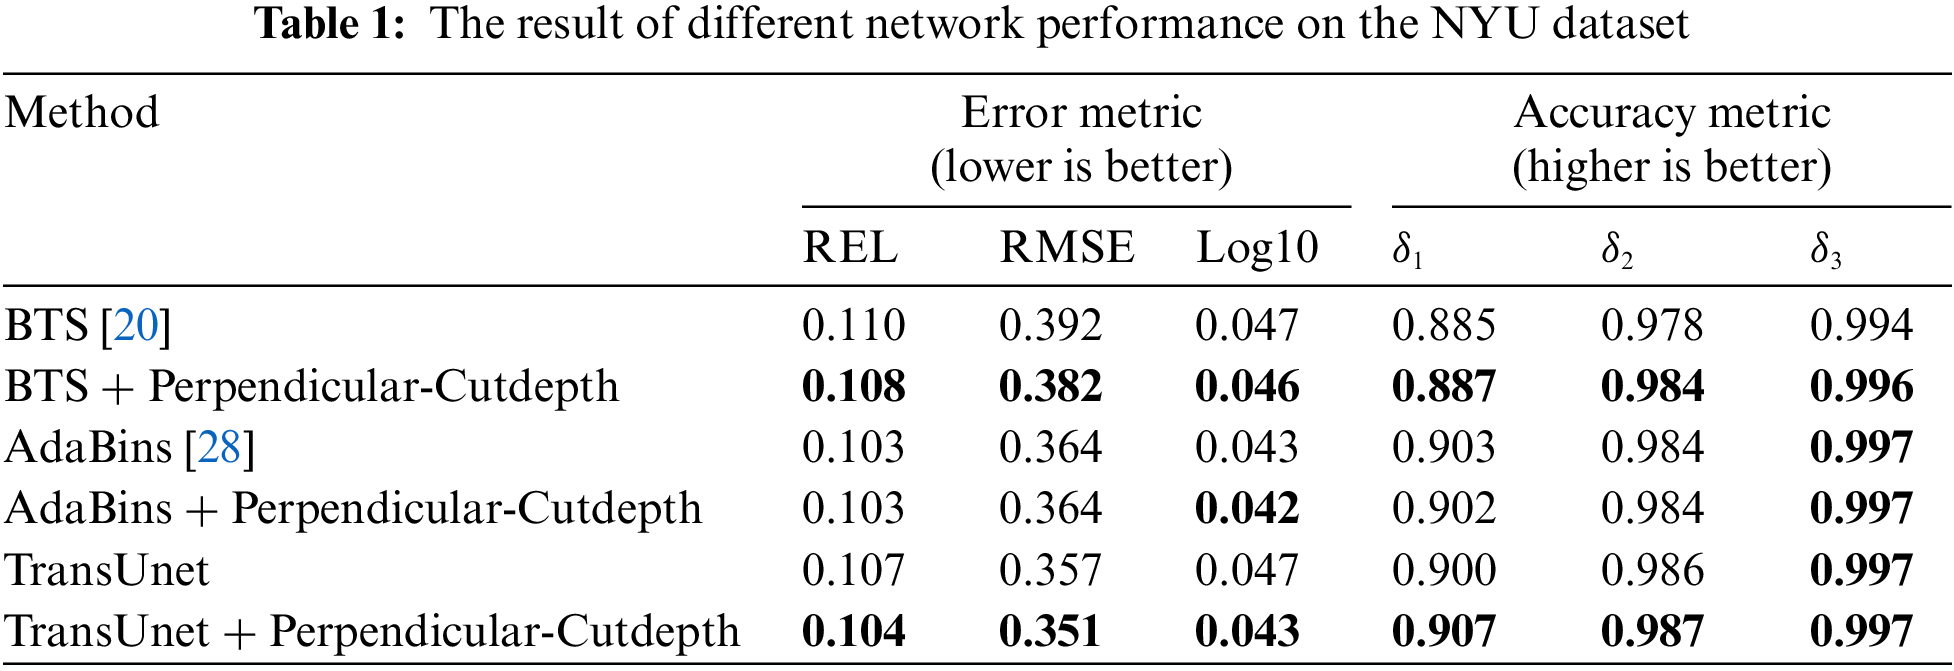
Table 1 shows our comparison results with different state-of-the-art models, from the table we can find that our proposed algorithm has limited improvement when targeting the latest model AdaBins [28], this is because the performance of the current model has reached a bottleneck, and the data enhancement algorithm alone is not enough to improve the performance of the network again. However, for some networks with weak generalization ability, such as BTS [20], and the Transformer network we constructed, the performance of the network can be significantly improved by using our algorithm, which also verifies the effectiveness of our algorithm for networks with weak generalization ability.
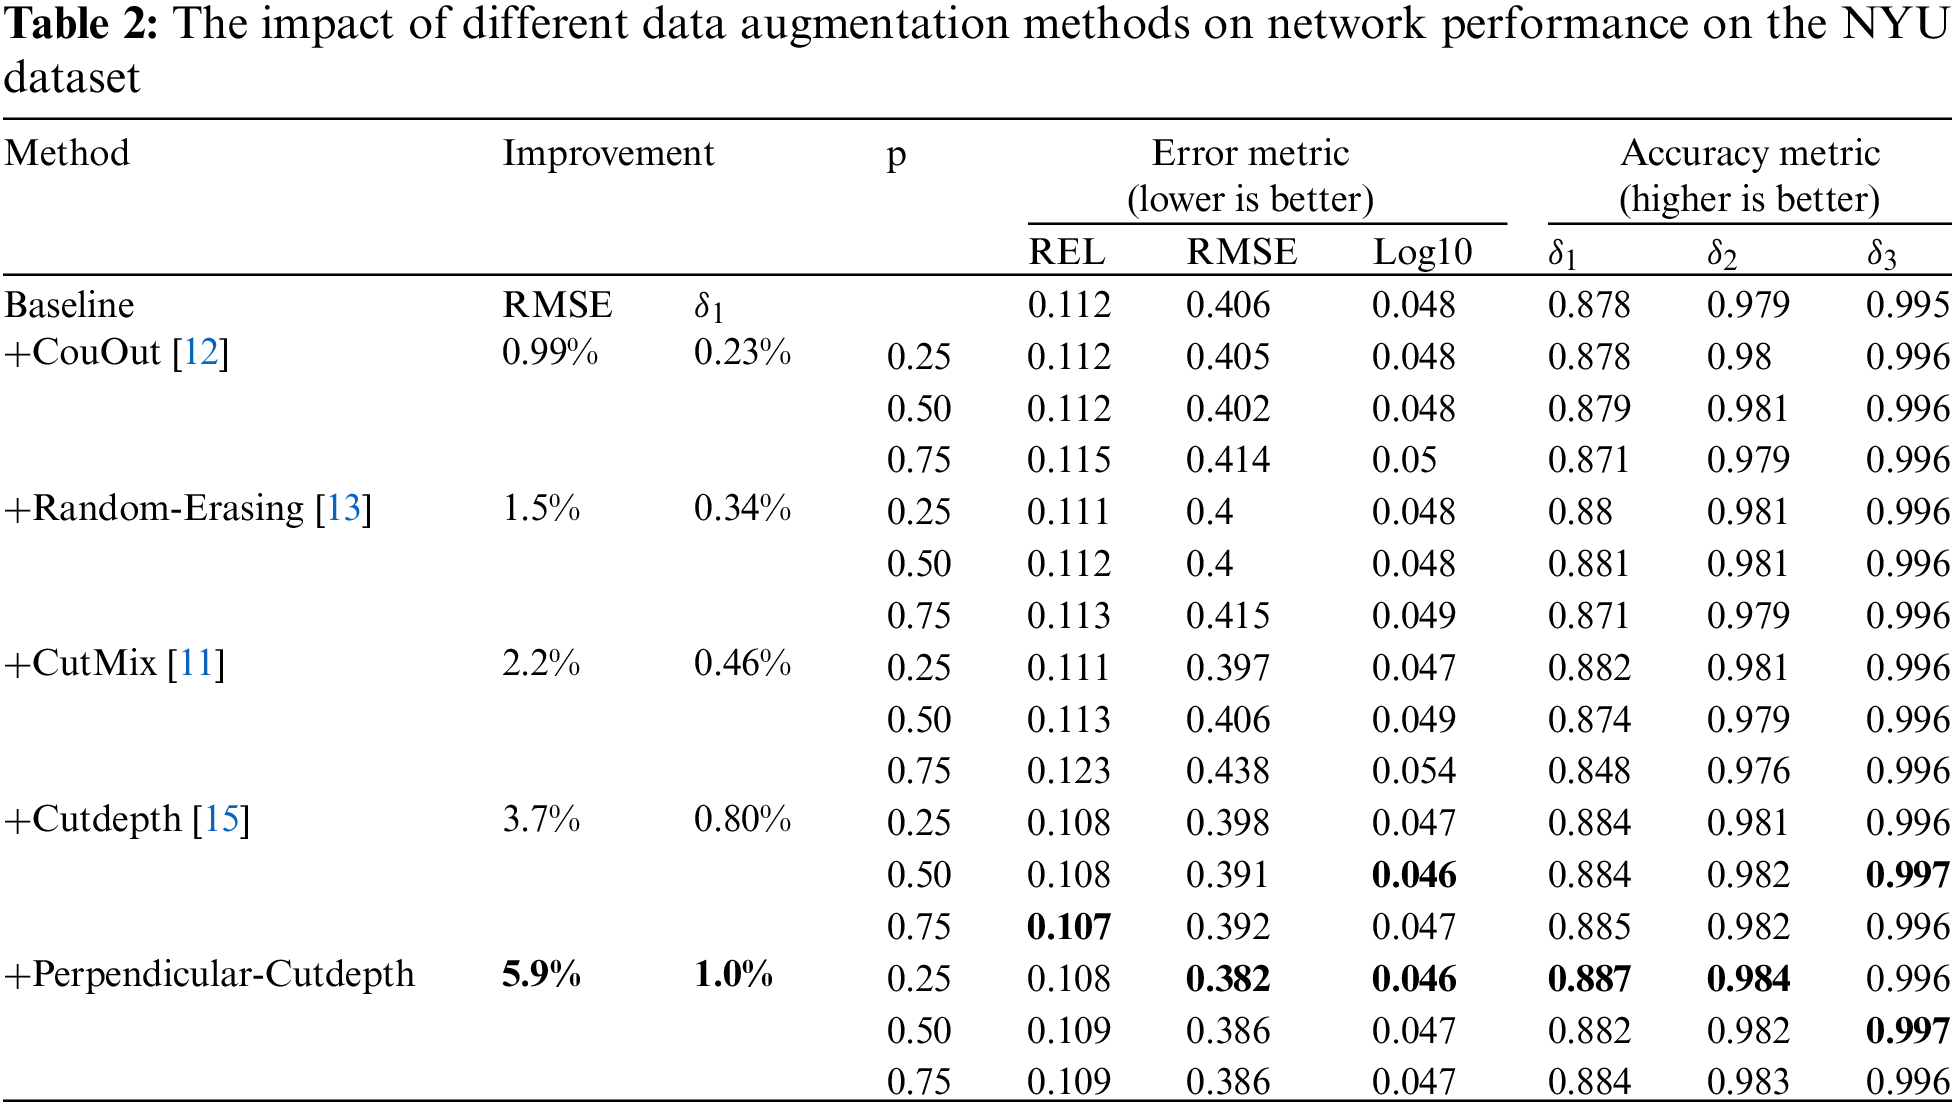
To validate the impact of different data augmentation methods on network performance, we followed the findings of Cutdepth [15] and experimented on the NYU indoor dataset [18] using BTS [20] as the backbone, BTS was pre-trained on ImageNet and using DenseNet161 [36] as the feature extractor. Table 2 displays the experimental results for CutOut [12], RE [13], CutMix [11], Cutdepth [15], and our proposed Perpendicular-Cutdepth under the same backbone. From the experimental results, we can observe that all these methods show varying degrees of improvement in the final depth evaluation metrics compared to the baseline. Among them, our proposed Perpendicular-Cutdepth method has an REL (mean absolute relative error) metric that is only 0.001 away from the best Cutdepth result. However, our RMSE (root mean square error) and accuracy measurement
4.4 The Impact of Geometric Structures on Network Performance in Data Augmentation
Fig. 4 shows different cut shapes for depth maps, where Figs. 4a and 4b are RGB images and corresponding depth maps, and Fig. 4c is the method of Cutdepth, which randomly cuts the rectangular part of the depth map and pastes it to the corresponding position of the RGB image. Kim et al. [16] discovered that replacing the vertical regions of depth maps in images with RGB images effectively improves the performance of network models. They introduced a variant of Cutdepth [15] called Vertical-Cutdepth (V-Cutdepth), as shown in Fig. 4d. However, we had doubts about whether the vertical region is the most appropriate segmentation algorithm. In order to explore the impact of the geometric shape of the segmented depth map region on the network, we propose two segmentation shape algorithms: Horizontal-Cutdepth (H-Cutdepth) and Perpendicular-Cutdepth (P-Cutdepth) methods. H-Cutdepth, as shown in Fig. 4e, selects the whole horizontal region for depth replacement. On the other hand, P-Cutdepth (Fig. 4f) simultaneously selects both horizontal and vertical regions for depth replacement in the corresponding areas of the real image. In addition, we adopt the network architecture designed in Fig. 3 as the main structure of our network, where the backbone utilizes Transformer instead of CNN, and the decoding part is represented by the decoder in Fig. 3. The experimental results on the NYU indoor dataset, as shown in Table 3, demonstrate that our proposed P-Cutdepth method outperforms existing depth estimation data augmentation methods. Through corresponding data analysis, it is evident that merely changing the geometric structure can indeed improve the network performance. Under the same hyperparameters, P-Cutdepth shows better results in terms of accuracy measurement and error rate. Our proposed method reduces the RMSE error rate from 0.357 to 0.351, a decrease of 1.6%, while V-Cutdepth decreases by 1.1%, H-Cutdepth and Cutdepth both decrease by 0.84%. The accuracy
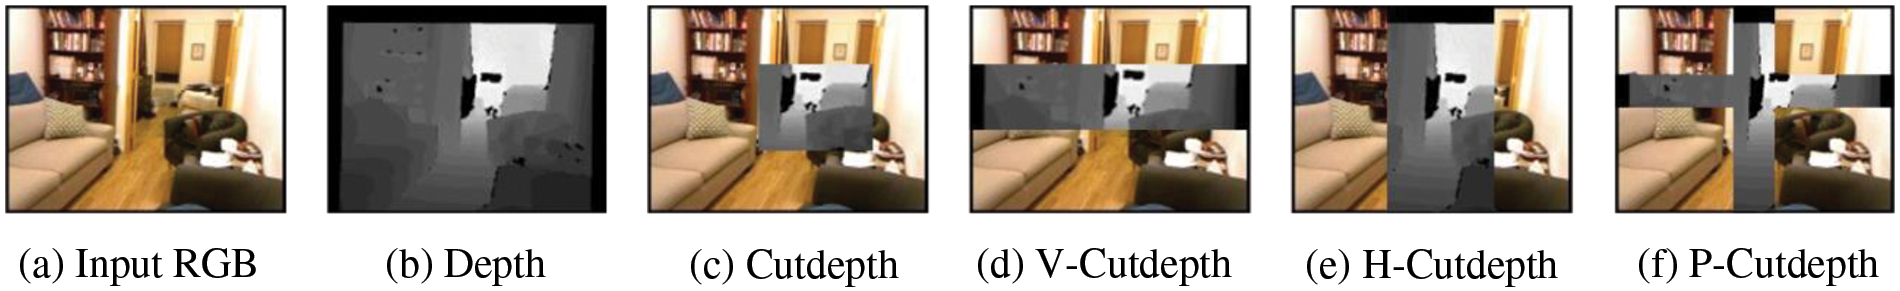
Figure 4: Cutdepth and some variants of the Cutdepth. We use the prefixes V-Cutdepth, H-Cutdepth, and P-Cutdepth to represent three different methods, corresponding to vertical, horizontal, and perpendicular, respectively
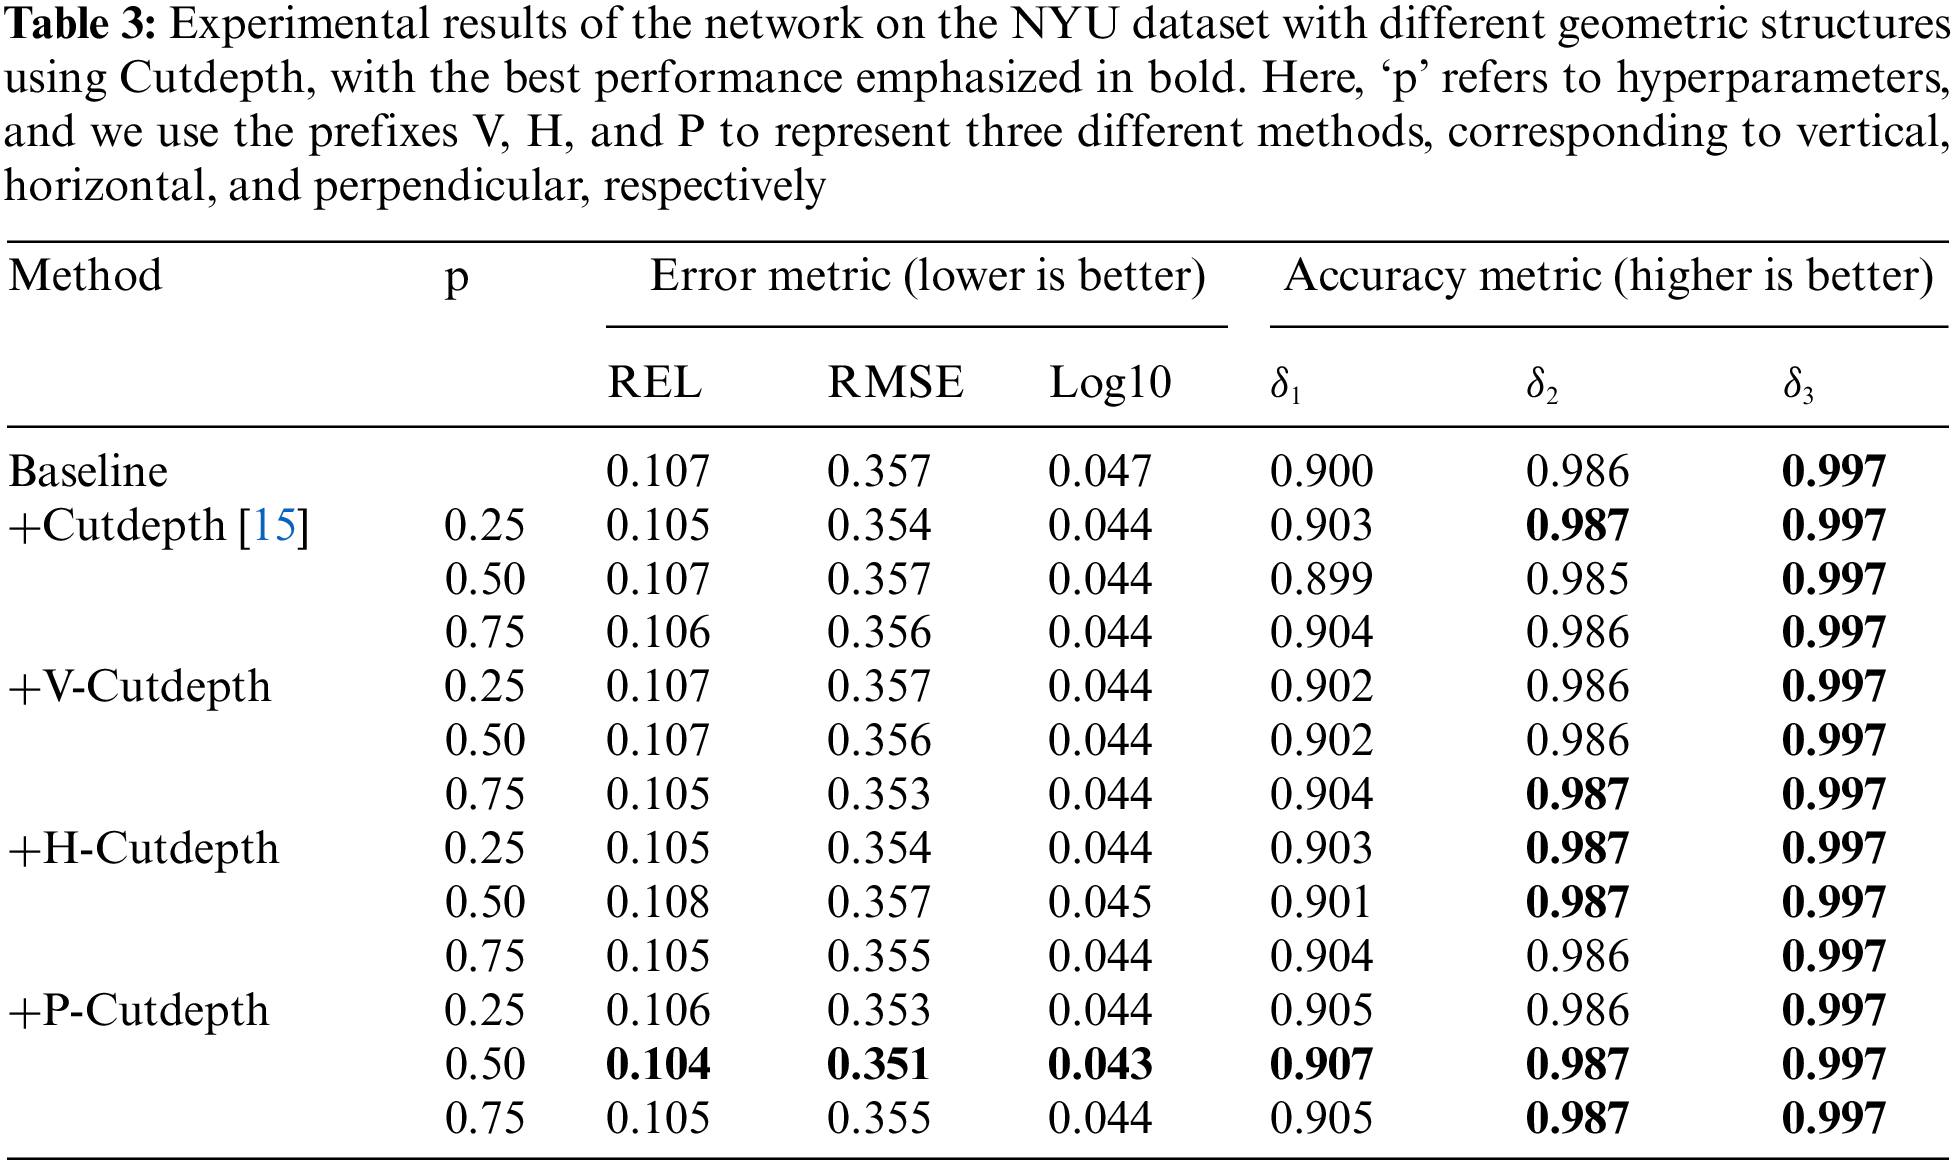
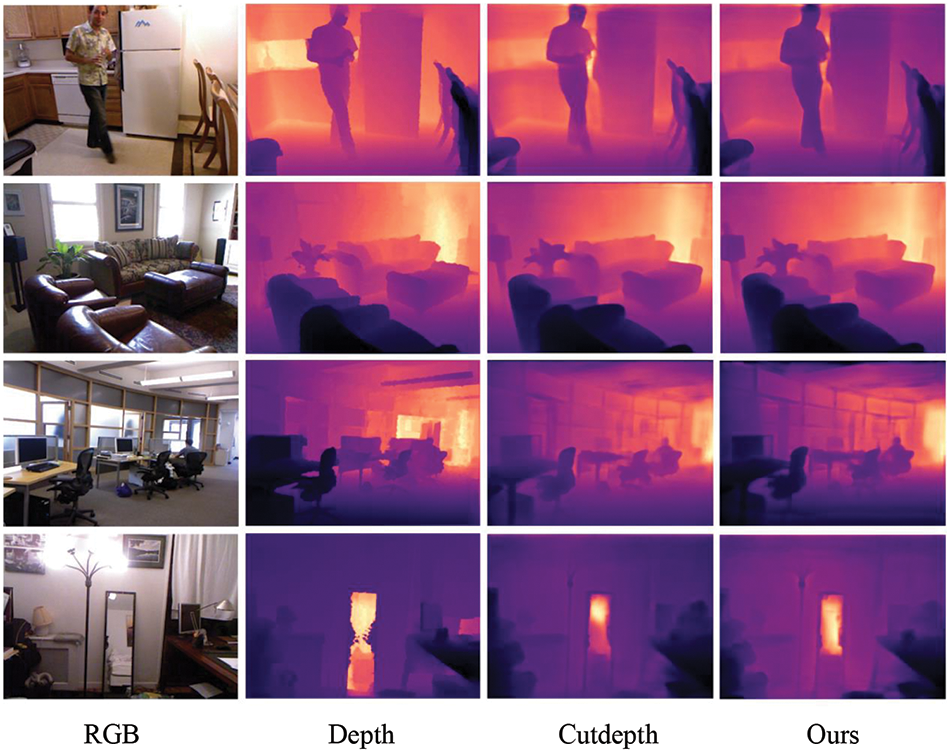
Figure 5: Results visualized on the NYU dataset, from left to right: RGB, depth, result of Cutdepth and ours
To further compare the differences between our proposed method and the Cutdepth method, we conducted comparative experiments on the KITTI outdoor dataset. The experimental results are shown in Table 4. We found that using the Cutdepth data augmentation method in outdoor environments did not lead to any further improvement in network performance. In fact, all metrics showed a decrease. In contrast, our algorithm showed improvements in both the accuracy and error rate evaluation metrics. Therefore, compared to the Cutdepth algorithm, our method can improve network performance not only in indoor environments but also in outdoor environments, demonstrating the stronger generalization capability of our algorithm. Fig. 6 provides a comparison of depth map predictions between our method and Cutdepth.
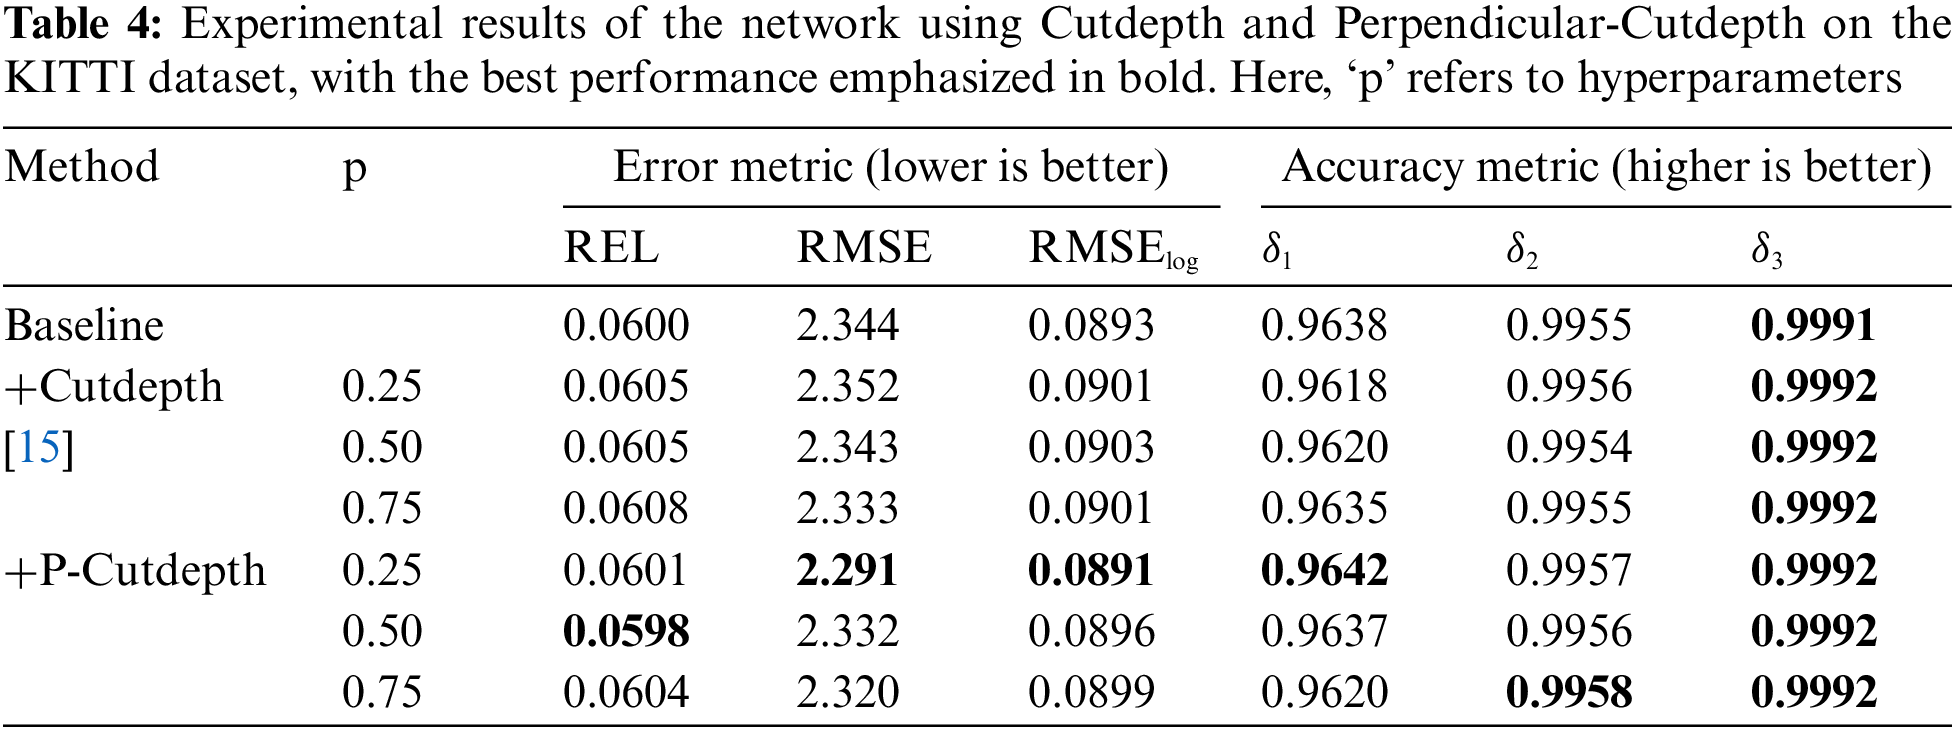
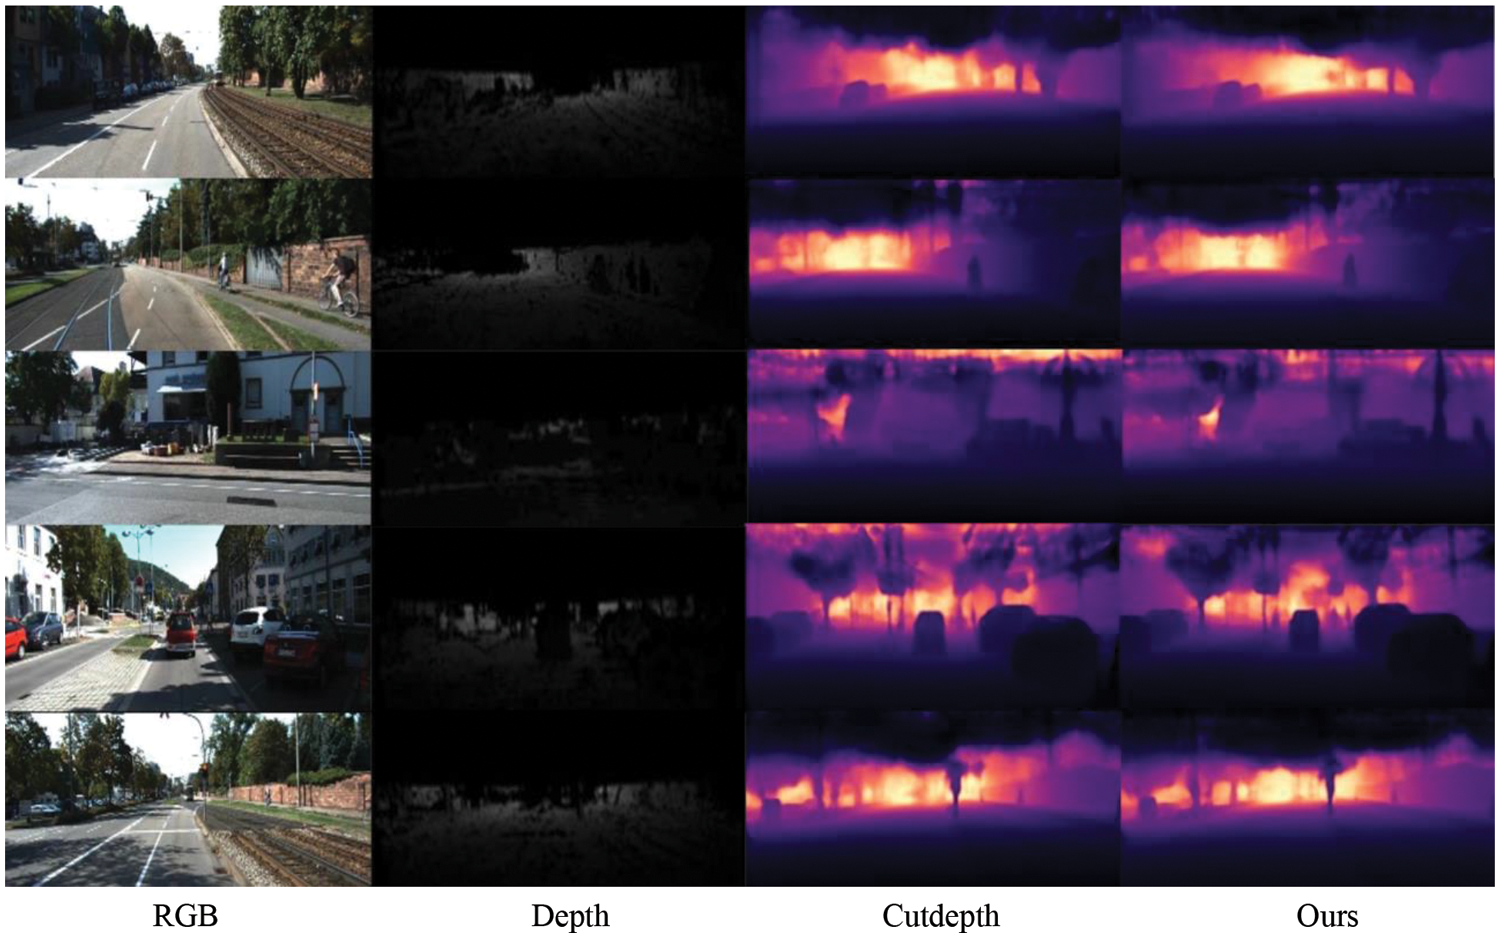
Figure 6: Results visualized on the KITTI dataset, from left to right: RGB, depth, result of Cutdepth and ours
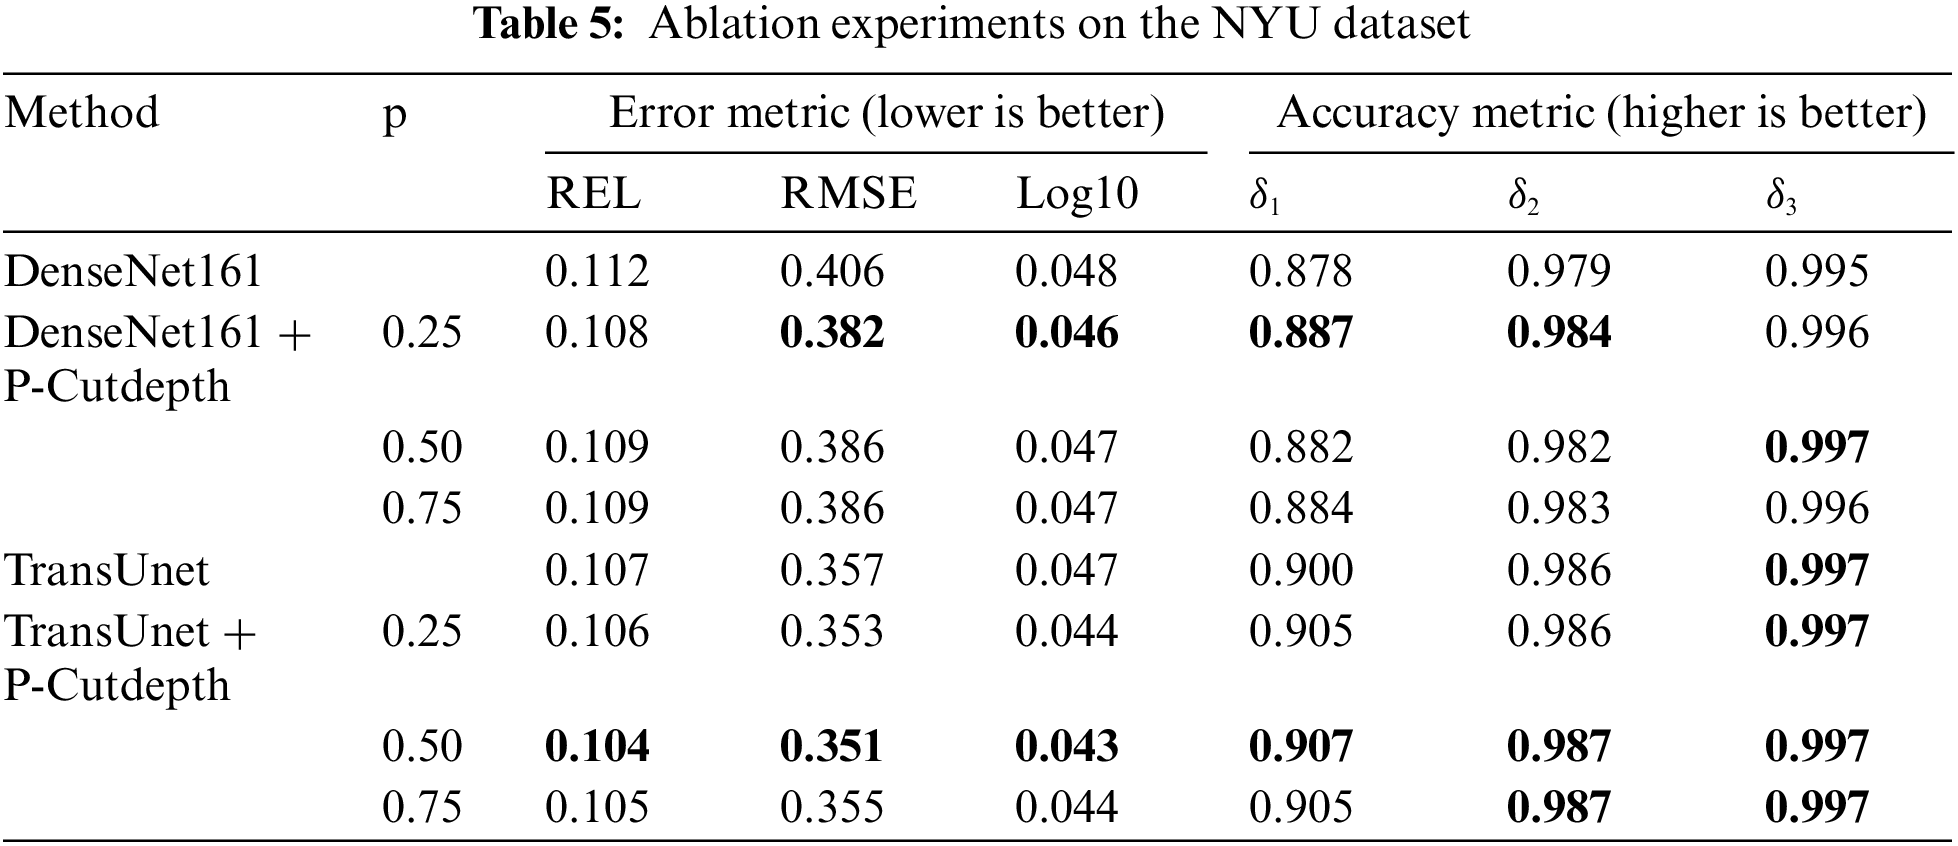
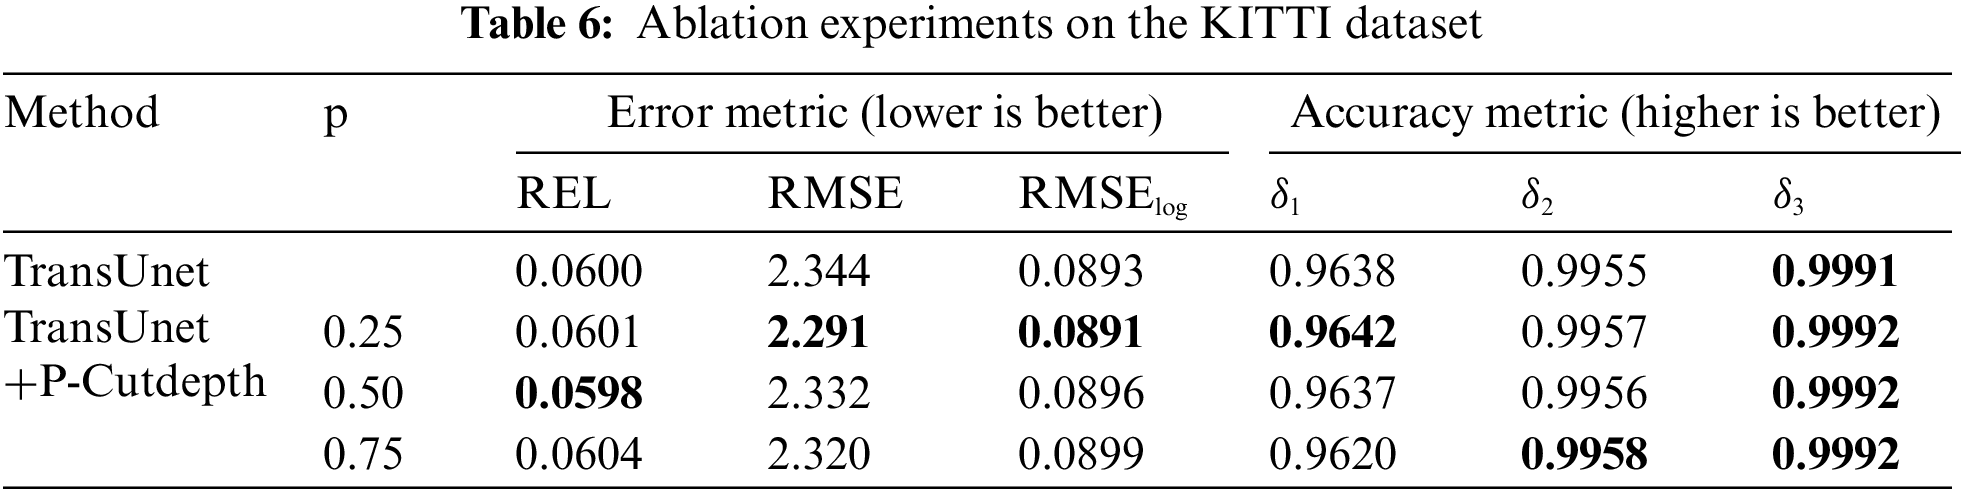
To more intuitively illustrate the effectiveness of our proposed method, we conducted ablation experiments on NYU dataset using both CNN and the Transformer network structure designed in Fig. 3. From Table 5, it can be observed that our proposed method shows improvement regardless of the value of the hyperparameter p. Additionally, the experimental results do not increase with an increase in P, indicating the stability of our network. Furthermore, we also conducted ablation experiments on KITTI, and the results in Table 6 demonstrate that our method enhances the network to a certain extent in both indoor and outdoor environments.
In this paper, we have introduced a novel data augmentation method for depth estimation. In contrast to traditional methods, our proposed approach involves replacing the horizontal and vertical regions of RGB images with corresponding depth regions. This enhances the ability of the network to extract features in both horizontal and vertical directions. Through extensive experiments, we have not only confirmed that altering geometric structures can improve model performance, but also demonstrated the superiority of our proposed Perpendicular-Cutdepth over traditional data augmentation methods. In future work, we will validate the effectiveness of the proposed method in other domains.
Acknowledgement: The authors would like to thank the editors and reviewers for their valuable work, as well as the supervisor and family for their valuable support during the research process.
Funding Statement: This work was supported by the Grant of Program for Scientific Research Innovation Team in Colleges and Universities of Anhui Province (2022AH010095); The Grant of Scientific Research and Talent Development Foundation of the Hefei University (No. 21-22RC15); The Key Research Plan of Anhui Province (No. 2022k07020011); The Grant of Anhui Provincial Natural Science Foundation, No. 2308085MF213; The Open Fund of Information Materials and Intelligent Sensing Laboratory of Anhui Province IMIS202205, as well as the AI General Computing Platform of Hefei University.
Author Contributions: The authors confirm contribution to the paper as follows: Le Zou: Methodology, Investigation, Funding. Linsong Hu: Investigation, Writing Review and Editing, Writing-Original Draft and Methodology. Yifang Wang: Resources, Validation. Zhize Wu and Xiaofeng Wang: Writing Review and Editing, Funding. All authors reviewed the results and approved the final version of the manuscript.
Availability of Data and Materials: The data that support the findings of this study are openly at: https://drive.google.com/file/d/1AysroWpfISmm-yRFGBgFTrLy6FjQwvwP/view?usp=sharing. https://www.cvlibs.net/datasets/kitti/.
Conflicts of Interest: The authors declare that they have no conflicts of interest to report regarding the present study.
References
1. Y. Gao, X. Liu, and J. Xiang, “Fault detection in gears using fault samples enlarged by a combination of numerical simulation and a generative adversarial network,” IEEE/ASME Trans. Mechatron., vol. 27, pp. 3798–3805, 2022. [Google Scholar]
2. Y. Gao, X. Liu, and J. Xiang, “FEM Simulation-based generative adversarial networks to detect bearing faults,” IEEE Trans. Ind. Inform., vol. 16, no. 7, pp. 4961–4971, 2020. [Google Scholar]
3. X. Liu, H. Huang, and J. Xiang, “A personalized diagnosis method to detect faults in gears using numerical simulation and extreme learning machine,” Knowl.-Based Syst., vol. 195, pp. 105653, 2020. [Google Scholar]
4. J. Xiang and Y. Zhong, “A novel personalized diagnosis methodology using numerical simulation and an intelligent method to detect faults in a shaft,” Appl. Sci., vol. 6, pp. 414, 2016. [Google Scholar]
5. S. Lei, M. Lu, J. Lin, X. Zhou, and X. Yang, “Remote sensing image denoising based on improved semi-soft threshold,” Signal Image Video Process., vol. 15, pp. 73–81, 2021. [Google Scholar]
6. Z. Bao, G. Zhang, B. Xiong, and S. Gai, “New image denoising algorithm using monogenic wavelet transform and improved deep convolutional neural network,” Multimed. Tools Appl., vol. 79, pp. 7401–7412, 2020. [Google Scholar]
7. Y. Lou, A. Kumar, and J. Xiang, “Machinery fault diagnosis based on domain adaptation to bridge the gap between simulation and measured signals,” IEEE Trans. Instrum. Meas., vol. 71, pp. 1–9, 2022. [Google Scholar]
8. T. Zhang, J. Chen, J. Xie, and T. Pan, “SASLN: Signals augmented self-taught learning networks for mechanical fault diagnosis under small sample condition,” IEEE Trans. on Instrum. Meas., vol. 70, pp. 1–11, 2021. [Google Scholar]
9. J. Yoo, N. Ahn, and K. A. Sohn, “Rethinking data augmentation for image super-resolution: A comprehensive analysis and a new strategy,” in Proc. CVPR, Seattle, WA, USA, 2020, pp. 8375–8384. [Google Scholar]
10. C. Gong, D. Wang, M. Li, V. Chandra, and Q. Liu, “KeepAugment: A simple information-preserving data augmentation approach,” in Proc. CVPR, Nashville, TN, USA, 2021, pp. 1055–1064. [Google Scholar]
11. S. Yun, D. Han, S. J. Oh, S. Chun, J. Choe, and Y. Yoo, “CutMix: Regularization strategy to train strong classifiers with localizable features,” in Proc. ICCV, Seoul, South Korea, 2019, pp. 6023–6032. [Google Scholar]
12. T. Devries and G. W. Taylor, “Improved regularization of convolutional neural networks with cutout,” arXiv preprint arXiv:1708.04552, 2017. [Google Scholar]
13. Z. Zhong, L. Zheng, G. Kang, S. Li, and Y. Yang, “Random erasing data augmentation,” in Proc. AAAI, San Francisco, CA, USA, 2017, pp. 13001–13008. [Google Scholar]
14. G. Ghiasi, Y. Cui, A. Srinivas, R. Qian, and B. Zoph, “Simple copy-paste is a strong data augmentation method for instance segmentation,” in Proc. CVPR, Nashville, TN, USA, 2021, pp. 2917–2927. [Google Scholar]
15. Y. Ishii and T. Yamashita, “CutDepth: Edge-aware data augmentation in depth estimation,” arXiv preprint arXiv:2107.07684, 2021. [Google Scholar]
16. D. Kim, W. Ga, P. Ahn, D. Joo, S. Chun, and J. Kim, “Global-local path networks for monocular depth estimation with vertical cutdepth,” arXiv preprint arXiv:2201.07436, 2022. [Google Scholar]
17. T. Dijk and G. Croon, “How do neural networks see depth in single images?,” in Proc. ICCV, Seoul, Korea (South2019, pp. 2183–2191. [Google Scholar]
18. N. Silberman, D. Hoiem, P. Kohli, and R. Fergus, “Indoor segmentation and support inference from RGBD images,” in Proc. ECCV, Florence, Italy, 2012, pp. 746–760. [Google Scholar]
19. A. Geiger, P. Lenz, C. Stiller, and R. Urtasun, “Vision meets robotics: The KITTI dataset,” Int. J. Robot. Res., vol. 32, pp. 1231–1237, 2013. [Google Scholar]
20. J. H. Lee, M. K. Han, D. W. Ko, and I. H. Suh, “From big to small: Multi scale local planar guidance for monocular depth estimation,” arXiv preprint arXiv:1907.10326, 2019. [Google Scholar]
21. Y. Li, Y. Guo, Z. Yan, X. Huang, Y. Duan and L. Ren, “OmniFusion: 360 monocular depth estimation via geometry-aware fusion,” in Proc. CVPR, New Orleans, LA, USA, 2022, pp. 2791–2800. [Google Scholar]
22. J. Hu et al., “Boosting lightweight depth estimation via knowledge distillation,” in Proc. KSEM, Guangzhou, China, 2021, pp. 27–39. [Google Scholar]
23. T. Wang, X. Zhu, J. Pang, and D. Lin, “Probabilistic and geometric depth: Detecting objects in perspective,” in Proc. CoRL, London, USA, 2021, pp. 1475–1485. [Google Scholar]
24. M. Tan and Q. Le, “EfficientNet: Rethinking model scaling for convolutional neural networks,” in Proc. ICML, Los Angeles, CA, USA, 2019, pp. 6105–6114. [Google Scholar]
25. S. H. Gao et al., “Res2Net: A new multi-scale backbone architecture,” IEEE Trans. Pattern Anal. Mach. Intell., vol. 43, no. 2, pp. 652–662, 2019. [Google Scholar]
26. Y. Lin, T. Cheng, Q. Zhong, W. Zhou, and H. Yang, “Dynamic spatial propagation network for depth completion,” in Proc. AAAI, Ancouver, Canada, 2022, pp. 1638–1646. [Google Scholar]
27. V. Patil, C. Sakaridis, A. Liniger, and L. Van Gool, “P3Depth: Monocular depth estimation with a piecewise planarity prior,” in Proc. CVPR, New Orleans, LA, USA, 2022, pp. 1610–1621. [Google Scholar]
28. S. Farooq Bhat, I. Alhashim, and P. Wonka, “AdaBins: Depth estimation using adaptive bins,” in Proc. CVPR, Nashville, TN, USA, 2021, pp. 4009–4018. [Google Scholar]
29. E. Xie, W. Wang, Z. Yu, A. Anandkumar, J. M. Alvarez and P. Luo, “SegFormer: Simple and efficient design for semantic segmentation with transformers,” in Proc. NIPS, 2021, pp. 12077–12090. [Google Scholar]
30. Z. Liu et al., “Swin transformer: Hierarchical vision transformer using shifted windows,” in Proc. ICCV, Montreal, QC, Canada, 2021, pp. 10012–10022. [Google Scholar]
31. S. F. Bhat, I. Alhashim, and P. Wonka, “Localbins: Improving depth estimation by learning local distributions,” in Proc. ECCV, Tel Aviv, Israel, 2022, pp. 480–496. [Google Scholar]
32. A. Agarwal and C. Arora, “Depthformer: Multiscale vision transformer for monocular depth estimation with global local information fusion,” in Proc. ICIP, Bordeaux, France, 2022, pp. 3873–3877. [Google Scholar]
33. J. Jun, J. H. Lee, C. Lee, and C. S. Kim, “Depth map decomposition for monocular depth estimation,” in Proc. ECCV, Tel Aviv, Israel, 2022, pp. 18–34. [Google Scholar]
34. G. Irie, D. Ikami, T. Kawanishi, and K. Kashino, “Cascaded transposed long-range convolutions for monocular depth estimation,” in Proc. ACCV, Kyoto, Japan, 2020, pp. 437–453. [Google Scholar]
35. M. Heo, J. Lee, K. R. Kim, H. U. Kim, and C. S. Kim, “Monocular depth estimation using whole strip masking and reliability-based refinement,” in Proc. ECCV, Munich, Germany, 2018, pp. 36–51. [Google Scholar]
36. G. Huang, Z. Liu, L. van der Maaten, and K. Q. Weinberger, “Densely connected convolutional networks,” in Proc. CVPR, Honolulu, HI, USA, 2017, pp. 4700–4708. [Google Scholar]
Cite This Article
 Copyright © 2024 The Author(s). Published by Tech Science Press.
This work is licensed under a Creative Commons Attribution 4.0 International License , which permits unrestricted use, distribution, and reproduction in any medium, provided the original work is properly cited.
 Downloads
 Citation Tools