
 Submit a Paper
 Propose a Special lssue
 Open Access
ARTICLE

RE-SMOTE: A Novel Imbalanced Sampling Method Based on SMOTE with Radius Estimation
1 Shenyang Fire Science and Technology Research Institute, Ministry of Emergency Management of the People’s Republic of China, Shenyang, 110034, China
2 College of Software, Northeastern University, Shenyang, 110006, China
* Corresponding Author: Ming Zhang. Email:
Computers, Materials & Continua 2024, 81(3), 3853-3880. https://doi.org/10.32604/cmc.2024.057538
Received 20 August 2024; Accepted 12 October 2024; Issue published 19 December 2024
 View Full Text
 Download PDF
Abstract
Imbalance is a distinctive feature of many datasets, and how to make the dataset balanced become a hot topic in the machine learning field. The Synthetic Minority Oversampling Technique (SMOTE) is the classical method to solve this problem. Although much research has been conducted on SMOTE, there is still the problem of synthetic sample singularity. To solve the issues of class imbalance and diversity of generated samples, this paper proposes a hybrid resampling method for binary imbalanced data sets, RE-SMOTE, which is designed based on the improvements of two oversampling methods parameter-free SMOTE (PF-SMOTE) and SMOTE-Weighted Ensemble Nearest Neighbor (SMOTE-WENN). Initially, minority class samples are divided into safe and boundary minority categories. Boundary minority samples are regenerated through linear interpolation with the nearest majority class samples. In contrast, safe minority samples are randomly generated within a circular range centered on the initial safe minority samples with a radius determined by the distance to the nearest majority class samples. Furthermore, we use Weighted Edited Nearest Neighbor (WENN) and relative density methods to clean the generated samples and remove the low-quality samples. Relative density is calculated based on the ratio of majority to minority samples among the reverse k-nearest neighbor samples. To verify the effectiveness and robustness of the proposed model, we conducted a comprehensive experimental study on 40 datasets selected from real applications. The experimental results show the superiority of radius estimation-SMOTE (RE-SMOTE) over other state-of-the-art methods. Code is available at: (accessed on 30 September 2024).Keywords
In recent years, machine learning techniques have played critical roles in the explosive data generated in various fields [1,2]. However, the imbalanced data distribution poses a significant challenge to traditional machine-learning techniques. Specifically, unbalanced datasets suffer from a skewed distribution of categories, with some classes significantly exceeding others. Various real-world applications encounter this issue, including fault diagnosis [3], fraud detection, bioinformatics, soil classification, and credit risk assessment [4].
The primary problem for unbalanced datasets is that it makes the model training unusable, which works well on balanced datasets by calibrating the loss function for optimal accuracy. For example, when the ratio of majority class to minority class is 98:2, the accuracy can still reach 98% even if all the samples are classified as majority class. On the other hand, all minority samples are ignored and misclassified, which makes it problematic in real-life applications. Accurate identification of cancer patients is of greater importance than that of non-cancer patients [5]. This study investigates binary imbalanced datasets where class relationships are clearly defined: one class represents the majority, while the other represents the minority.
The fundamental approach to addressing the binary class imbalance issue is to mitigate the bias toward the majority class and enhance the focus on the minority class, thereby achieving balanced performance across both classes [6]. It can be categorized into 3 types, data-level methods, algorithm-level methods, and cost-sensitive methods. Data-level methods balance the number of samples between majority and minority-based sampling, i.e., oversampling [7], cut sampling [8], and mixed [9–11]. Algorithm-level methods try to modify the classification model to improve the performance, such as changing the decision threshold for each class and training the classifier separately [12–14]. Cost-sensitive methods can be seen as a hybrid of data-level and algorithm-level. It incorporates misclassification costs or samples into the optimization process [15–18]. Among these, data-level methods are the most widely used compared to algorithm-level methods that rely on specific classifiers, or problem-specific cost-sensitive methods.
Chawla et al. [7] proposed the synthetic minority oversampling technique (SMOTE), which balanced the class distribution by adding synthetic minority samples. It reduced the possibility of overfitting and improved the generalization performance of the classifier on the test set. Unlike random oversampling with repeated samples, SMOTE generates synthetic samples by using the k-nearest neighbors of the considered minority class samples. In the last decade, various approaches have been studied to improve SMOTE at different levels, including (1) Improvements in the initial selection of samples, (2) Combination with undersampling, (3) Improvements in interpolation type, (4) Combination with feature selection or dimensionality reduction, (5) Adaptive sample generation, and (6) Filtering out noisy samples. Most of these SMOTE-based methods only focus on synthesizing a safe minority of samples and ignore other minority classes. It cannot overcome the data distribution of unbalanced datasets, which is prone to the distribution marginalization problem. Since the distribution of minority class samples dictates their available nearest neighbors, if a minority class sample lies at the boundary of the distribution, the interpolated samples generated from this sample and its neighbors will also be positioned near the edge, further marginalizing them. This results in a blurring of the boundary between majority and minority class samples, leading to more significant boundary ambiguity. While this process may balance the dataset, it also increases the complexity of the classification algorithm.
To solve the above problems, we propose radius estimation-SMOTE (RE-SMOTE) which is essentially an improved model based on parameter-free SMOTE (PF-SMOTE) [19] and SMOTE-Weighted Ensemble Nearest Neighbor (SMOTE-WENN) [20]. Specifically, the minority class is first divided into boundary minority and safe minority, as used in PF. For safe minority synthesis, the synthesized samples are interpolated into the region dominated by the minority class, while a Gaussian process is adopted to expand the boundaries of the minority class. Hence, boundary minority and safe minority samples are all reorganized. Then, data cleaning is performed based on WENN and relative density estimation. Different distance weights are applied to the majority and minority class samples by considering local imbalance and spatial sparsity. Relative density determines whether a sample is noisy by calculating a ratio between the number of majority samples and minority samples among reverse k-nearest neighbor samples. An extensive experimental study is conducted to evaluate the effectiveness of the RE-SMOTE method. In this study, 40 datasets are selected from the KEEL dataset repository. Commonly used evaluation metrics, such as the area under the curve (AUC) [21], F1 score, and the Wilcoxon signed-rank test [22], are employed for performance assessment.
In summary, the contributions of this paper are as follows:
(1) We propose RE-SMOTE, an advanced model that builds upon the foundational principles of PF-SMOTE and SMOTE-WENN. This hybrid approach leverages the strengths of both methods to more effectively tackle the problem of class imbalance.
(2) We classify minority class samples into boundary minority and safe minority categories. For the synthesis of safe minority samples, a Gaussian process is utilized to strategically expand the class boundaries, ensuring that these samples are interpolated within regions predominantly occupied by the minority class. This approach enhances the diversity and representativeness of the synthesized samples.
(3) The model incorporates advanced data-cleaning mechanisms using the WENN method and relative density estimation. By applying varying distance weights based on local class imbalance and spatial sparsity, this approach accurately identifies and eliminates noisy samples. The relative density is computed as the ratio of majority to minority class samples within the reverse k-nearest neighbors, ensuring a precise cleaning process that enhances the overall quality of the dataset.
(4) To demonstrate the robustness and effectiveness of the proposed RE-SMOTE method, comprehensive experiments are evaluated on 40 imbalanced data sets.
The rest of this paper is structured as follows: The related works are provided in Section 2. Section 3 describes RE-SMOTE in detail. Section 4 sets up the experiment. The experimental results and discussions are analyzed in Section 5. Finally, Section 6 concludes this paper.
In this section, the generic SMOTE method is first introduced, which is illustrated in Fig. 1. Sample
where
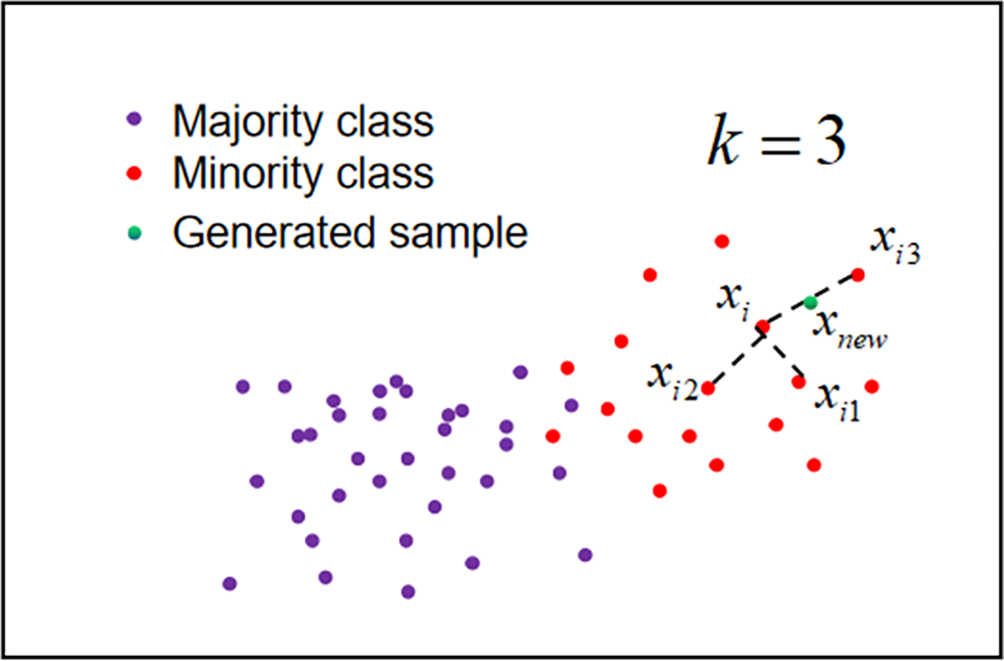
Figure 1: The basic principle of SMOTE
As an effective method, many researches have been done based on SMOTE.
(1) Synthetic minority oversampling algorithm based on nearest neighbors (SMOM): A synthetic minority oversampling algorithm based on nearest neighbors SMOM is proposed in reference [23]. For the minority class sample, its k-nearest neighbor samples are set with different weights. A smaller weight is assigned to the sample’s direction which may result in severe over-generalization. Then Neighborhood-Based Density-Oriented Sampling (NBDOS) clustering and a double loop filter are applied to reduce the cost of distance computation. The security coefficient of the sample neighborhood for minority class oversampling (SSCMIO) is another way to avoid over-generalization [24], which makes oversampling based on the security coefficient of the neighborhood. A synthetic oversampling method with minority and majority class (SOMM) that combined samples by taking into account the neighbor features of both minority and majority classes is proposed in Reference [25]. It obtains better performance than SMOM. Heiringer Distance-guided SMOTE (HDSMOTE) guides sample synthesis and evaluation through Heiringer distance [26,27], to solve the problem of over generalization and class overlap.
(2) Adaptive synthetic sampling approach (ADASYN) [28]: The basic idea is to use weighted distributions for different minority samples according to their learning difficulty, and to generate more synthetic data for minority samples compared to the easier-to-learn minority samples. Thus, the ADASYN method improves the learning ability of data distribution by reducing the bias due to class imbalance, and adaptively shifting the classification decision boundaries to difficult samples. In Borderline-SMOTE [29], different minority samples are given different weights for sample generation. The number of combinations for each minority sample is determined in Reference [30]. The adaptive synthetic sampling approach for nominal data (ADASYN-N) and adaptive synthetic sampling approach using k-nearest neighbors (ADASYN-KNN) make extensions to process nominal data types [31]. The nearest neighbor parameter k is estimated during class balancing [32].
(3) Sampling clustering and under-sampling technique (SCUT) [33]: This algorithm adopts undersampling and oversampling to reduce the imbalance between classes in a multiclass setup. Oversampling using SMOTE for minority classes generates synthetic samples. Under-sampling is used for the majority class, using a clustering-based under-sampling technique and the Expectation Maximization (EM) algorithm, which is suitable for scenarios with high imbalance ratios. Sampling clustering and under-sampling technique with under-sampling (SCUT-US) improve the SCUT by setting windows [34]. It balances the number of incoming samples of all classes and improves the recognition rate of minority class samples.
(4) Complexity-based synthetic technique (COSTE) [35]: Unlike the proximity-based SMOTE, this method first normalizes the data
(5) SMOTE-least squares support vector machine (SMOTE-LSSVM) [37]: This method first decomposes the multi-class problem, applies SMOTE to balance the data, and then optimizes the parameters of the least squares support vector machine (LSSVM) classifier using a combination of particle swarm optimization and gravitational search algorithms. This approach leverages the global search capability and the local search capability to enhance classifier performance. This method is validated using the breast cancer malignancy dataset.
(6) SMOTE-local outlier factor (SMOTE-LOF) [38]: This method combines the Local Outlier Factor (LOF) to identify noise in synthetic minority samples, addressing the noise issue that may arise when handling imbalanced data. Experimental results show that, compared to traditional SMOTE, SMOTE-LOF performs better in terms of accuracy and F-measure. Additionally, when dealing with large datasets with a smaller imbalance ratio, SMOTE-LOF also outperforms SMOTE in terms of AUC.
(7) Refined neighborhood-SMOTE (RN-SMOTE) [39]: The method begins by applying SMOTE to oversample the minority class, generating synthetic instances. It then employs the density-based spatial clustering of applications with noise (DBSCAN) algorithm to detect and eliminate noisy instances. After cleaning, the synthetic instances are reintegrated into the original dataset. SMOTE is subsequently reapplied to ensure the dataset remains balanced before being introduced to the classifier.
(8) Feature-weighted-SMOTE (FW-SMOTE) [40]: This method introduces a feature-weighted oversampling approach aimed at addressing the limitations of using Euclidean distance to define neighborhoods in high-dimensional spaces, as in traditional SMOTE. FW-SMOTE utilizes a weighted Minkowski distance to define neighborhoods for minority classes, giving greater priority to features that are more relevant to the classification task. Another advantage is its built-in feature selection capability, where attributes with weights below a threshold are discarded. This ensures the method avoids unnecessary complexity while effectively mitigating issues such as class overlap and hubness.
(9) DeepSMOTE [41]: DeepSMOTE, a novel oversampling algorithm designed specifically for deep learning models. It leverages the successful features of the SMOTE algorithm, using an encoder/decoder framework to produce high-quality synthetic images. DeepSMOTE enhances minority class data through SMOTE-based oversampling techniques. Furthermore, it employs a specialized loss function augmented with a penalty term to optimize the generation, ensuring that the artificial images are both information-rich and suitable for visual inspection, without the need for a discriminator. This streamlined and effective design is particularly adept at addressing class imbalance issues in image data.
This paper proposes a novel unbalanced data processing method based on PF-SMOTE and SMOTE-WENN. The minority class samples are first divided into safe minority and boundary minority as given in Section 3.1. Data synthesis and data cleaning are described in detail in Sections 3.2 and 3.3, respectively.
The dataset is divided into safe minority and boundary minority categories, with the following definitions. For a given dataset
If
Definition 1 (Boundary minority sample): If
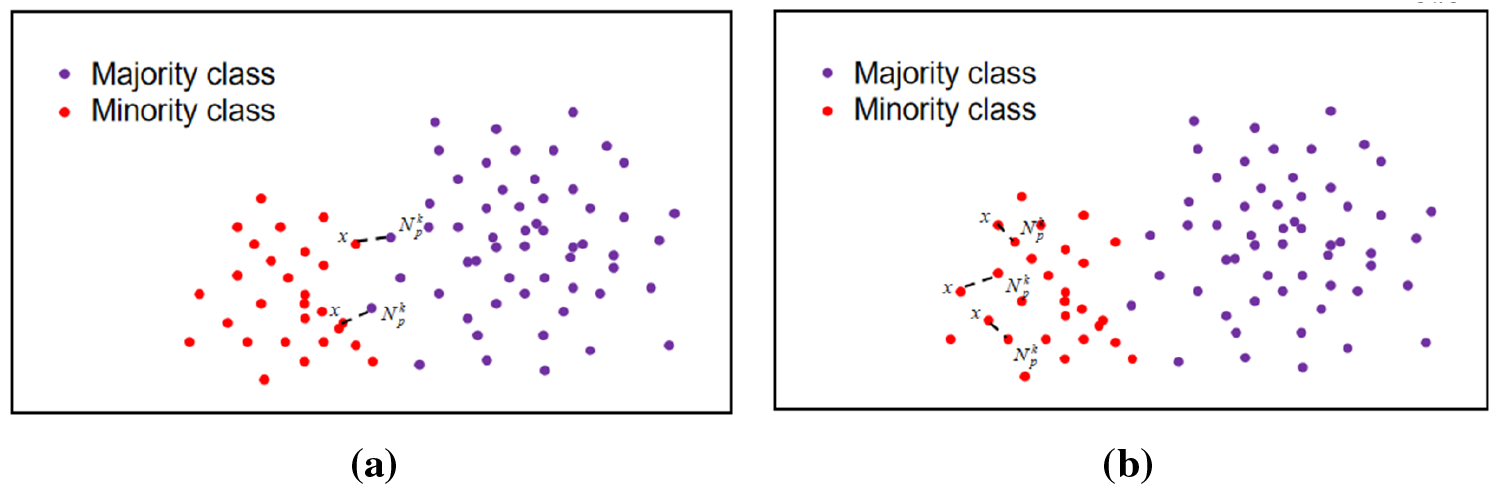
Figure 2: Examples of two types of minority samples. (a) Example diagram of boundary minority sample. (b) Example diagram of safe minority sample
Definition 2 (Safe minority sample): If
For each of the minority class samples
As can be seen from Fig. 2a,b, boundary minority samples and safe minority samples have heterogeneous characteristics, so multiple strategies should be taken into account for data sample synthesis. We aim to increase the diversity of synthesized samples and expand the boundary of the minority class. Meanwhile, for safe minority class samples, it is necessary to increase the local area as much as possible and avoid generating duplicate examples and noisy samples.
For the safety minority sample synthesis, the location of the nearest majority samples for one safety minority sample should be found. Then, a new safety minority sample is synthesized randomly within the formed circle by taking this safety minority sample as the center and the distance from the nearest majority class sample as the radius. This procedure is illustrated in Fig. 3a.
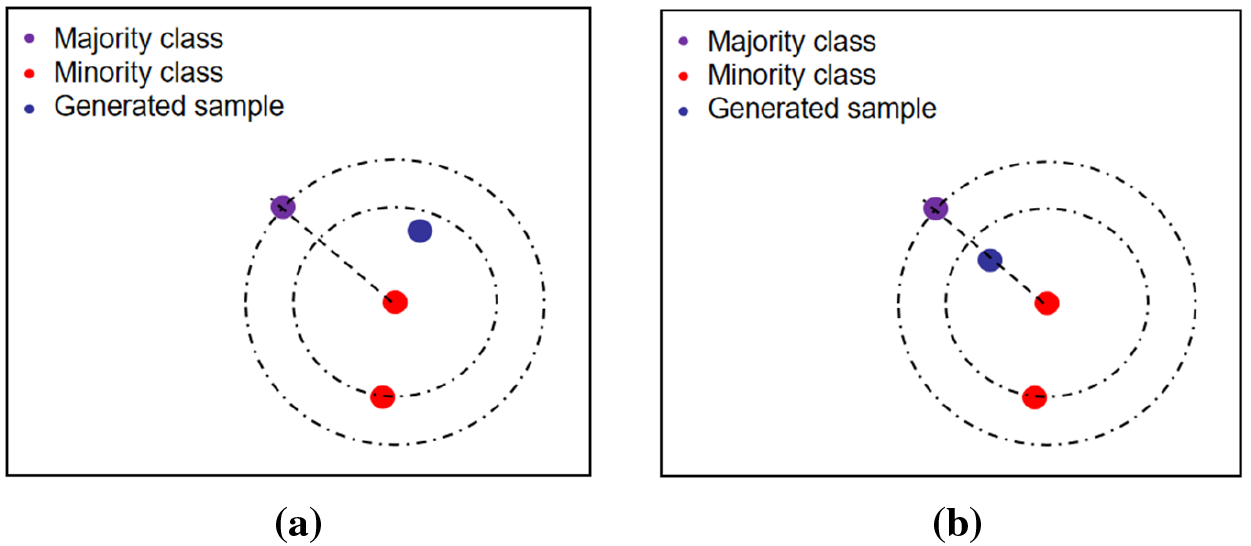
Figure 3: Examples of minority class synthesis for safe and boundary samples. (a) Example diagram of security minority class synthesis. (b) Example of sample synthesis of the boundary minority class
For the boundary minority sample synthesis, the boundary toward the majority class sample is extended, i.e., the position of the synthesized sample is biased towards the position of the majority class sample. Specifically, for a boundary minority sample, its nearest majority class sample is first found, and a boundary minority class sample is synthesized by interpolating along the line between boundary minority class sample point and the nearest majority class sample point. The Gaussian process is employed to enhance the diversity of the synthesized samples. This procedure is shown in Fig. 3b.
where
Noise is inevitably introduced during the synthesis of new samples, potentially degrading the quality of both sample attributes and class labels and adversely affecting model performance. To mitigate this, data cleaning is applied to all samples, including both majority and minority class samples, based on two key aspects: the WENN method and relative data density.
(1) WENN
WENN addresses class imbalance and the small sample problem through a distance scaling function. By applying different distance scaling for positive and negative candidate neighbors, WENN effectively preserves a higher proportion of safe minority and safe majority samples.
In WENN, the distance between two samples is defined using the isomorphic value difference metric, as described in Eq. (7).
where
Here,
Fig. 4a shows an unscaled distance sample, where the
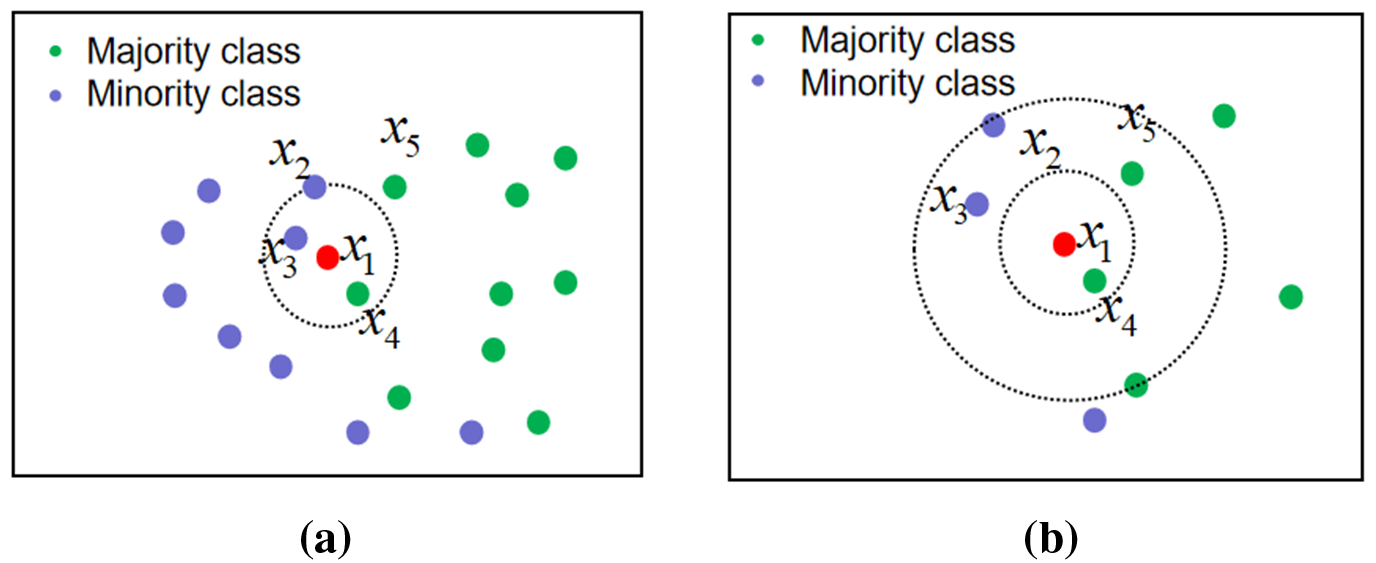
Figure 4: Example of distance scaling weights. (a) Unscaled distance sample. (b) Scaled distance sample with weights
(2) Relative data density
Besides WENN, we design another rule for data cleaning based on relative data density. A reverse k-nearest neighbor is adopted to determine the relative data density. The inverse k-nearest neighbor is defined as: The reverse nearest neighbor of query point q is the set of all data points in data set
Fig. 5 shows the reverse
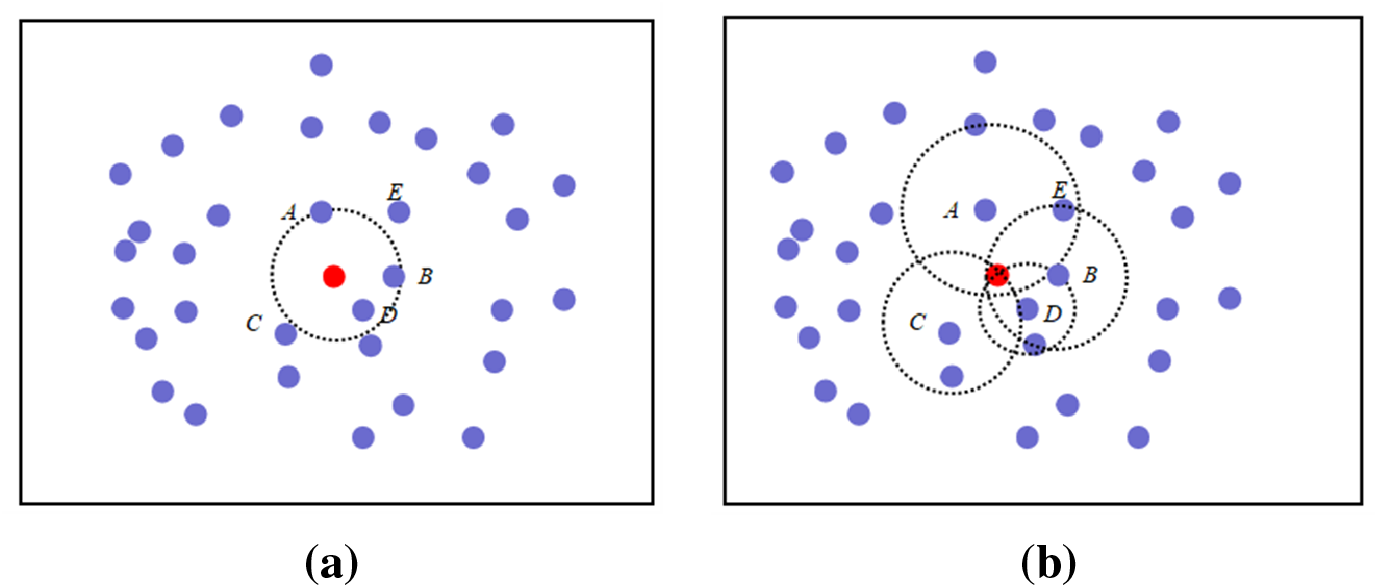
Figure 5: Illustration of k-nearest neighbor and reverse k-nearest neighbor samples. (a) k-nearest neighbor sample diagram. (b) Reverse k-nearest neighbor sample diagram

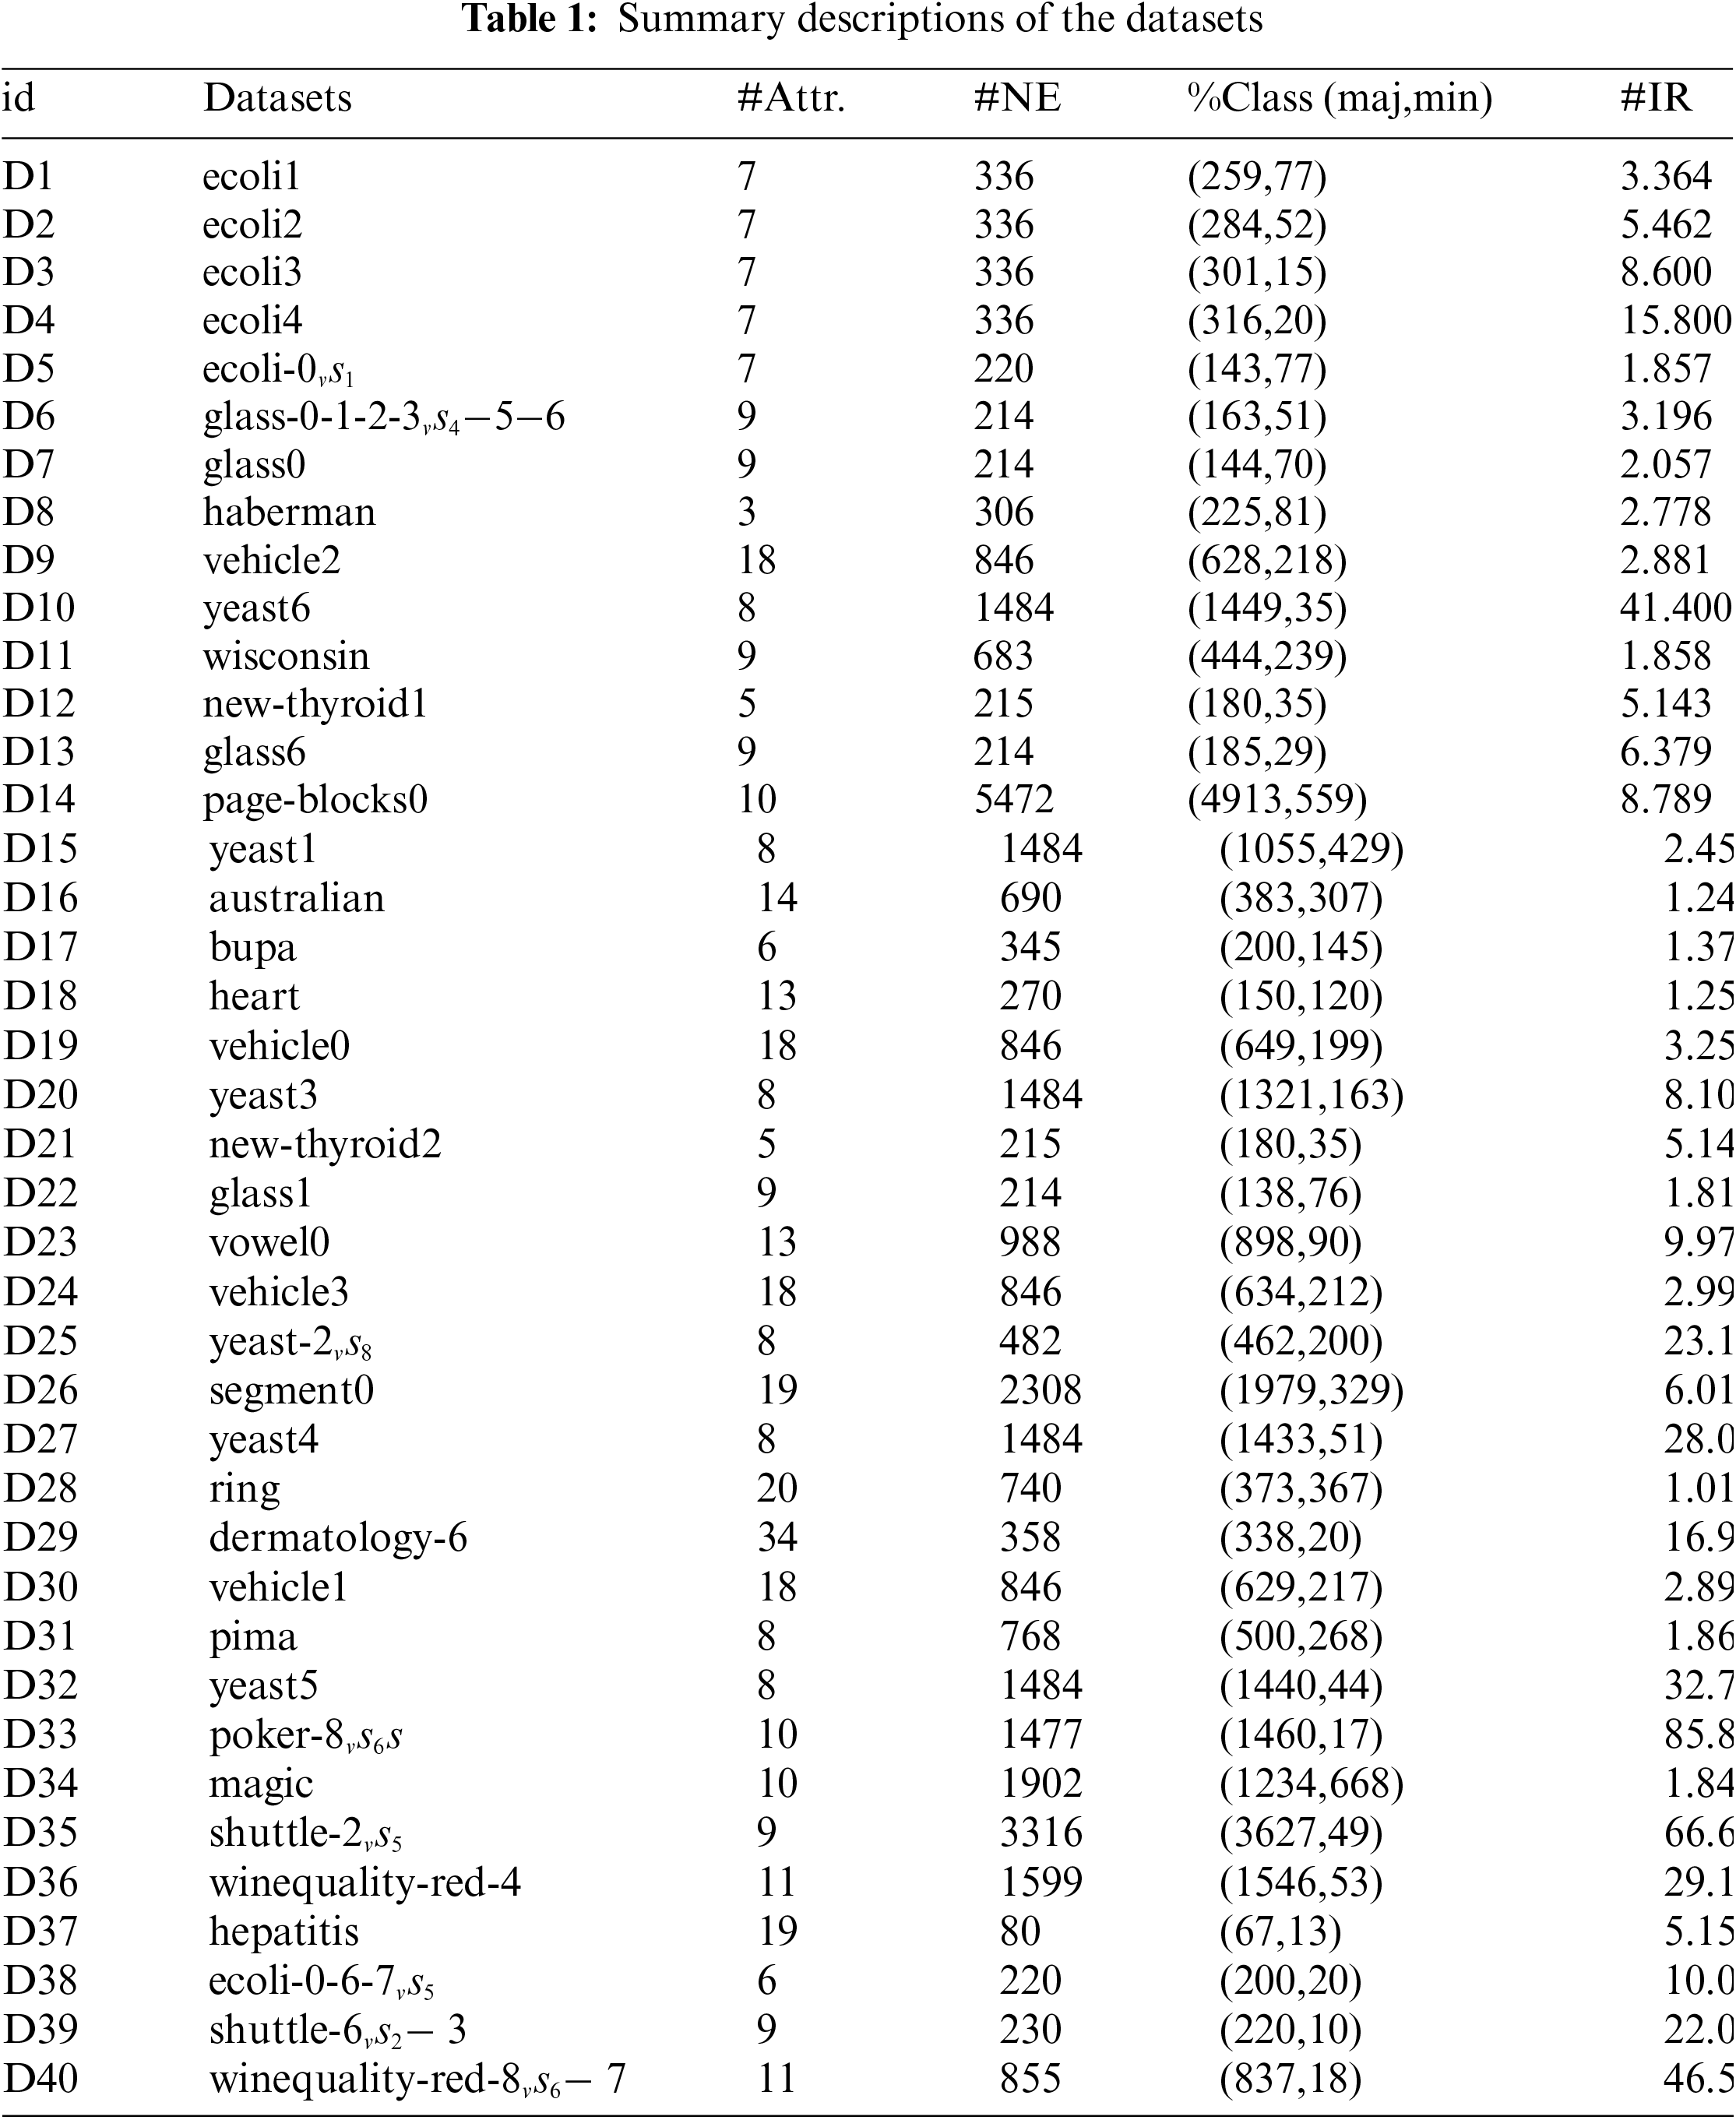
In this section, 40 unbalanced datasets from the KEEL repository are used to evaluate the performance of RE-SMOTE. Table 1 provides details of the datasets, including the numbers of attributes (Attr.) and examples (NE), the number of each class (%Class(maj,min)), and the imbalance ratio (IR).
Repeated stratified k-fold cross-validation is employed, using ten replicates of 10-fold cross-validation, resulting in 100 models being fitted and evaluated. The dataset is divided into 10 subsets, each containing 10% of the samples. In each iteration, one subset is used as the test set, while others are used for training. The average of the 10 repetitions is considered as the final performance metric.
While classification accuracy is often used to evaluate algorithm performance, it is not an ideal metric for imbalanced datasets due to the skewed class distribution. Unlike standard metrics, which assume equal importance for all classes, imbalanced classification problems typically prioritize minimizing classification errors in the minority class over the majority class. As a result, performance metrics must focus on the minority class, which poses a challenge due to the limited representation of minority class observations, making it harder to train an effective model. Therefore, we employ two widely recognized metrics, AUC and F1 score [21]. To better explain AUC and F1, the confusion matrix of a dichotomous problem is shown in Table 2, and the corresponding concepts are given as follows:
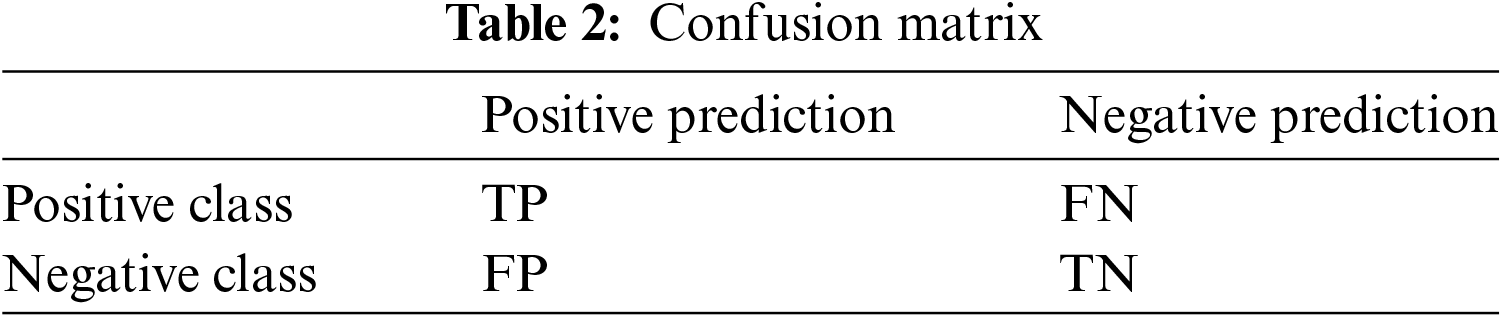
TP (True Positive). The number of positive class samples that were predicted as positive class.
FN (False Negative). The number of positive class samples that were predicted as negative class.
FP (False Positive). The number of negative class samples that were predicted as positive class.
TN (True Negative). The number of negative class samples that were predicted as negative class.
Based on the confusion matrix, ROC curves can be drawn on different thresholds. ROC curves, also called subject working characteristic curves, are composed of True Positive Rate (TPR) and False Positive Rate (FPR) at different classification thresholds, as given in Eqs. (11) and (12). TPR is the vertical axis and FPR is the horizontal axis. Each threshold corresponds to a (FPR, TPR) point, which is depicted as the ROC curve. The closer the ROC curve is to the upper left corner, the higher the model’s accuracy.
AUC is the area under the ROC curve. The larger the area under the ROC curve, the better the model. There are two obvious advantages of AUC. First, AUC does not focus on specific scores. It reflects relative results such as ranking relations. Second, AUC is an overall indicator and does not focus on the local characteristics of the model, so it is not sensitive to the sample. AUC can be represented as Eq. (13), where (
The F1 value is the summed average of precision and recall, as given in Eq. (14). It is close to the smaller of these two values. If the F1 value is large, then precision and recall must be large. F1 can reflect the algorithm’s overall performance.
To evaluate the proposed RE-SMOTE model, 3 well-known classifiers are selected in this experiment, which are described in detail as follows:
• Decision Tree (DT) [42,43]. It can be applied to both classification and regression, with the leaf nodes being the final decision result. It starts with a root node containing all the training data and then continuously refines the internal nodes using specific division criteria until the stopping conditions are satisfied. Thus, classification rules can be obtained inductively. The training is to construct a tree based on the given dataset and select the most valuable feature-slicing nodes. Decision tree is easy to understand and interpret. The data preparation is simple. It can be used constructed for data containing many attributes. Moreover, the decision tree scales well to large databases while its size is independent of the dataset.
• Support Vector Machine (SVM) [44]. The basic idea is to find the best-separating hyperplane in the feature space to maximize the interval between positive and negative samples in the training set, and with the power of kernel functions, SVM can also be used to solve nonlinear problems. The SVM classifier can be adapted to small training datasets and easy-to-fit high-dimensional samples. In addition, it can also handle the problem of neural network structure selection and local minima prevention.
• K-Nearest Neighbor (KNN) [45]. KNN is used for classification by measuring the distance between different feature values. It is based on the idea that a sample belongs to a class if the majority of the
To verify the performance of the RE-SMOTE method, three SMOTE variants are selected for experimental comparisons. A brief descriptions of these methods are given as follows:
• SMOTE-ENN [46]: It starts with oversampling samples of minority class using SMOTE, and then performs local data cleaning using ENN. If the predicted label of
• SMOTE-WENN [20]: It designs a new data cleaning method WENN. WENN uses a weighted distance function and KNN rules to detect and remove unsafe majority and minority samples. The weighted distance function extends a suitable distance by considering local imbalance and spatial sparsity.
• PF-SMOTE [19]: It is a parameter-free variant of SMOTE that generates a sufficient number of representative synthetic samples based on bounded minority and the safe minority classes while avoiding the generation of interpolated noisy samples.
• SMOTE-RkNN [47]: This method introduces an improved SMOTE hybrid algorithm called SMOTE-reverse k-nearest neighbors (SMOTE-RkNN). The algorithm identifies noise based on probability density rather than relying on local neighborhood information.
5 Experimental Results and Discussions
To demonstrate the effectiveness of RE-SMOTE, the experiments are conducted in two aspects. (1) In Section 5.1, visualization results on the synthesis of samples are provided. (2) In Section 5.2, comparisons of other well-known variants of the SMOTE methods are given.
5.1 Visualization of Synthetic Samples
Among the 40 datasets in Table 1, we randomly select two datasets for visualization, numbered D1 and D23, for visualization. For these comparative methods, we set the k-nearest neighbors parameter to 3 based on empirical experience. Other parameters will be adjusted and calculated according to the characteristics of different datasets.
The original dataset, the balanced dataset after the SMOTE, and the balanced dataset after RE-SMOTE are listed, respectively. In this way, the regions where RE-SMOTE generates samples can be visually displayed. The final visualization plot of applying SMOTE and RE-SMOTE to a two-dimensional data set is shown in Fig. 6, where blue points represent the minority class samples and red points represent the majority class samples. Original data sample plots are given in Fig. 6a,d. Balanced data sample plots after SMOTE are given in Fig. 6b,e.

Figure 6: Visualization comparison of RE-SMOTE with SMOTE on 2 datasets. (a) Visualization of the original dataset (D1). (b) Balanced dataset after SMOTE (D1). (c) Balanced dataset after RE-SMOTE (D1). (d) Visualization of the original dataset (D23). (e) Balanced dataset after SMOTE (D23). (f) Balanced dataset after RE-SMOTE (D23)
We randomly select a minority class sample and interpolate between the nearest minority class neighbors to synthesize a new minority class sample. SMOTE is a linear interpolation to synthesize the new sample. This leads to a more convergent distribution of the synthesized minority class sample than the original one. Balanced data samples performed by RE-SMOTE are given in Fig. 6c,f. In contrast, RE-SMOTE focuses on the diversity of the synthesized samples and favors the synthesis of minority-class samples. In general, it can be concluded that RE-SMOTE is more effective in sample synthesis.
5.2 Comparison of Different Methods
The comparison results on AUC and F1 with DT-based, KNN-based and SVM-based classifiers are shown in Tables 3–12, respectively. Through these results, it can be observed that the proposed RE-SMOTE outperforms other variants in most cases. Specifically, the proportion of best results with RE-SMOTE on 40 data sets is shown in Fig. 7.
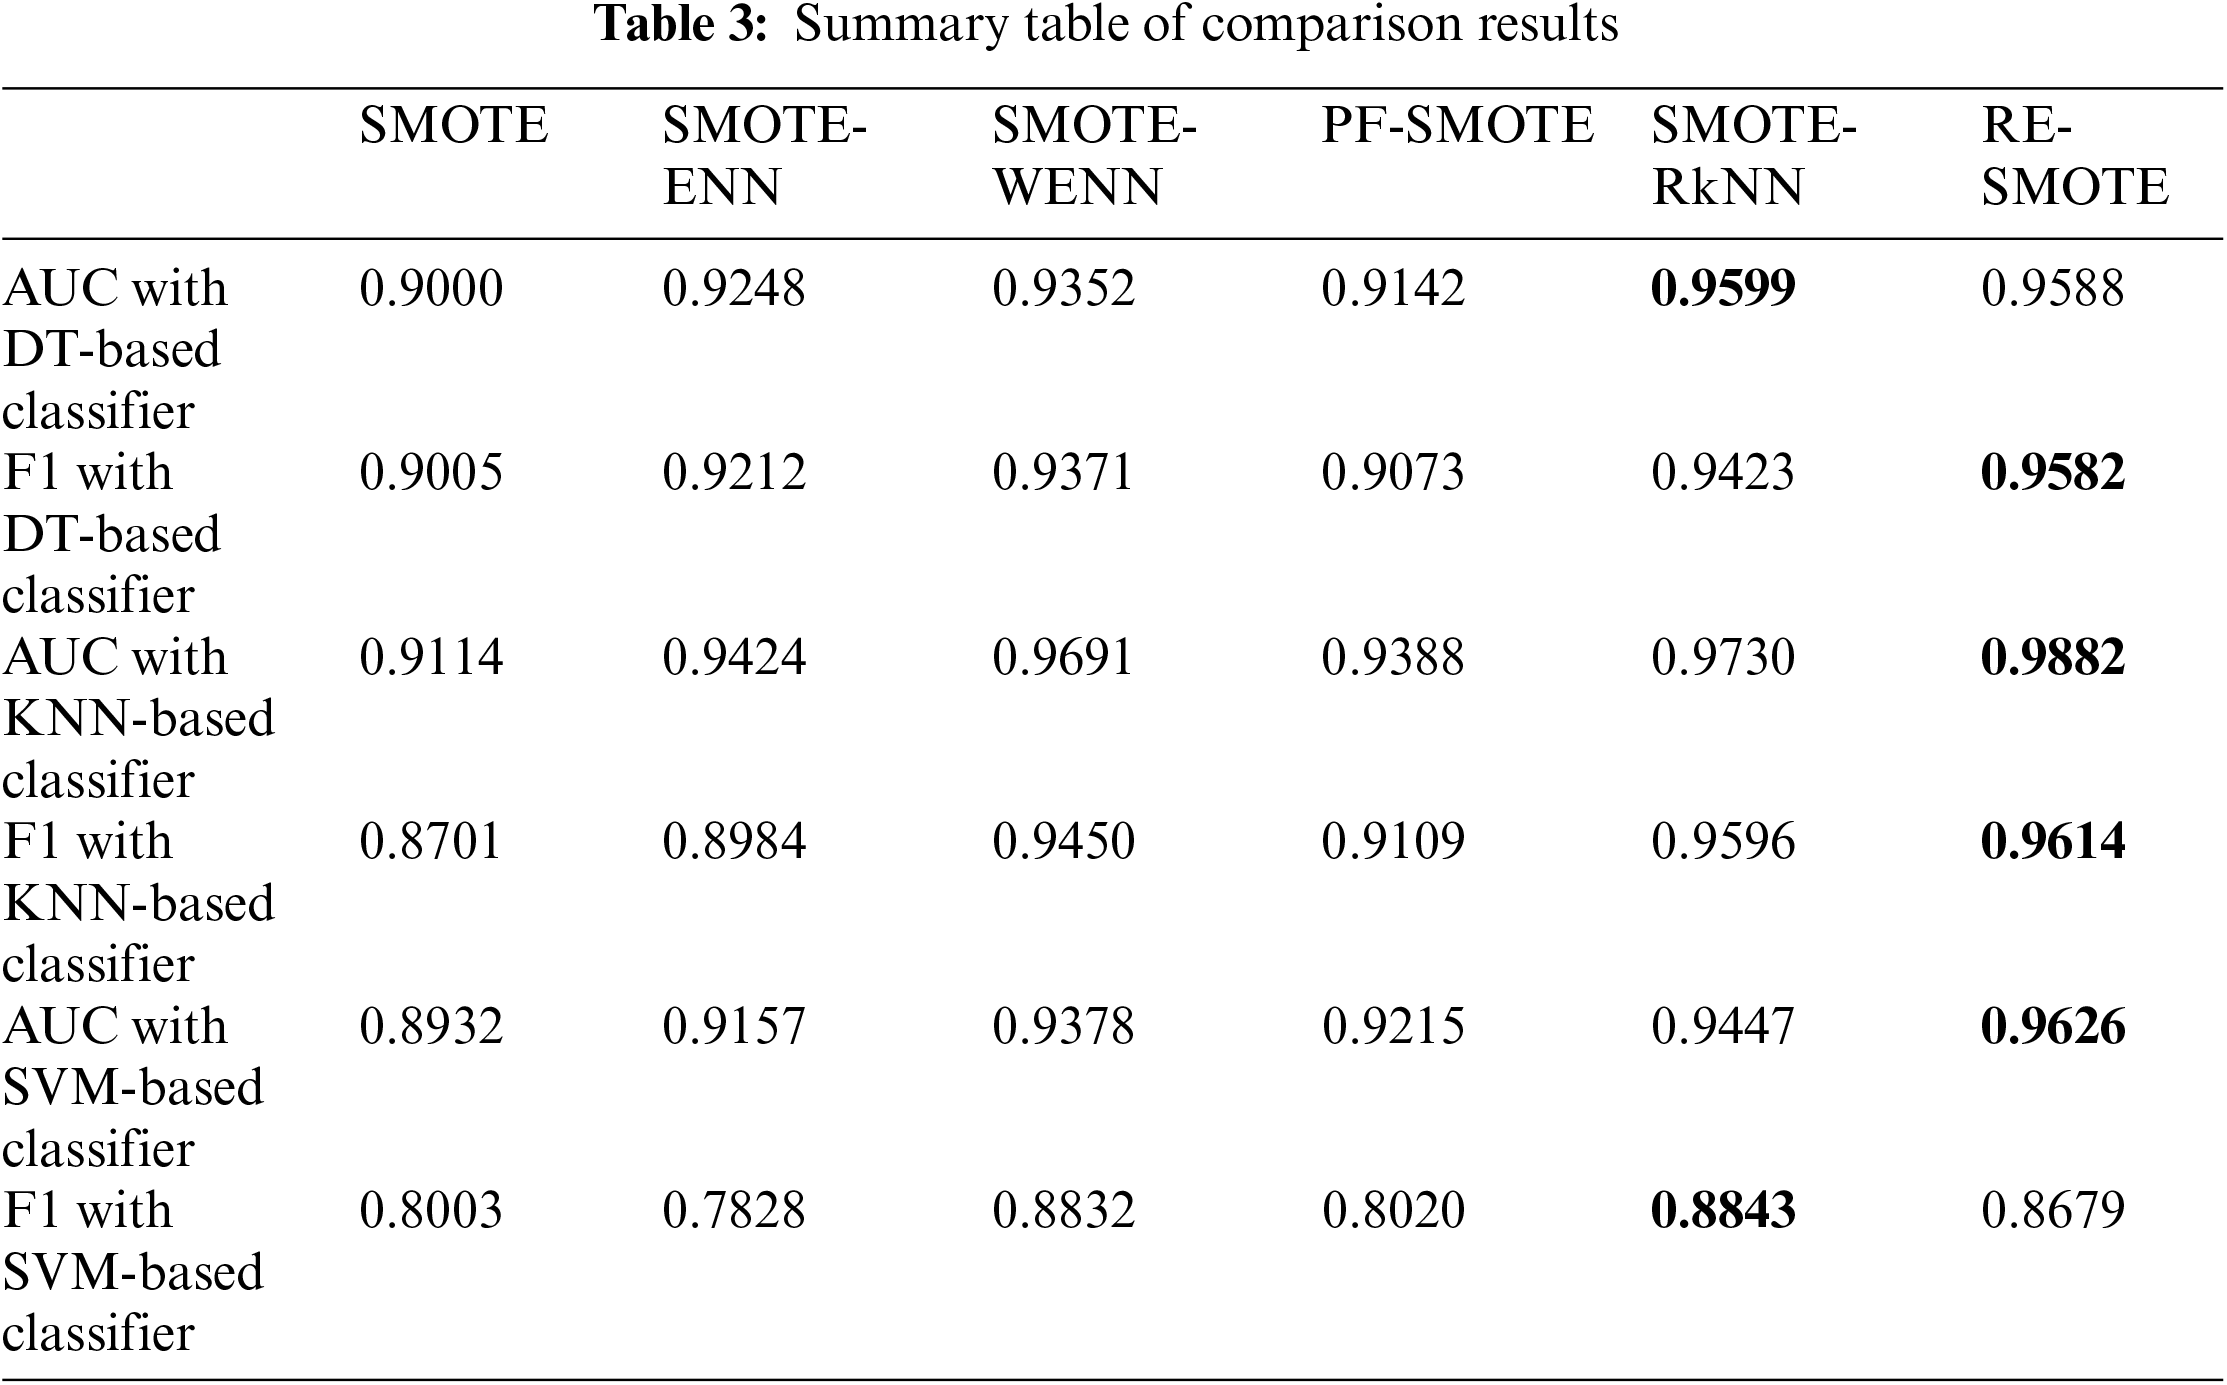
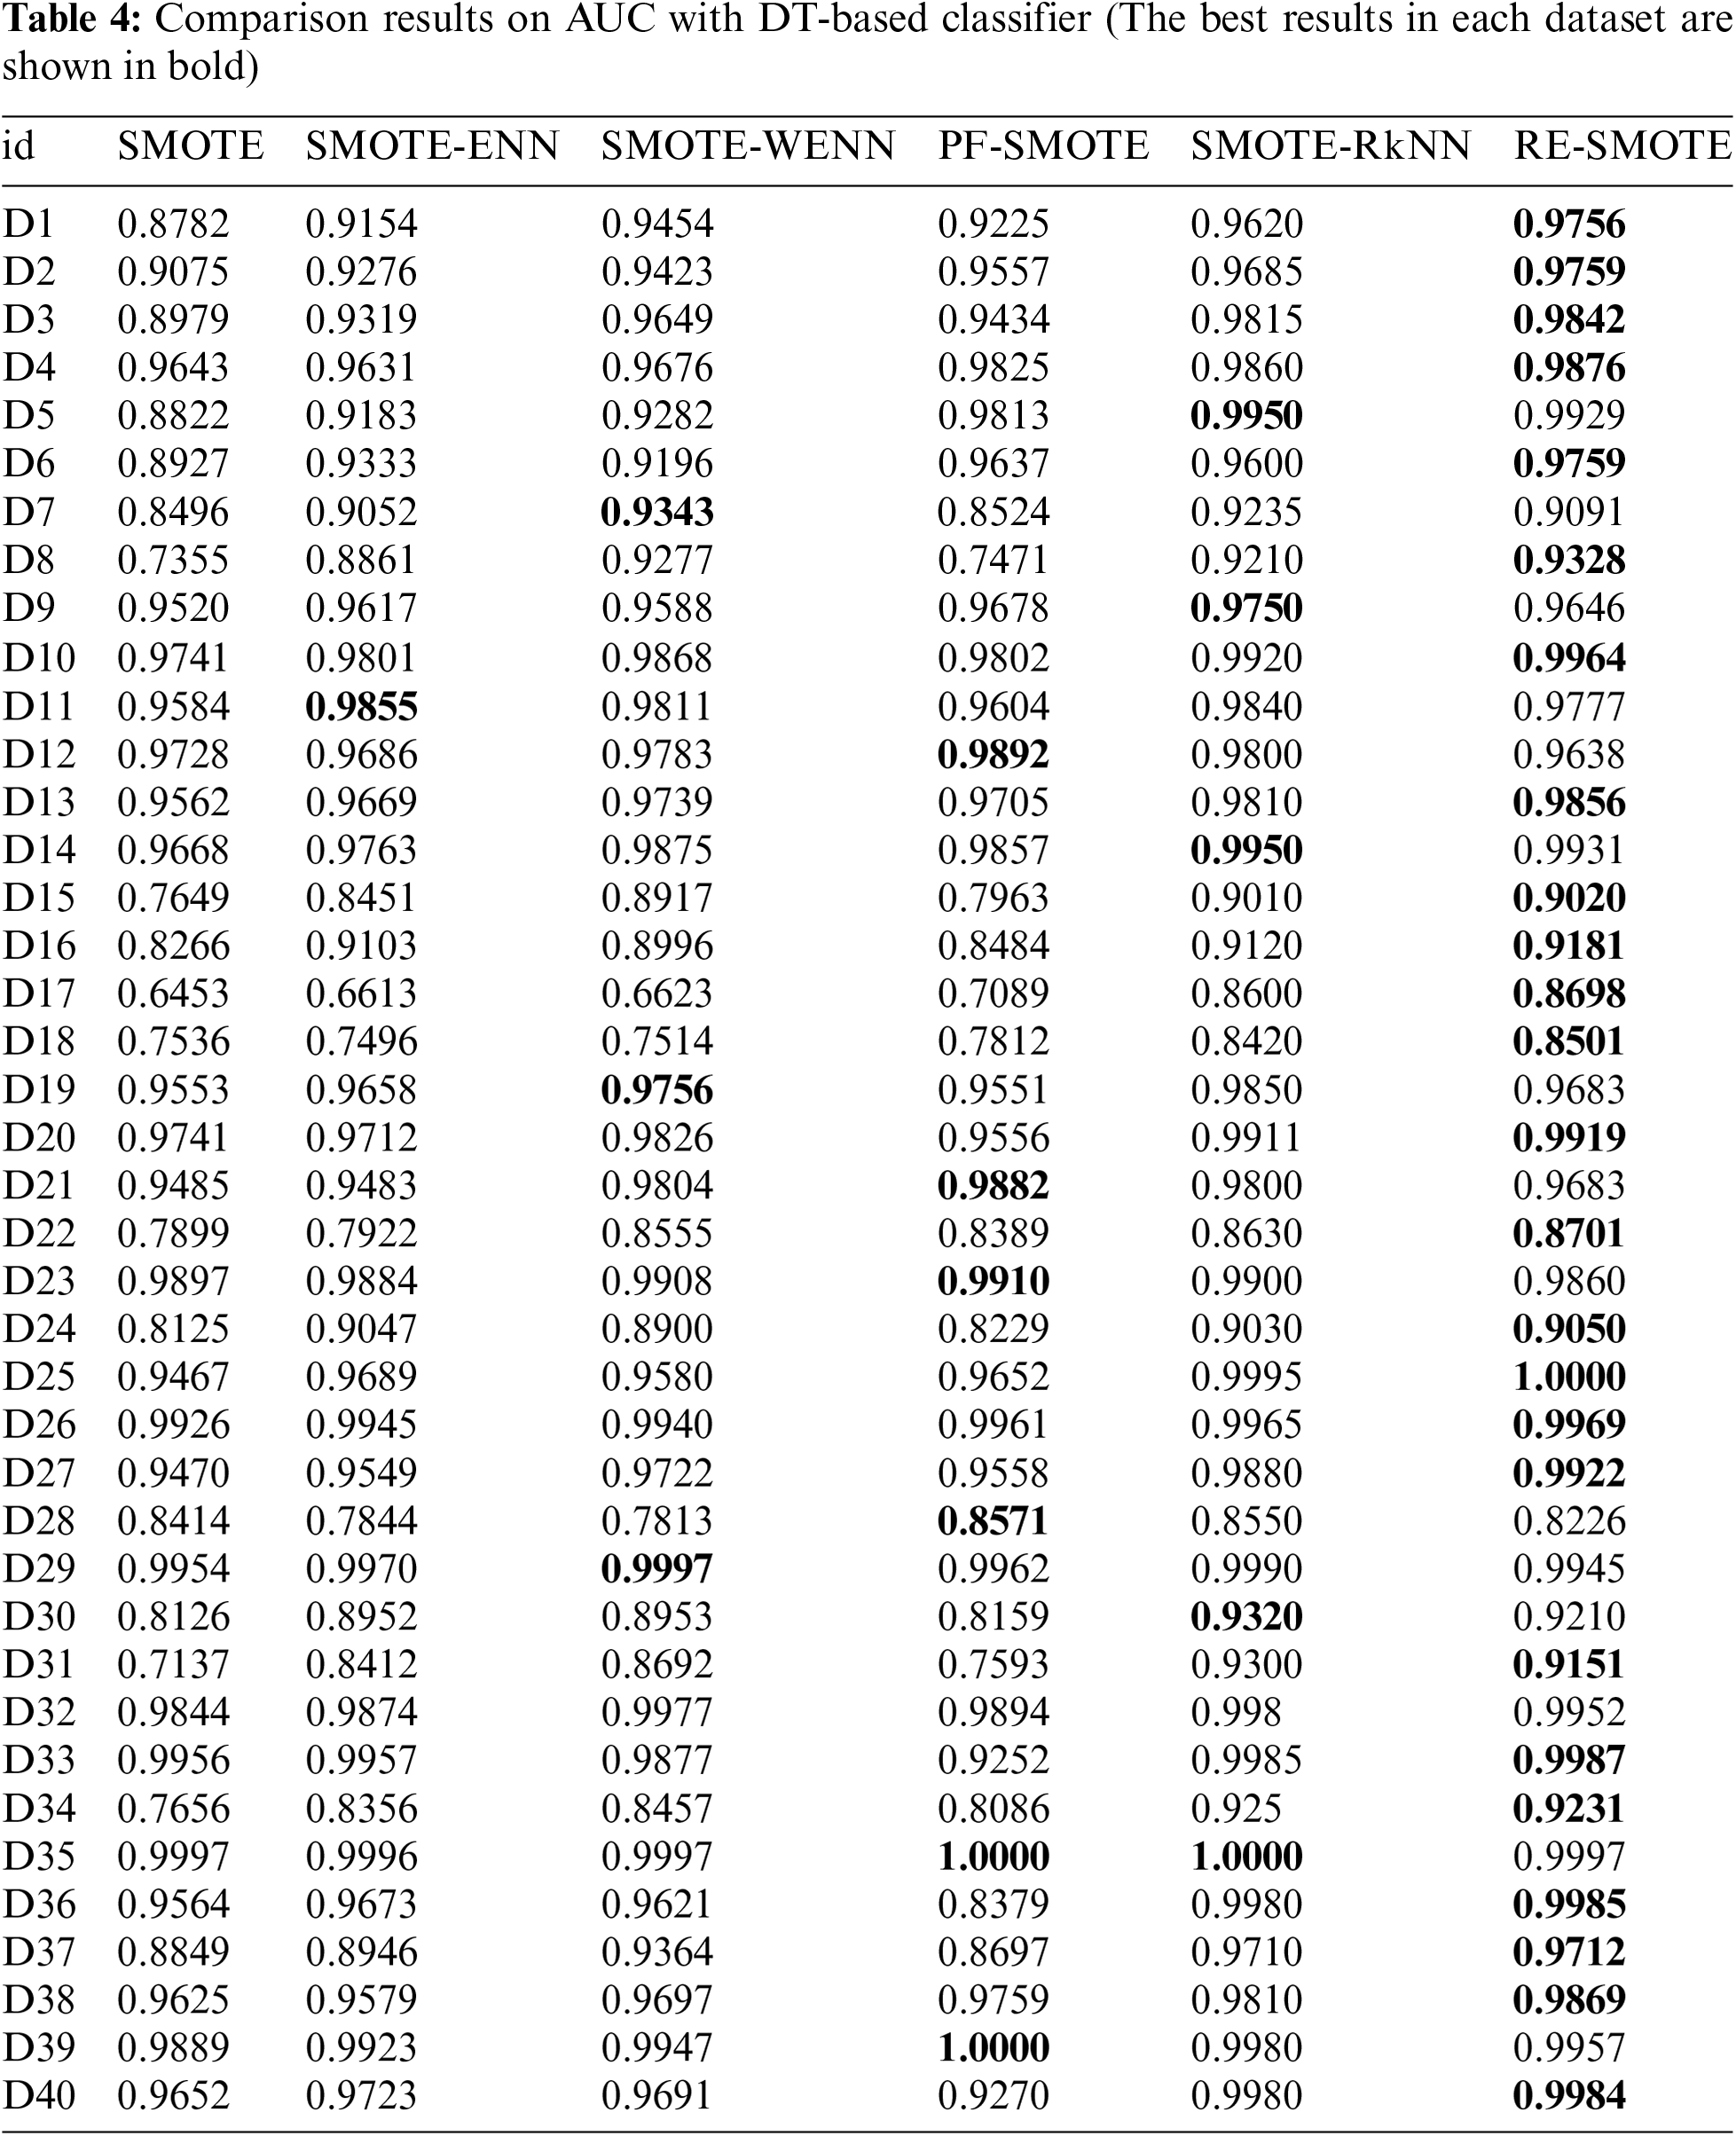
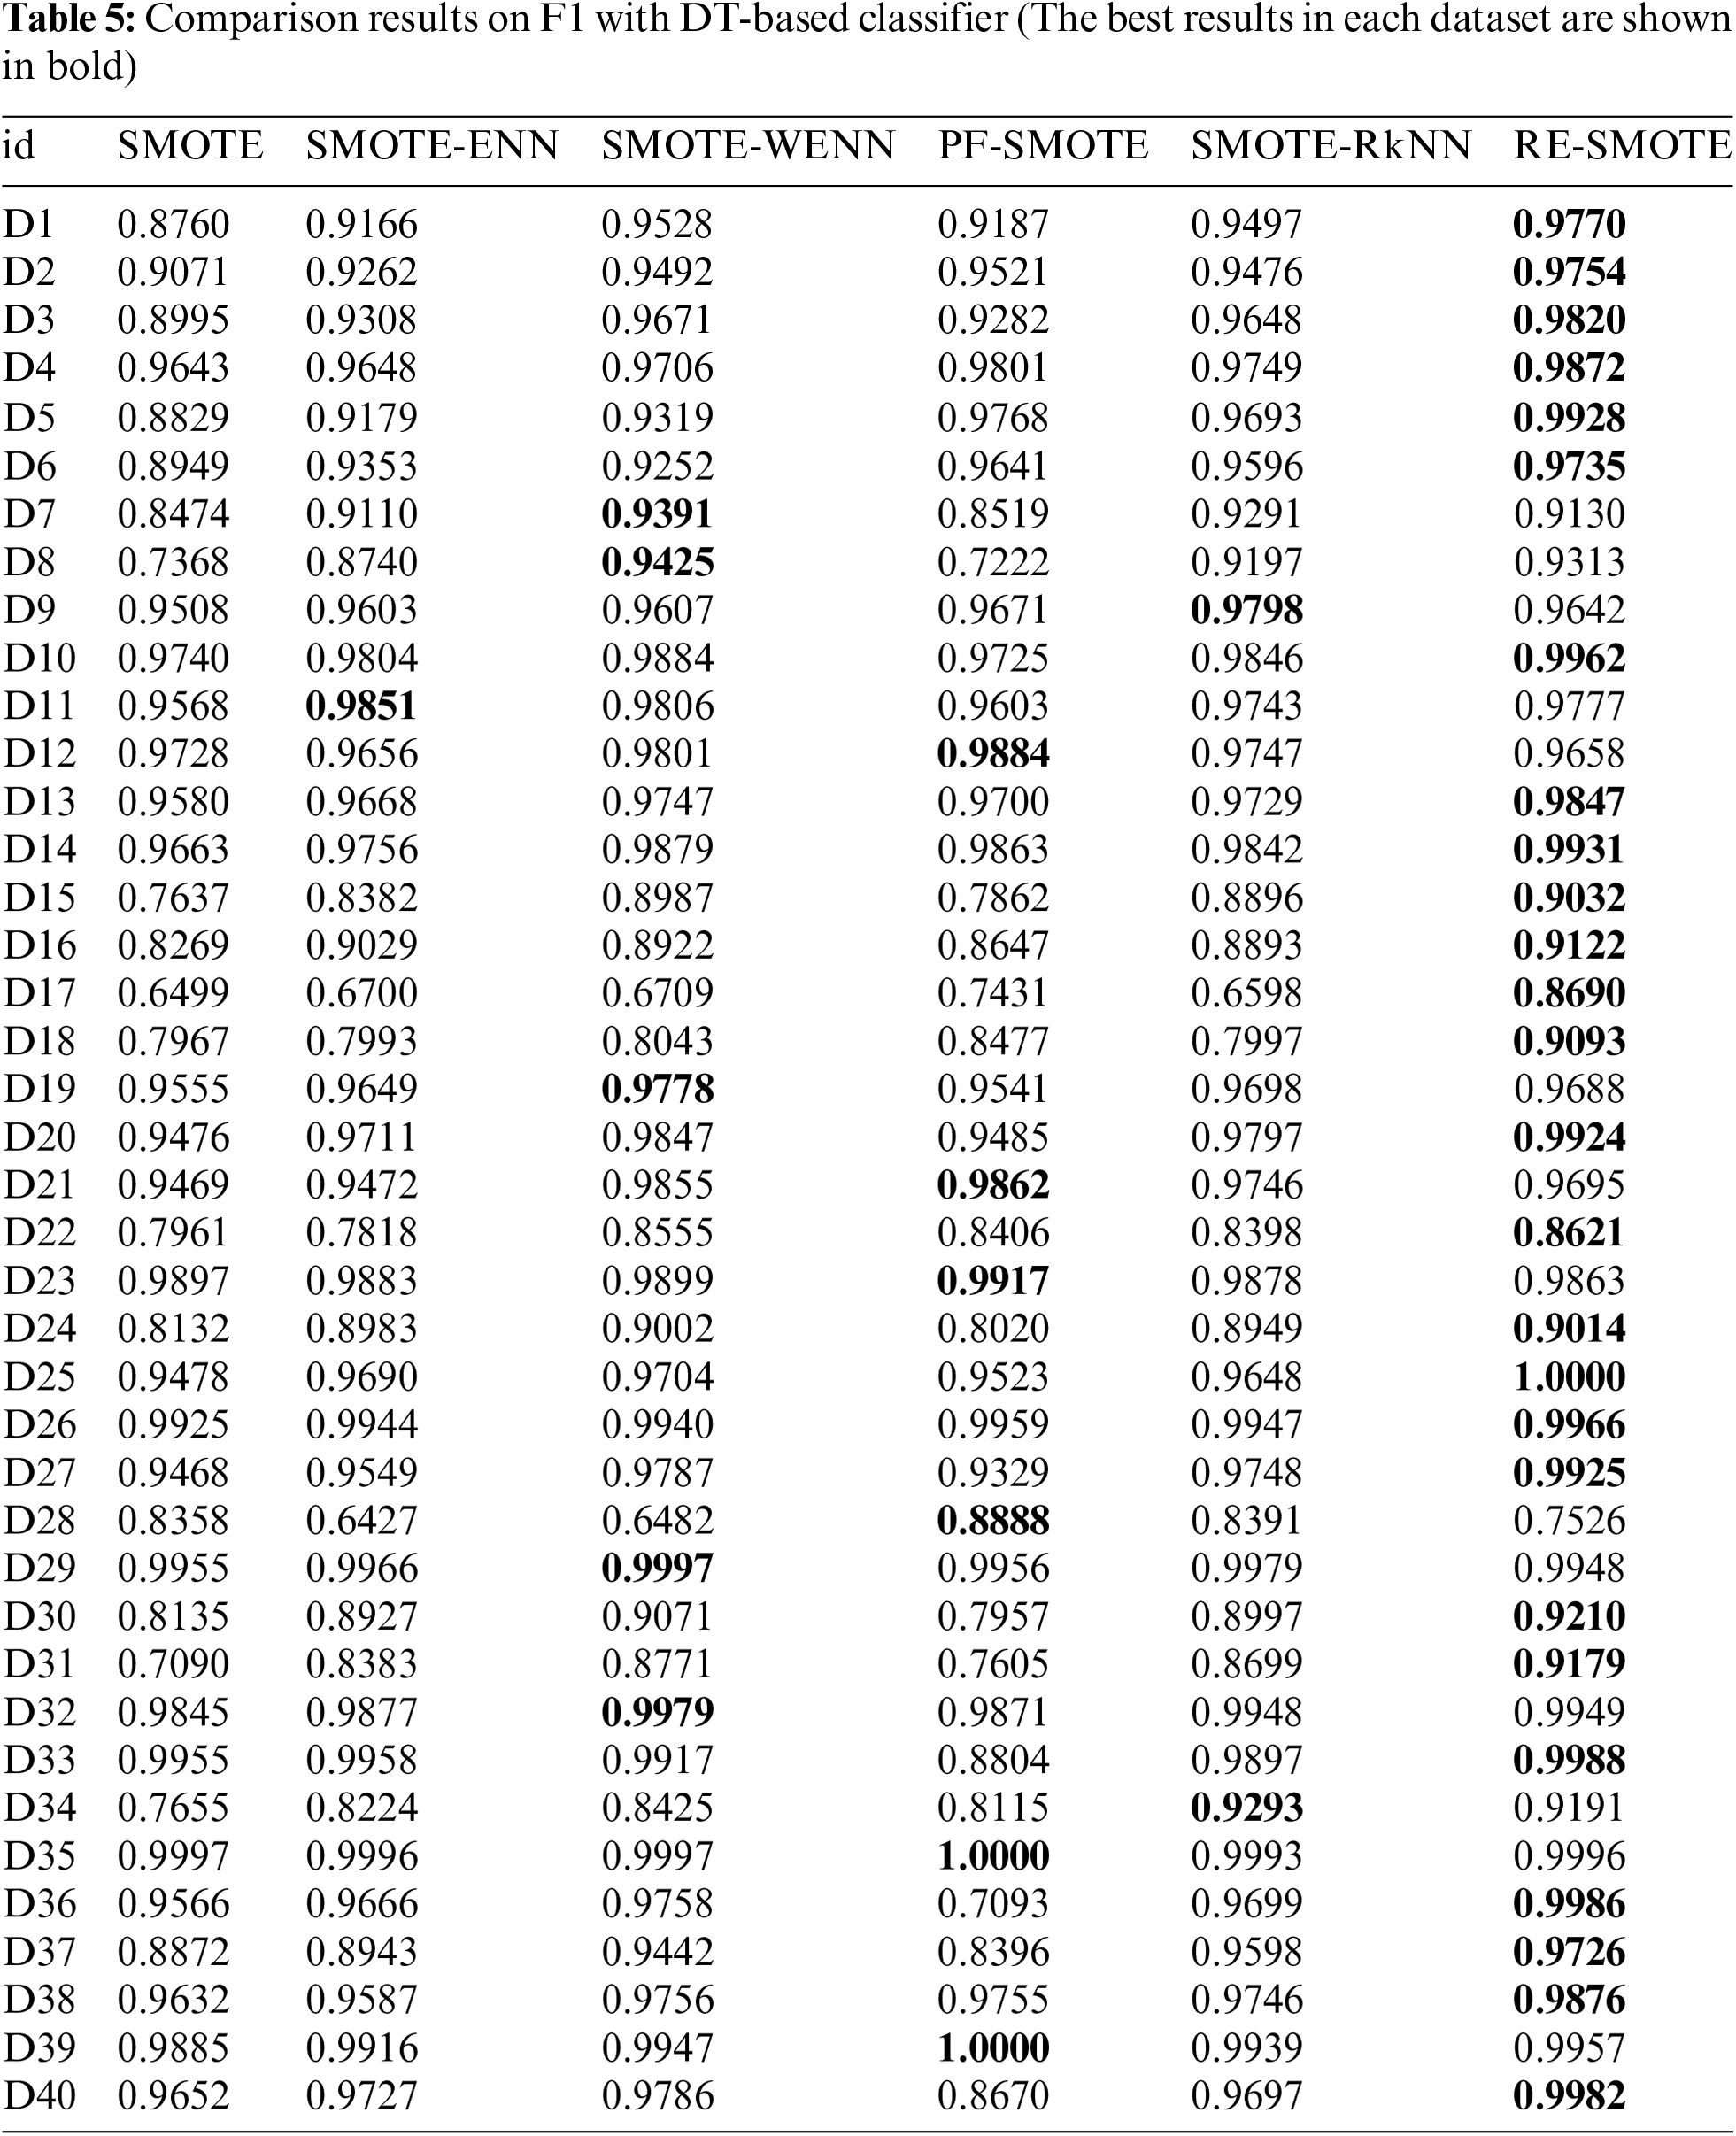
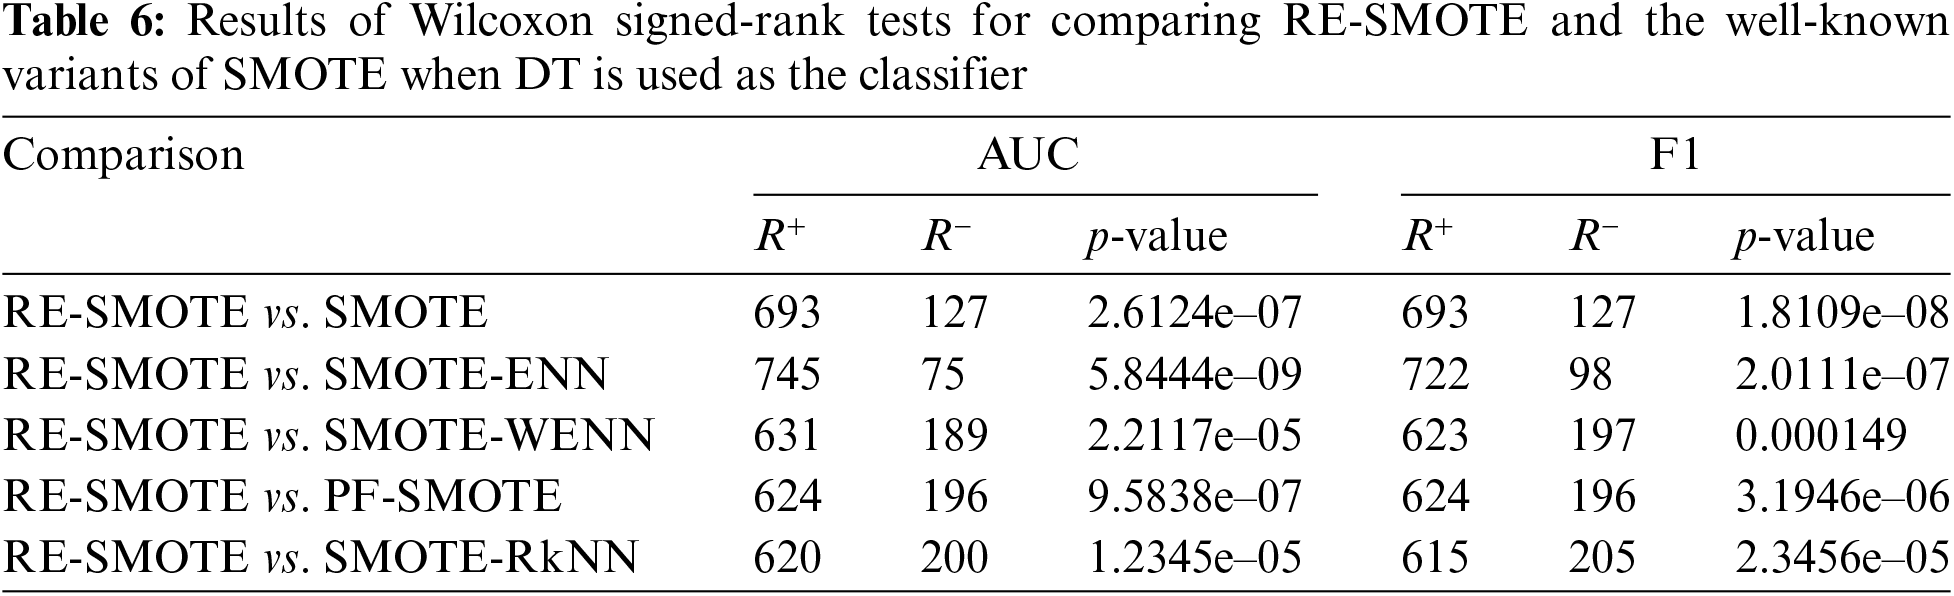
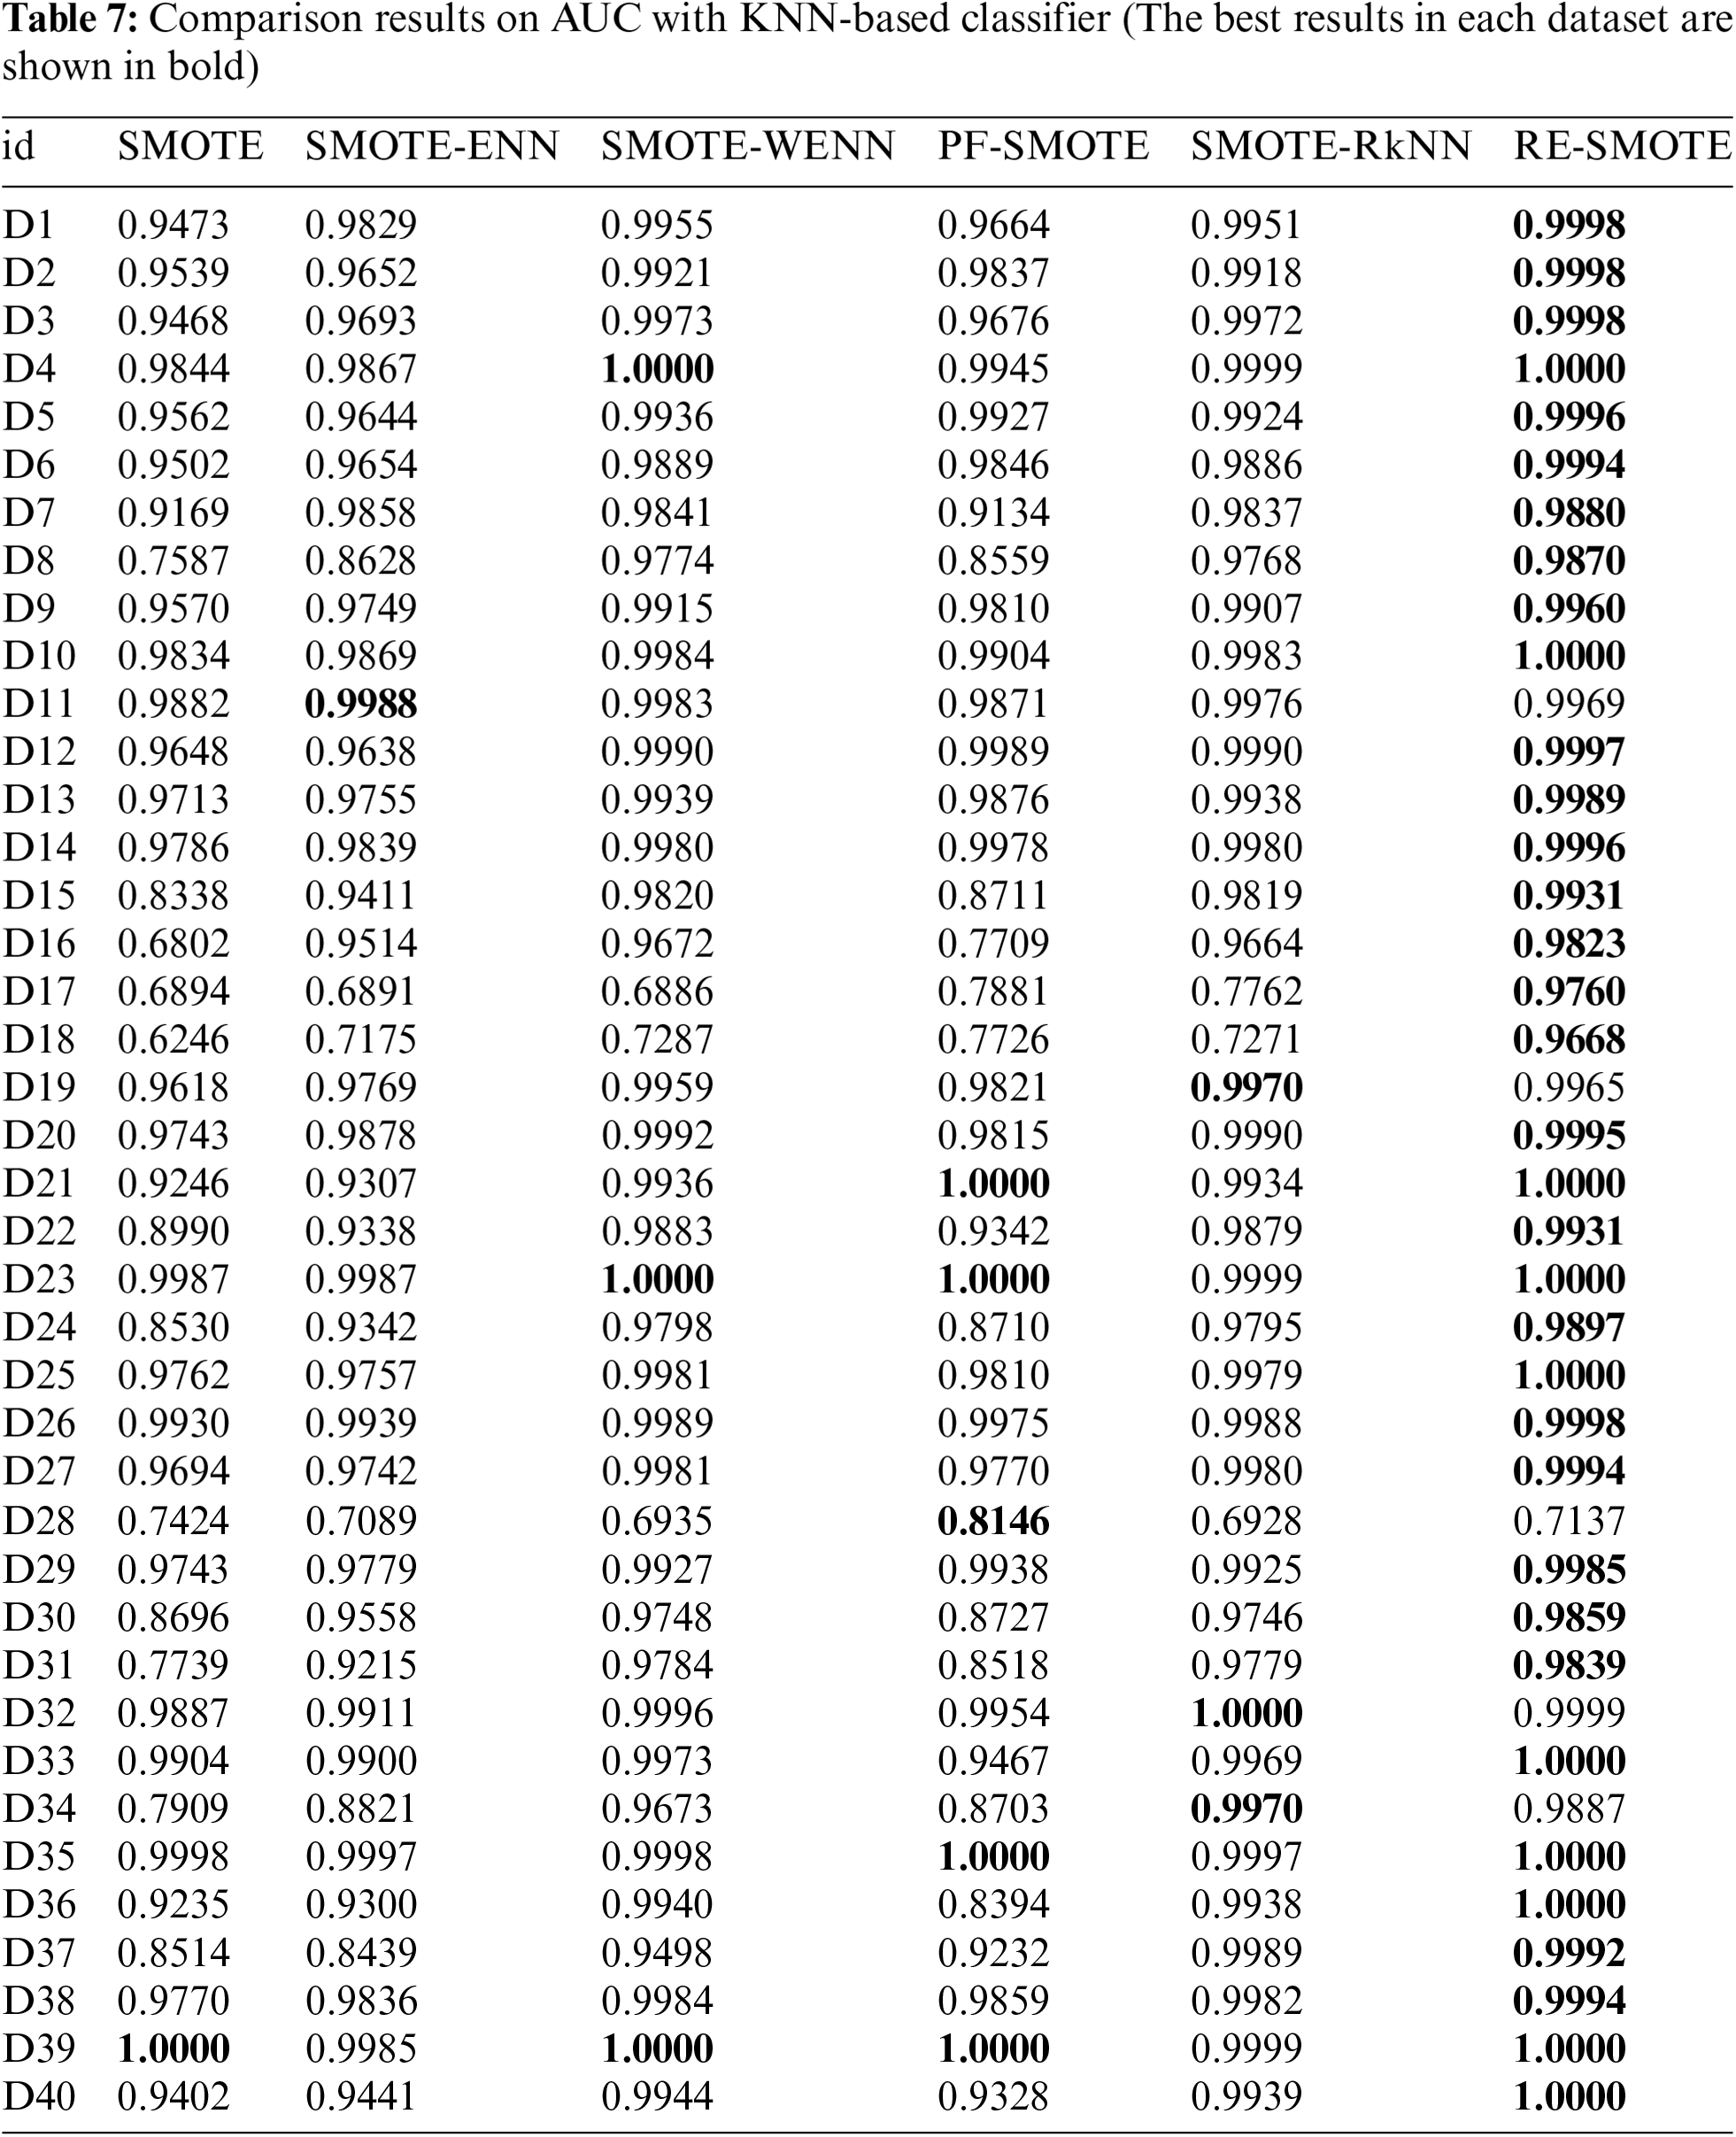

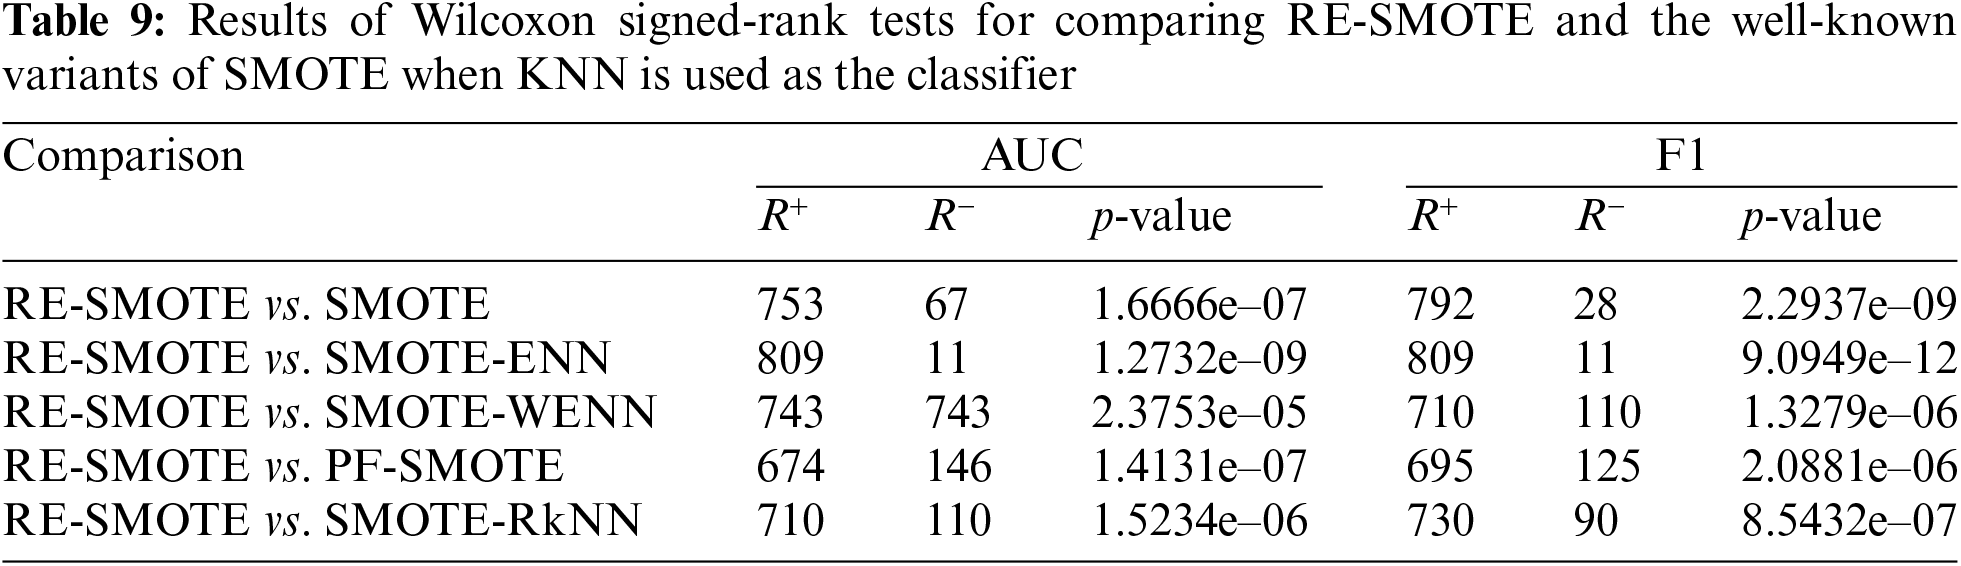
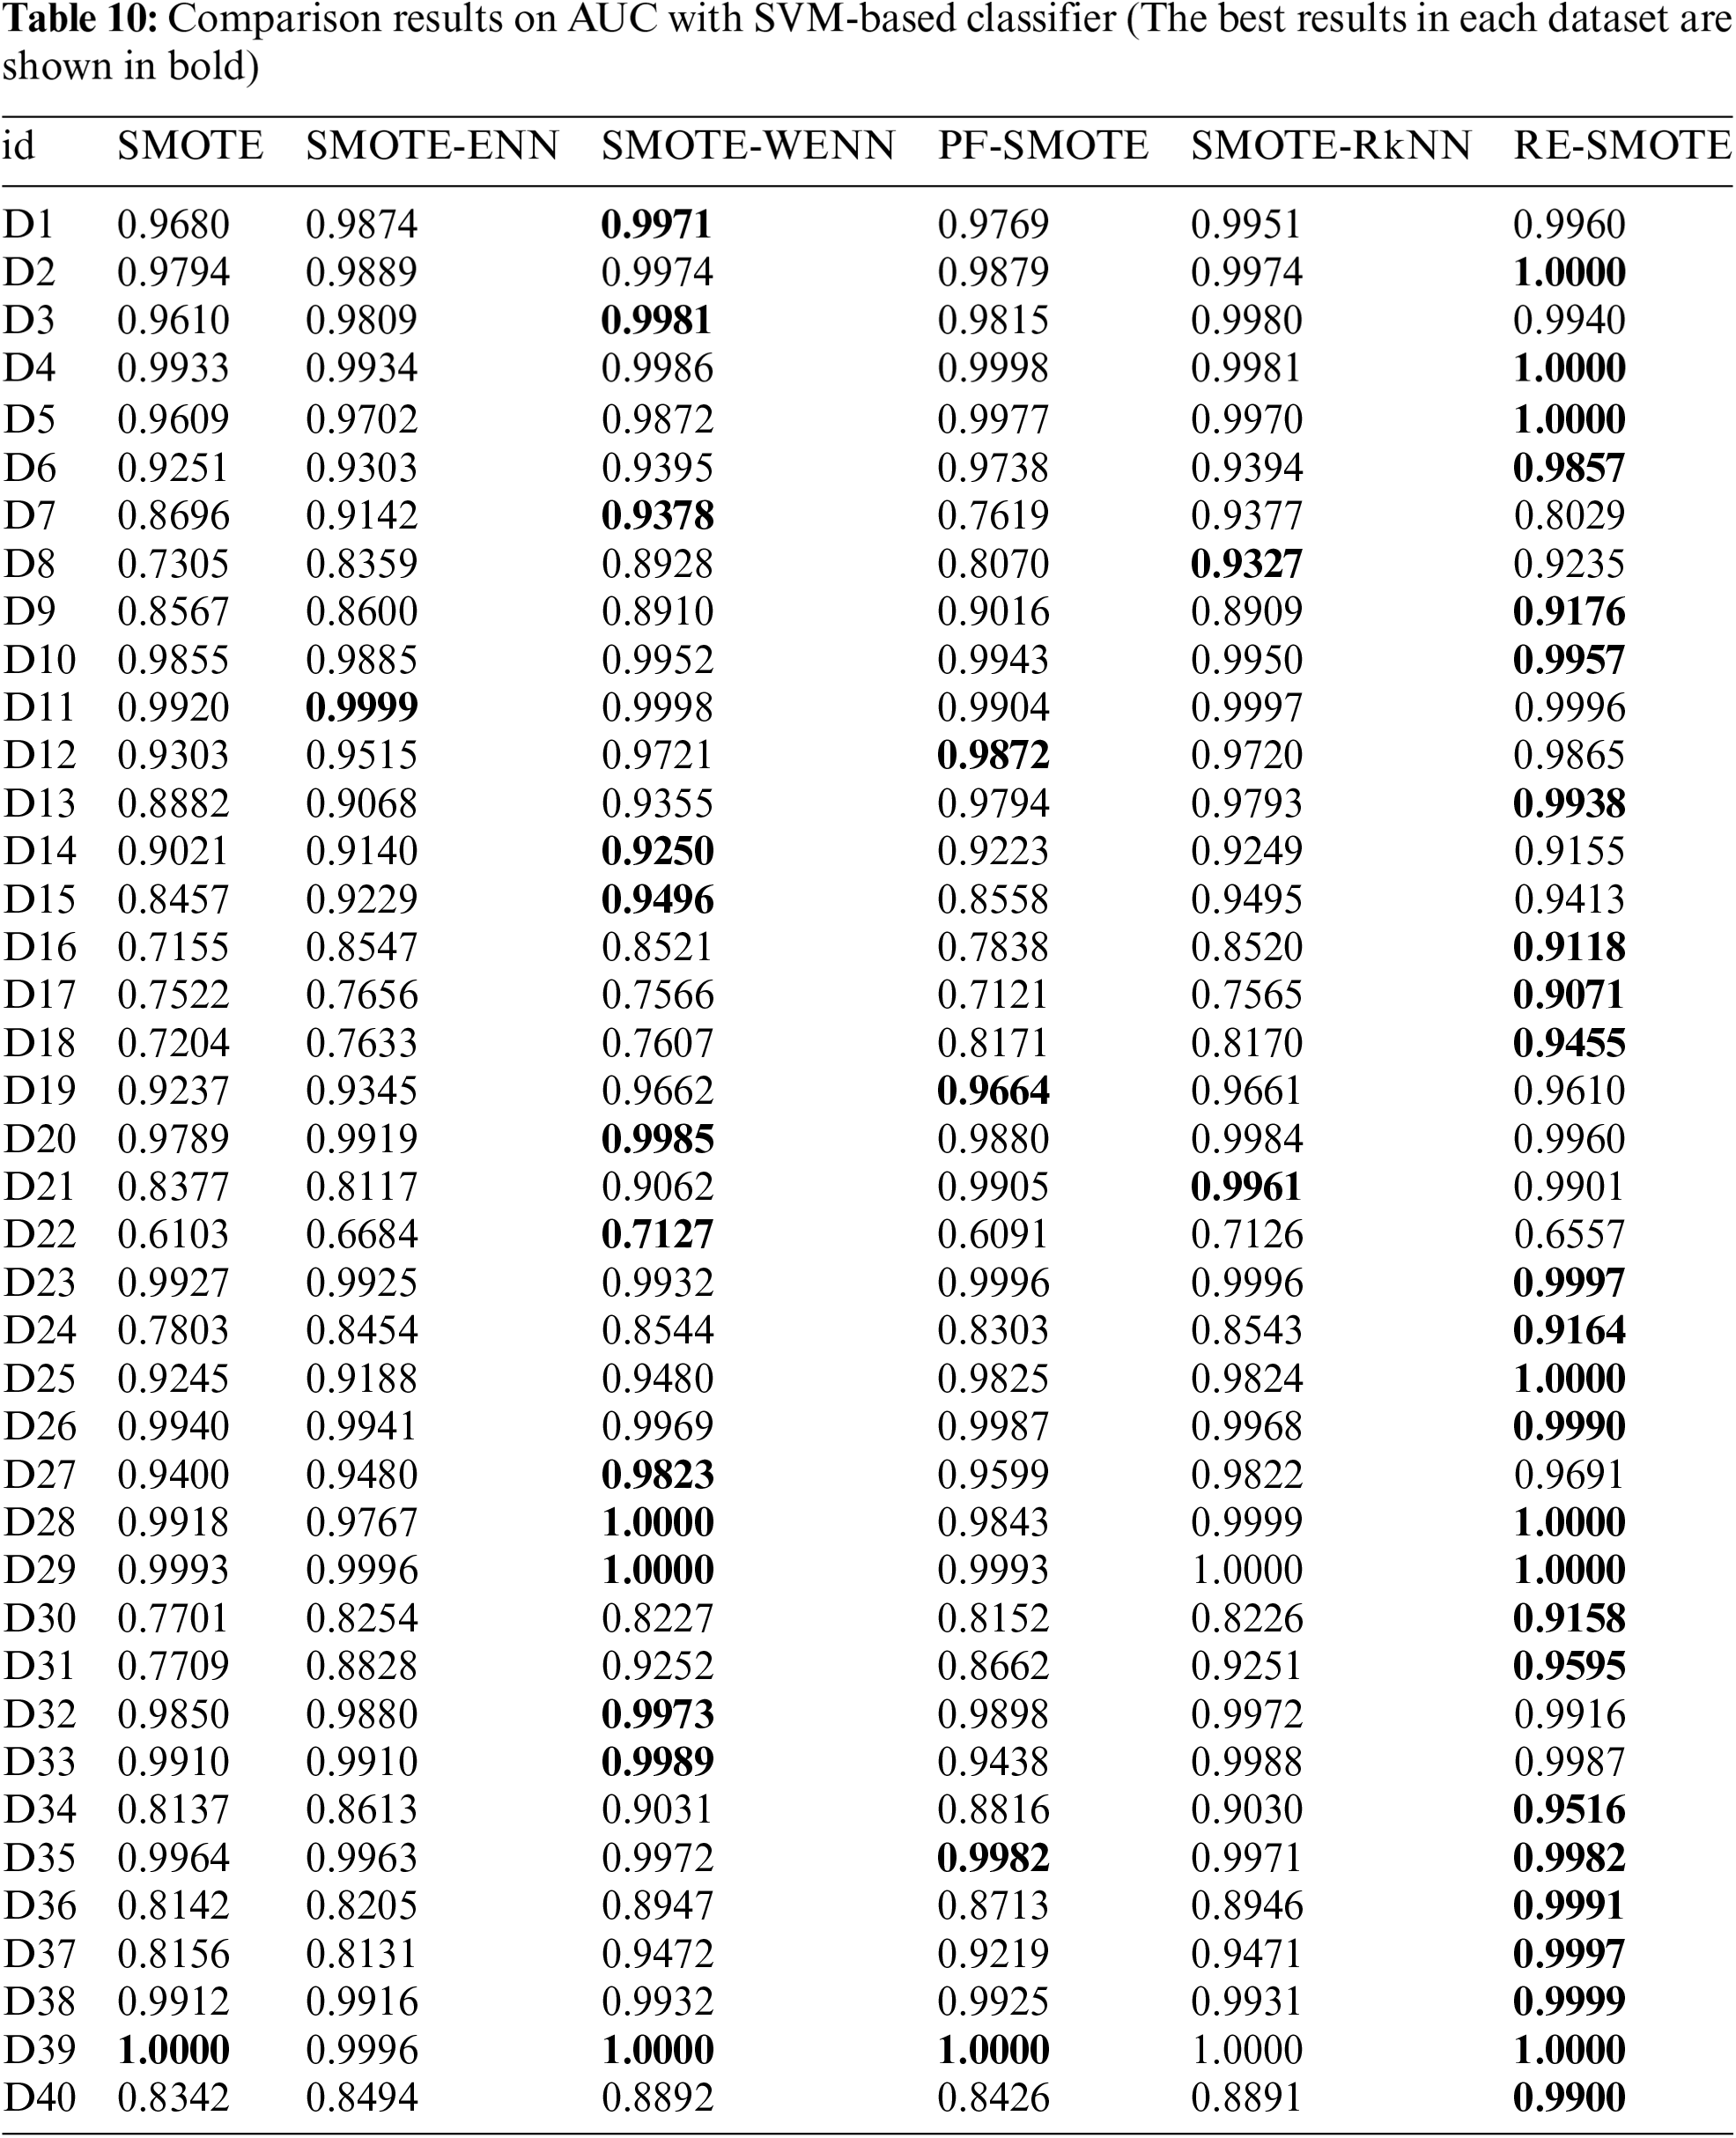
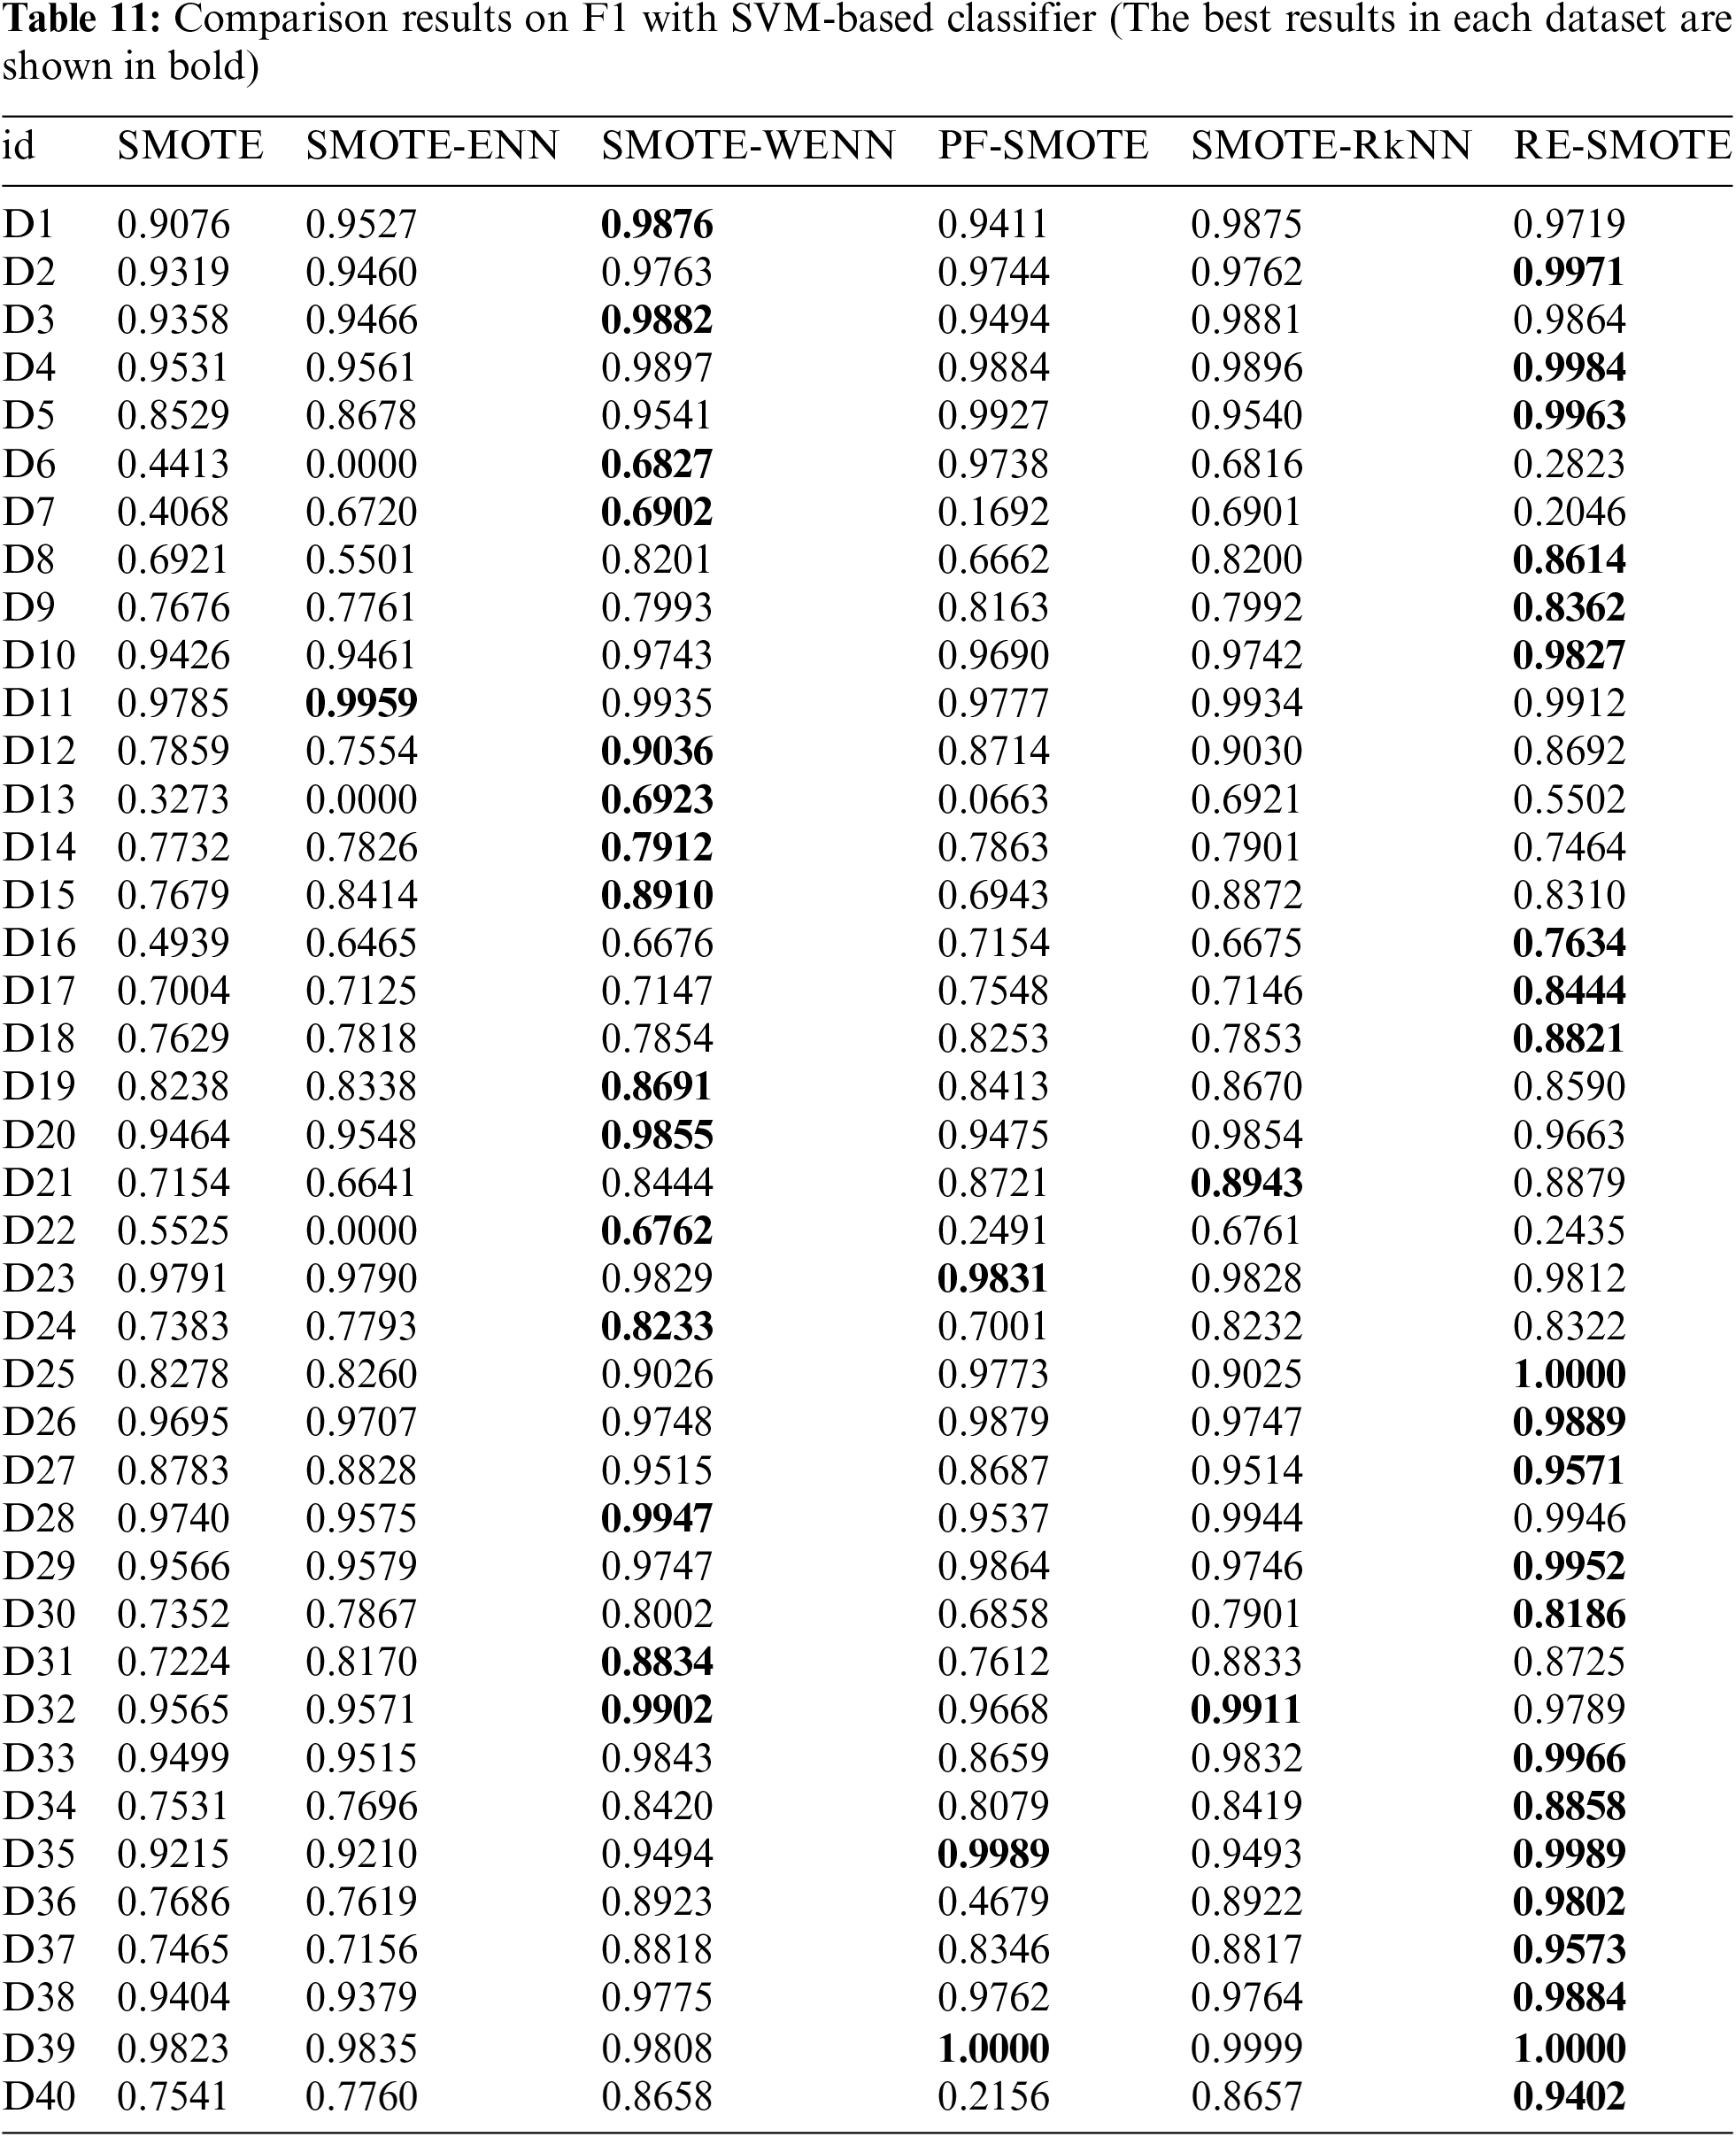
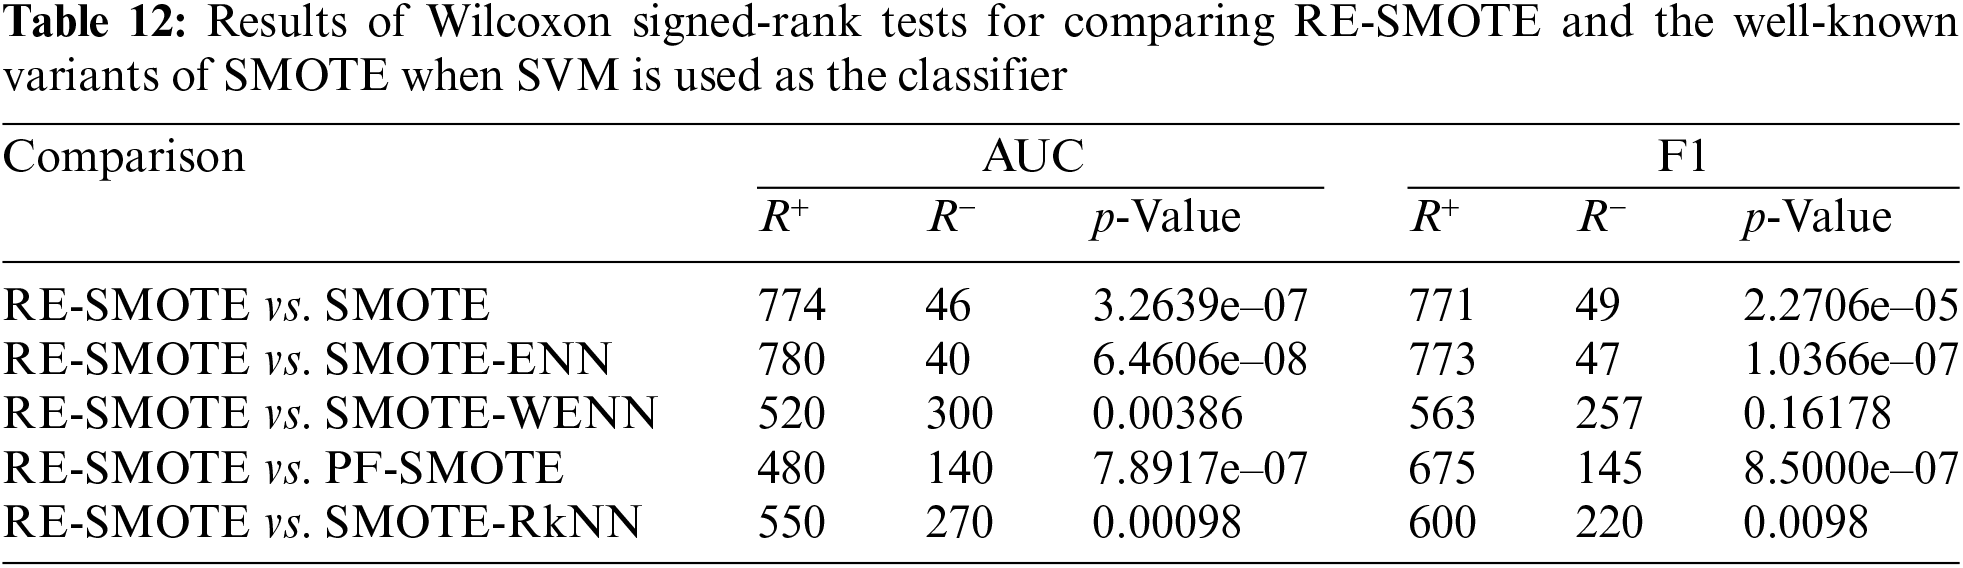
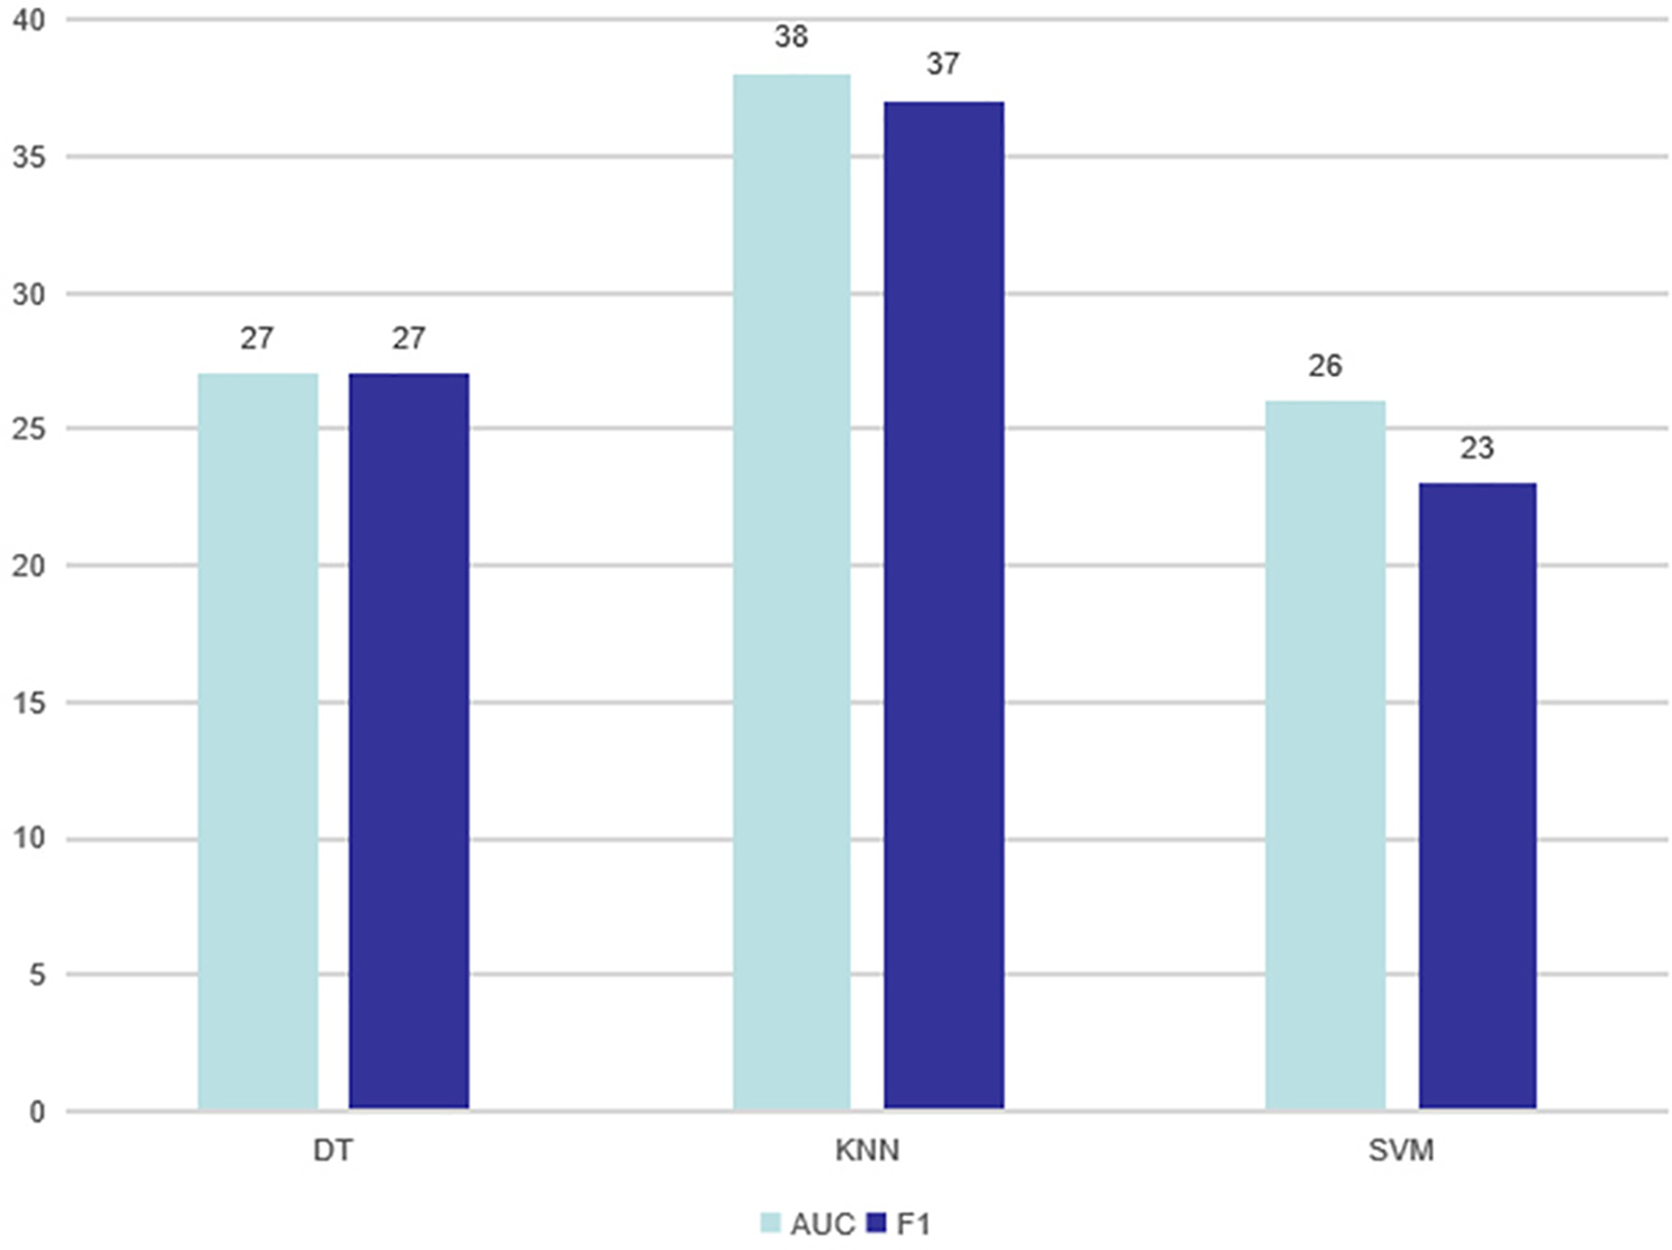
Figure 7: Best results of RE-SMOTE on 40 data sets
Table 3 presents the average results of comparative methods across 40 datasets, tested on three different classifiers. From the table, it is evident that our method consistently outperforms the comparative approaches across all classifiers, demonstrating its superior performance. This highlights the effectiveness and robustness of our approach to handling diverse datasets.
In addition to the above comparisons, “The Wilcoxon Signed Rank Test” is also used for statistical analysis of the proposed RE-SMOTE. The Wilcoxon Signed Rank Test (also known as Wilcoxon Signed Rank Sum Test) is non-parametric, and it is often used to determine the matching degree of the overall data distributions, especially for non-normal conditions. The statistical test results on AUC and F1 with DT-based, KNN-based, and SVM-based classifiers are given in Tables 6, 9, and 12, respectively.
For p-value, we have zero hypothesis: there is no difference between the performance of RE-SMOTE and other models. A smaller p-value means this zero hypothesis can be rejected. As can be seen from the results, the p-value is smaller for most cases (significantly less than alpha-value = 0.05). There is only one exceptional case in Table 13. p-value = 0.16178 for RE-SMOTE vs. SMOTE-WENN on F1. Therefore, for comprehensive consideration, there are significant differences between RE-SMOTE and other compared models.
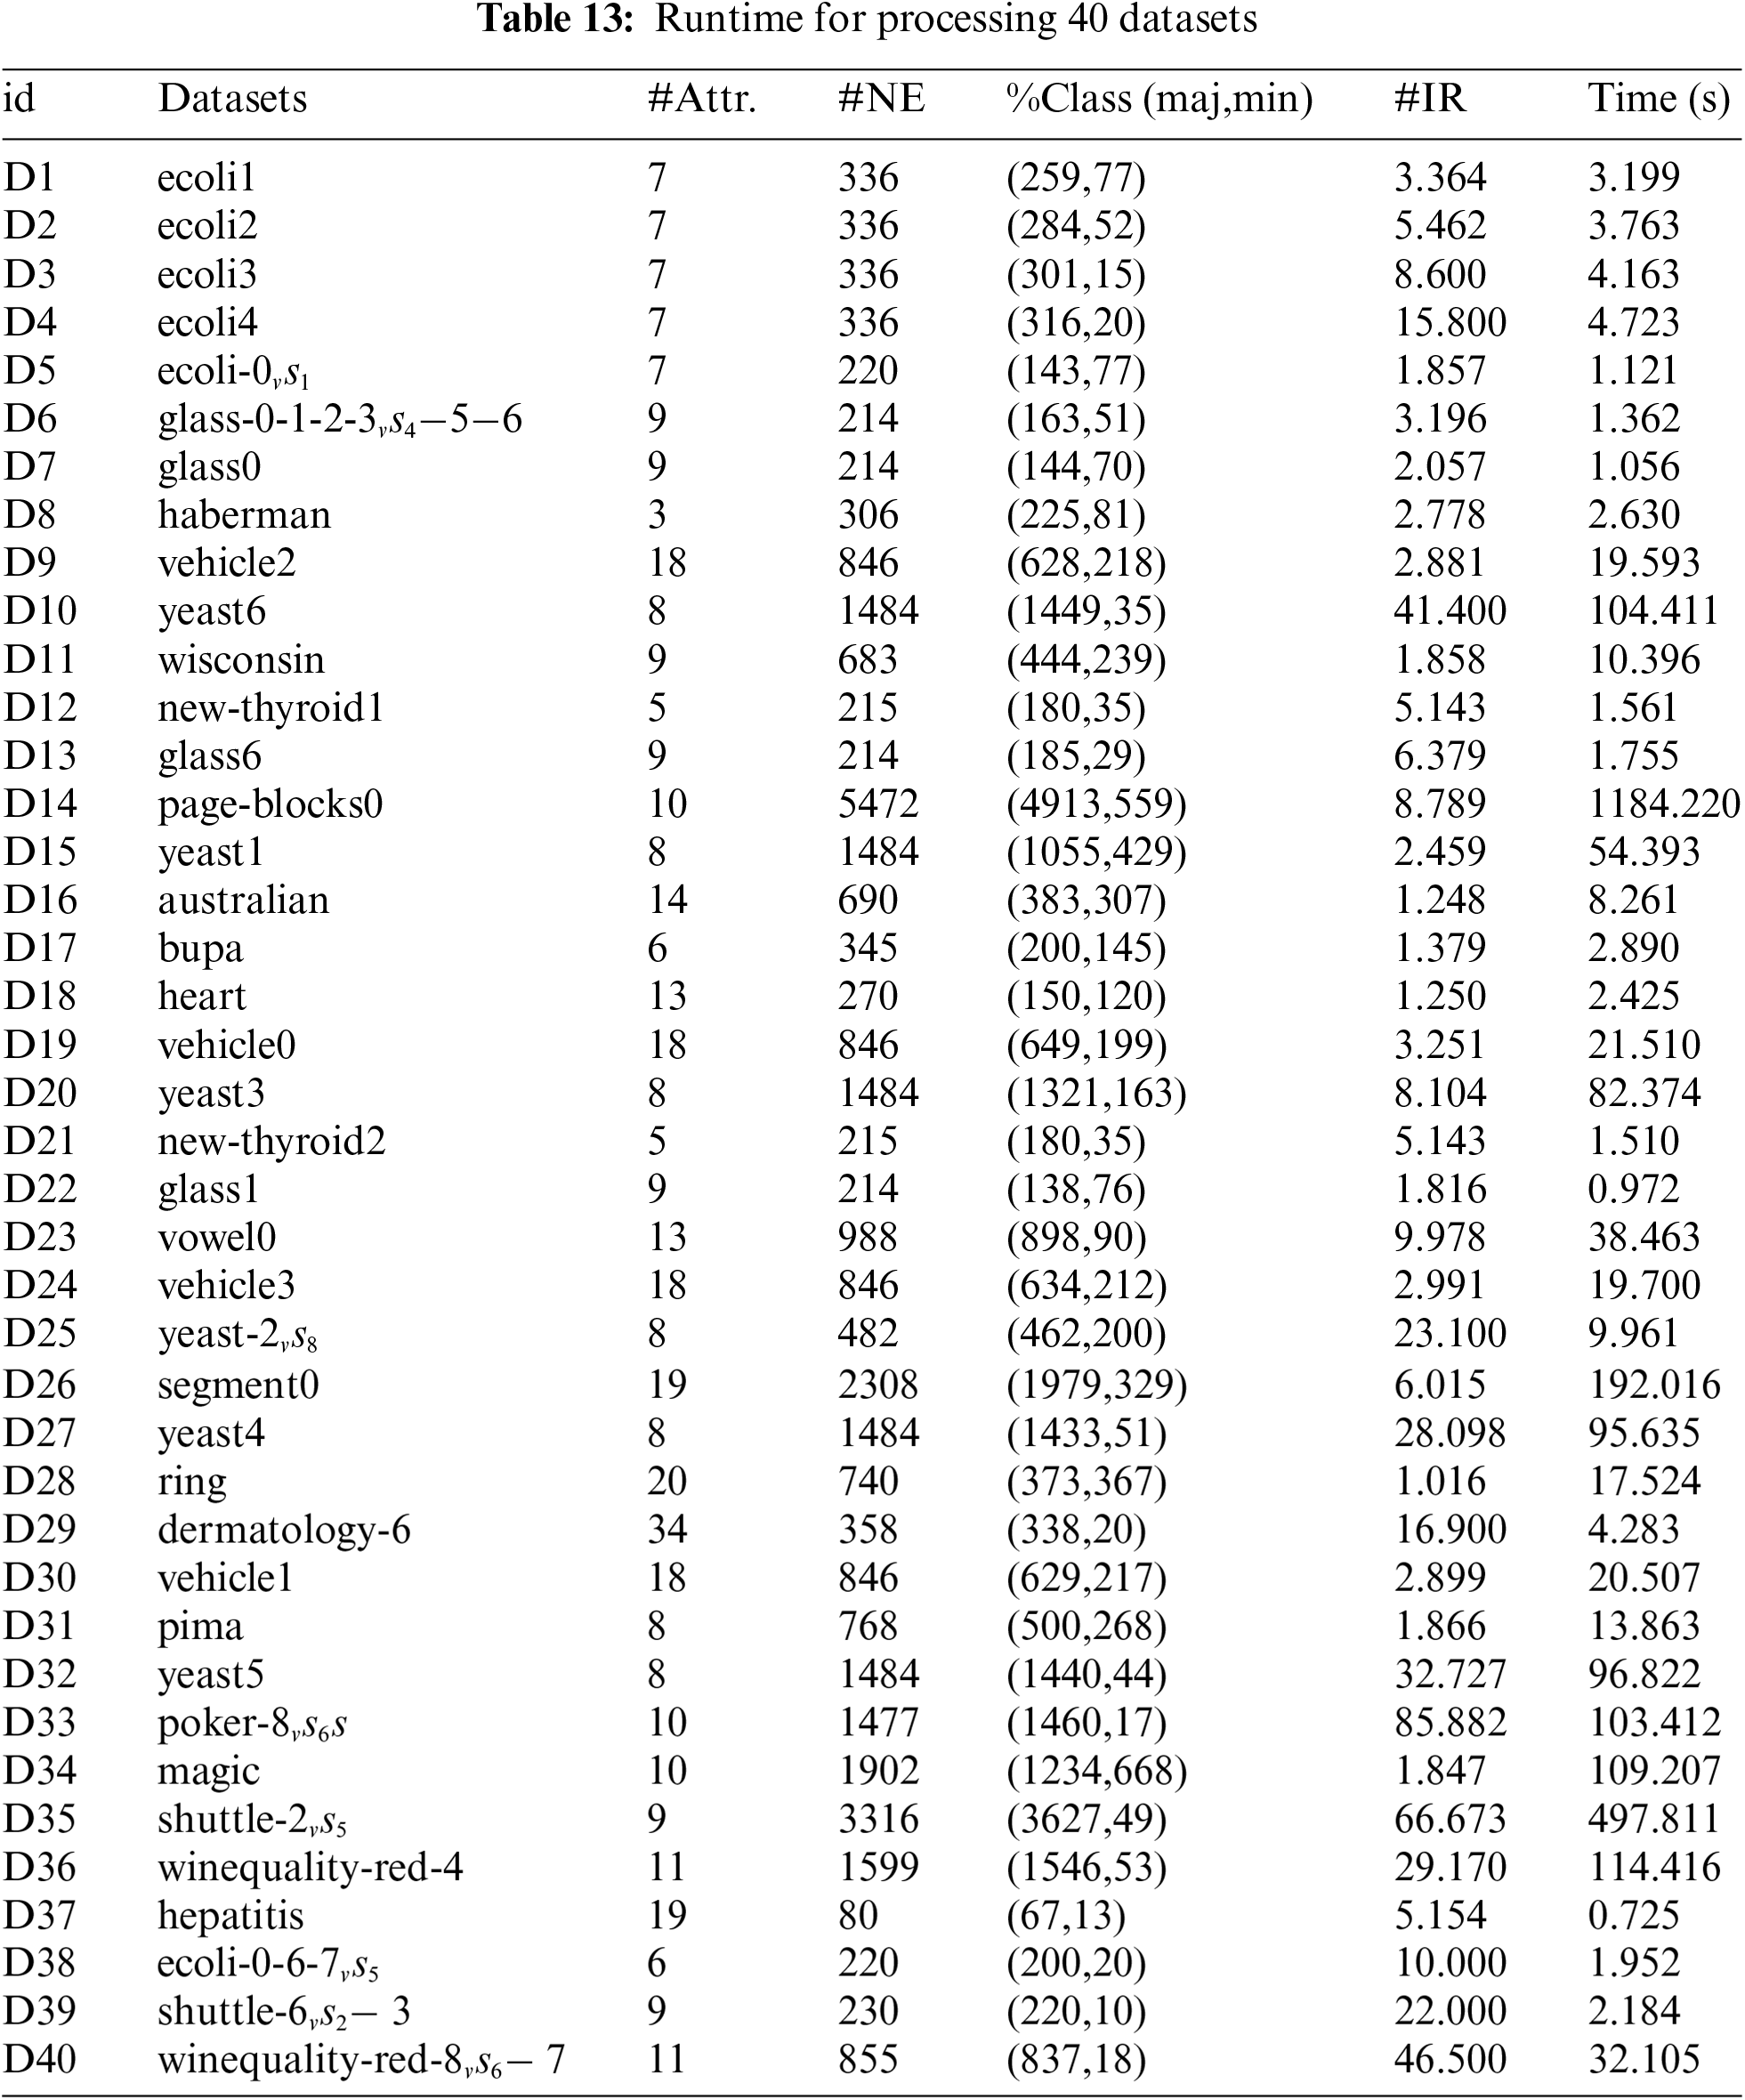
5.3 Runtime and Complexity Analysis
In this section, the runtime for processing all 40 datasets has been recorded and presented in Table 13. Each dataset is processed using the methods described in this study, and the total time for each dataset is measured to provide a comprehensive overview of the computational performance. Based on the results, it can be observed that the processing time increases as the dataset size and imbalance ratio (IR) grow. Due to operations such as reverse k-nearest neighbor searches, the time consumption grows significantly as the dataset size increases.
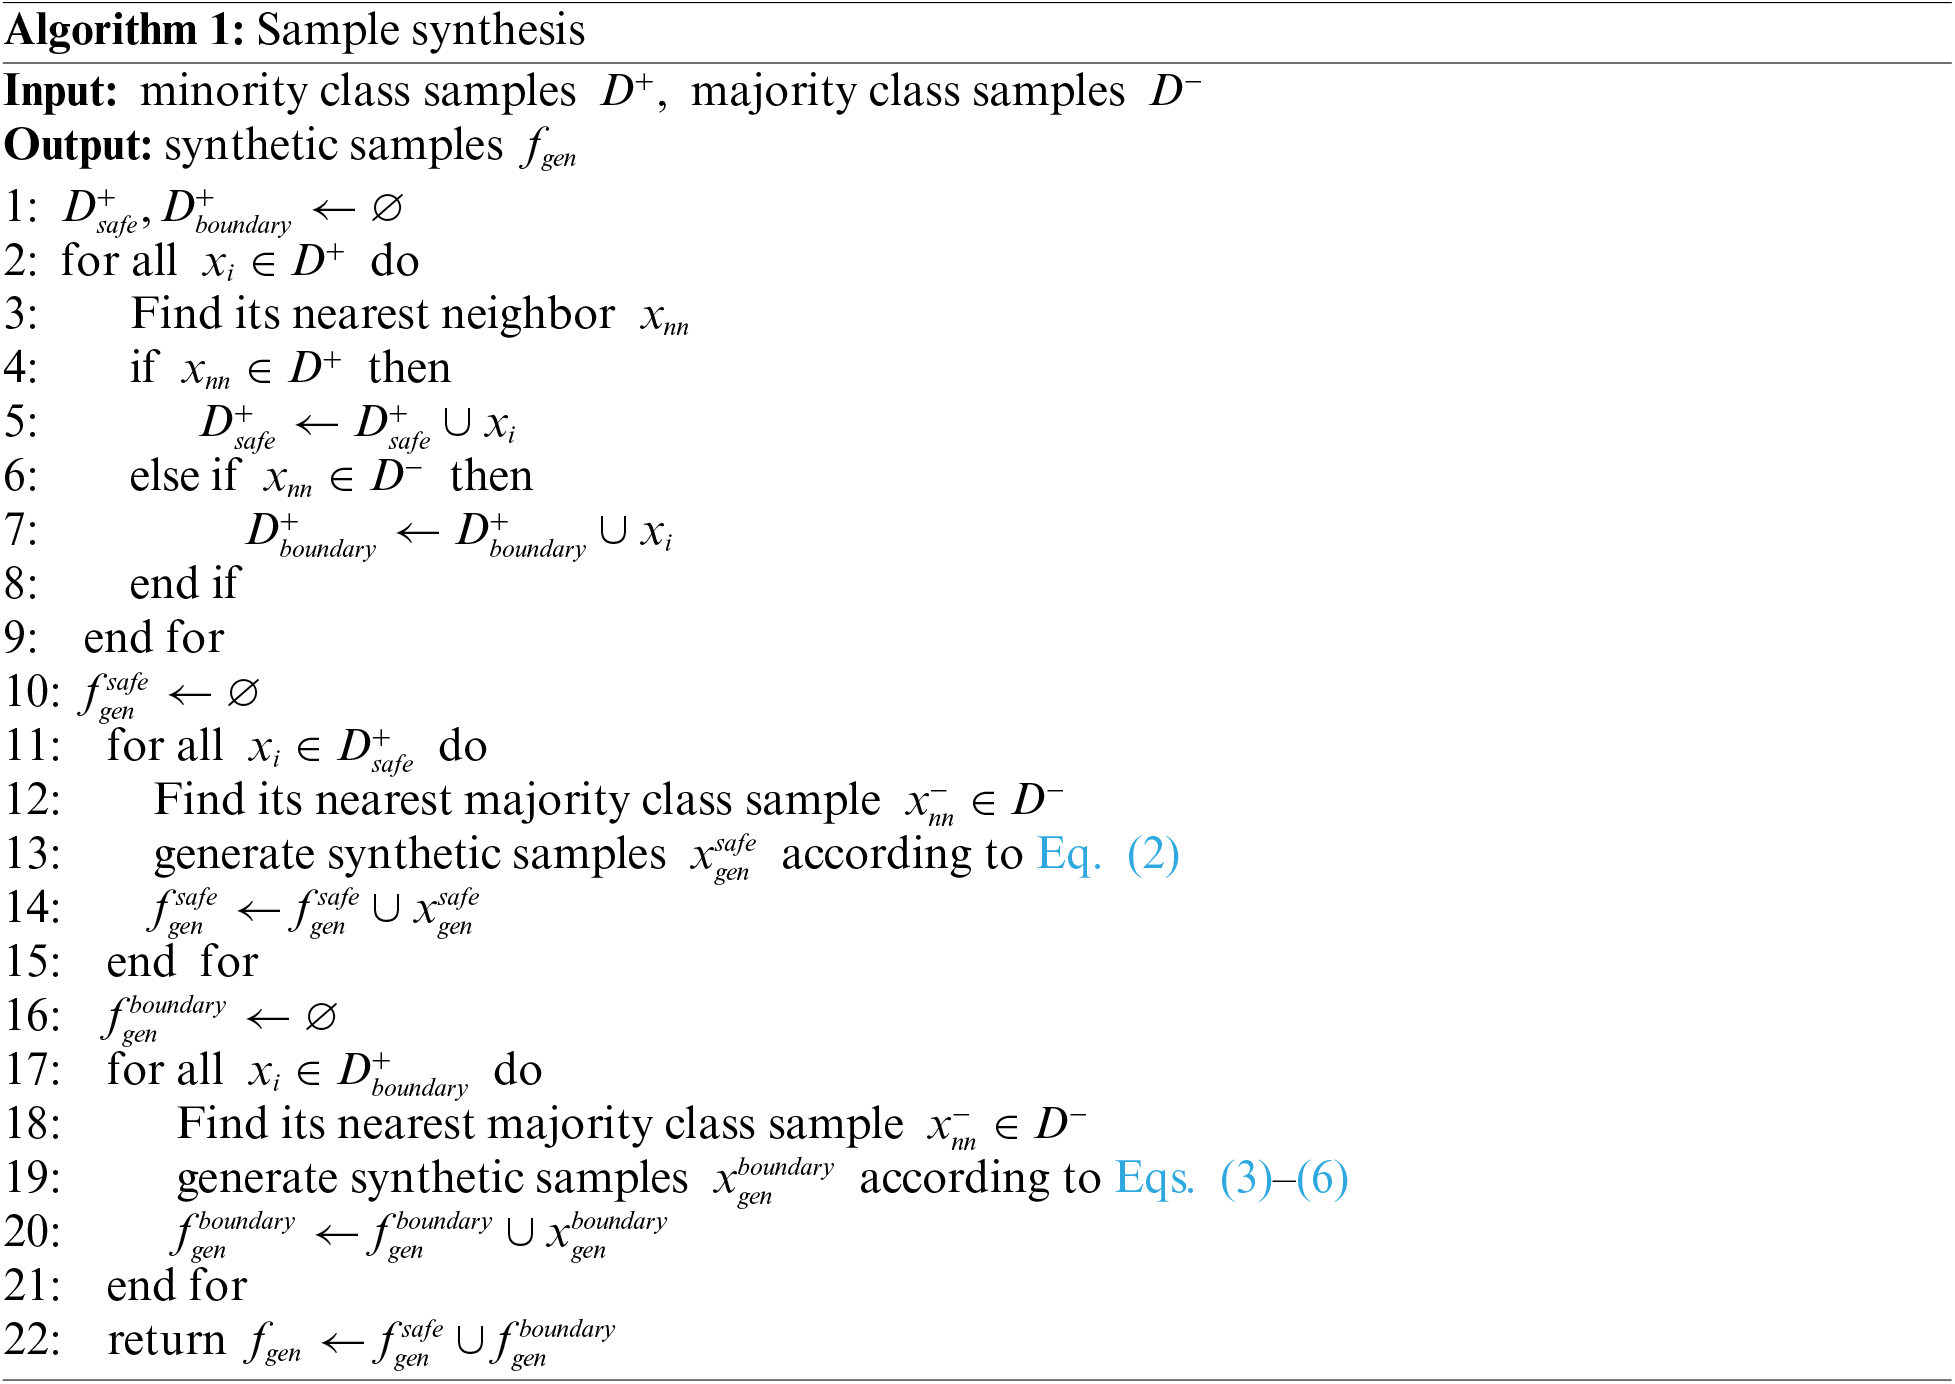
Regarding the complexity, two core algorithms are analyzed. The time complexity of Algorithm 1 is
For Algorithm 2, the time complexity of Algorithm 2 is
In this paper, we propose a novel hybrid resampling method RE-SMOTE to solve the class imbalance and diversity of synthetic samples. Different sample synthesis rules are adopted for the safe minority and the boundary minority class, and noisy samples are judged by WENN and the relative density for data cleaning. To demonstrate the effectiveness of RE-SMOTE, a variety of experiments on 40 datasets are tested. Different SMOTE variants equipment with different classifiers are adopted for evaluation. The experimental results demonstrate that the proposed RE-SMOTE significantly outperforms baseline methods.
The proposed method addresses the binary imbalance problem. In future work, we will focus on the more complex multivariate imbalance problem. Currently, minority classes are categorized into safe minority and boundary minority; we plan to explore personalized sample synthesis rules for various minority classes. Additionally, we will investigate further noise filters for data cleaning.
Acknowledgement: We thank all the members who have contributed to this work with us.
Funding Statement: This research is supported by the National Key R&D Program of China, No. 2022YFC3006302.
Author Contributions: Study conception and design: Dazhi E, Jiale Liu, Ming Zhang; Data collection: Dazhi E, Huiyuan Jiang, Keming Mao; Analysis and interpretation of methods: Dazhi E, Ming Zhang, Keming Mao; Draft manuscript preparation: Dazhi E, Huiyuan Jiang; Review and editing: Ming Zhang. All authors reviewed the results and approved the final version of the manuscript.
Availability of Data and Materials: The datasets and materials used in this study are available at https://github.com/blue9792/RE-SMOTE (accessed on 30 September 2024) and have been made publicly accessible for reproducibility and further research.
Ethics Approval: Not applicable.
Conflicts of Interest: The authors declare no conflicts of interest to report regarding the present study.
References
1. Z. Li, J. Tang, and T. Mei, “Deep collaborative embedding for social image understanding,” IEEE Trans. Pattern Anal. Mach. Intell., vol. 41, no. 9, pp. 2070–2083, 1 Sep. 2019. doi: 10.1109/TPAMI.2018.2852750. [Google Scholar] [PubMed] [CrossRef]
2. C. Zhang, Y. Xie, H. Bai, B. Yu, W. Li and Y. Gao, “A survey on federated learning,” Knowl.-Based Syst., vol. 216, 2021, Art. no. 106775. doi: 10.1016/j.knosys.2021.106775. [Google Scholar] [CrossRef]
3. B. Zhao, X. Zhang, H. Li, and Z. Yang, “Intelligent fault diagnosis of rolling bearings based on normalized CNN considering data imbalance and variable working conditions,” Knowl.-Based Syst., vol. 199, 2020, Art. no. 105971. doi: 10.1016/j.knosys.2020.105971. [Google Scholar] [CrossRef]
4. L. Wang, Y. Chen, H. Jiang, and J. Yao, “Imbalanced credit risk evaluation based on multiple sampling, multiple kernel fuzzy self-organizing map and local accuracy ensemble,” Appl. Soft Comput., vol. 91, no. 3, 2020, Art. no. 106262. doi: 10.1016/j.asoc.2020.106262. [Google Scholar] [CrossRef]
5. V. S. Sheng and C. X. Ling, “Thresholding for making classifiers cost-sensitive,” in Proc. 21st Natl. Conf. Artif. Intell., 2006, vol. 1, no. 3, pp. 476–481. doi: 10.1016/j.asoc.2020.106262. [Google Scholar] [CrossRef]
6. G. LemaÃŽtre, F. Nogueira, and C. K. Aridas, “Imbalanced-learn: A python toolbox to tackle the curse of imbalanced datasets in machine learning,” J. Mach. Learn. Res., vol. 18, no. 17, pp. 1–5, 2017. [Google Scholar]
7. N. V. Chawla, K. W. Bowyer, L. O. Hall, and W. P. Kegelmeyer, “SMOTE: Synthetic minority over-sampling technique,” J. Artif. Intell. Res., vol. 16, pp. 321–357, 2002. doi: 10.1613/jair.953. [Google Scholar] [CrossRef]
8. S. -J. Yen and Y. -S. Lee, “Cluster-based under-sampling approaches for imbalanced data distributions,” Expert. Syst. Appl., vol. 36, no. 3, pp. 5718–5727, 2009. doi: 10.1016/j.eswa.2008.06.108. [Google Scholar] [CrossRef]
9. E. Ramentol, Y. Caballero, R. Bello, and F. Herrera, “SMOTE-RSB*: A hybrid preprocessing approach based on oversampling and undersampling for high imbalanced data-sets using smote and rough sets theory,” Knowl. Inf. Syst., vol. 33, no. 2, pp. 245–265, 2012. doi: 10.1007/s10115-011-0465-6. [Google Scholar] [CrossRef]
10. Z. -J. Lee, C. -Y. Lee, S. -T. Chou, W. -P. Ma, F. Ye and Z. Chen, “A hybrid system for imbalanced data mining,” Microsyst. Technol., vol. 26, no. 9, pp. 3043–3047, 2020. doi: 10.1007/s00542-019-04566-1. [Google Scholar] [CrossRef]
11. D. Gyoten, M. Ohkubo, and Y. Nagata, “Imbalanced data classification procedure based on SMOTE,” Total Qual. Sci., vol. 5, no. 2, pp. 64–71, 2020. doi: 10.17929/tqs.5.64. [Google Scholar] [CrossRef]
12. N. V. Chawla, N. Japkowicz, and A. Kotcz, “Special issue on learning from imbalanced data sets,” ACM SIGKDD Explor. Newsl., vol. 6, no. 1, pp. 1–6, 2004. doi: 10.1145/1007730.1007733. [Google Scholar] [CrossRef]
13. M. Galar, A. Fernandez, E. Barrenechea, H. Bustince, and F. Herrera, “A review on ensembles for the class imbalance problem: Bagging-, boosting-, and hybrid-based approaches,” IEEE Trans. Syst. Man Cybern. Part C (Appl. Rev.), vol. 42, no. 4, pp. 463–484, 2011. doi: 10.1109/TSMCC.2011.2161285. [Google Scholar] [CrossRef]
14. S. Kotsiantis, D. Kanellopoulos, and P. Pintelas, “Handling imbalanced datasets: A review,” GESTS Int. Trans. Comput. Sci. Eng., vol. 30, no. 1, pp. 25–36, 2006. [Google Scholar]
15. X. -Y. Liu and Z. -H. Zhou, “The influence of class imbalance on cost-sensitive learning: An empirical study,” in Sixth Int. Conf. Data Min. (ICDM’06), Hong Kong, China, 2006, pp. 970–974. doi: 10.1109/ICDM.2006.158. [Google Scholar] [CrossRef]
16. M. A. Maloof, “Learning when data sets are imbalanced and when costs are unequal and unknown,” in Int. Conf. Mach. Learn., 2003. [Google Scholar]
17. K. McCarthy, B. Zabar, and G. Weiss, “Does cost-sensitive learning beat sampling for classifying rare classes?” in Proc. 1st Int. Workshop Util.-Based Data Min., 2005, pp. 69–77. [Google Scholar]
18. G. Douzas, F. Bacao, and F. Last, “Improving imbalanced learning through a heuristic oversampling method based on k-means and SMOTE,” Inform. Sci., vol. 465, no. 1, pp. 1–20, 2018. doi: 10.1016/j.ins.2018.06.056. [Google Scholar] [CrossRef]
19. Q. Chen, Z. -L. Zhang, W. -P. Huang, J. Wu, and X. -G. Luo, “PF-SMOTE: A novel parameter-free SMOTE for imbalanced datasets,” Neurocomputing, vol. 498, no. 16, pp. 75–88, 2022. doi: 10.1016/j.neucom.2022.05.017. [Google Scholar] [CrossRef]
20. H. Guan, Y. Zhang, M. Xian, H. -D. Cheng, and X. Tang, “SMOTE-WENN: Solving class imbalance and small sample problems by oversampling and distance scaling,” Appl. Intell., vol. 51, no. 3, pp. 1394–1409, 2021. doi: 10.1007/s10489-020-01852-8. [Google Scholar] [CrossRef]
21. A. P. Bradley, “The use of the area under the ROC curve in the evaluation of machine learning algorithms,” Pattern Recognit., vol. 30, no. 7, pp. 1145–1159, 1997. doi: 10.1016/S0031-3203(96)00142-2. [Google Scholar] [CrossRef]
22. J. Demsar, “Statistical comparisons of classifiers over multiple data sets,” J. Mach. Learn. Res., vol. 7, pp. 1–30, Jan. 2006. [Google Scholar]
23. T. F. Zhu, Y. P. Lin, and Y. H. Liu, “Synthetic minority oversampling technique for multiclass imbalance problems,” Pattern Recognit., vol. 72, no. 9, pp. 327–340, Dec. 2017. doi: 10.1016/j.patcog.2017.07.024. [Google Scholar] [CrossRef]
24. M. Dong, M. Liu, and C. Jing, “Sampling safety coefficient for multi-class imbalance oversampling algorithm,”(in ChineseJ. Front. Comput. Sci. Technol., vol. 14, no. 10, pp. 1776–1786, 2020. [Google Scholar]
25. H. A. Khorshidi and U. Aickelin, “A synthetic over-sampling method with minority and majority classes for imbalance problems,” 2020, arXiv:2011.04170. [Google Scholar]
26. M. Dong, Z. Jiang, and C. Jing, “Multi-class imbalanced learning algorithm based on Hellinger Distance and SMOTE algorithm,” (in ChineseComput. Sci., vol. 47, no. 1, pp. 102–109, 2020. [Google Scholar]
27. D. A. Cieslak, T. R. Hoens, N. V. Chawla, and W. P. Kegelmeyer, “Hellinger distance decision trees are robust and skew-insensitive,” Data Min. Knowl. Discov., vol. 24, no. 1, pp. 136–158, Jan. 2012. doi: 10.1007/s10618-011-0222-1. [Google Scholar] [CrossRef]
28. H. He, Y. Bai, E. A. Garcia, and S. Li, “ADASYN: Adaptive synthetic sampling approach for imbalanced learning,” in 2008 IEEE Int. Joint Conf. Neural Netw. (IEEE World Congr. Comput. Intell.), Hong Kong, China, 2008, pp. 1322–1328. doi: 10.1109/IJCNN.2008.4633969. [Google Scholar] [CrossRef]
29. H. Han, W. Y. Wang, and B. H. Mao, “Borderline-SMOTE: A new over-sampling method in imbalanced data sets learning,” Adv. Intell. Comput., vol. 3644, pp. 878–887, 2005. doi: 10.1007/11538059. [Google Scholar] [CrossRef]
30. R. Alejo, V. García, and J. Pacheco-Sánchez, “An efficient over-sampling approach based on mean square error back-propagation for dealing with the multi-class imbalance problem,” Neural Process. Lett., vol. 42, no. 3, pp. 603–617, Dec. 2015. doi: 10.1007/s11063-014-9376-3. [Google Scholar] [CrossRef]
31. Y. E. Kurniawati, A. E. Permanasari, and S. Fauziati, “Adaptive synthetic-nominal (ADASYN-N) and adaptive synthetic-KNN (ADASYN-KNN) for multiclass imbalance learning on laboratory test data,” in 2018 4th Int. Conf. Sci. Technol. (ICST), Yogyakarta, Indonesia, 2018, pp. 1–6. doi: 10.1109/ICSTC.2018.8528679. [Google Scholar] [CrossRef]
32. S. Rahayu, J. A. Putra, and Y. M.Z, “Effect of giving N value on ADA N method for classification of imbalanced nominal data,” in 2019 4th Int. Conf. Inform. Technol. Inform. Syst. Elect. Eng. (ICITISEE), Yogyakarta, Indonesia, 2019, pp. 290–294. doi: 10.1109/ICITISEE48480.2019.9003757. [Google Scholar] [CrossRef]
33. A. Agrawal, H. L. Viktor, and E. Paquet, “SCUT: Multi-class imbalanced data classification using SMOTE and cluster-based undersampling,” in 7th Int. Joint Conf. Knowl. Discov. Knowl. Eng. Knowl. Manage. (IC3K), Lisbon, Portugal, 2015, pp. 226–233. [Google Scholar]
34. O. M. Olaitan and H. L. Viktor, “SCUT-DS: Learning from multi-class imbalanced Canadian weather data,” in 24th Int. Symp. Methodol. Intell. Syst. (ISMIS), Limassol, Cyprus, 2018, vol. 11177, pp. 291–301. doi: 10.1007/978-3-030-01851-1_28. [Google Scholar] [CrossRef]
35. S. Feng et al., “COSTE: Complexity-based OverSampling TEchnique to alleviate the class imbalance problem in software defect prediction,” Inf. Softw. Tech., vol. 129, Jan. 2021, Art. no. 106432. doi: 10.1016/j.infsof.2020.106432. [Google Scholar] [CrossRef]
36. S. Hartono, A. Lestari, A. Rahmadsyah, R. Maya Faza Lubis, and M. Gunawan, “HAR-MI with COSTE in handling multi-class imbalance,” in 2020 8th Int. Conf. Cyber IT Serv. Manage. (CITSM), Pangkal, Indonesia, 2020, pp. 1–4. doi: 10.1109/CITSM50537.2020.9268804. [Google Scholar] [CrossRef]
37. S. W. Purnami and R. K. Trapsilasiwi, “SMOTE-least square support vector machine for classification of multiclass imbalanced data,” in Proc. 9th Int. Conf. Mach. Learn. Comput., 2017, pp. 107–111. [Google Scholar]
38. N. U. Asniar, N. U. Maulidevi, and K. Surendro, “SMOTE-LOF for noise identification in imbalanced data classification,” J. King Saud Univ.-Comput. Inform. Sci., vol. 34, no. 6, pp. 3413–3423, Jun. 2022. doi: 10.1016/j.jksuci.2021.01.014. [Google Scholar] [CrossRef]
39. A. Arafa, N. El-Fishawy, M. Badawy, and M. Radad, “RN-SMOTE: Reduced noise SMOTE based on DBSCAN for enhancing imbalanced data classification,” J. King Saud Univ.-Comput. Inform. Sci., vol. 34, no. 8, pp. 5059–5074, Sep. 2022. doi: 10.1016/j.jksuci.2022.06.005. [Google Scholar] [CrossRef]
40. S. Maldonado, C. Vairetti, A. Fernandez, and F. Herrera, “FW-SMOTE: A feature-weighted oversampling approach for imbalanced classification,” Pattern Recogn., vol. 124, Apr. 2022, Art. no. 108511. doi: 10.1016/j.patcog.2021.108511. [Google Scholar] [CrossRef]
41. D. Dablain, B. Krawczyk, and N. V. Chawla, “DeepSMOTE: Fusing deep learning and SMOTE for imbalanced data,” IEEE Trans. Neural Netw. Learn. Syst., vol. 34, no. 9, pp. 6390–6404, Sep. 2023. doi: 10.1109/TNNLS.2021.3136503. [Google Scholar] [PubMed] [CrossRef]
42. L. Breiman, J. Friedman, R. Olshen, and C. Stone, Classification and Regression Trees, 1sted. New York, USA: Chapman and Hall/CRC; 1984. [Google Scholar]
43. S. L. Salzberg, “C4.5: Programs for machine learning by J. Ross Quinlan,” in Machine Learning, 1sted. Boston, MA, USA: Kluwer Academic Publishers, 1994, vol. 16, pp. 235–240. [Google Scholar]
44. V. Vapnik, “The support vector method of function estimation,” in Int. Workshop Adv. Black-Box Tech. Nonlinear Model.-Theory Appl., Catholic University of Louvain, Louvain, Belgium, 1998, pp. 55–85. [Google Scholar]
45. T. Cover and P. Hart, “Nearest neighbor pattern classification,” IEEE Trans. Inf. Theory, vol. 13, no. 1, pp. 21–27, 1967. doi: 10.1109/TIT.1967.1053964. [Google Scholar] [CrossRef]
46. G. E. Batista, R. C. Prati, and M. C. Monard, “A study of the behavior of several methods for balancing machine learning training data,” ACM SIGKDD Explor. Newsl., vol. 6, no. 1, pp. 20–29, 2004. doi: 10.1145/1007730.1007735. [Google Scholar] [CrossRef]
47. A. Zhang, H. Yu, Z. Huan, X. Yang, S. Zheng and S. Gao, “SMOTE-RkNN: A hybrid re-sampling method based on SMOTE and reverse k-nearest neighbors,” Inform. Sci., vol. 595, no. 2, pp. 70–88, May 2022. doi: 10.1016/j.ins.2022.02.038. [Google Scholar] [CrossRef]
Cite This Article
 Copyright © 2024 The Author(s). Published by Tech Science Press.
This work is licensed under a Creative Commons Attribution 4.0 International License , which permits unrestricted use, distribution, and reproduction in any medium, provided the original work is properly cited.
 Downloads
 Citation Tools