
 Submit a Paper
 Propose a Special lssue
 Open Access
ARTICLE

Secure Image Communication Using Galois Field, Hyper 3D Logistic Map, and B92 Quantum Protocol
1 Faculty of Computer Science, Universitas Dian Nuswantoro, Semarang, 50131, Central Java, Indonesia
2 Research Center for Quantum Computing and Materials Informatics, Faculty of Computer Science, Universitas Dian Nuswantoro, Semarang, 50131, Central Java, Indonesia
3 Faculty of Information Technology, Universitas Merdeka, Malang, 65146, East Java, Indonesia
4 Faculty of Economics and Business, Universitas STRADA Indonesia, Kediri, 64133, East Java, Indonesia
5 Faculty of Informatics and Computing, Universiti Sultan Zainal Abidin, Campus Besut, Besut, 22200, Terengganu, Malaysia
6 Department of Mechanical Engineering, Universitas Muhammadiyah Tasikmalaya, Tamansari Gobras, Tasikmalaya, 46196, Indonesia
* Corresponding Author: Nova Rijati. Email:
Computers, Materials & Continua 2024, 81(3), 4435-4463. https://doi.org/10.32604/cmc.2024.058478
Received 13 September 2024; Accepted 14 November 2024; Issue published 19 December 2024
 View Full Text
 Download PDF
Abstract
In this paper, we propose a novel secure image communication system that integrates quantum key distribution and hyperchaotic encryption techniques to ensure enhanced security for both key distribution and plaintext encryption. Specifically, we leverage the B92 Quantum Key Distribution (QKD) protocol to secure the distribution of encryption keys, which are further processed through Galois Field (GF(28)) operations for increased security. The encrypted plaintext is secured using a newly developed Hyper 3D Logistic Map (H3LM), a chaotic system that generates complex and unpredictable sequences, thereby ensuring strong confusion and diffusion in the encryption process. This hybrid approach offers a robust defense against quantum and classical cryptographic attacks, combining the advantages of quantum-level key distribution with the unpredictability of hyperchaos-based encryption. The proposed method demonstrates high sensitivity to key changes and resilience to noise, compression, and cropping attacks, ensuring both secure key transmission and robust image encryption.Keywords
Increasingly sophisticated cyber attacks increasingly threaten data security in digital communications. Cyberattacks continue to increase [1–3], with attack techniques such as man-in-the-middle, brute force, cryptography-based attacks, and machine learning increasingly endangering data integrity and privacy. One approach that is relied on to protect information in communications is encryption [4]. However, with the advancement of technology, classical encryption methods are vulnerable to attacks supported by machine learning [4], especially with quantum computing technology [5]. Algorithms such as Shor and Grover have shown potential in efficiently solving public and symmetric key encryption problems, reducing the security of factor-based cryptography or long keys [5].
To overcome this challenge, Quantum Key Distribution (QKD) offers a revolutionary solution for securely distributing encryption keys. QKD operates on quantum mechanical principles, where any attempt at eavesdropping disturbs the quantum states, making such efforts detectable. The BB84 protocol was the first QKD protocol developed and remains widely used due to its robust security. It employs four possible quantum states and two measurement bases, providing high security but requiring more complex hardware implementation [6]. B92, an extension of BB84, simplifies this approach by using only two non-orthogonal quantum states and a single measurement basis for key distribution [7]. This makes B92 more efficient while still retaining the ability to detect eavesdropping attempts based on quantum state changes. B92’s simpler design reduces the computational overhead, making it an attractive option for practical quantum communication systems [8,9]. Additionally, the main advantage of B92 is its ability to detect the presence of eavesdroppers through changes in quantum states, thus theoretically guaranteeing the security of key distribution.
In classical encryption systems, various methods can be used after distributing quantum keys, such as symmetric (AES, DES) and asymmetric (RSA, ECC) algorithms. A popular technique is the Galois Field (GF). GF excels in the efficiency of modular arithmetic operations, especially in block-based data manipulation and systems that require processing with simpler structures in symmetric encryption systems [10–12]. Operations on GF(28), for example, utilize blocks of data managed in 8-bit units, which allows for more efficient and secure data manipulation in encryption algorithms [11,13]. GF ensures that operations on data blocks can be performed modularly, maintaining computational efficiency without sacrificing security.
As encryption techniques develop, chaos methods are increasingly attracting attention. Chaos offers nonlinear and unpredictable encryption, making breaking more complicated than conventional linear encryption methods [14,15]. One of the most popular forms of chaos methods is the logistic map, which exhibits chaotic properties with patterns that are very sensitive to changes in initial values [16]. Logistic maps are iterative functions that are easy to implement in cryptographic systems. However, their development is carried out to increase complexity and security through variants such as improved logistic maps [17] or combining them with other chaotic maps into 2D logistic-adjusted-sine maps [18].
Furthermore, the hyperchaos phenomenon provides additional advantages in chaotic systems. Hyperchaos involves more than one positive Lyapunov exponent (LE) value, which results in more complex and unpredictable system dynamics [16]. Hyperchaos systems have lower stability, making them more resistant to decryption or spectral analysis efforts. Various variants of hyperchaotic systems have been developed to increase the diversity and complexity of key randomization, such as the Lorenz [19], Rössler [20], and Chen et al. [21] systems, which are classic examples of 3D hyperchaotic systems. The 3D Lorenz system is well known for its complex dynamic properties, with some further developments in the Improved Lorenz System [22], which expands the dimension to increase the complexity and security of the encryption. Hyperchaotic systems with larger dimensions, such as 4D hyperchaos, have also been developed, such as the 4D quadratic autonomous hyperchaotic system (4D-QAHS) [23], and even further developments up to 6D in the paper [24].
Further developments also include hyperchaotic variants on simpler systems, such as 2D Logistic Map and 2D Henon Map, which show potential for use in multimedia encryption scenarios due to their enhanced chaotic properties. Recently, several 2D hyperchaotic systems have been proposed for image encryption applications, such as 2D hyperchaotic map [25], 2D Schaffer Map [26], 2D simplified quadratic polynomial hyperchaotic map (2D-SQPM) [27], dan 2D Nonlinear Coupled Map Lattices (2DNLCML) [28] as well as several studies that combine several 2D chaotic maps to improve security such as [29,30]. However, 2D hyperchaotic systems have limitations regarding the complexity of the dynamics that can be generated. The use of 3D hyperchaotic systems becomes more attractive when all LE values are positive because they show extreme sensitivity to initial conditions and produce unpredictable chaos. Systems with more than one positive LE value allow for more random, secure dynamics and are very suitable for encryption scenarios [31]. In previous studies, the development of hyperchaos has had high dimensions, even up to 6D [24] and 7D hyperchaotic systems [32], but it is only limited to two positive LEs. In this study, a Hyper 3D Logistic Map (H3LM) is proposed, which is the development of a logistic map with additional dimensions to increase chaos in encryption. This system, characterized by more than one positive LE value, allows the creation of more complex and unpredictable dynamics, strengthening data security against modern cryptographic attacks. This study combines the strengths of B92 Quantum Key Distribution’s strengths, Galois Field (GF(28)) encryption operations, and Hyper 3D Logistic Map to produce a secure image encryption system. The main contributions of this study include:
1. Combining the B92 quantum protocol and classical operations in GF(28). This hybrid process is designed to improve the security of encryption keys, where the key generated from the B92 protocol is divided into two parts, and the GF(28) operation is performed to maintain the integrity and confidentiality of the key.
2. Developing an H3LM model that can generate more than one positive LE value results in a more complex chaotic system. With this approach, the chaos generated by the chaotic system not only makes encryption more random but also more difficult to hack due to the unpredictable chaotic nature.
3. Implementing a key and plaintext security system framework on digital images. The H3LM model combines the permutation and substitution processes on the bits and pixels level. Thus, the resulting image will be difficult to decrypt without access to a valid encryption key.
In short, this paper introduces a complete multi-layered security framework that integrates the B92 protocol for secure key distribution with classical chaotic encryption using GF(28) operations and H3LM for encrypting images. The hybrid quantum-classical security system ensures robust protection from key distribution to plaintext encryption. The structure of this paper is as follows: Section 2 discusses the theoretical foundations of GF(28) and introduces the novel H3LM method. Section 3 describes the detailed implementation of the proposed system, including the integration of B92 QKD with H3LM and the encryption process. Section 4 presents the experimental results and evaluates the system’s resilience against various attacks, while Section 5 concludes with discussions on the proposed system’s advantages and potential future developments.
The B92 protocol is one of the QKD methods developed to distribute quantum keys securely. This protocol utilizes two arbitrary non-orthogonal quantum states to generate and distribute keys without requiring two different measurement bases, as in the BB84 protocol. The non-orthogonal nature of the quantum states allows eavesdropping detection without requiring multiple bases, making its implementation simpler yet still efficient. The B92 protocol consists of several main steps:
1. Alice prepares the qubits in two non-orthogonal quantum states ∣0⟩ and ∣+⟩. In a common implementation, the states used are
2. Bob performs a measurement on the received qubit in a fixed basis (usually basis Z). If the qubit sent by Alice is ∣0⟩, Bob will measure a definite result of 0. If the qubit sent is ∣+⟩, it will produce a random measurement of 0 or 1 due to the superposition state. This creates uncertainty and keeps the system secure. If Bob’s measurement is free from eavesdropping or noise, the correct bit will be obtained, but otherwise the measurement result will be distorted.
3. After the measurement, Alice and Bob communicate over the classical channel to match the measurement basis used. In B92, Alice does not need to change the basis, so Bob only needs to tell whether he successfully measured the qubit or not.
4. Only the bits that Bob successfully measured are used to form the shared key. If any qubit is measured with an error, Bob will detect it and ignore it from the key.
One of the main advantages of B92 is its ability to detect eavesdroppers (Eve). These two non-orthogonal states allow tampering detection through their overlapping probability properties. For example, the probability that Bob can accurately measure the qubit sent by Alice when Eve tries to eavesdrop can be calculated using the overlap probability calculated by Eq. (1).
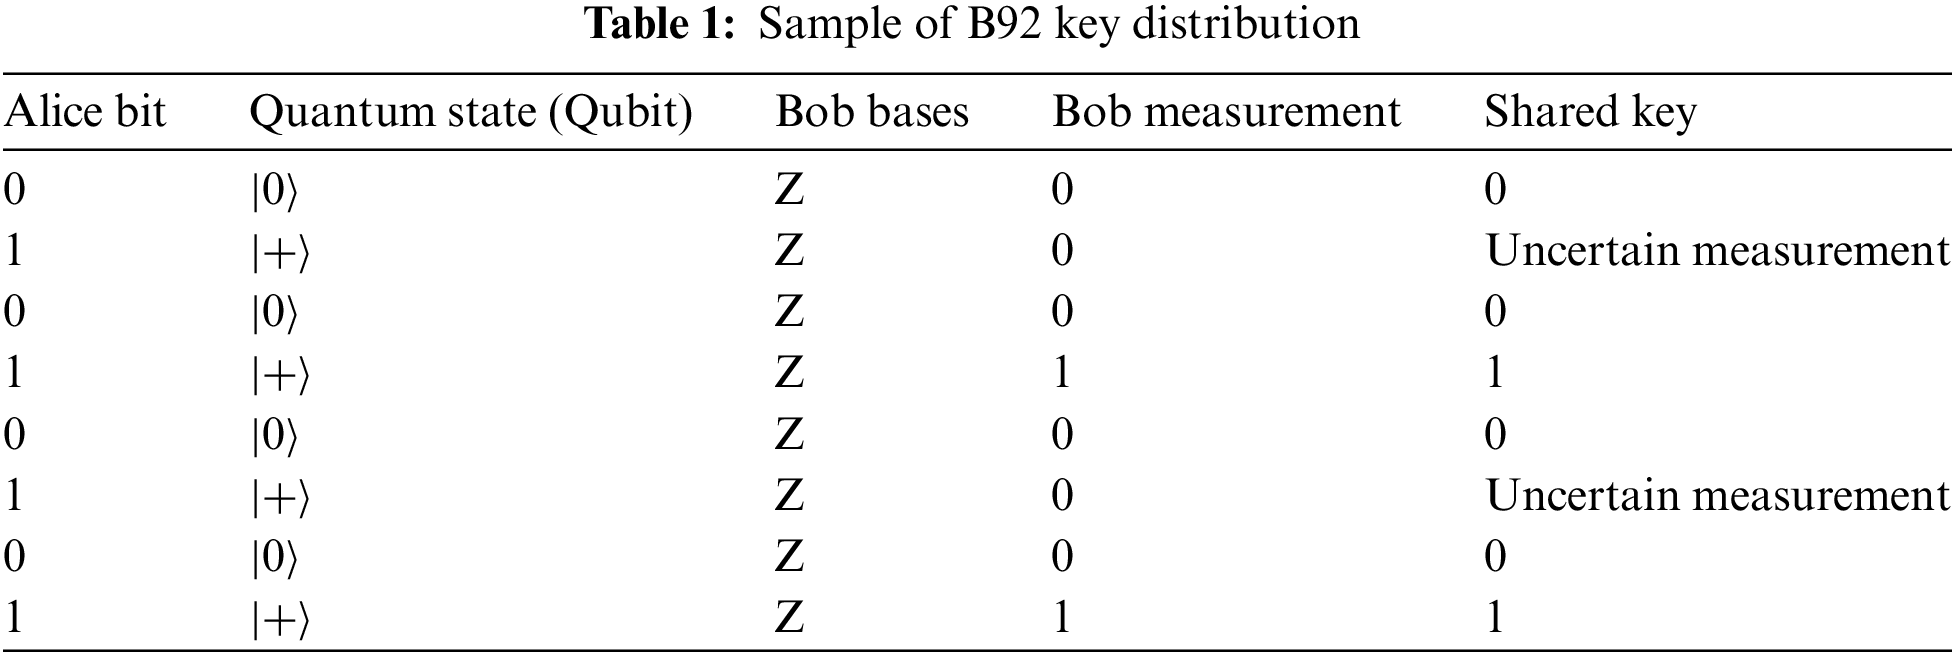
Since the overlap between two non-orthogonal states is non-zero, Eve’s interference causes errors that can be detected by Bob, which directly increases the security of the protocol, as measured by the Quantum Bit Error Rate (QBER). QBER is a metric that measures the error rate in key exchange between Alice and Bob. QBER is the ratio of the number of bits incorrectly measured by Bob to the total bits sent by Alice and received by Bob. QBER can be calculated by Eq. (2). Meanwhile, an example of sending key qubits in the B92 protocol is presented in Table 1.
where
Based on Table 1, the length of the shared key is reduced from 8 bits to 6 bits or reduced to about 75% of all bits sent. This is a normal shared key length and corresponds to a probability of about 50% of Bob’s measurement for the state ∣+⟩, which causes some bits to be discarded due to uncertainty [33]. Furthermore, the QBER value is
Galois Field (GF) is a finite set of numbers used in various cryptographic applications, including symmetric and asymmetric encryption. GF(2n) is the most commonly used type of Galois Field, where the values in the field are represented as binary polynomials with coefficients 0 or 1, and operations are performed modulo a particular polynomial. In GF(28), the field consists of 28 = 256 unique elements that can be represented by a byte (8 bits). Each element in GF(28) can be considered as a polynomial of degree up to 7, with addition and multiplication operations performed in the domain of the binary polynomial, using XOR for addition and reduction modulo an irreducible polynomial for multiplication [34].
The addition operation in GF(28) is performed by a bitwise XOR operation between two elements, as seen in Eq. (3). The multiplication operation in GF(28) involves polynomial multiplication followed by reduction modulo, an irreducible polynomial. More details on the multiplication operation on GF(28) can be seen in Eq. (4).
where
1. Computational efficiency because it uses simple binary operations such as XOR and polynomial reduction.
2. High security because the strong mathematical structure helps spread the key entropy throughout the data block, making it difficult for attackers to predict or guess the encryption key.
3. The modular field structure allows implementation in various security systems without requiring major changes to the basic algorithm.
2.3 Logistic Map and Its Improvement
Logistic Map is one of the most frequently used simple chaotic systems in various applications, including cryptography. Bio-mathematician Pierre François Verhulst first introduced a Logistic Map to model nonlinear population growth. The basic Equation of a Logistic Map is presented in Eq. (5). While the logistic map bifurcation plot is presented in Fig. 1a.

Figure 1: Bifurcation diagram plot of (a) Logistic map; (b) Modified logistic map
where
Logistic Map is used in cryptography because it can generate sequences highly sensitive to small changes in initial conditions, which is a characteristic of chaotic systems. The pseudo-random sequences generated by Logistic Map iterations can be used as encryption keys or for scrambling data. The high sensitivity to small changes ensures that an attacker without the initial key information cannot accurately reconstruct the sequence, thus increasing the security of the encryption system. Although the basic Logistic Map already exhibits strong chaotic properties, some drawbacks, such as the limited size of the key space, have encouraged the development of new variants. Variants that have been developed include the modified Logistic Map using Eq. (6) [17,30], which is designed to increase the complexity of chaos and strengthen the security of encryption. The bifurcation plot of the modified logistic map is presented in Fig. 1b.
In addition, research also leads to developing chaotic systems with higher dimensions, such as combining logistic maps and sine maps into 2D Logistic-Adjusted-Sine Map (2D LASM) [18]. In this higher-dimensional system, the additional dimensions produce more complex dynamics, which makes the system less predictable and, therefore, safer to use in encryption scenarios. LASM modifies the basic Logistic Map by adding a sinusoidal function into the iteration, resulting in more complicated chaotic properties and enlarging the possible key space. This system has been used in various multimedia encryption applications because it generates unpredictable sequences efficiently.
In addition, hyperchaotic systems have also been developed as another form of more complex chaotic systems. Hyperchaotic systems have more than one positive LE, meaning that the system has much more complex dynamics than ordinary chaotic systems. The use of hyperchaotic systems is very effective in encryption applications because of its extreme sensitivity to initial conditions, which ensures that any slight disturbance to the system will result in a large change in the resulting sequence. This study proposes the H3LM method, which consists of three dynamically interrelated logistic map dimensions. The Eq. (7) represents a H3LM with interactions between three variables (
where
This system models a more complex interaction compared to the traditional 1D logistic map and can be used to simulate chaotic systems with interdependent variables. Using the values
where

Figure 2: LE plot of based on changes in the values of r, α, β, γ, step size, and simulation duration of H3LM

Figure 3: Plot of trajectory hyper 3D logistic map (H3LM)
Based on the results shown in Fig. 2, although the range of parameters used is relatively short, the H3LM system exhibits strong fluctuations in the LE values, which consistently remain positive. These LE values confirm that the system is in a chaotic state and provide better indications than previous logistic map methods. The system demonstrates a strong hyperchaotic nature, reinforced by the consistently positive LE values across various parameter variations, such as
This paper proposes a novel approach combining B92 protocol, Galois Field (GF(28)) operation, and Hyper 3D Logistic Map (H3LM) for secure image communication. B92 protocol is used for secure key exchange by utilizing non-orthogonal quantum states. After the key is shared, GF(28) operation is applied for efficient and secure data manipulation. Furthermore, H3LM is introduced into encryption to add chaos and complexity and strengthen security. The combination of quantum cryptography, modular arithmetic, and chaos theory aims to create an encryption system resilient to modern cryptographic attacks. The proposed method consists of three main stages (see Fig. 4), the first stage is shared key generation and security enhancement with GF, the second stage is seed generation, and the third stage is palintext encryption. We give each stage a different color. The proposed method consists of more detailed stages of the proposed method are presented as follows:

Figure 4: Illustration of proposed method
3.1 Stage 1-Generation of Shared Keys and Their Security
The B92 protocol is used to distribute quantum keys securely. In this protocol, Alice sends qubits in two arbitrary non-orthogonal states, namely ∣0⟩ and ∣+⟩. Bob measures these qubits using a single fixed basis (the Z basis). If the qubit received by Bob is ∣0⟩, the measurement result is always 0. On the other hand, if Bob receives the qubit ∣+⟩, the measurement result can be random, either 0 or 1, due to the superposition state. After the measurement is completed, Alice and Bob exchange information about the correctly measured qubits to form a shared key through a classical channel.
The key generated from the B92 protocol is divided into 16-bit blocks to ensure that it can be split into manageable segments for further processing. This division allows for each 16-bit block to be further broken down into 8-bit units, which are required for arithmetic operations within the Galois Field (GF(28)). The reason for choosing 16-bit blocks is that GF(28) operates on 8-bit elements, and dividing the key into 16-bit blocks ensures consistency and efficient processing. Each 8-bit part can then be processed using simple XOR and polynomial reduction operations, providing both computational efficiency and security.
If the key length is not a multiple of 16 bits, any remaining bits that do not fit into the 16-bit structure are discarded to maintain consistency during encryption. GF(28) is widely used in cryptographic applications because of its ideal balance between efficiency and complexity—allowing for fast computation while still providing sufficient security. The use of 16-bit blocks allows for better diffusion, ensuring that changes in one part of the key spread across the entire key during encryption, which strengthens the encryption by introducing more entropy.
Once divided, each 8-bit block from the first part of the 16-bit block is multiplied by the corresponding 8-bit block from the second part using the irreducible polynomial
3.2 Stage 2-Initial Seed Generation
At this stage, the result from the GF(28) operation is converted into a binary representation before being further processed with the SHA-512 hash algorithm. The hashing algorithm produces a long and random value, which is then transformed into a numerical data type to be used as input for H3LM. These steps are summarized as follows:
1. The result from GF(28) is first converted into a binary form to be further processed by the hashing algorithm.
2. The binary blocks are then hashed using SHA-512 to generate a new random key (
3. The image to be encrypted is read and similarly hashed with SHA-512, producing another random key (
4. Based on both
Standard deviation helps aggregate multiple numeric values from
3.3 Stage 3-Hyper 3D Logistic Map Image Encryption
At this stage, the image encryption process uses three sequences generated by the H3LM. These sequences are used to permute and substitute pixel and bit levels to produce strong confusion and diffusion effects in the image [40]. The encryption steps can be explained in detail as follows:
1. The parameters used in H3LM are
2. The original image (plain image) is transformed from a two-dimensional (2D) form into a one-dimensional (1D) form to facilitate the encryption process. The number of pixels in the image is calculated to ensure the chaotic sequence generated matches the size of the image data.
3. After generating the chaotic sequences, these sequences are trimmed to match the number of pixels in the image. Then, the chaotic sequences
4. Pixel permutation is performed based on the chaotic sequence
5. The next step involves substituting the bits of
6. The final encryption step involves performing pixel substitution with
7. The decryption process reverses the encryption steps. The first step is to apply desubstitution using the inverted Vigenère algorithm as shown in Eq. (15), followed by XOR desubstitution with
Implementing the proposed method above uses Python language and a Qiskit simulator to run the B92 quantum protocol. Furthermore, the encryption process is tested using several standard images that can be downloaded [41]. The images used have dimensions of 512 × 512 × 3 and 256 × 256 × 3. Then, the images are also converted to grayscale format with Eq. (16), so that testing is carried out on RGB and grayscale images. Several images used in testing are presented in Fig. 5.

Figure 5: Sample images used in this study (a) Baboon color (512 × 512 × 3); (b) Peppers color (512 × 512 × 3); (c) Airplane color (512 × 512 × 3); (d) House color (256 × 256 × 3); (e) Baboon grayscale (512 × 512); (f) Peppers grayscale (512 × 512); (g) Airplane grayscale (512 × 512); (h) House grayscale (256 × 256); (i) Fishing boat (512 × 512)
where
In the shared key generation process using the B92 protocol, Alice uses 512 random bits, which are then converted into qubits and entered into the B92 protocol to distribute the key. The entire process follows the theory outlined in Section 2.1. As shown in Fig. 6, the experimental results indicate that a shared key of 388 bits is generated with a QBER of 0.2421875. Approximately 25% of QBER is due to inherent measurement uncertainty, consistent with the B92 protocol. Based on 100 experimental trials, the average QBER was 0.25016, with a standard deviation of 0.0227. The average shared key length across trials was 383.9861 bits, with a standard deviation of 8.8462 bits. These results demonstrate that the B92 protocol performs reliably in a noise-free environment, as the simulations were conducted using the Qiskit simulator via Google Collab. Importantly, the 25% QBER represents the portion of key bits discarded because of the nature of the B92 protocol, not due to transmission errors. The remaining portion of the shared key is error-free, thus eliminating the need for additional error-correction mechanisms and ensuring secure communication.

Figure 6: Sample output of shared key generation using B92 quantum protocol
Next, the shared key produced by the B92 quantum protocol is processed through GF(28) and the SHA-512 hashing to generate the initial seed for the H3LM, as explained in Section 3.2. Control parameters for H3LM include

Figure 7: Sample encryption results and its histogram (a) Original image; (b) Original histogram; (c) Encrypted image; (d) Encrypted image histogram
Next, the results of the proposed method are presented and analyzed. The encryption process was tested on standard images, and several metrics were employed to evaluate the effectiveness of the encryption method, including chi-square analysis, information entropy, differential analysis, correlation coefficient analysis, and robustness analysis. These evaluations measure the encryption approach’s security, sensitivity, and robustness.
4.1 Histogram and Chi-Square Analysis
The histogram serves to show the distribution of pixel intensity values. For a secure encrypted image, the histogram should approach a uniform distribution [37], and it can be seen in the sample results in Fig. 6d that the histogram distribution visually appears uniform and changes significantly compared to the original histogram. The main purpose of the Chi-square (
where
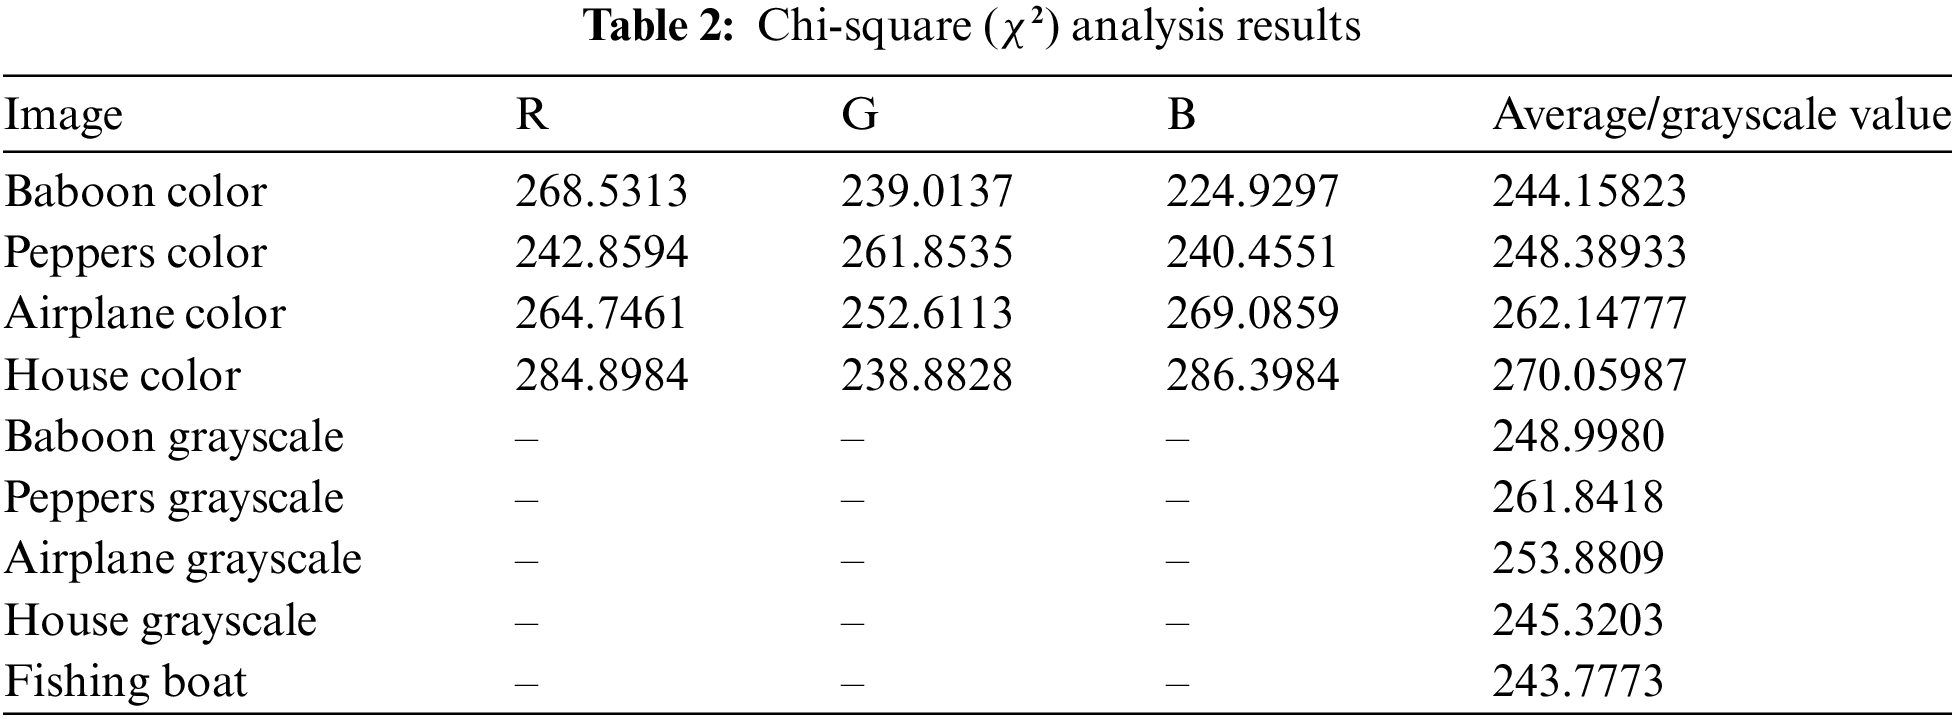
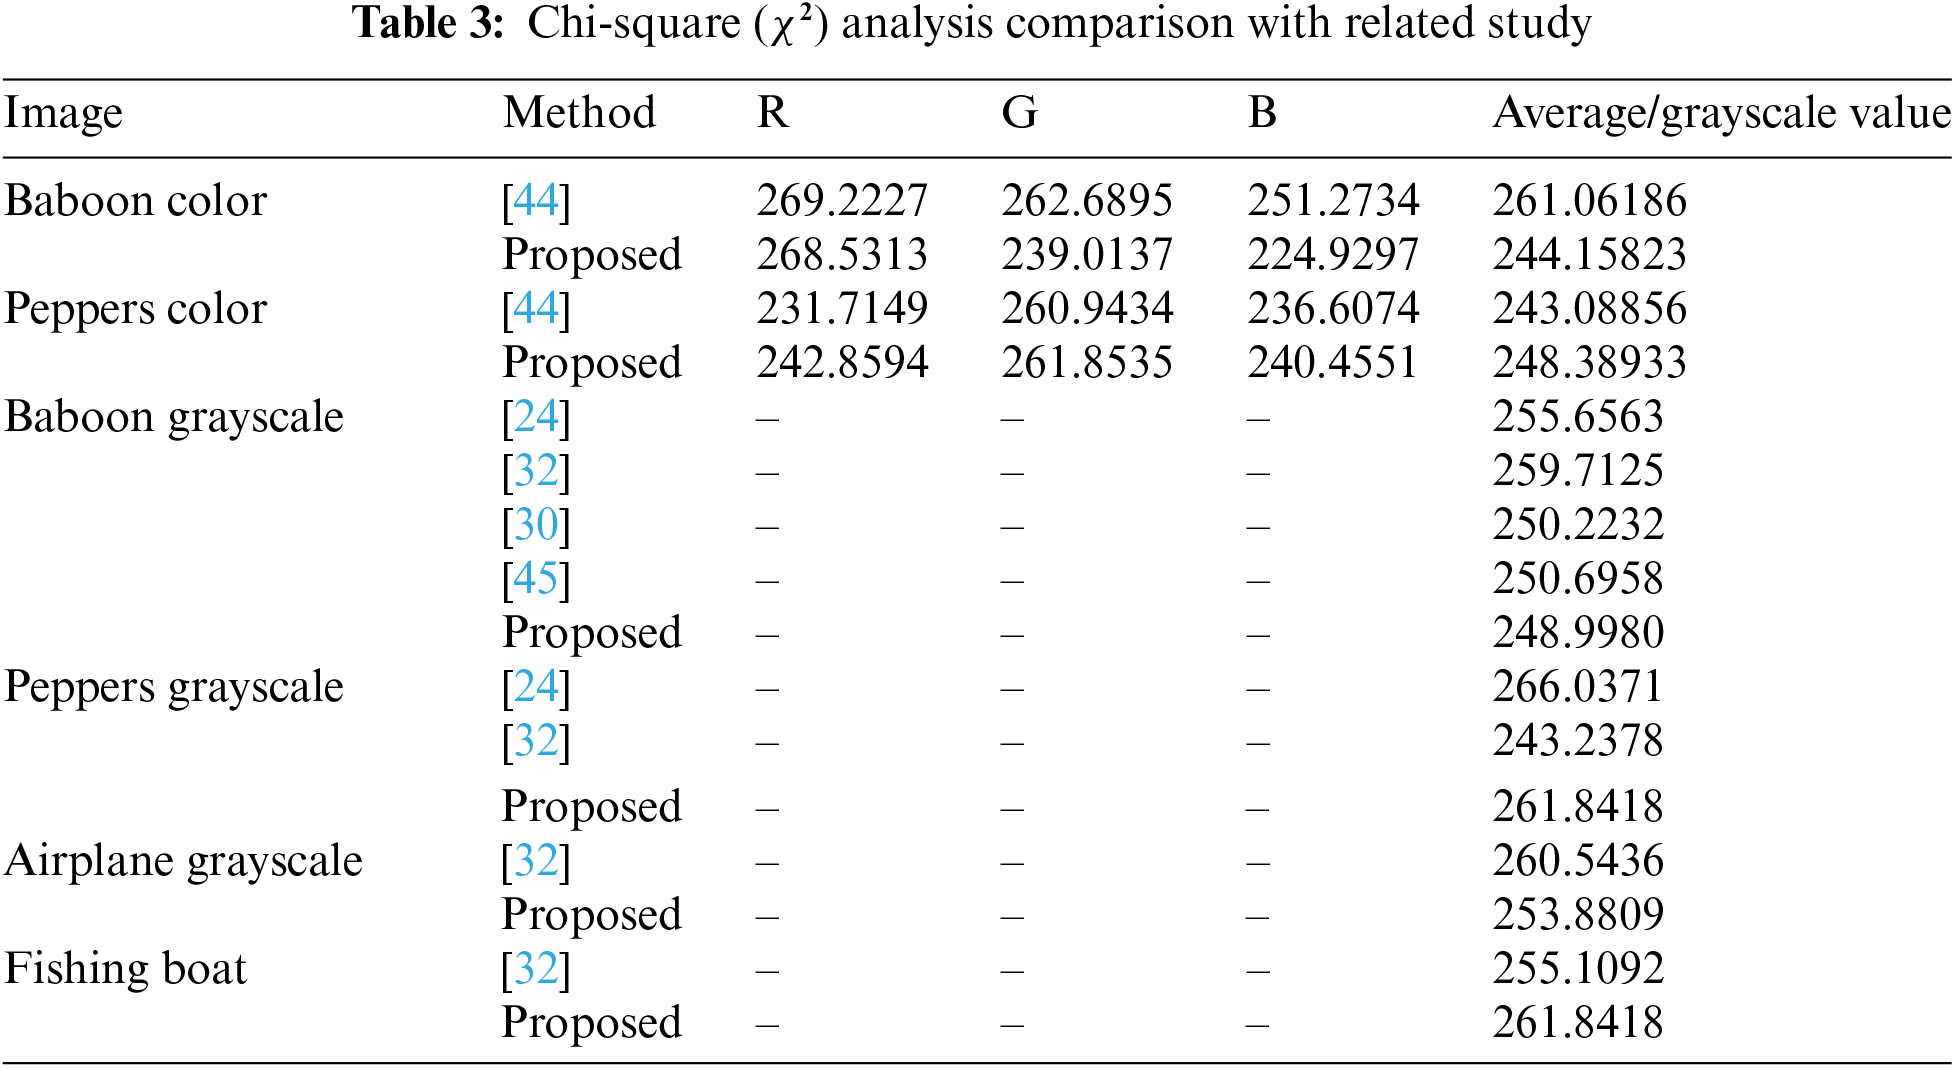
Based on the results of the Chi-square analysis presented in Table 2, it can be seen that the proposed method produces a pixel value distribution that is close to the ideal critical value of 293.24. The average Chi-square value for colored images such as “Baboon”, “Peppers”, “Airplane”, and “House” shows quite good results, with most images ranging from 240 to 270, indicating a relatively random pixel distribution. For example, the “House” image has an average value of 270.05987, close to the critical value, indicating that this encryption method effectively creates an even pixel distribution. Compared with other studies in Table 3, the proposed method generally shows competitive performance. For example, for the colored “Baboon” image, this method produces an average Chi-square value of 244.15823, lower than the method from Reference [44], which reaches 261.06186. This can indicate that the proposed method produces a more random and uniform pixel distribution. On the other hand, some images like “Peppers” show better value enhancement with the proposed method compared to some other references.
4.2 Information Entropy Analysis
In image encryption, information entropy measures the degree of uncertainty or randomness within an encrypted image. The primary purpose of entropy analysis in image encryption is to ensure that the encryption algorithm produces an indistinguishable image from random noise. When the entropy value is close to the theoretical maximum (8 bits for an 8-bit grayscale image), each pixel in the image has an equal probability of being any value between 0 and 255. This level of randomness makes it extremely challenging for an attacker to infer any patterns or information from the encrypted image, thereby enhancing security. Shannon’s formula for entropy is typically applied in the analysis of encryption strength. It is expressed as Eq. (18).
where
In the case of color images, each color channel (red, green, blue) is treated individually for entropy analysis, with each channel having its own entropy calculation. For example, a 24-bit color image would ideally have 8 bits of entropy per channel, resulting in a total entropy of 24 bits. Result of
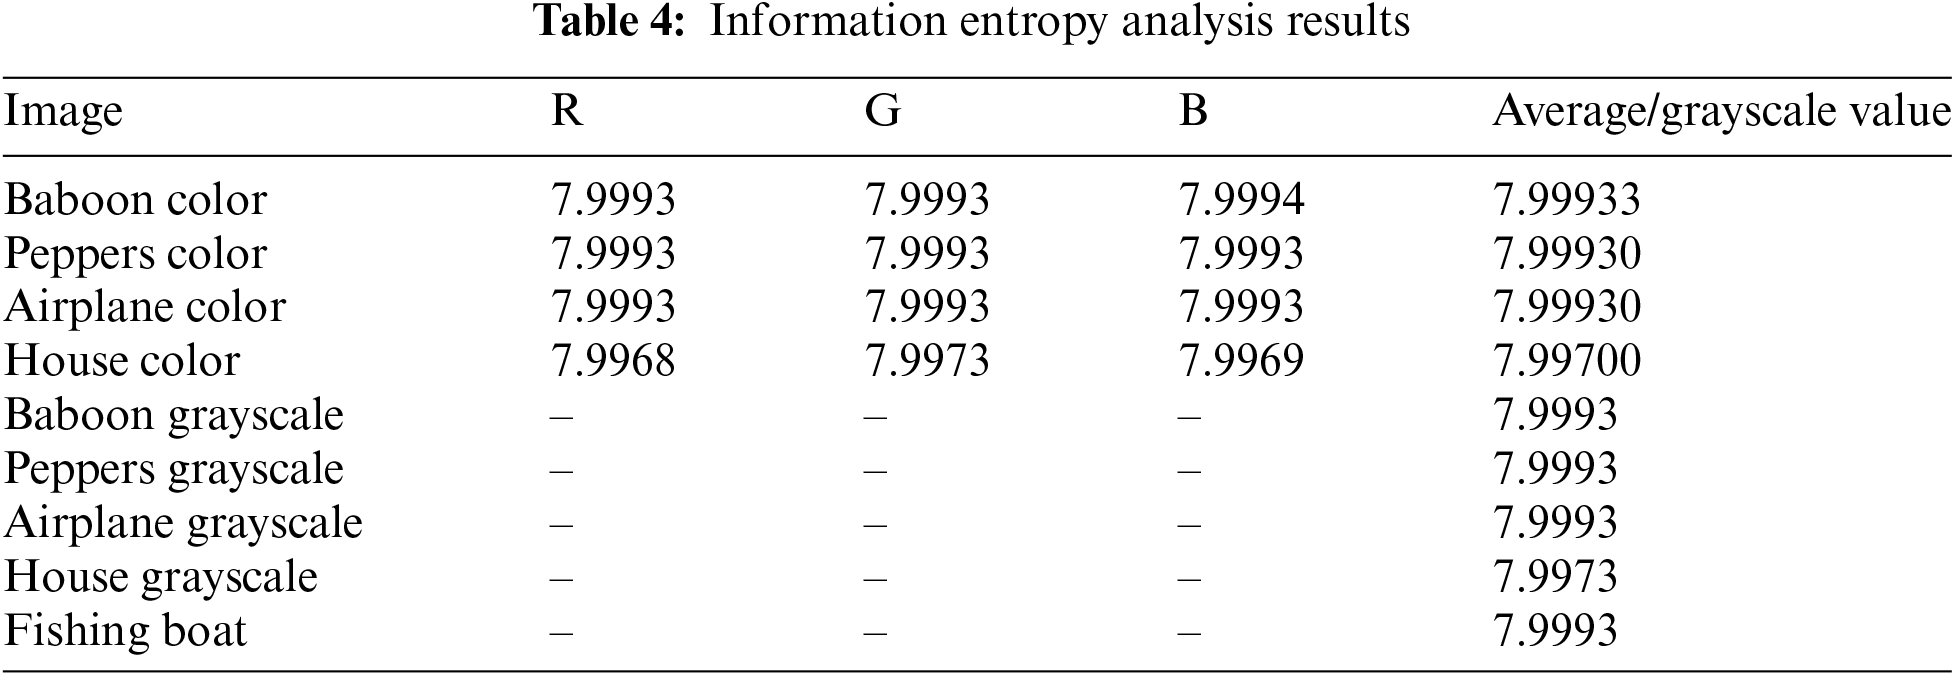
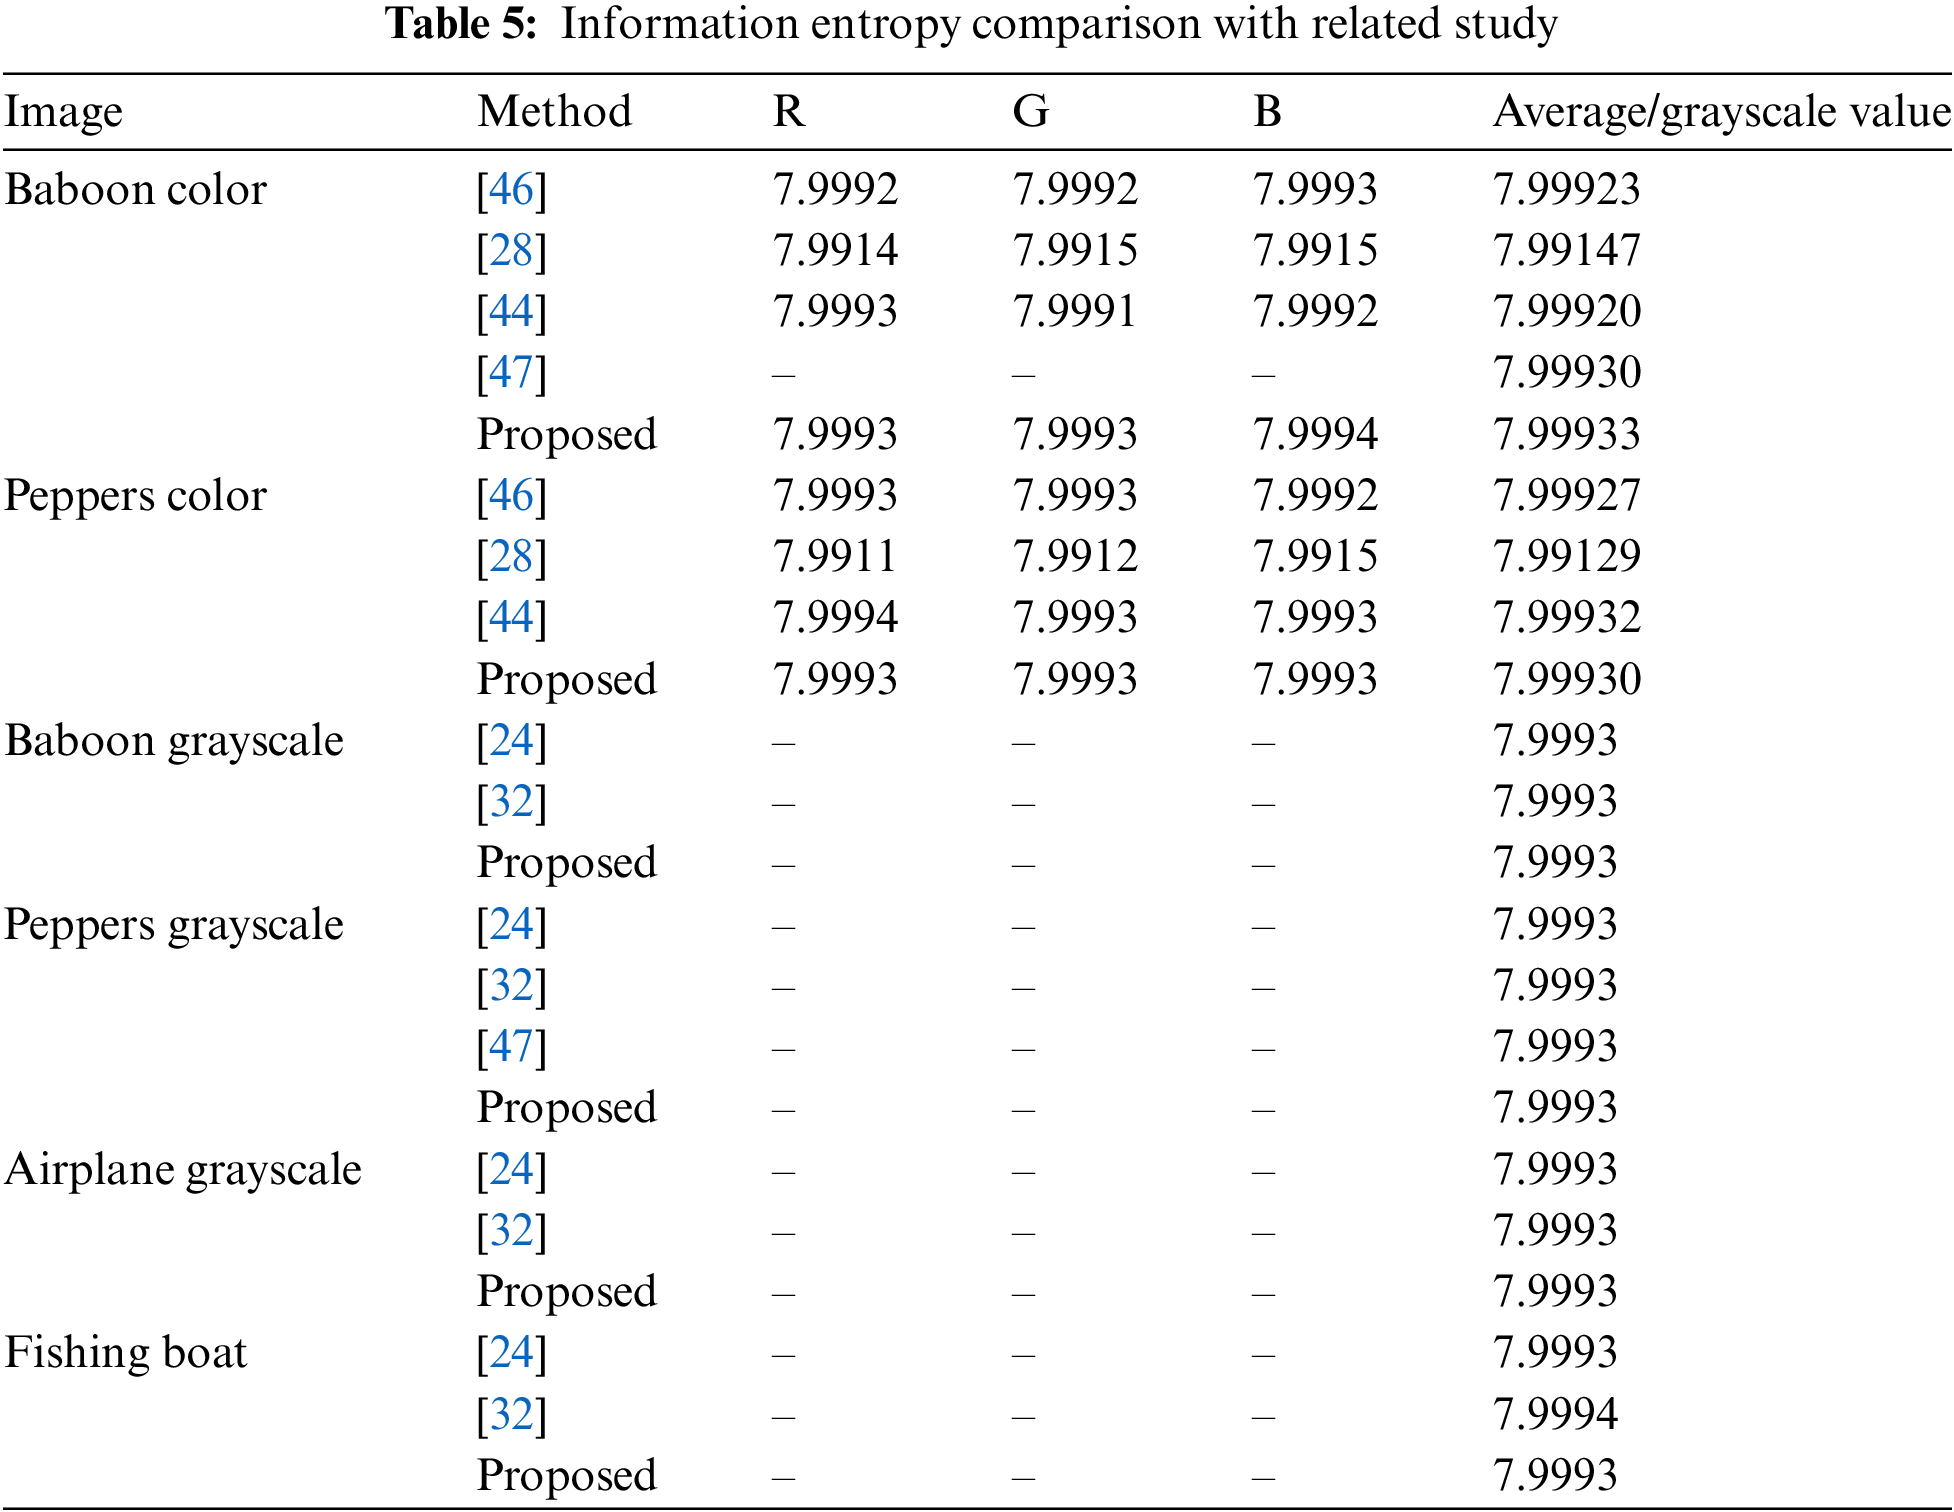
Based on the results of the information entropy analysis presented in Table 4, it can be seen that the entropy value for each image is close to the maximum theoretical value of 8, indicating a high level of randomness in the encrypted image. For colored images such as “Baboon” and “Peppers,” the entropy values range from 7.9993 to 7.9994, which is close to the maximum value, indicating that the encryption algorithm produces a very random and unpredictable pixel value distribution. This is a sign of strong and secure encryption. Compared with other studies presented in Table 5, the proposed method shows comparable or better performance. For example, for the colored image “Baboon”, the proposed method produces an entropy value of 7.99933, slightly higher than the method from Reference [46], which produces 7.99923. This improvement, although small, shows the superiority of the proposed method in creating better randomness in the pixel distribution. In addition, for grayscale images, the proposed method also produces values consistent with those produced by other studies, such as 7.9993 for the grayscale “Baboon” image.
In the context of image encryption, differential analysis measures the sensitivity of an encryption algorithm to small changes in the input, typically by examining how much difference in the encrypted image is caused by a minor modification in the plaintext. Differential analysis aims to ensure that even a slight change in the input image (e.g., a single pixel or bit) results in a significantly different encrypted image, thereby making the encryption resistant to attacks that exploit structural similarities between the original and encrypted images.
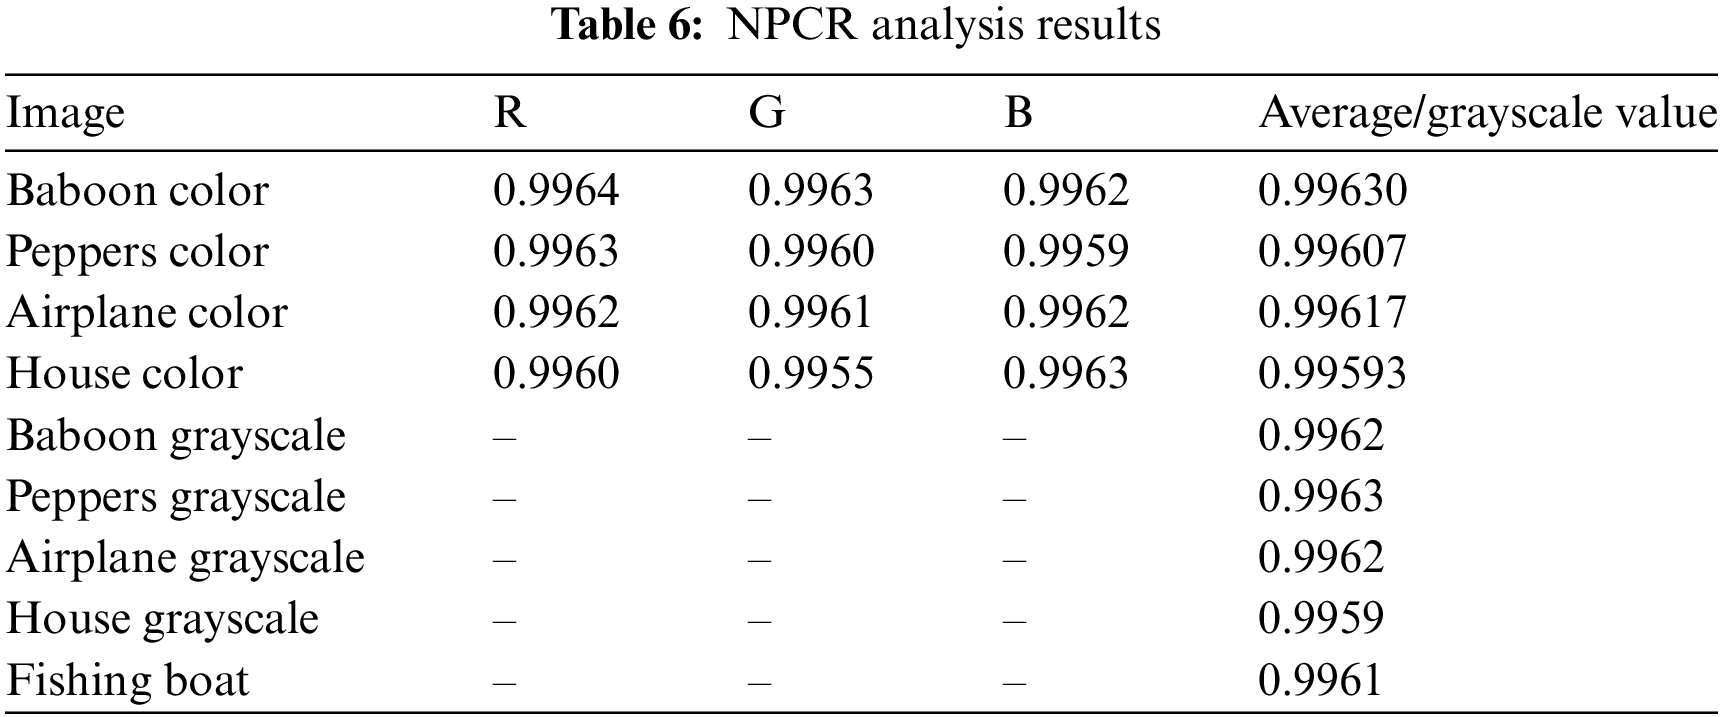
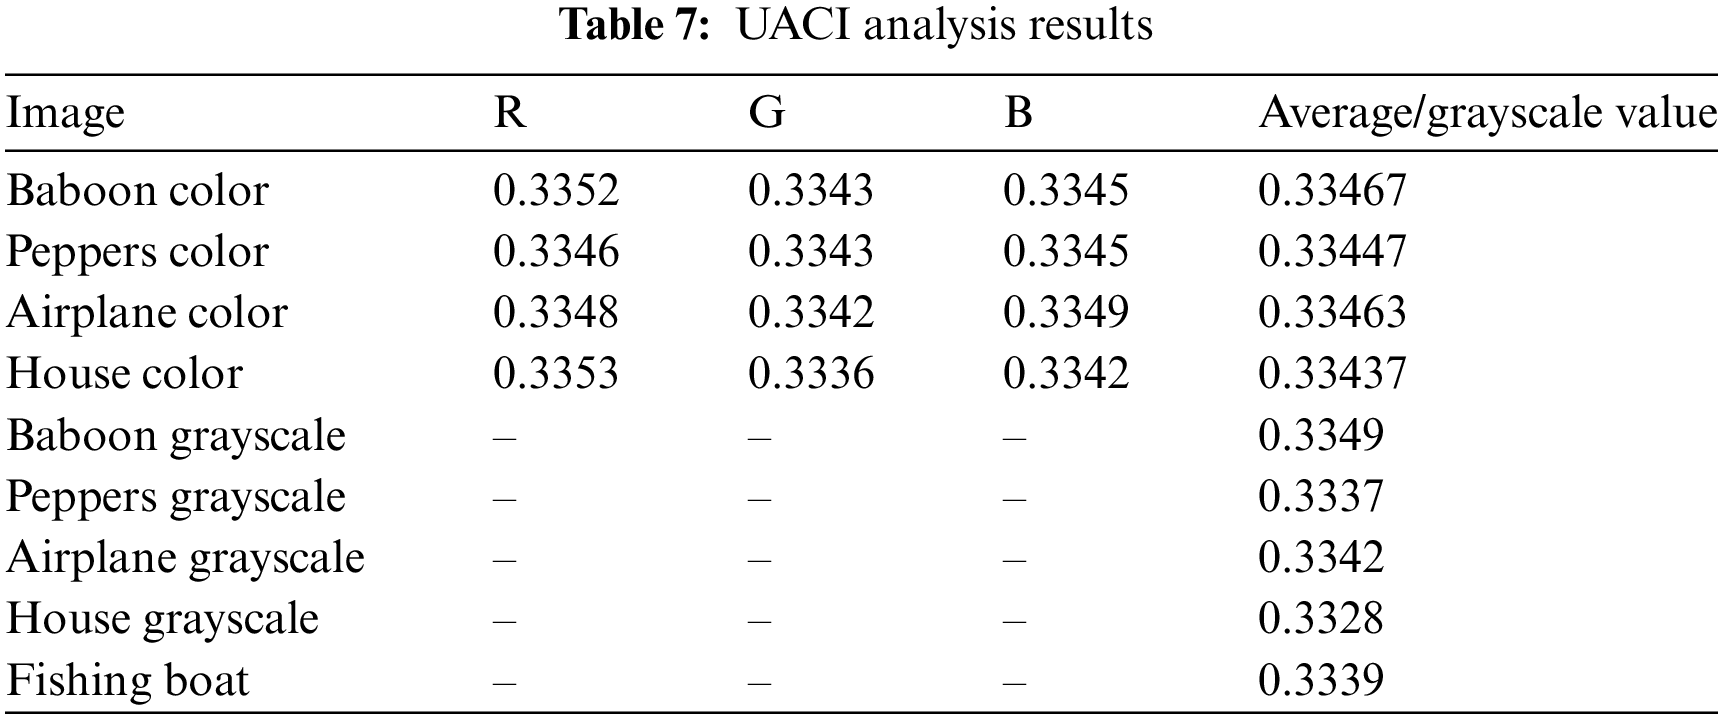
The Number of Pixels Change Rate (NPCR) and the Unified Average Changing Intensity (UACI) are two primary metrics used in differential analysis. These metrics quantify the extent of change between two encrypted images generated from slightly different inputs. NPCR calculates the percentage of different pixel values between two encrypted images. Given two encrypted images (
where
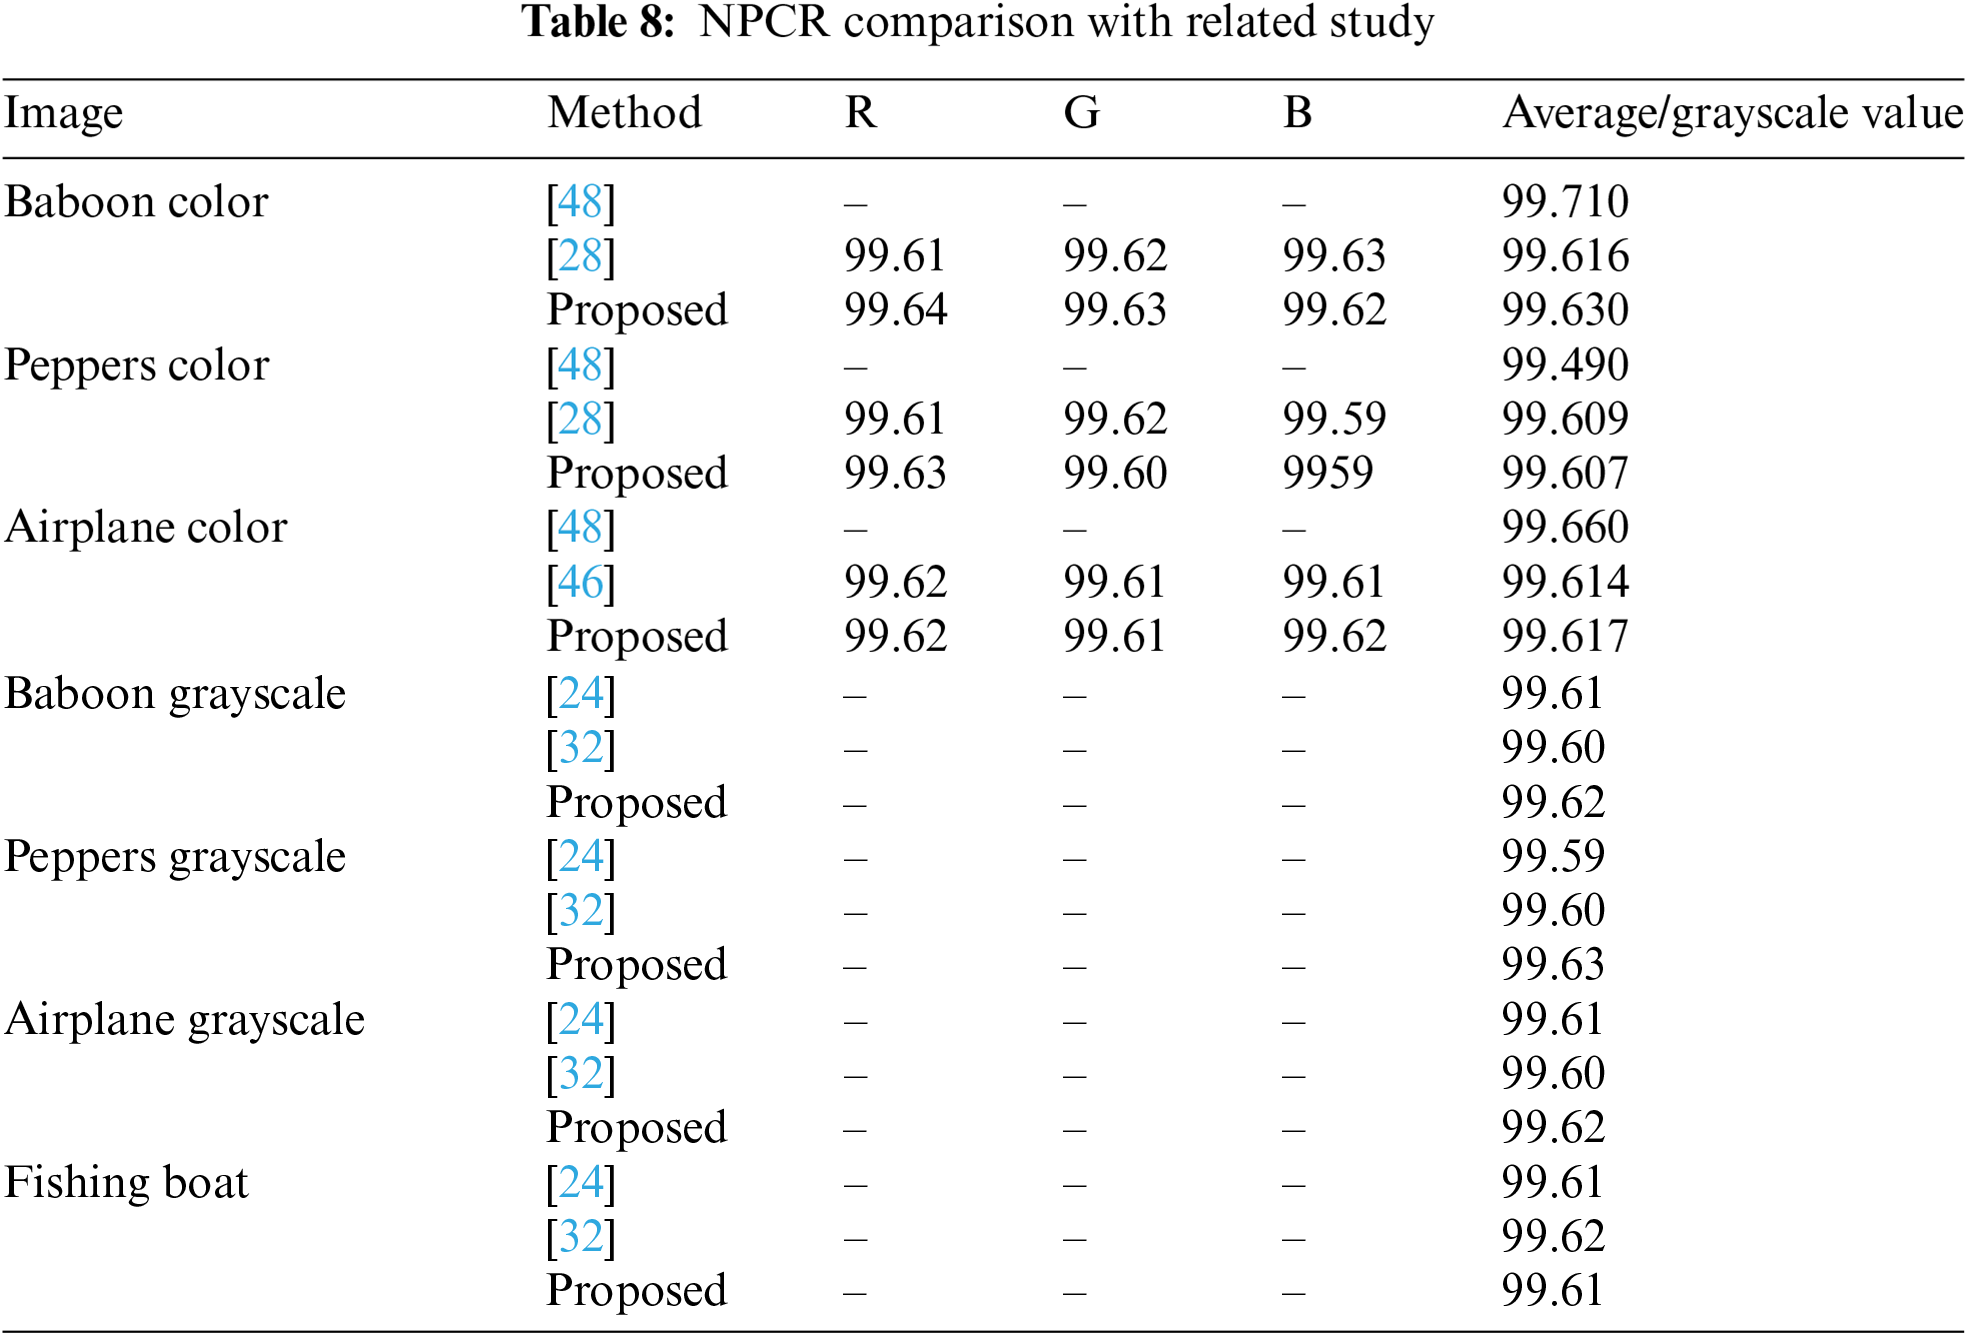
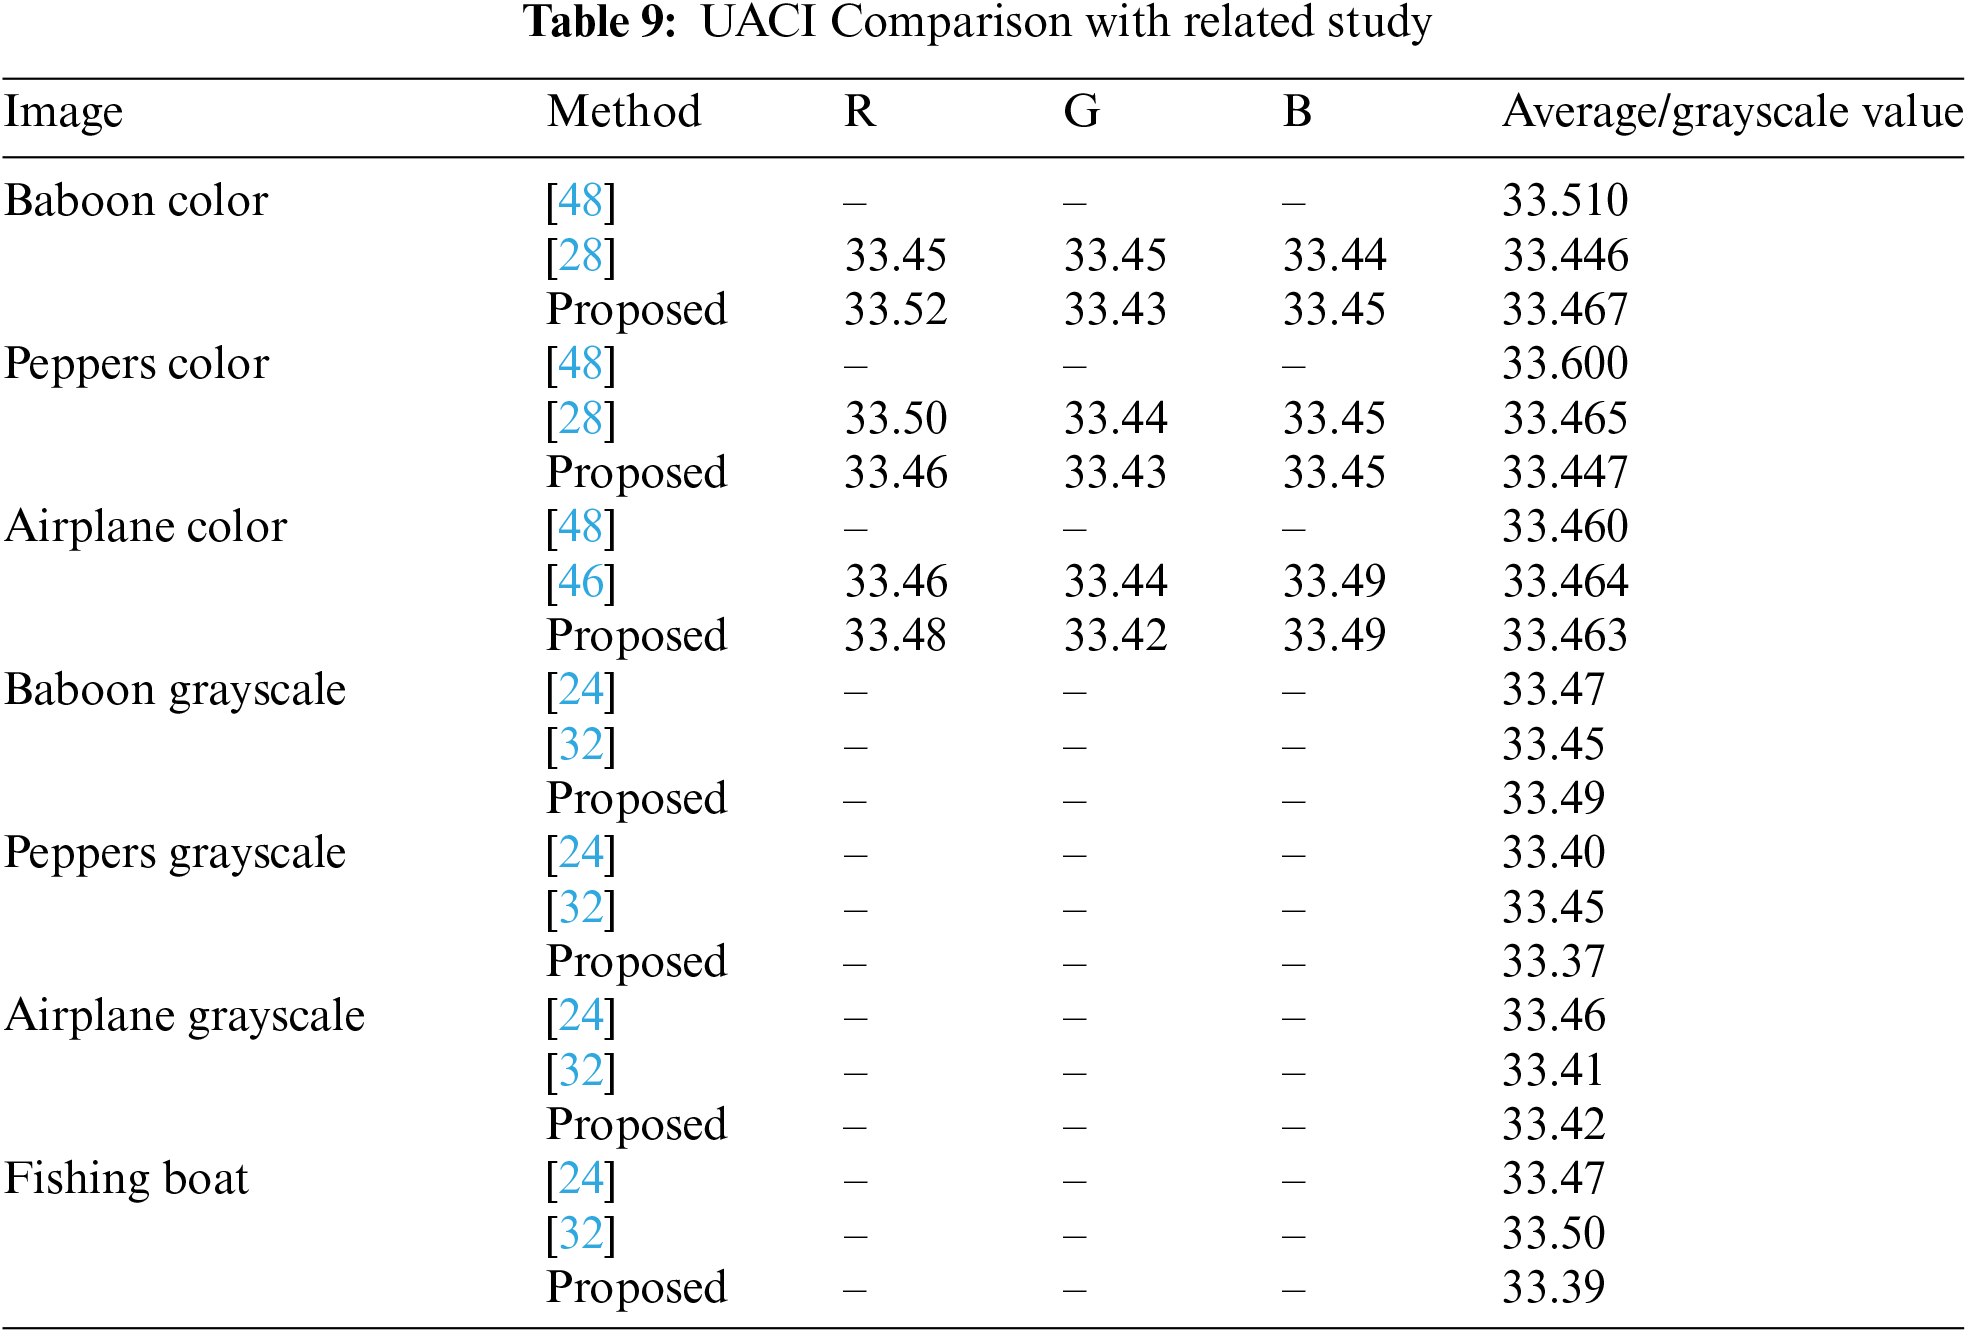
The differential analysis results in Tables 6–9 show that the proposed encryption method performs very well in the face of small changes in the input image. For the NPCR metric, the values obtained for various color and grayscale images are close to ideal, namely 99.64% to 99.61%, as seen in the “Baboon” and “Peppers” images (Table 6). This value indicates that almost all pixels in the encrypted image change when there is a slight change in the original image. This strongly indicates that this encryption algorithm is susceptible to small changes in the input, making it resistant to differential attacks. Compared with other studies in Table 7, the proposed method produces very competitive NPCR values. For example, for the “Baboon” image, the proposed method achieves 99.63%, which is higher than the method from Reference [28] which produces a value of 99.61%. This indicates that the proposed encryption algorithm provides better protection against attempts to predict or discover patterns from the original image through differential analysis. For UACI, the values generated by the proposed method are also very close to the ideal value of 33%, as seen in the “Baboon” and “Peppers” images with values ranging from 33.46% to 33.52% (Table 8). This indicates that the average intensity difference between pixels in the encrypted images is very significant, strengthening encryption security. Comparison with other studies presented in Table 9 also shows that the performance of the proposed method is very good. For example, in the colored “Baboon” image, the proposed method achieves a UACI value of 33.467%, which is slightly higher than some previous studies. Overall, these results indicate that the proposed encryption algorithm can produce significant changes in the encrypted images and shows competitive and acceptable performance in the context of image security.
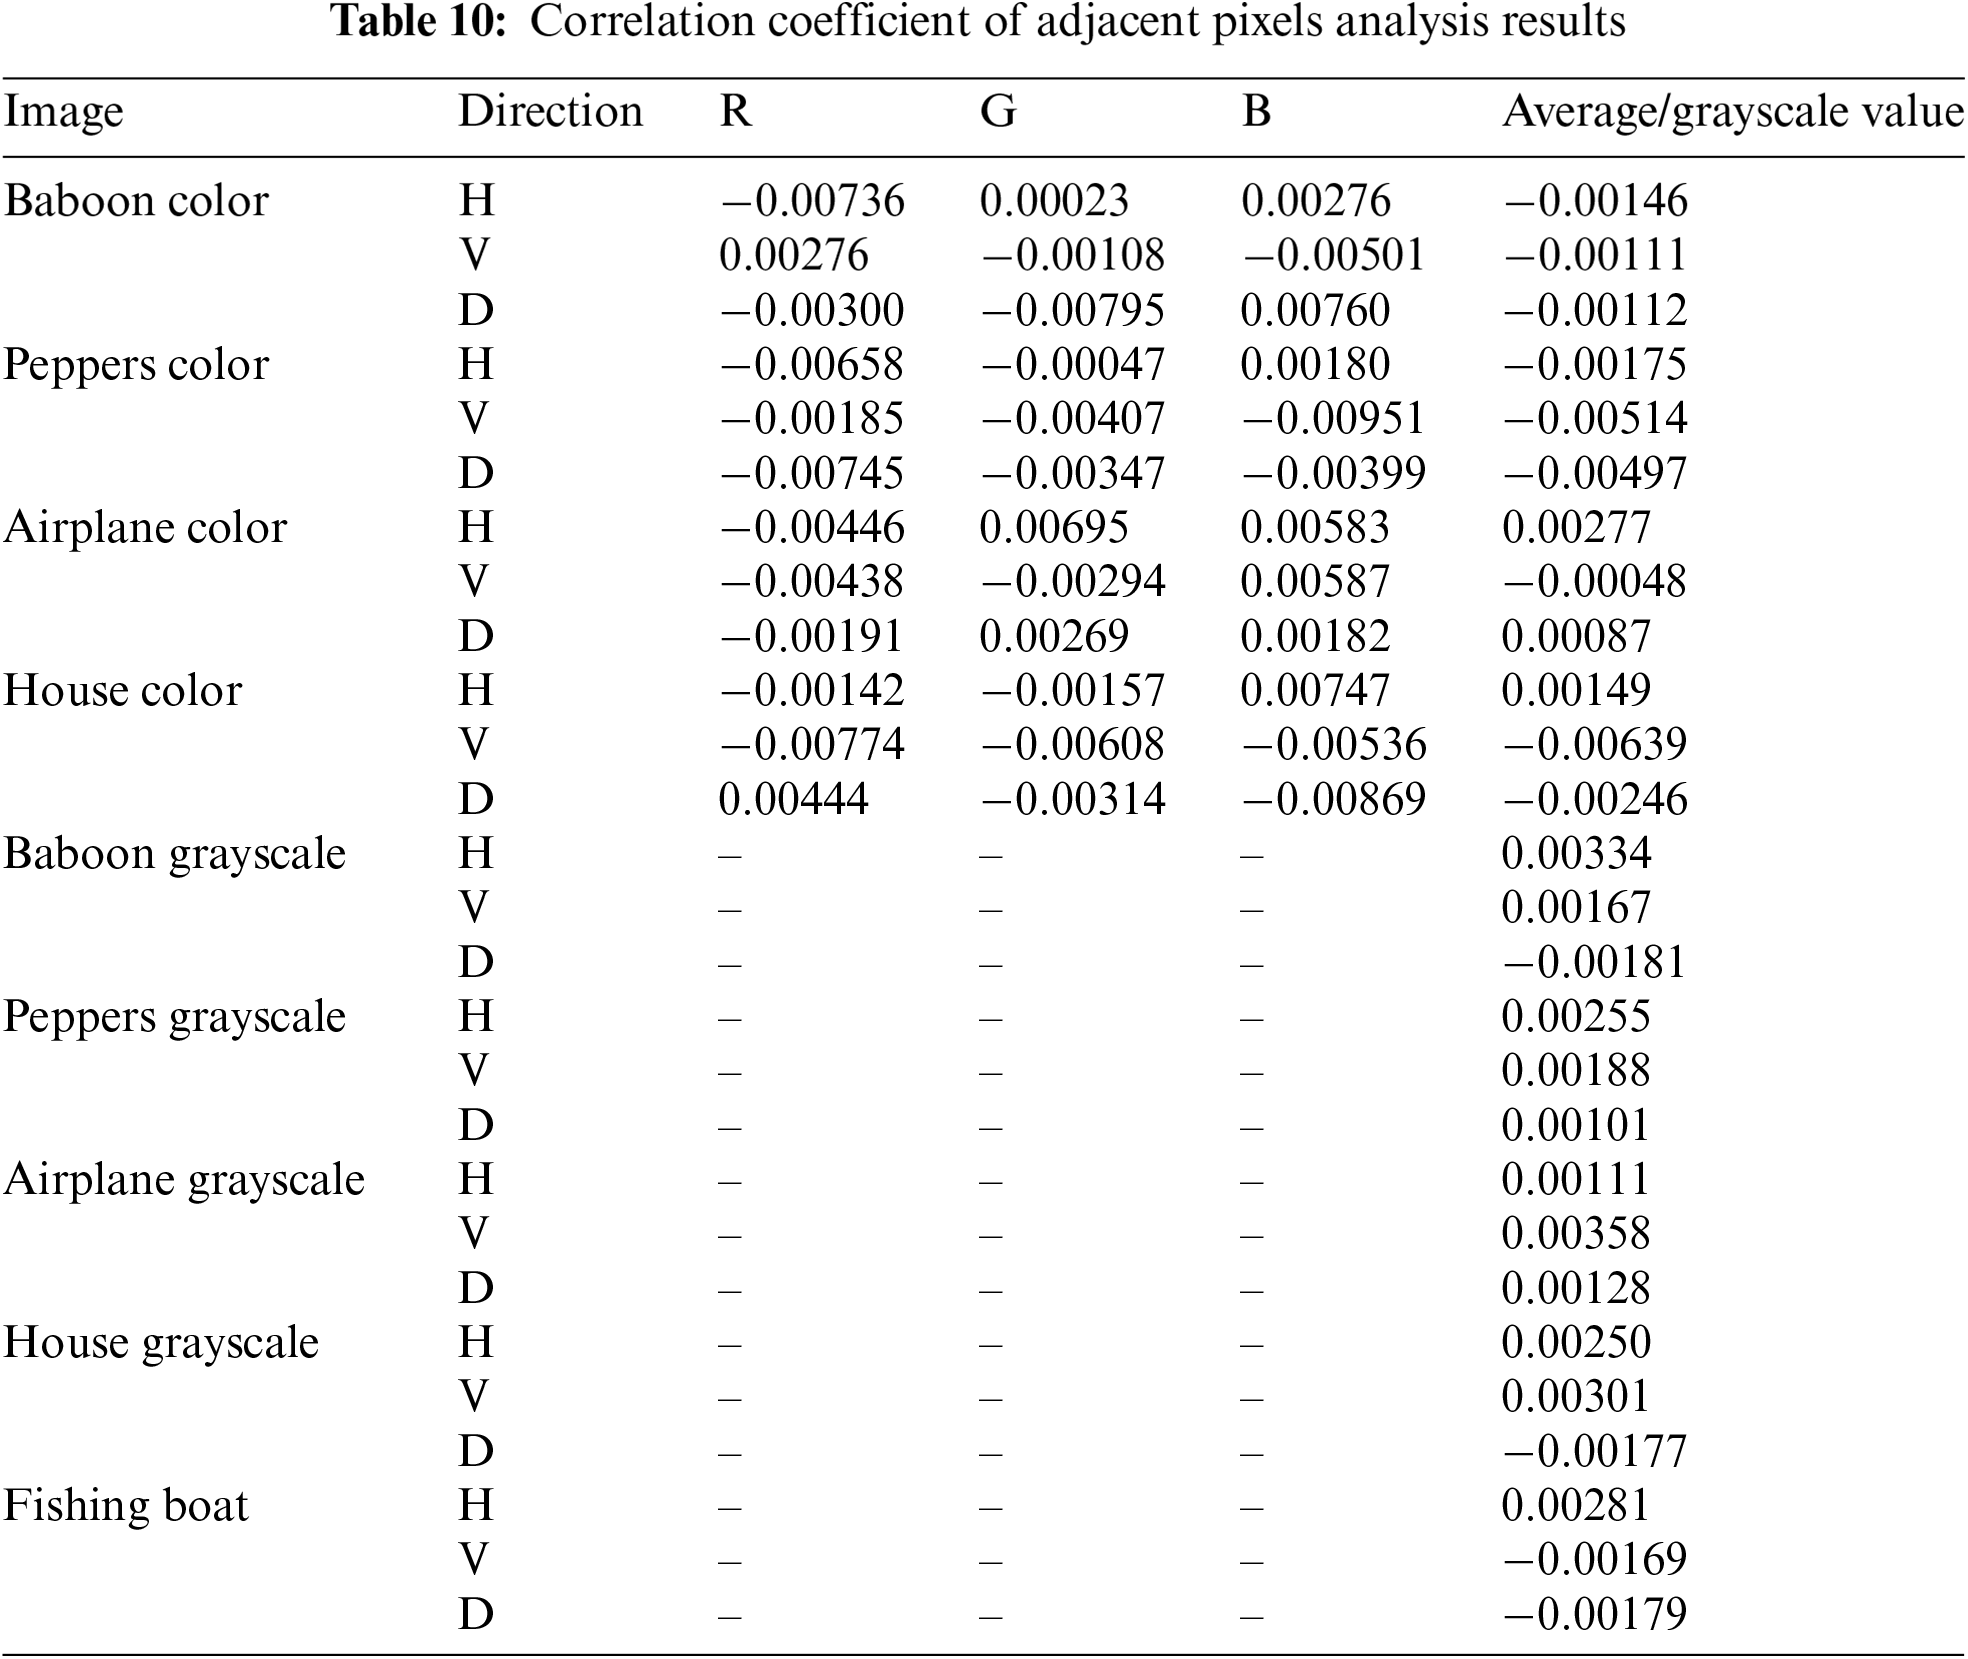
4.4 Correlation Coefficient Analysis
The Correlation Coefficient (
where
The
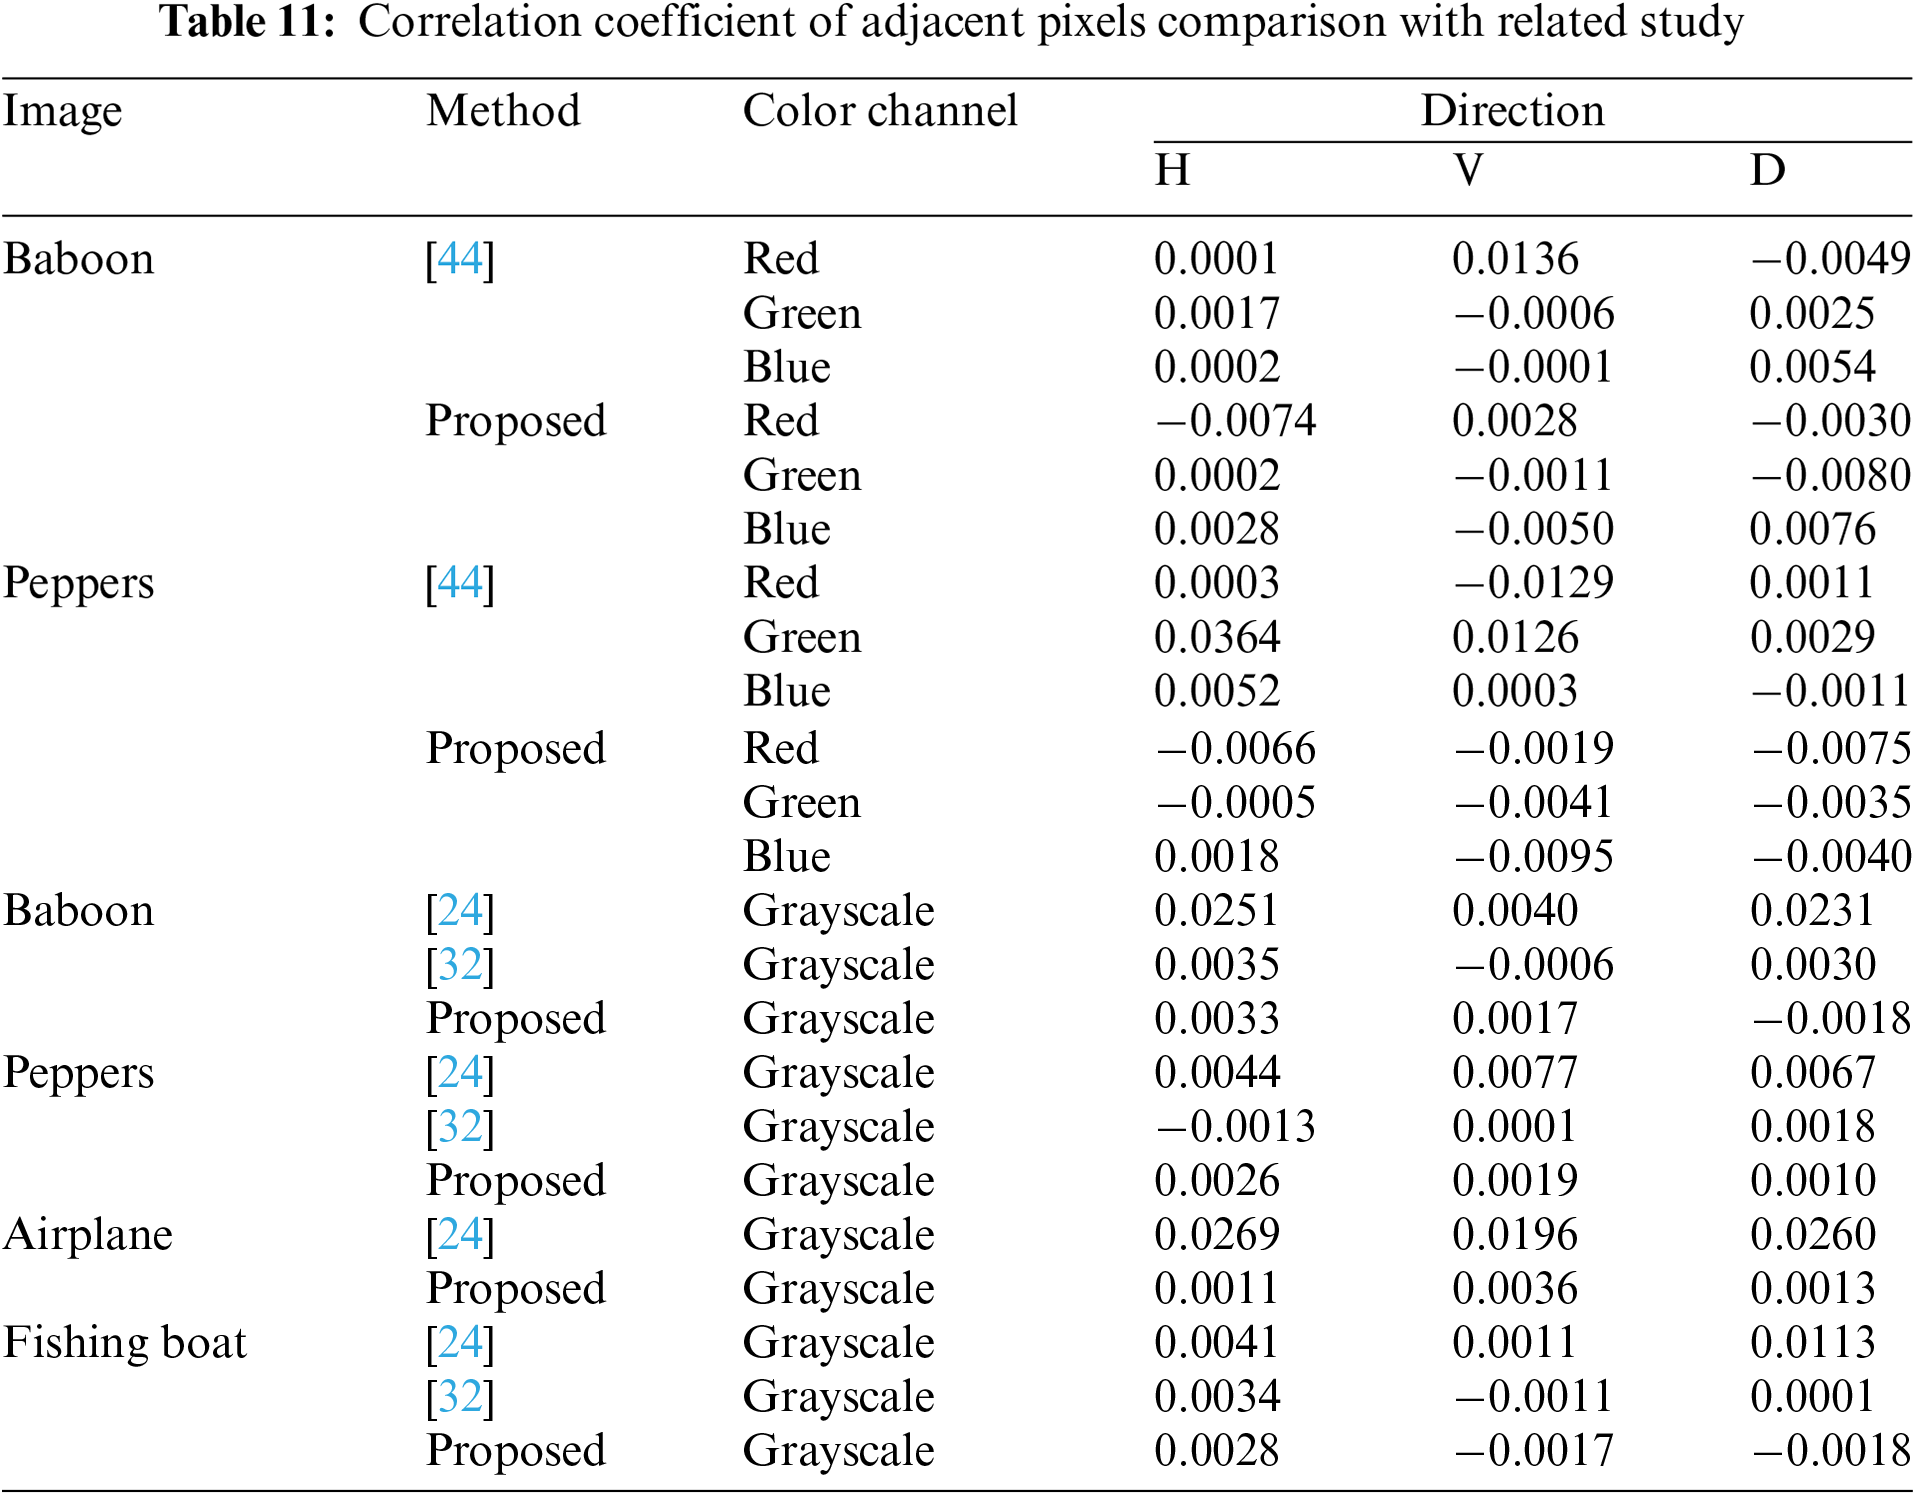
Comparison with other studies in Table 11 shows that the proposed method is superior or comparable to related studies. For example, for the colored “Peppers” image, the proposed method produces a correlation of −0.0066 in the horizontal direction for the red color channel, which is lower than the method from Reference [44], which produces a value of 0.0003. This confirms that the proposed algorithm can better break the correlation between pixels, thereby improving the level of encryption security. For grayscale images, the proposed results also show good performance. For example, in the grayscale “Baboon” image, the proposed method produces a correlation value of −0.0018 in the diagonal direction, lower than the Reference [24], achieving a correlation value of 0.0251. This indicates that the proposed method is more effective in removing the relationship between neighboring pixels in grayscale images.
Key Sensitivity Analysis measures how small changes to the encryption key affect the encrypted output, ensuring that a minimal change to the key will significantly change the encrypted data. This sensitivity is important to the security of an encryption system, as it ensures that an attacker cannot gain meaningful information by attempting to change the key by a small amount. In sensitivity testing, specifically decryption, the goal is to decrypt an encrypted image using a slightly changed key. The expectation is that the decryption process will fail entirely if the wrong key is used, and the resulting decrypted image will appear as random noise, emphasizing the dependence on the correct key for successful decryption. A sample of key sensitivity testing results is shown in Fig. 8.

Figure 8: Sample key sensitivity analysis test (a) Original image; (b) Encrypted image; (c) Decrypted image with correct key; (d) Decrypted image with 1-bit difference in key
Based on the Key Sensitivity Analysis results presented in Fig. 8, it can be seen that the proposed encryption method has excellent key sensitivity. The original image (Fig. 8a) is transformed into an encrypted image (Fig. 8b), which visually looks like random noise. The original image can be perfectly recovered when the correct key is used for decryption (Fig. 8c). However, when the key used differs by only 1 bit (Fig. 8d), the decryption result becomes random noise, indicating that this method is very sensitive to small changes in the key. These results indicate that the proposed encryption algorithm strongly depends on the correct key because even a small 1-bit change in the key results in a complete failure in the decryption process. This ensures the encryption system is highly secure because attacks based on small key changes will not succeed.
Robustness Analysis is an important assessment to evaluate the strength and reliability of image encryption algorithms, especially when facing common perturbations such as noise or compression. This analysis aims to determine how well the encryption system maintains the integrity of the encrypted data, ensuring that minor perturbations during transmission or storage do not compromise the decryption process. The Robustness Analysis process typically involves applying various types of noise, such as Gaussian noise, salt-and-pepper noise, JPEG compression or crop attacks, to the encrypted image. These perturbations simulate real-world scenarios, such as transmission errors or image compression, common in communication and storage systems. After applying the perturbations, the algorithm’s resilience is evaluated by attempting to decrypt the corrupted image. Ideally, the decryption process should still produce the original image with minimal loss of information, indicating the system’s resilience. Fig. 8 shows several experimental results of image decryption after an attack on the encrypted image.
Based on the Robustness Analysis in Fig. 9, the proposed encryption method is resilient to noise, cropping, and JPEG compression disturbances. In the test with salt-and-pepper noise of 0.05 (Fig. 9a) and Gaussian noise of 0.05 (Fig. 9c), the decrypted images (Fig. 9b,d) can still be recovered well. However, there are some acceptable artifact distortions. For the crop attack test with the size of 200 × 200 pixels (Fig. 9e) and 400 × 400 pixels (Fig. 9g), the decrypted images (Fig. 9f,h) still retain most of the visual information. However, the cropped part cannot be recovered, demonstrating resilience in partial data loss scenarios. In the JPEG compression test with a quality (Q) of 75 (Fig. 9i), the decrypted image (Fig. 9j) still displays quite good quality with little visual degradation. Overall, this method is robust against various disturbances, ensuring security and reliability in real-world situations involving noise, cropping, and compression.

Figure 9: Robustness analysis (a) Applied salt-and-pepper noise (0.05) to the encrypted image; (b) The decrypted image was obtained after applying salt-and-pepper noise (0.05) to the encrypted image; (c) Applied Gaussian noise (0.05) to the encrypted image; (d) The decrypted image was obtained after applying Gaussian noise (0.05) to the encrypted image; (e) Applied crop 200 × 200 to the encrypted image; (f) The decrypted image was obtained after applying crop 200 × 200 to the encrypted image; (g) Applied crop 400 × 400 to the encrypted image; (h) The decrypted image was obtained after applying crop 400 × 400 to the encrypted image; (i) Applied JPEG compression (Q = 75) to the encrypted image; (j) The decrypted image was obtained after applying JPEG compression (Q = 75) to the encrypted image
This paper presented a comprehensive approach to secure image communication by integrating quantum key distribution (QKD) with hyperchaotic encryption techniques, overcoming limitations in existing hyperchaos-based encryption systems. The proposed system utilizes the B92 QKD protocol for the secure distribution of encryption keys, ensuring the protection of the key exchange process. Additionally, the Hyper 3D Logistic Map (H3LM) was employed to enhance the encryption of plaintext images, providing strong diffusion and confusion properties necessary for a robust encryption mechanism. Unlike previous methods, H3LM extends the chaotic behavior by ensuring higher complexity and sensitivity to initial conditions, resulting in better security. Our method demonstrated high sensitivity to key variations, ensuring that even minimal changes in the encryption key result in complete decryption failure, thereby enhancing security. Moreover, the system proved resilient against common attacks, including noise (salt-and-pepper, Gaussian), cropping, and JPEG compression. These results suggest that the combined quantum and hyperchaotic approach secure key distribution and ensure the integrity of the encrypted image under real-world perturbations.
This work fills gaps in the literature by combining quantum key distribution with chaotic encryption, addressing the predictability issues seen in earlier hyperchaos-based systems. The contributions of this work are twofold: first, the combination of quantum key distribution with a hyperchaotic encryption system offers a dual-layer security model, securing both key exchange and the encryption process; second, the proposed system was shown to be resistant to various forms of attack, making it suitable for applications where the integrity and confidentiality of sensitive image data are paramount. Future work will explore extending this approach to other forms of data and further optimizing the hyperchaotic system for enhanced computational efficiency.
Acknowledgement: None.
Funding Statement: The authors received no specific funding for this study.
Author Contributions: The authors confirm contribution to the paper as follows: study conception and design: De Rosal Ignatius Moses Setiadi, Nova Rijati; data collection: Ahmad Rofiqul Muslikh; Bonifacius Vicky Indriyono; analysis and interpretation of results: De Rosal Ignatius Moses Setiadi, Nova Rijati; Aceng Sambas; draft manuscript preparation: De Rosal Ignatius Moses Setiadi, Nova Rijati. All authors reviewed the results and approved the final version of the manuscript.
Availability of Data and Materials: Data available on request from the authors.
Ethics Approval: Not applicable.
Conflicts of Interest: The authors declare no conflicts of interest to report regarding the present study.
References
1. M. D. Okpor et al., “Pilot study on enhanced detection of cues over malicious sites using data balancing on the random forest ensemble,” J. Futur. Artif. Intell. Technol., vol. 1, no. 2, pp. 109–123, Sep. 2024. doi: 10.62411/faith.2024-14. [Google Scholar] [CrossRef]
2. D. R. I. M. Setiadi, S. Widiono, A. N. Safriandono, and S. Budi, “Phishing website detection using bidirectional gated recurrent unit model and feature selection,” J. Futur. Artif. Intell. Technol., vol. 2, no. 1, pp. 75–83, 2024. doi: 10.62411/faith.2024-15. [Google Scholar] [CrossRef]
3. Z. S. Dhahir, “A hybrid approach for efficient DDoS detection in network traffic using CBLOF-based feature engineering and XGBoost,” J. Futur. Artif. Intell. Technol., vol. 1, no. 2, pp. 174–190, Sep. 2024. doi: 10.62411/faith.2024-33. [Google Scholar] [CrossRef]
4. A. Singh, K. B. Sivangi, and A. N. Tentu, “Machine learning and cryptanalysis: An in-depth exploration of current practices and future potential,” J. Comput. Theor. Appl., vol. 1, no. 3, pp. 257–272, Feb. 2024. doi: 10.62411/jcta.9851. [Google Scholar] [CrossRef]
5. D. R. I. M. Setiadi and M. Akrom, “Hybrid quantum key distribution protocol with chaotic system for securing data transmission,” J. Comput. Theor. Appl., vol. 1, no. 2, pp. 188–200, Dec. 2023. doi: 10.33633/jcta.v1i2.9547. [Google Scholar] [CrossRef]
6. H. -Y. Su, “Simple analysis of security of the BB84 quantum key distribution protocol,” Quantum Inf. Process, vol. 19, no. 6, Jun. 2020, Art. no. 169. doi: 10.1007/s11128-020-02663-z. [Google Scholar] [CrossRef]
7. C. H. Bennett, “Quantum cryptography using any two non-orthogonal states,” Phys. Rev. Lett., vol. 68, no. 21, pp. 3121–3124, May 1992. doi: 10.1103/PhysRevLett.68.3121. [Google Scholar] [PubMed] [CrossRef]
8. Y. Zheng, “Comparative analysis of quantum key distribution protocols: BB84 and B92 in the context of hybrid quantum-classical networks,” in Proc. of the 2023 Int. Conf. on Image, Algorithms and Artificial Intelligence (ICIAAI 2023), 2023, pp. 548–556. doi: 10.2991/978-94-6463-300-9_56. [Google Scholar] [CrossRef]
9. S. Srikara, K. Thapliyal, and A. Pathak, “Continuous variable B92 quantum key distribution protocol using single photon added and subtracted coherent states,” Quantum Inf. Process, vol. 19, no. 10, Oct. 2020, Art. no. 371. doi: 10.1007/s11128-020-02872-6. [Google Scholar] [CrossRef]
10. M. Mazyad Hazzazi, H. Ur Rehman, T. Shah, and H. Younas, “Asymmetric key cryptosystem for image encryption by elliptic curve over galois field,” Comput. Mater. Contin., vol. 76, no. 2, pp. 2033–2060, 2023. doi: 10.32604/cmc.2023.040629. [Google Scholar] [CrossRef]
11. M. Shariatzadeh, M. J. Rostami, and M. Eftekhari, “Proposing a novel dynamic AES for image encryption using a chaotic map key management approach,” Optik, vol. 246, Nov. 2021, Art. no. 167779. doi: 10.1016/j.ijleo.2021.167779. [Google Scholar] [CrossRef]
12. H. Liu, A. Kadir, and J. Liu, “Color pathological image encryption algorithm using arithmetic over Galois field and coupled hyper chaotic system,” Opt. Lasers Eng., vol. 122, pp. 123–133, Nov. 2019. doi: 10.1016/j.optlaseng.2019.05.027. [Google Scholar] [CrossRef]
13. T. H. Cormen, C. E. Leiserson, R. L. Rivest, and C. Stein, Introduction to Algorithms, 3rd ed. Dartmouth College, MIT, Columbia Univ.: MIT Press, 2009. [Google Scholar]
14. D. R. I. M. Setiadi, E. H. Rachmawanto, C. A. Sari, A. Susanto, and M. Doheir, “A comparative study of image cryptographic method,” in Proc. Int. Conf. Inform. Technol. Comput. Electr. Eng., Sep. 2018, pp. 336–341. doi: 10.1109/ICITACEE.2018.8576907. [Google Scholar] [CrossRef]
15. D. R. I. M. Setiadi, E. H. Rachmawanto, and R. Zulfiningrum, “Medical image cryptosystem using dynamic josephus sequence and chaotic-hash scrambling,” J. King Saud Univ.-Comput. Inf. Sci., vol. 34, no. 9, pp. 6818–6828, Oct. 2022. doi: 10.1016/j.jksuci.2022.04.002. [Google Scholar] [CrossRef]
16. G. Alvarez and S. Li, “Some basic cryptographic requirements for chaos-based cryptosystems,” Int. J. Bifurc. Chaos., vol. 16, no. 8, pp. 2129–2151, Aug. 2006. doi: 10.1142/S0218127406015970. [Google Scholar] [CrossRef]
17. C. Han, “An image encryption algorithm based on modified logistic chaotic map,” Optik, vol. 181, pp. 779–785, Mar. 2019. doi: 10.1016/j.ijleo.2018.12.178. [Google Scholar] [CrossRef]
18. Z. Hua and Y. Zhou, “Image encryption using 2D logistic-adjusted-sine map,” Inf. Sci., vol. 339, pp. 237–253, Apr. 2016. doi: 10.1016/j.ins.2016.01.017. [Google Scholar] [CrossRef]
19. E. N. Lorenz, “Deterministic nonperiodic flow,” J. Atmos. Sci., vol. 20, no. 2, pp. 130–141, Mar. 1963. doi: 10.1175/1520-0469(1963)020. [Google Scholar] [CrossRef]
20. O. E. Rössler, “An equation for continuous chaos,” Phys. Lett. A, vol. 57, no. 5, pp. 397–398, Jul. 1976. doi: 10.1016/0375-9601(76)90101-8. [Google Scholar] [CrossRef]
21. G. Chen and T. Ueta, “Yet another chaotic attractor,” Int. J. Bifurc. Chaos., vol. 9, no. 7, pp. 1465–1466, Jul. 1999. doi: 10.1142/S0218127499001024. [Google Scholar] [CrossRef]
22. G. Ye, H. Wu, M. Liu, and Y. Shi, “Image encryption scheme based on blind signature and an improved Lorenz system,” Expert. Syst. Appl., vol. 205, Nov. 2022, Art. no. 117709. doi: 10.1016/j.eswa.2022.117709. [Google Scholar] [CrossRef]
23. A. Zarei and S. Tavakoli, “Hopf bifurcation analysis and ultimate bound estimation of a new 4-D quadratic autonomous hyper-chaotic system,” Appl. Math. Comput., vol. 291, pp. 323–339, Dec. 2016. doi: 10.1016/j.amc.2016.07.023. [Google Scholar] [CrossRef]
24. K. M. Hosny, S. T. Kamal, M. M. Darwish, and G. A. Papakostas, “New image encryption algorithm using hyperchaotic system and fibonacci q-matrix,” Electronics, vol. 10, no. 9, 2021. doi: 10.3390/electronics10091066. [Google Scholar] [CrossRef]
25. X. Gao, “Image encryption algorithm based on 2D hyperchaotic map,” Opt. Laser Technol., vol. 142, Oct. 2021, Art. no. 107252. doi: 10.1016/j.optlastec.2021.107252. [Google Scholar] [CrossRef]
26. U. Erkan, A. Toktas, and Q. Lai, “2D hyperchaotic system based on Schaffer function for image encryption,” Expert Syst. Appl., vol. 213, Mar. 2023, Art. no. 119076. doi: 10.1016/j.eswa.2022.119076. [Google Scholar] [CrossRef]
27. W. Feng et al., “Exploiting robust quadratic polynomial hyperchaotic map and pixel fusion strategy for efficient image encryption,” Expert Syst. Appl., vol. 246, Jul. 2024, Art. no. 123190. doi: 10.1016/j.eswa.2024.123190. [Google Scholar] [CrossRef]
28. Y. -Q. Zhang, Y. He, P. Li, and X. -Y. Wang, “A new color image encryption scheme based on 2DNLCML system and genetic operations,” Opt. Lasers Eng., vol. 128, May 2020, Art. no. 106040. doi: 10.1016/j.optlaseng.2020.106040. [Google Scholar] [CrossRef]
29. D. R. I. M. Setiadi and N. Rijati, “An image encryption scheme combining 2D cascaded logistic map and permutation-substitution operations,” Computation, vol. 11, no. 9, Sep. 2023, Art. No. 178. doi: 10.3390/computation11090178. [Google Scholar] [CrossRef]
30. D. R. I. M. Setiadi, R. Robet, O. Pribadi, S. Widiono, and M. K. Sarker, “Image encryption using half-inverted cascading chaos cipheration,” J. Comput. Theor. Appl., vol. 1, no. 2, pp. 61–77, Oct. 2023. doi: 10.33633/jcta.v1i2.9388. [Google Scholar] [CrossRef]
31. S. -Y. Li, S. -C. Huang, C. -H. Yang, and Z. -M. Ge, “Generating tri-chaos attractors with three positive Lyapunov exponents in new four order system via linear coupling,” Nonlinear Dyn., vol. 69, no. 3, pp. 805–816, Aug. 2012. doi: 10.1007/s11071-011-0306-x. [Google Scholar] [CrossRef]
32. A. A. Neamah, “An image encryption scheme based on a seven-dimensional hyperchaotic system and Pascal’s matrix,” J. King Saud Univ.-Comput. Inf. Sci., vol. 35, no. 3, pp. 238–248, Mar. 2023. doi: 10.1016/j.jksuci.2023.02.014. [Google Scholar] [CrossRef]
33. A. Carrasco-Casado, V. Fernández, and N. Denisenko, “Free-space quantum key distribution,” Opt. Pura. Apl., vol. 44, no. 2, pp. 589–607, 2016. doi: 10.1007/978-3-319-30201-0. [Google Scholar] [CrossRef]
34. A. Entin and A. Popov, “Probabilistic Galois theory in function fields,” Finite Fields Their Appl., vol. 98, 2024, Art. no. 102466. doi: 10.1016/j.ffa.2024.102466. [Google Scholar] [CrossRef]
35. N. Wang et al., “Galois field-based image encryption for remote transmission of tumor ultrasound images,” IEEE Access, vol. 7, pp. 49945–49950, 2019. doi: 10.1109/ACCESS.2019.2910563. [Google Scholar] [CrossRef]
36. S. Farwa, N. Muhammad, T. Shah, and S. Ahmad, “A novel image encryption based on algebraic S-box and Arnold transform,” 3D Res., vol. 8, no. 3, pp. 1–14, Sep. 2017. doi: 10.1007/s13319-017-0135-x. [Google Scholar] [CrossRef]
37. X. Zhang, G. Liu, and C. Zou, “An image encryption method based on improved Lorenz chaotic system and Galois field,” Appl. Math. Model., vol. 131, pp. 535–558, 2024. doi: 10.1016/j.apm.2024.04.023. [Google Scholar] [CrossRef]
38. M. Jangra, S. Rani, and B. Singh, “PRESENT block cipher defined over galois-field (28),” in The Future of Artificial Intelligence and Robotics, 2024, pp. 535–543. doi: 10.1007/978-3-031-60935-0_48. [Google Scholar] [CrossRef]
39. K. George and A. J. Michaels, “Designing a block cipher in galois extension fields for IoT security,” IoT, vol. 2, no. 4, pp. 669–687, Nov. 2021. doi: 10.3390/iot2040034. [Google Scholar] [CrossRef]
40. P. N. Andono and D. R. I. M. Setiadi, “Improved pixel and bit confusion-diffusion based on mixed chaos and hash operation for image encryption,” IEEE Access, vol. 10, pp. 115143–115156, 2022. doi: 10.1109/ACCESS.2022.3218886. [Google Scholar] [CrossRef]
41. USC Viterbi School of Engineering, “SIPI Image Database”. Accessed: Mar. 27, 2019. [Online]. Available: http://sipi.usc.edu/database/ [Google Scholar]
42. P. N. Lone, D. Singh, V. Stoffová, D. C. Mishra, U. H. Mir and N. Kumar, “Cryptanalysis and improved image encryption scheme using elliptic curve and affine hill cipher,” Mathematics, vol. 10, no. 20, Oct. 2022, Art. no. 3878. doi: 10.3390/math10203878. [Google Scholar] [CrossRef]
43. X. Huang, J. Tang, and Z. Zhang, “Efficient and secure image encryption algorithm using 2D LIM map and Latin square matrix,” Nonlinear Dyn., vol. 112, no. 24, pp. 22463–22483, Aug. 2024. doi: 10.1007/s11071-024-10191-z. [Google Scholar] [CrossRef]
44. H. Zhang, X. Q. Wang, Y. J. Sun, and X. Y. Wang, “A novel method for lossless image compression and encryption based on LWT, SPIHT and cellular automata,” Signal Process. Image Commun., vol. 84, 2020, Art. no. 115829. doi: 10.1016/j.image.2020.115829. [Google Scholar] [CrossRef]
45. C. Cao, K. Sun, and W. Liu, “A novel bit-level image encryption algorithm based on 2D-LICM hyperchaotic map,” Signal Process, vol. 143, pp. 122–133, Feb. 2018. doi: 10.1016/j.sigpro.2017.08.020. [Google Scholar] [CrossRef]
46. Y. Hong et al., “A novel approach for image encryption with chaos-RNA,” Comput. Mater. Contin., vol. 77, no. 1, pp. 139–160, 2023. doi: 10.32604/cmc.2023.043424. [Google Scholar] [CrossRef]
47. E. Moya-Albor, A. Romero-Arellano, J. Brieva, and S. L. Gomez-Coronel, “Color image encryption algorithm based on a chaotic model using the modular discrete derivative and Langton’s ant,” Mathematics, vol. 11, no. 10, May 2023, Art. no. 2396. doi: 10.3390/math11102396. [Google Scholar] [CrossRef]
48. Y. Y. Ghadi, “A new S-box design system for data encryption using artificial bee colony algorithm,” Comput. Mater. Contin., vol. 77, no. 1, pp. 781–797, 2023. doi: 10.32604/cmc.2023.042777. [Google Scholar] [CrossRef]
Cite This Article
 Copyright © 2024 The Author(s). Published by Tech Science Press.
This work is licensed under a Creative Commons Attribution 4.0 International License , which permits unrestricted use, distribution, and reproduction in any medium, provided the original work is properly cited.
 Downloads
 Citation Tools