
 Submit a Paper
 Propose a Special lssue
 Open Access
ARTICLE
Machine Learning Stroke Prediction in Smart Healthcare: Integrating Fuzzy K-Nearest Neighbor and Artificial Neural Networks with Feature Selection Techniques
1 Department Information System Study Program, Faculty of Science and Technology, Universitas Airlangga, Surabaya, 60286, Indonesia
2 School of Software, Northwestern Polytechnical University, Xi’an, 710072, China
3 Research Center for Quantum Engineering Design, Faculty of Science and Technology, Universitas Airlangga, Surabaya, 60286, Indonesia
4 School of Computer Science and Software Engineering, Shenzhen University, Shenzhen, 518061, China
5 Cybersecurity Center, Prince Mohammad Bin Fahd University, 617, Al Jawharah, Khobar, Dhahran, 34754, Saudi Arabia
6 Cardiff School of Technologies, Cardiff Metropolitan University, Western Avenue, Cardiff, CF5 2YB, UK
7 Instituto de Telecomunicações, Escola Superior de Tecnologia e Gestão de Águeda, Universidade de Aveiro, Águeda, 3750-127, Portugal
* Corresponding Authors: Ira Puspitasari. Email: ; Ivan Miguel Pires. Email:
(This article belongs to the Special Issue: Advances in Deep Learning and Neural Networks: Architectures, Applications, and Challenges)
Computers, Materials & Continua 2025, 82(3), 5115-5134. https://doi.org/10.32604/cmc.2025.062605
Received 22 December 2024; Accepted 03 February 2025; Issue published 06 March 2025
 View Full Text
 Download PDF
Abstract
This research explores the use of Fuzzy K-Nearest Neighbor (F-KNN) and Artificial Neural Networks (ANN) for predicting heart stroke incidents, focusing on the impact of feature selection methods, specifically Chi-Square and Best First Search (BFS). The study demonstrates that BFS significantly enhances the performance of both classifiers. With BFS preprocessing, the ANN model achieved an impressive accuracy of 97.5%, precision and recall of 97.5%, and an Receiver Operating Characteristics (ROC) area of 97.9%, outperforming the Chi-Square-based ANN, which recorded an accuracy of 91.4%. Similarly, the F-KNN model with BFS achieved an accuracy of 96.3%, precision and recall of 96.3%, and a Receiver Operating Characteristics (ROC) area of 96.2%, surpassing the performance of the Chi-Square F-KNN model, which showed an accuracy of 95%. These results highlight that BFS improves the ability to select the most relevant features, contributing to more reliable and accurate stroke predictions. The findings underscore the importance of using advanced feature selection methods like BFS to enhance the performance of machine learning models in healthcare applications, leading to better stroke risk management and improved patient outcomes.Keywords
In recent years, we have transitioned from a traditional world to one advanced and driven by technology. The advent of 5G and beyond 5G technologies is shaping this transformation, enveloping humanity within the expansive embrace of the Internet of Everything (IoE) [1]. Among the various facets of this interconnected world, healthcare applications have emerged as a dominant area, addressing critical concerns and bringing solutions to our fingertips. Alarmingly, heart-stroke incidents have been on the rise. According to the World Health Organization (WHO) and other health entities, stroke has consistently been one of the leading causes of death and disability worldwide. By 2019, it was estimated that more than 13 million people would suffer a stroke annually, with roughly 5.5 million resulting in death [2]. The increase in stroke incidence and prevalence has been particularly notable in low-and middle-income countries, in part because of changes in lifestyle and demographics. In contrast, some high-income countries have seen stable or declining rates thanks to effective public health interventions. Given this surge, we must harness the capabilities of the current technological landscape to effectively detect and respond to heart strokes, ensuring timely interventions and saving countless lives [3].
Data mining plays a crucial role across various sectors, with its applications in the healthcare industry being particularly transformative. At its core, data mining involves analyzing large datasets to extract previously unrecognized, valid patterns and relationships [4]. This process is integral to the broader Knowledge Discovery in Databases (KDD) discipline, which includes classification, association, and clustering as key components.
Data mining’s profound impact on the healthcare sector cannot be overstated. It enables the discovery of actionable insights from massive datasets and plays a pivotal role in enhancing the efficacy and efficiency of healthcare services. By leveraging data mining techniques, healthcare organizations can address significant challenges, including disease prediction, treatment optimization, and cost reduction, ultimately leading to improved health outcomes and patient care [5].
In this research, we focused on improving stroke prediction accuracy by combining two machine learning algorithms–Fuzzy K-Nearest Neighbor (F-KNN) and Artificial Neural Networks (ANN) with advanced feature selection techniques, specifically Chi-Square and Best First Search (BFS). Our key contributions include enhancing feature selection by identifying the most relevant features and significantly improving model performance. We evaluated our models using multiple metrics like precision, recall, F-measure, and Receiver Operating Characteristics (ROC) area, ensuring a comprehensive assessment of performance. Our findings highlight the effectiveness of combining ANN with BFS for stroke prediction, offering a robust framework that can be adapted for other medical prediction tasks, ultimately aiding in faster and more accurate healthcare decision-making.
Technologies such as machine learning and deep learning can significantly enhance stroke prediction accuracy in the medical field, and numerous studies have investigated their application in this context. This section presents a selection of studies that utilized publicly available datasets, including those from Kaggle and data from local hospitals and laboratories. In [6], the main focus of this study was to consider six types of beats taken from the MIT-BIH Arrhymtia database. They used a technique called PCA (Principal Component Analysis). The performance of the fuzzy k-Nearest classifier was identified with PCA and without using PCA. In the end, the Accuracy of the fuzzy-KNN is 97%.
The authors in [7] collected data from Kaggle involving 3254 participants. The dataset comprises ten independent features, including age, BMI, glucose level, smoking status, hypertension, and a history of stroke. Data preprocessing was conducted, and class balancing was achieved using the Synthetic Minority Over-Sampling Technique (SMOTE) resampling technique. To predict stroke occurrence, various machine learning models, including Stacking, Decision Tree, Random Forest, Majority Voting, Naive Bayes, Multilayer Perceptron, KNN, Stochastic Gradient Descent, and logistic regression. The results indicated that the stacking classifier outperformed the others, achieving an Area Under The Curve (AUC) value of 0.989 and precision and recall rates of 0.974. Additionally, random forest, KNN, and majority voting demonstrated strong performance.
In [8], the authors developed a model for predicting heart disease using Neural Networks, K-means clustering, and Frequent Item Set generation methods. The dataset was sourced from the Cleveland Heart Disease database, encompassing 14 key attributes and 303 records. Performance analysis was conducted, focusing on accuracy, sensitivity, and specificity. Ultimately, the Artificial Neural Network emerged as the most effective classifier, achieving an accuracy rate of 79%.
The author in paper [9] utilized a dataset published by McKinsey and Company, which included 11 attributes such as body mass index, heart disease status, marital status, age, average blood glucose levels, and smoking habits. The dataset comprised 548 patients who had experienced a stroke and 28,524 patients with no prior strokes, necessitating a size reduction. To mitigate sampling bias, 1000 downsampling experiments were conducted. Subsequently, 70% of the dataset was allocated for training and 30% for testing. Among the 1000 experiments, the Neural Network model achieved the highest accuracy at 75.02%, followed by Random Forest with 74.53% and Decision Tree at 74.31%.
In [10], the authors investigate the implementation of data mining approaches for forecasting heart disease. The primary focus of this survey paper is to identify more effective mining techniques for heart disease classification. According to the findings, several machine learning algorithms were evaluated, including Fuzzy KNN, K-Nearest Neighbor, K-means, Neural Network, Neuro-Fuzzy, C4.5, and J48. Among these algorithms, Fuzzy KNN demonstrated superior performance and enhanced accuracy compared to the others.
In [11], the authors presents a machine learning model designed to improve the prediction of cardiovascular diseases (CVDs). The model integrates a Multilayer Perceptron Neural Network (MLPNN) with an Arithmetic Optimization Algorithm (AOA) to select the most relevant features from medical datasets, focusing on the Cleveland dataset. The methodology involves preprocessing data, applying AOA for feature selection, and using MLPNN for classification. By addressing issues such as imbalanced datasets and irrelevant features, the approach enhances the accuracy and efficiency of CVD prediction. The model’s performance was evaluated using metrics like accuracy, precision, recall, and F1-score. It achieved an accuracy of 88.89%, outperforming traditional machine learning models like SVM, decision trees, and KNN. This demonstrates the model’s ability to provide reliable and non-invasive predictions, making it a valuable tool for early CVD diagnosis.
In [12], the author proposed a model in his thesis to predict stroke disease utilizing K-Nearest Neighbor (KNN) and Decision Tree classifiers. Chi-Squared and Genetic Search data mining techniques were implemented to effectively evaluate and preprocess the attributes. The comparison between the K-Nearest Neighbor and Decision Tree algorithms revealed that the Chi-Squared method outperformed Genetic Search. At the same time, KNN demonstrated superior performance compared to the Decision Tree algorithm.
The researcher in the paper [13] introduced four stacking ensemble techniques designed for heart disease diagnosis by optimizing hyperparameters. Their research utilized the UCI dataset containing 918 records and 12 attributes. To enhance the performance of 11 machine learning classifiers, they employed GridSearchCV with five-fold cross-validation. The highest accuracy, 91.5%, was achieved with the second stacking ensemble method combined with oversampling. Similarly, in the paper [14], the researchers tackled the problem of data imbalance by applying the SMOTE technique for oversampling. They developed a machine learning approach for predicting cardiac conditions, using the Cleveland dataset to train models such as Naive Bayes, Random Forest, Support Vector Machines, Decision Trees, and K-Nearest Neighbors.
The study [15] explores an automated stroke prediction model using machine learning, focusing on improving early diagnosis and intervention. The methodology involves using various machine learning models, such as Random Forest and XGBoost, alongside techniques like SMOTE for data balancing to address the issue of imbalanced datasets. Explainable Artificial Intelligence (XAI) methods, including SHAP and LIME, were employed to provide interpretable insights into the model’s decision-making process. A web application was developed to facilitate user interaction with the model, allowing real-time stroke risk prediction. The Random Forest model achieved the highest accuracy of 90.36% without data leakage, demonstrating its reliability. Performance metrics like precision, recall, and F1-score were used to evaluate the models comprehensively.
Despite the promising results achieved in stroke prediction using machine learning, there are still several areas that require further improvement. While many models have demonstrated high accuracy, the performance can be enhanced even more, especially for real-time applications. One of the challenges lies in the time complexity and memory consumption of complex models, which can be a barrier when trying to deploy them in resource-limited environments. The feature selection methods used to improve prediction accuracy also need further optimization, particularly when dealing with large and high-dimensional datasets.
In this study, the tool used to construct the data mining model is the ‘WEKA’. This tool foresees stroke disease, and suggestions are provided for physicians to apply the proposed model in the medical field. The first step in this research is gathering data on stroke disease. For the analysis and verification of the data, the Chi-Squared and best first search are used for better and more delicate feature selection. Classifiers called Fuzzy K-Nearest Neighbor and Artificial Neural Network classification algorithms are used to check the accuracy. The model is trained using the WEKA tool, and then data is provided to this model to check the accuracy. Fig. 1 shows research methodology architecture.
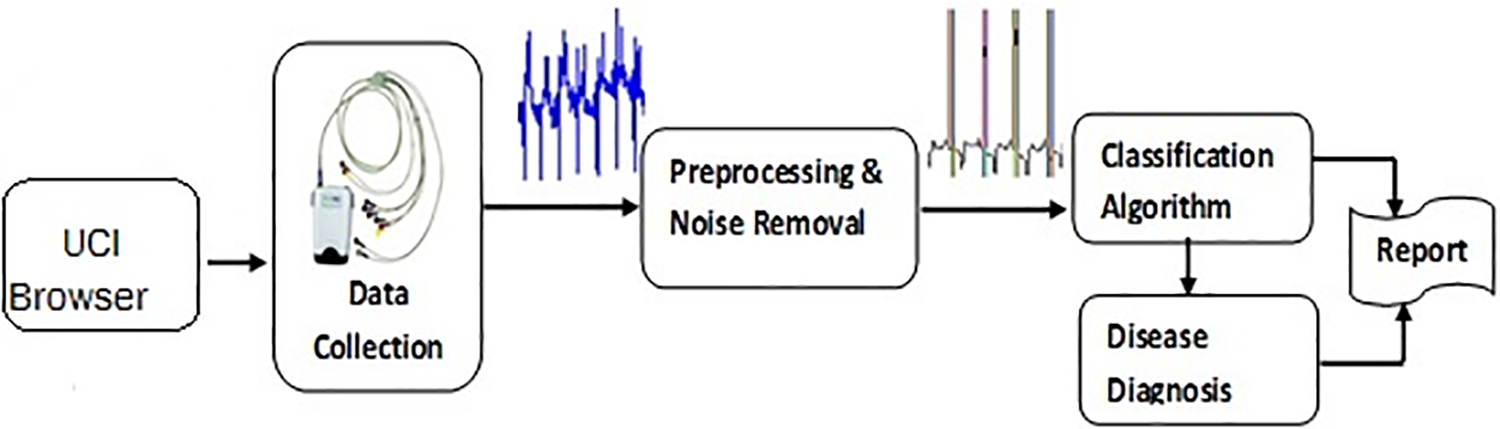
Figure 1: Research methodology architecture
In our comprehensive framework for stroke disease prediction, data preprocessing plays a crucial role in enhancing the performance of our predictive models, including Fuzzy K-Nearest Neighbor (F-KNN) and Artificial Neural Networks (ANN) augmented with the Chi-Square (CS) and Best First Search (BFS) feature selection technique. The process involves several meticulously designed steps to ensure the highest quality of data feeding into our prediction algorithms.
Our methodology’s initial phase involves gathering a stroke patient dataset, which we sourced from the publicly available UCI and Kaggle repositories. The dataset consists of 1207 instances with 12 attributes. Attributes of the stroke dataset consist of age, gender, blood pressure, fasting blood sugar, diabetes, cholesterol, smoking, family history, arrhythmias, FND (functional neurological disorder), stroke type and Class Label.
The preprocessing stage is fundamental in transforming raw data into a suitable format for analysis. This stage involves several key processes.
• Data Cleaning: The first step in preprocessing involves cleaning the dataset by removing any inconsistencies or irrelevant data. It is a crucial step because the presence of such data can lead to inaccurate predictions.
• Handling Missing Values: We identified and imputed missing values within our dataset. Missing values can distort the predictive model’s understanding of the data, leading to less accurate predictions. Various strategies were employed for imputation, including the mean imputation method for continuous variables and mode imputation for categorical variables.
• Normalization: We applied data normalization techniques to scale the features within a similar range. This process is vital, especially when dealing with features that vary in magnitudes, units, and range. Normalization ensures that each feature contributes proportionately to the final prediction.
• Final Dataset: After the preprocessing steps, we finalized a clean, normalized dataset and reduced it to only the most relevant features. This dataset was then split into a training set, which comprises 70% of the data, and a test set, making up the remaining 30%. The training set was used to train our F-KNN and ANN models, while the test set was reserved for evaluating the models’ performance.
A statistical hypothesis test is implemented if the statistics are a Chi-Squared distribution when the null hypothesis is accurate and the distribution of the statistics is simple. It is also known as “Pearson’s Chi-Squared test. It is also asymptotically true, showing that the sampling distribution can be estimated as carefully as anticipated by making the sample size big enough. The Chi-Square test is considered to identify whether there is a noteworthy difference between the predictable and experimental frequencies in one or more classes [16]. Formula for Chi-Square:
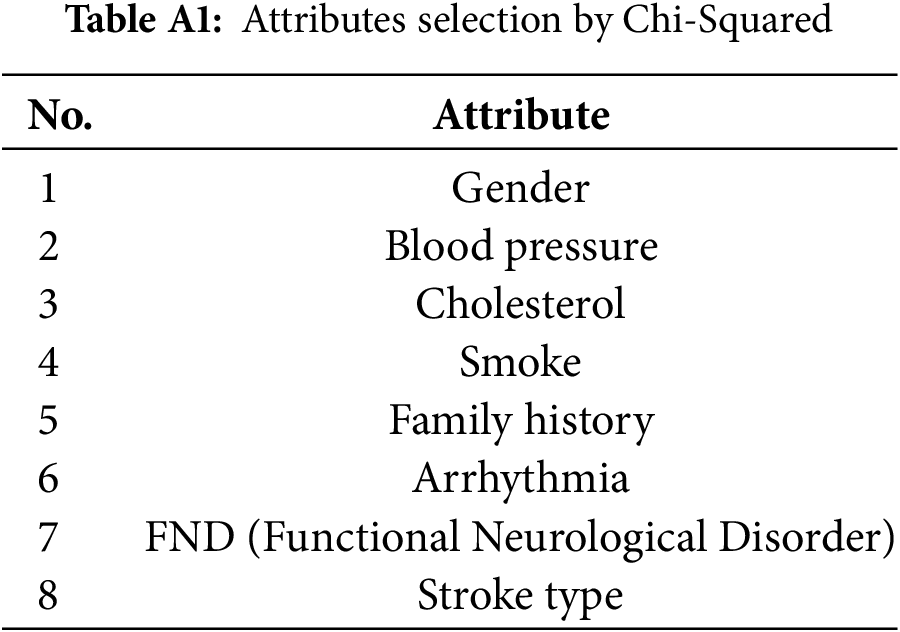
The Chi-Square technique removes noise and unnecessary and irrelevant features from selected data. As a result, the best and optimal attributes are chosen, contributing more to our data. The best selection attributes process with Chi-Square is shown in Table A1.
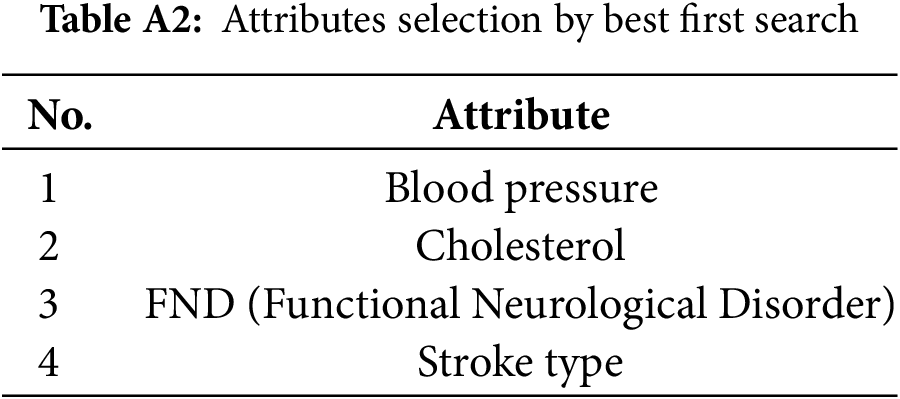
In Best-First Search, the algorithm expands nodes based on their heuristic values, selecting the node with the best (minimum) heuristic value at each step. It maintains two lists: the open list and the closed list. The open list contains the nodes that have been created but not yet expanded, while the closed list contains the nodes that have already been expanded. The node with the lowest heuristic value from the open list is selected for expansion during each iteration. Once expanded, its child nodes are added to the closed list. This process ensures that the algorithm prioritizes exploring shorter or more promising paths while longer or less favorable paths are less likely to be pursued. The best selection attributes process with Best First Search is shown in Table A2. The formula for Best First Search is as follows:
•
•
•
3.5 Building Classification Models of F-KNN and ANN
The term classification is also known as supervised learning, which gives class labels to new items. This new stroke patient classification model allows a class label (Yes or No). The two classifiers, Fuzzy K-Nearest Neighbor and Artificial Neural Networks, are used for stroke disease classification. The 70% data are used for machine training, and the remaining 30% is used for model testing.
A WEKA tool version 3.7 was used to build up classification models. The machine is trained to apply a training data set through two classification methods: Fuzzy K-Nearest Neighbor and Artificial Neural Network. Then, these models were used for stroke disease classification.
Classification Model: Fuzzy K-Nearest Neighbor (F-KNN)
The Fuzzy K-Nearest Neighbor (F-KNN) algorithm is a sophisticated extension of the conventional K-Nearest Neighbor (K-NN) method, which is widely used for classification tasks [17]. F-KNN incorporates fuzzy logic principles into the K-NN framework to enhance its classification performance, especially in scenarios where the data is not separable or overlaps among the classes. This section delves into the details of the F-KNN algorithm, including its working mechanism.
The F-KNN algorithm uses the membership grades principle to determine a query instance’s class. Instead of assigning the instance to the majority class among its nearest neighbors, F-KNN calculates the degree of membership of the instance to each class, providing a more nuanced classification that accounts for the instance’s proximity to various class clusters.
• Determine the K-Nearest Neighbors: For a given query instance, the algorithm identifies the K closest training instances based on a distance metric, typically Euclidean distance. The distance between two points
• Calculate Membership Grades: For each class
where
Here,
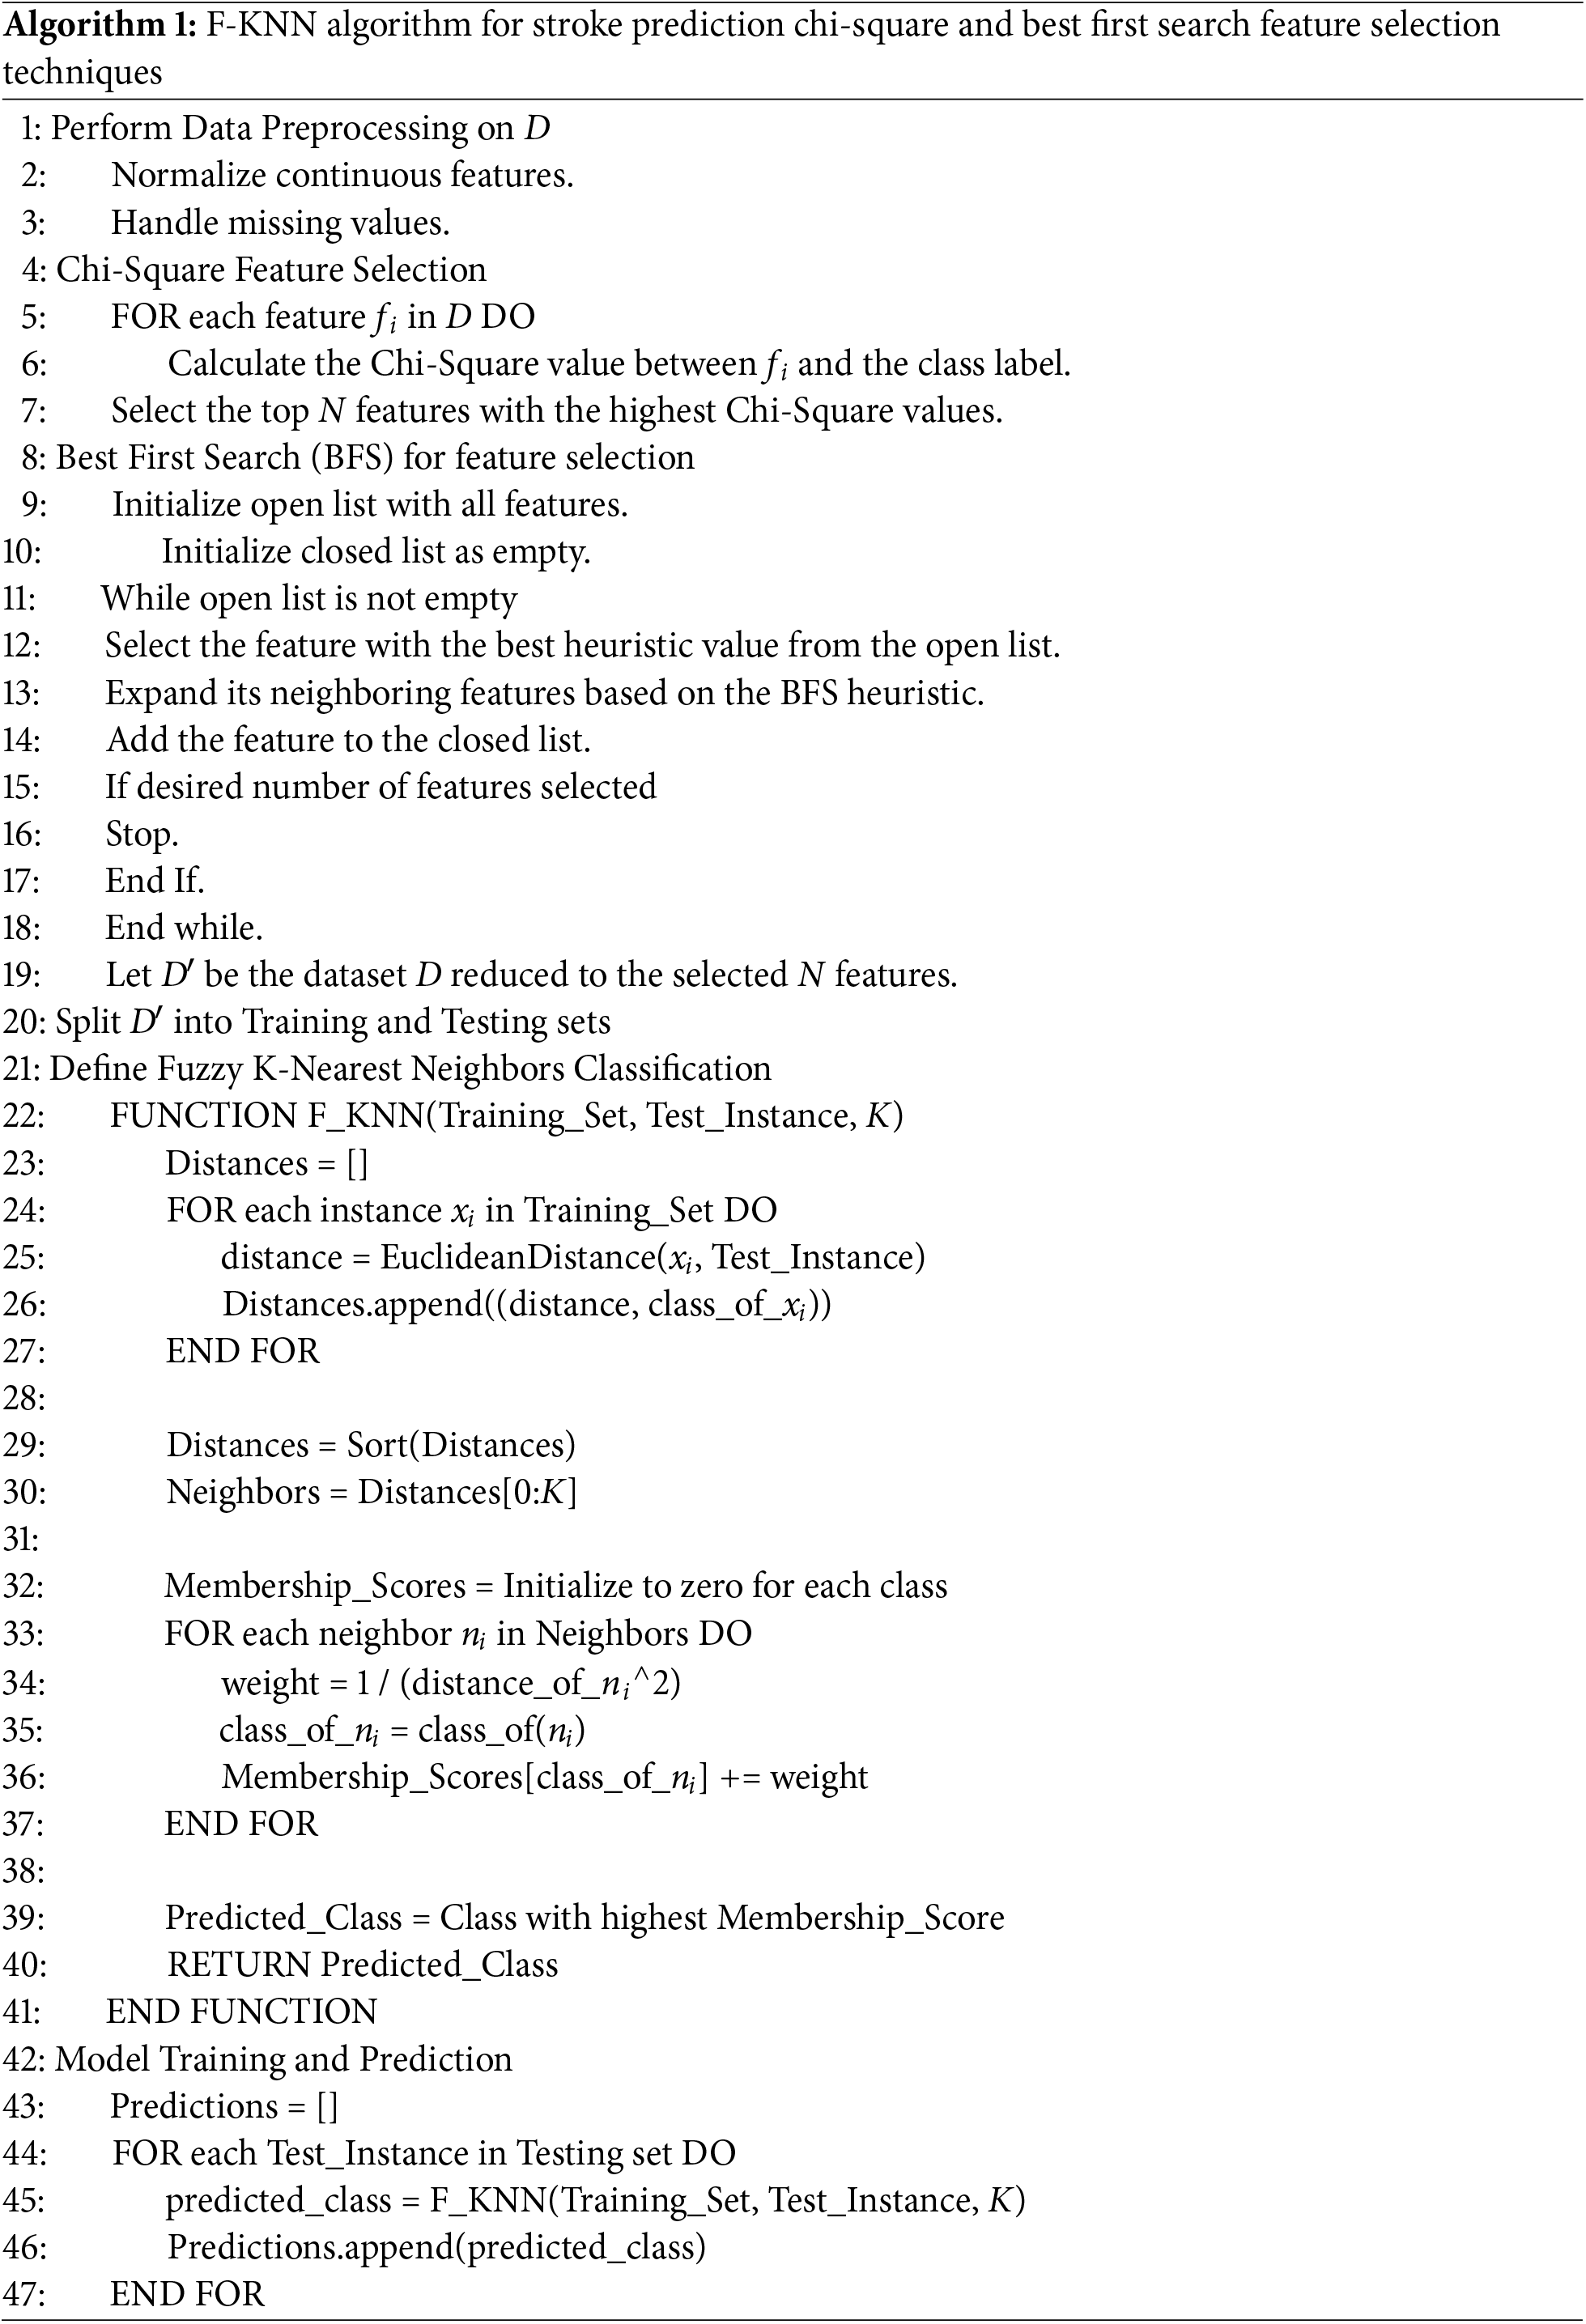
In the context of stroke disease prediction, the F-KNN algorithm’s ability to account for overlapping symptoms and risk factors across different patient profiles significantly enhances its predictive accuracy. By evaluating the fuzzy membership grades of a patient to the classes of ‘stroke’ and ‘no stroke,’ the algorithm provides a nuanced assessment of stroke risk, which is critical for early intervention and personalized healthcare planning. The Algorithm 1 elaborates the pseudo-code of Fuzzy K-Nearest Neighbors with Chi-Square and Best First Search feature selection techniques for Stroke Prediction.
3.6 Classification Model: Artificial Neural Networks (ANN)
Artificial Neural Networks (ANN) is a cornerstone of modern machine learning, inspired by the biological neural networks that constitute animal brains. These models are particularly effective for complex pattern recognition tasks, including classification, making them highly suitable for medical prediction tasks such as stroke disease prediction [18]. This section provides a detailed overview of the ANNs model.
• Neurons (Nodes): The basic computational unit of an ANN, analogous to biological neurons. Each neuron receives input, processes it, and transmits output to the next layer of neurons.
• Layers: ANNs are composed of layers: an input layer, one or more hidden layers, and an output layer. Each layer contains multiple neurons.
• Weights and Biases: Weights are the connection strengths between neurons of consecutive layers. Biases are additional parameters added to the neuron’s weighted sum before applying the activation function, allowing the activation function to be shifted to the left or right, which may be critical for successful learning.
• Activation Function: A nonlinear function applied to the weighted sum of inputs and the bias. It determines whether a neuron should be activated, introducing nonlinear properties to the model.
3.6.2 The Forward Propagation Algorithm
The process of calculating the output of an ANN for given inputs is known as forward propagation. It involves the following steps:
• Initialization: Input values are provided to the input layer.
• Weighted Sum Calculation: For each neuron in the subsequent layers, calculate the weighted sum of its inputs, which includes the outputs from the previous layer’s neurons, their corresponding weights, and the neuron’s bias. The weighted sum (
where
• Activation: The activation function (
Activation function sigmoid (
3.6.3 The Backpropagation Algorithm
ANNs learn by adjusting the weights and biases to minimize the difference between the actual and predicted outputs. This process, known as backpropagation, involves:
• Loss Function Calculation: Calculate the loss (error) using a loss function, such as Mean Squared Error (MSE) for regression tasks or Cross-Entropy for classification tasks. The loss function quantifies the difference between actual and predicted output.
• Gradient Descent: Use the gradient of the loss function to each weight and bias to update these parameters in the direction that minimally reduces the loss. It is achieved through gradient descent, where each parameter is updated as follows with Eqs. (7) and (8).
where
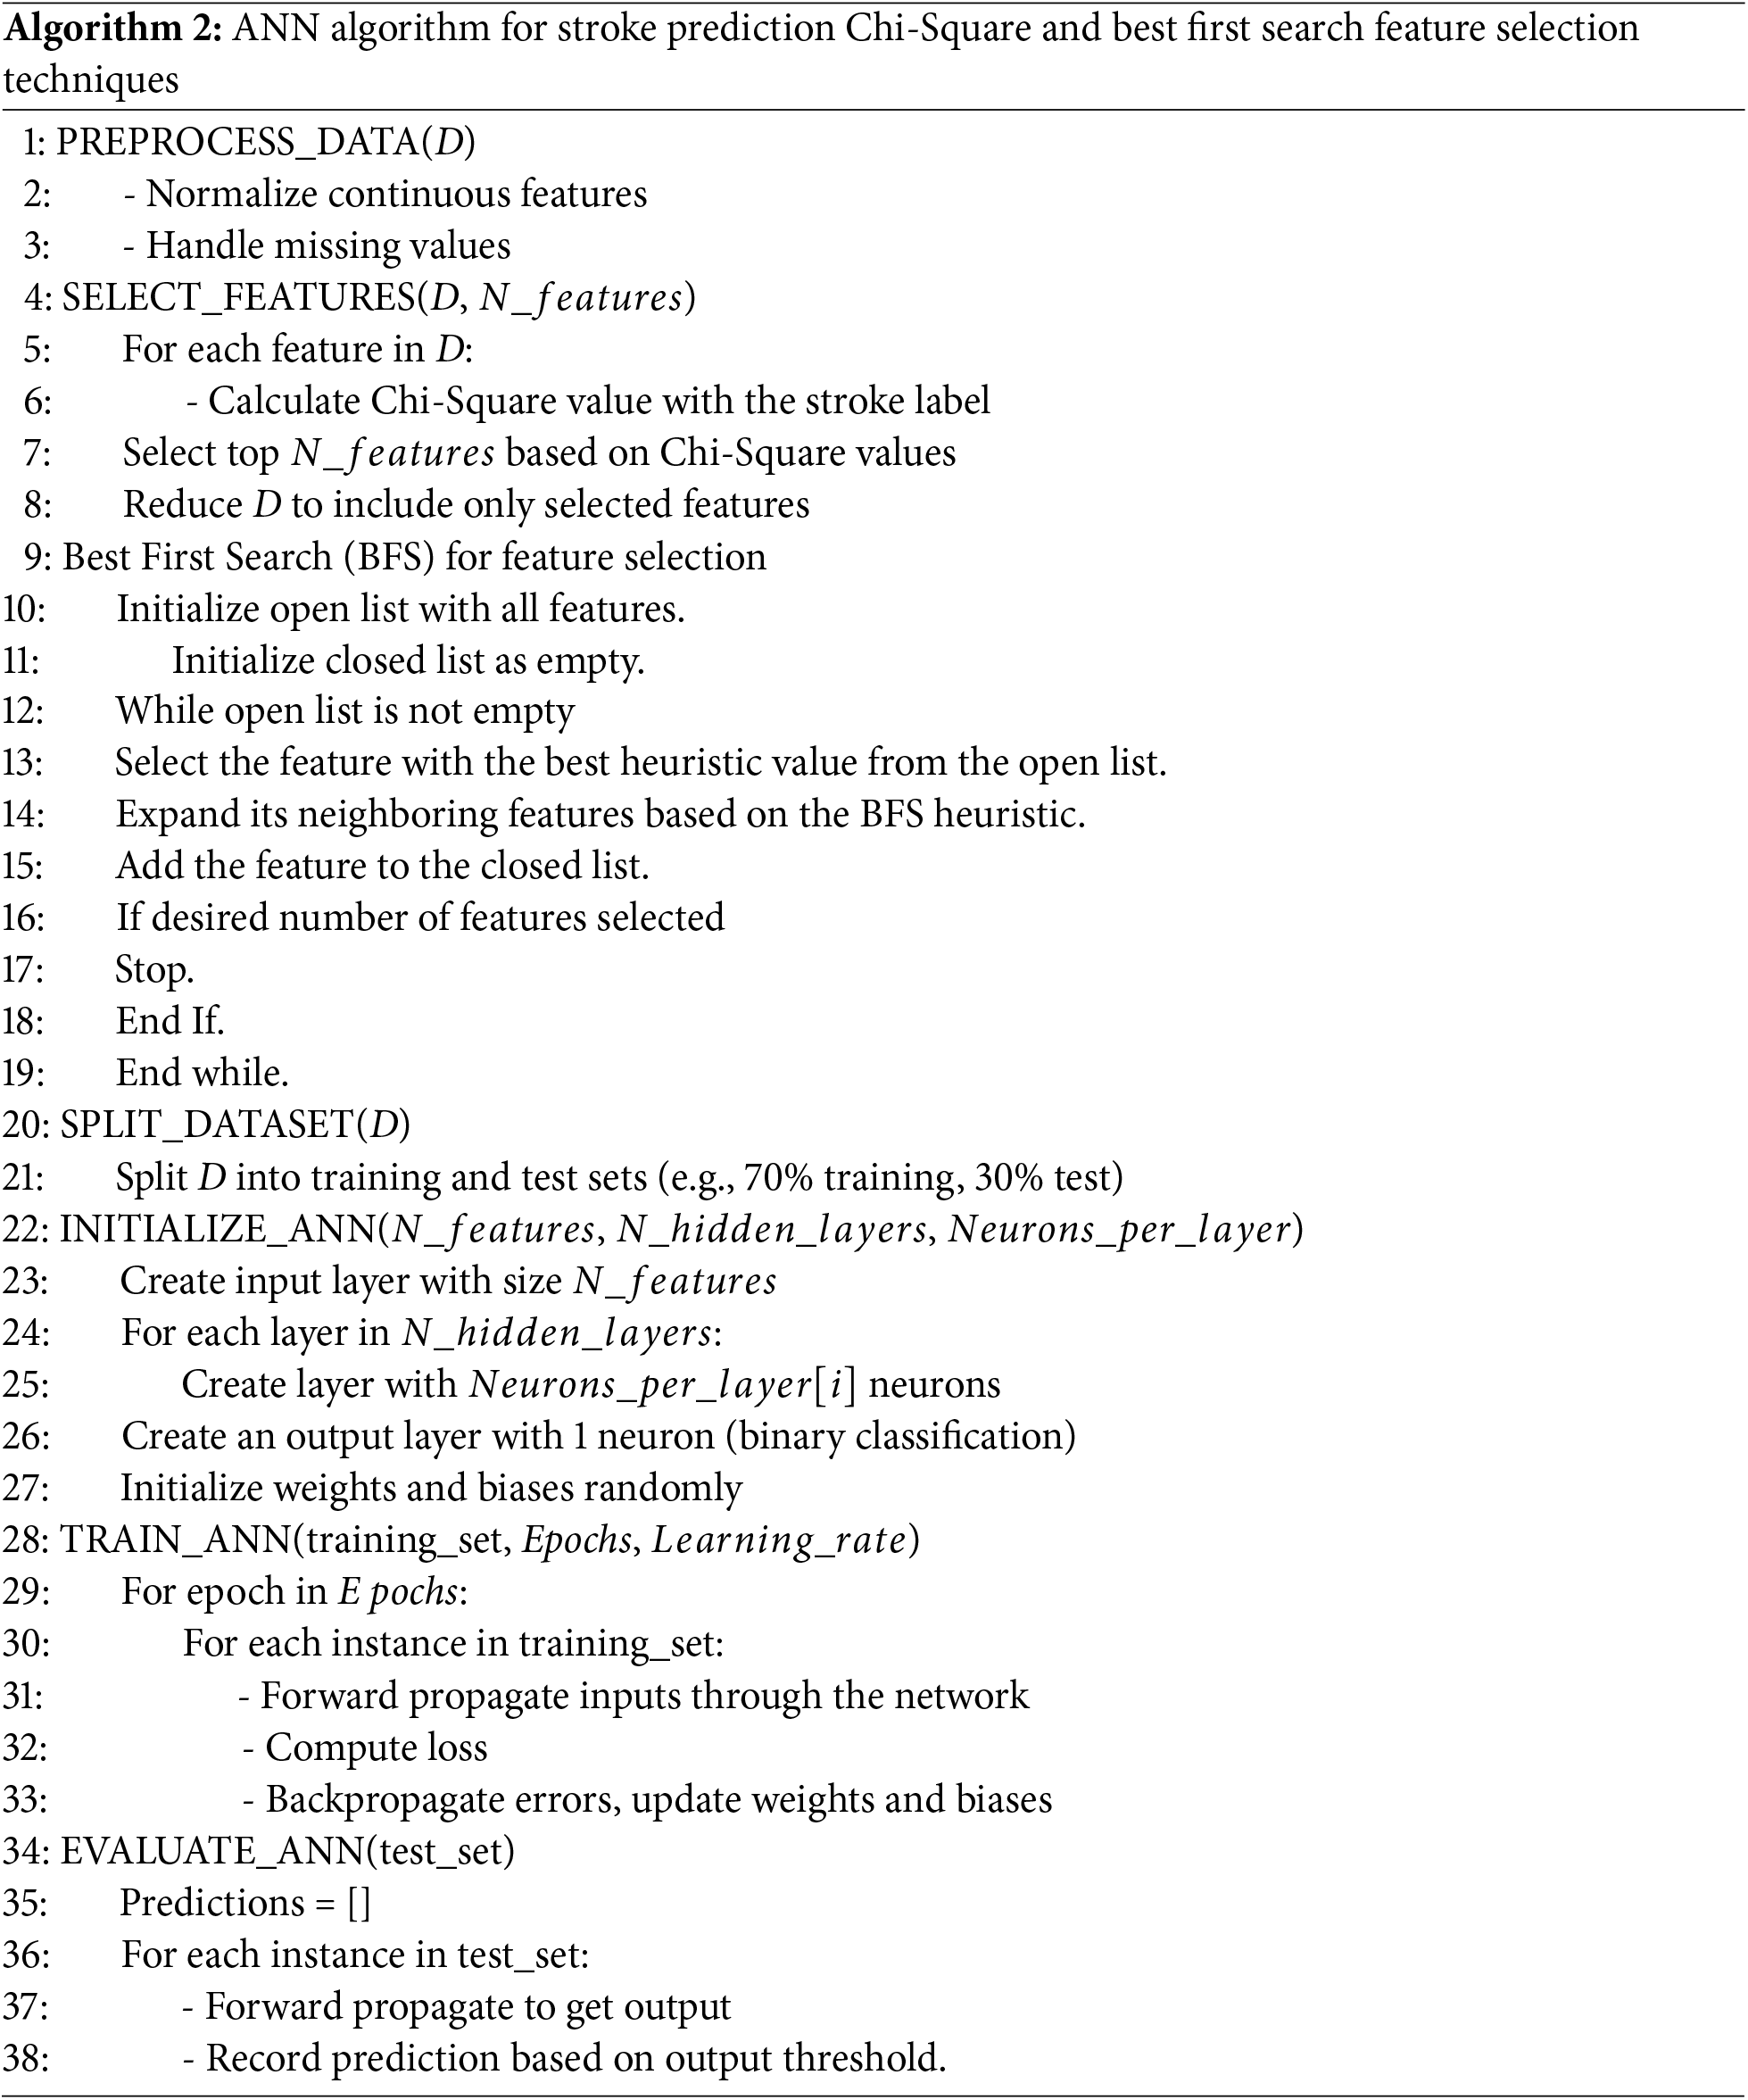
In stroke disease prediction, an ANN has input neurons corresponding to risk factors like age, blood pressure, cholesterol levels, etc. The output layer represents the probability of having a stroke. The ANN learns to map the complex relationships between risk factors and stroke outcomes through training, making it a robust medical diagnosis and prognosis tool. The Algorithm 2 elaborates the pseudo-code of Artificial Neural Networks (ANN) for Stroke Prediction Chi-Square and Best First Search feature selection techniques.
4.1 Analysis of F-KNN with Chi-Square with Test and Training Data Set
Fig. 2 presents the results of the Fuzzy K-Nearest Neighbors (F-KNN) algorithm classifier on a training dataset. The model achieved high accuracy in classifying the instances, with 97.5% of them being correctly classified and only 2.5% misclassified. The Kappa statistic of 0.9409 indicates a strong agreement between the predicted and actual classifications, suggesting the model performs well. The Root Mean Squared Error (RMSE) is 0.1581, which indicates that the model’s predictions are generally quite close to the actual values. Additionally, the Root Relative Squared Error (RRSE) of 34.50% shows a relatively low level of error in the predictions compared to the overall data variance. The model’s performance on individual classes achieved high precision and recall values, especially for the “yes” class, with a precision of 0.988 and recall of 0.982, resulting in a high F-measure score of 0.985. These metrics suggest that the model identifies true positives and minimizes false negatives for the “yes” class. The ROC area score of 0.974 further confirms that the model can distinguish between the classes, providing confidence in its effectiveness. Overall, these results indicate that the FuzzyKNN classifier is a reliable and accurate tool for this dataset.
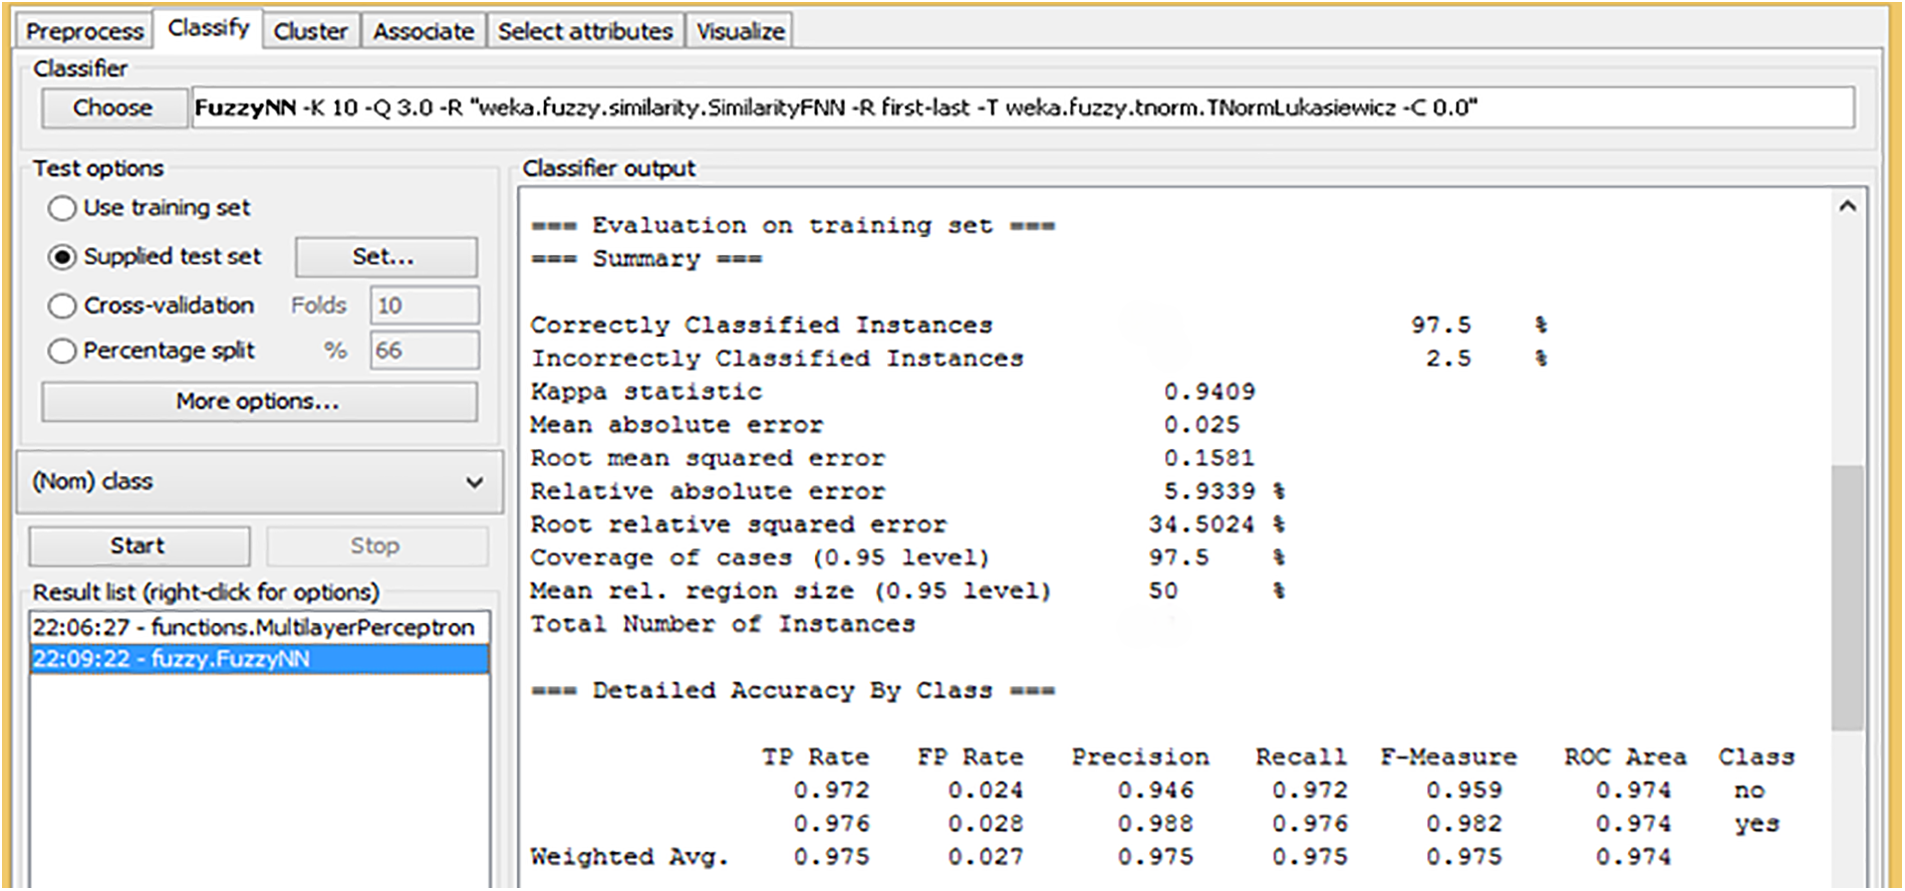
Figure 2: Training model of F-KNN with Chi-Square
Fig. 3 presents the results of re-evaluating the Fuzzy K-Nearest Neighbors (F-KNN) classifier on a test dataset. The model correctly classified 95% of the instances, with only 5% misclassified. The Kappa statistic of 0.886 shows a strong agreement between the predicted and actual classifications, indicating that the model performs well overall. The Mean Absolute Error (MAE) of 0.05 and the Root Mean Squared Error (RMSE) of 0.2236 both suggest that the model’s predictions are quite accurate, with a low level of error. In terms of class-specific performance, the model achieved a high precision and recall of 0.923 for the “no” class and 0.963 for the “yes” class, demonstrating its ability to accurately identify both classes. Additionally, the F-measure values of 0.923 for “no” and 0.963 for “yes” show that the model maintains a good balance between precision and recall for both classes. The ROC area score of 0.943 for both classes further reinforces the model’s strong discriminative ability, ensuring it effectively distinguishes between them. These results suggest that F-KNN with Chi-Square applied to the test dataset provides a reliable and high-performance classification model.
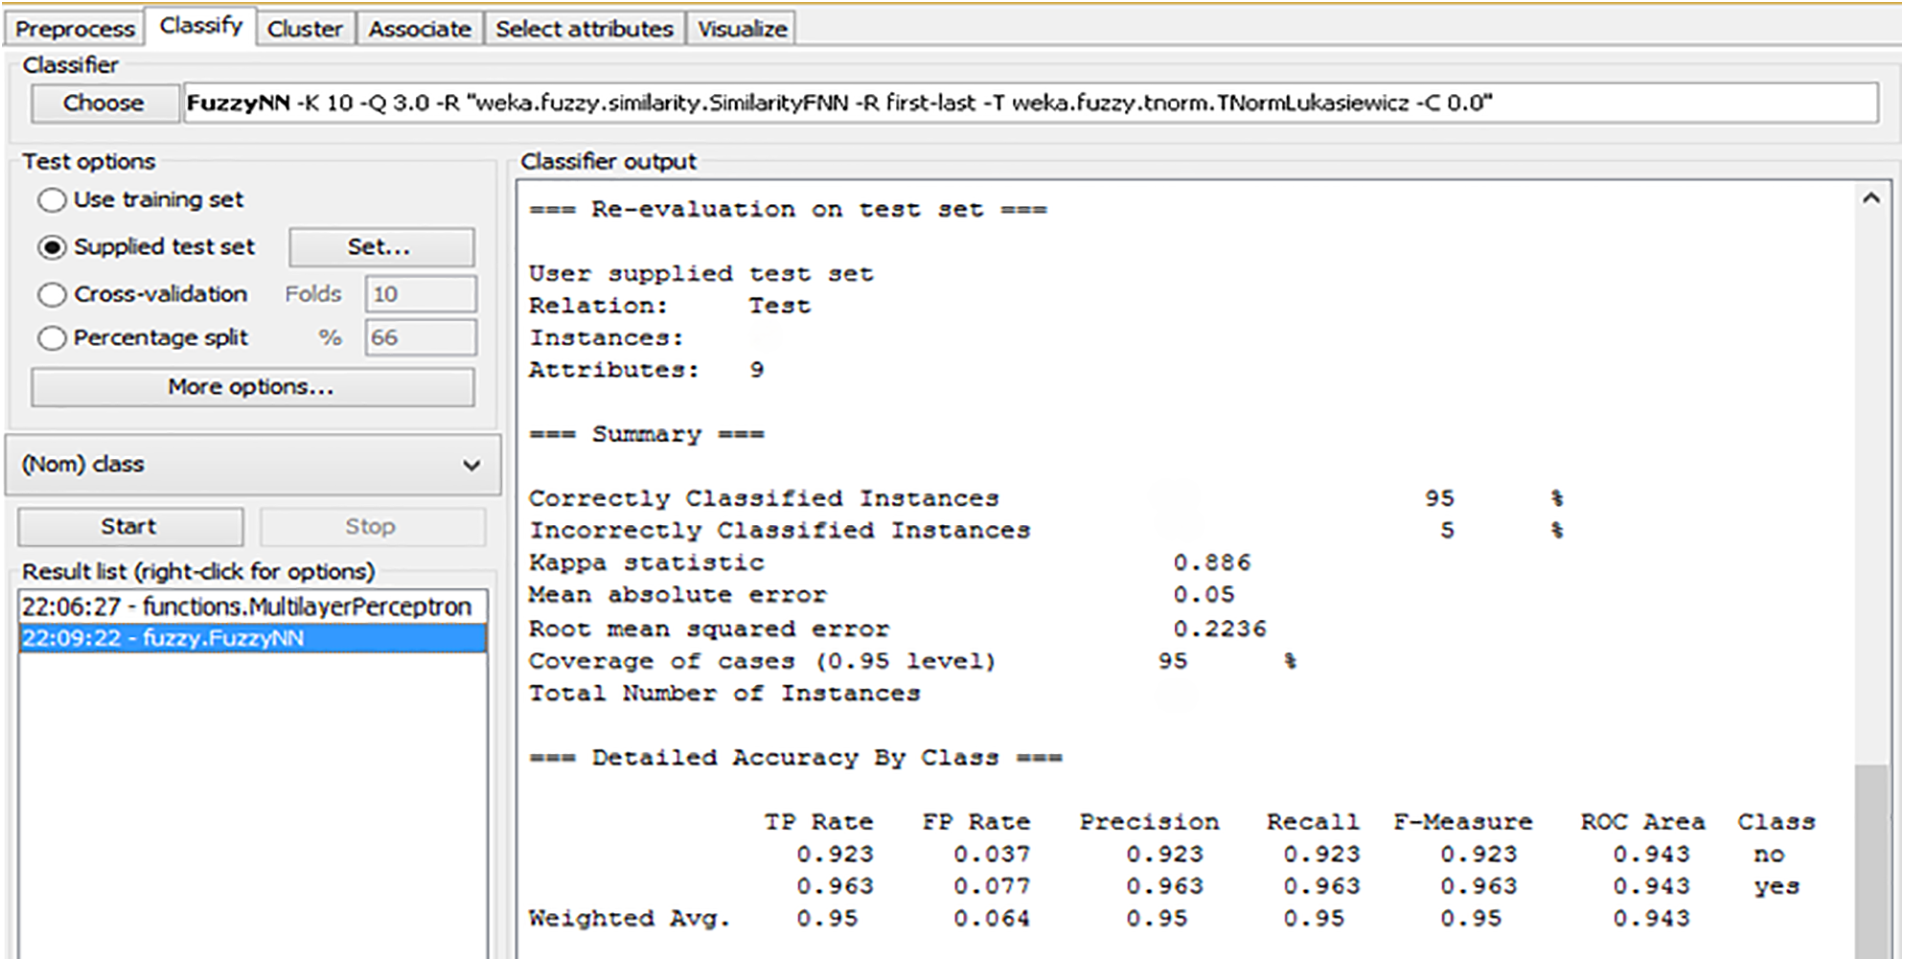
Figure 3: Re-evaluation and outcomes of F-KNN with chi-square on test dataset
4.2 Analysis of ANN with Chi-Square with Test and Training Data Set
Fig. 4 presents the evaluation results of the Artificial Neural Network (ANN) model on a training dataset. The model achieved perfect performance with 100% of the instances correctly classified, indicating that it could predict all cases perfectly. The Kappa statistic is 1, which confirms a perfect agreement between the predicted and actual classes, meaning there were no discrepancies in classification. The Mean Absolute Error (MAE) is 0.0055, which is extremely low, suggesting the model’s predictions were very close to the actual values. The Root Mean Squared Error (RMSE) is also low at 0.0063, further demonstrating the accuracy of the model. Looking at the performance in detail for individual classes, the model shows an impressive precision, recall, and F-measure of 1.0 for both the “no” and “yes” classes. It means that the model perfectly identifies both classes without any false positives or false negatives. Additionally, the ROC Area for both classes is 1, which indicates that the model has perfect discrimination between the classes, correctly distinguishing between the “no” and “yes” outcomes. Overall, these results suggest that the MLP model, when applied with Chi-Square feature selection, is highly effective and capable of achieving flawless classification performance on the training dataset.
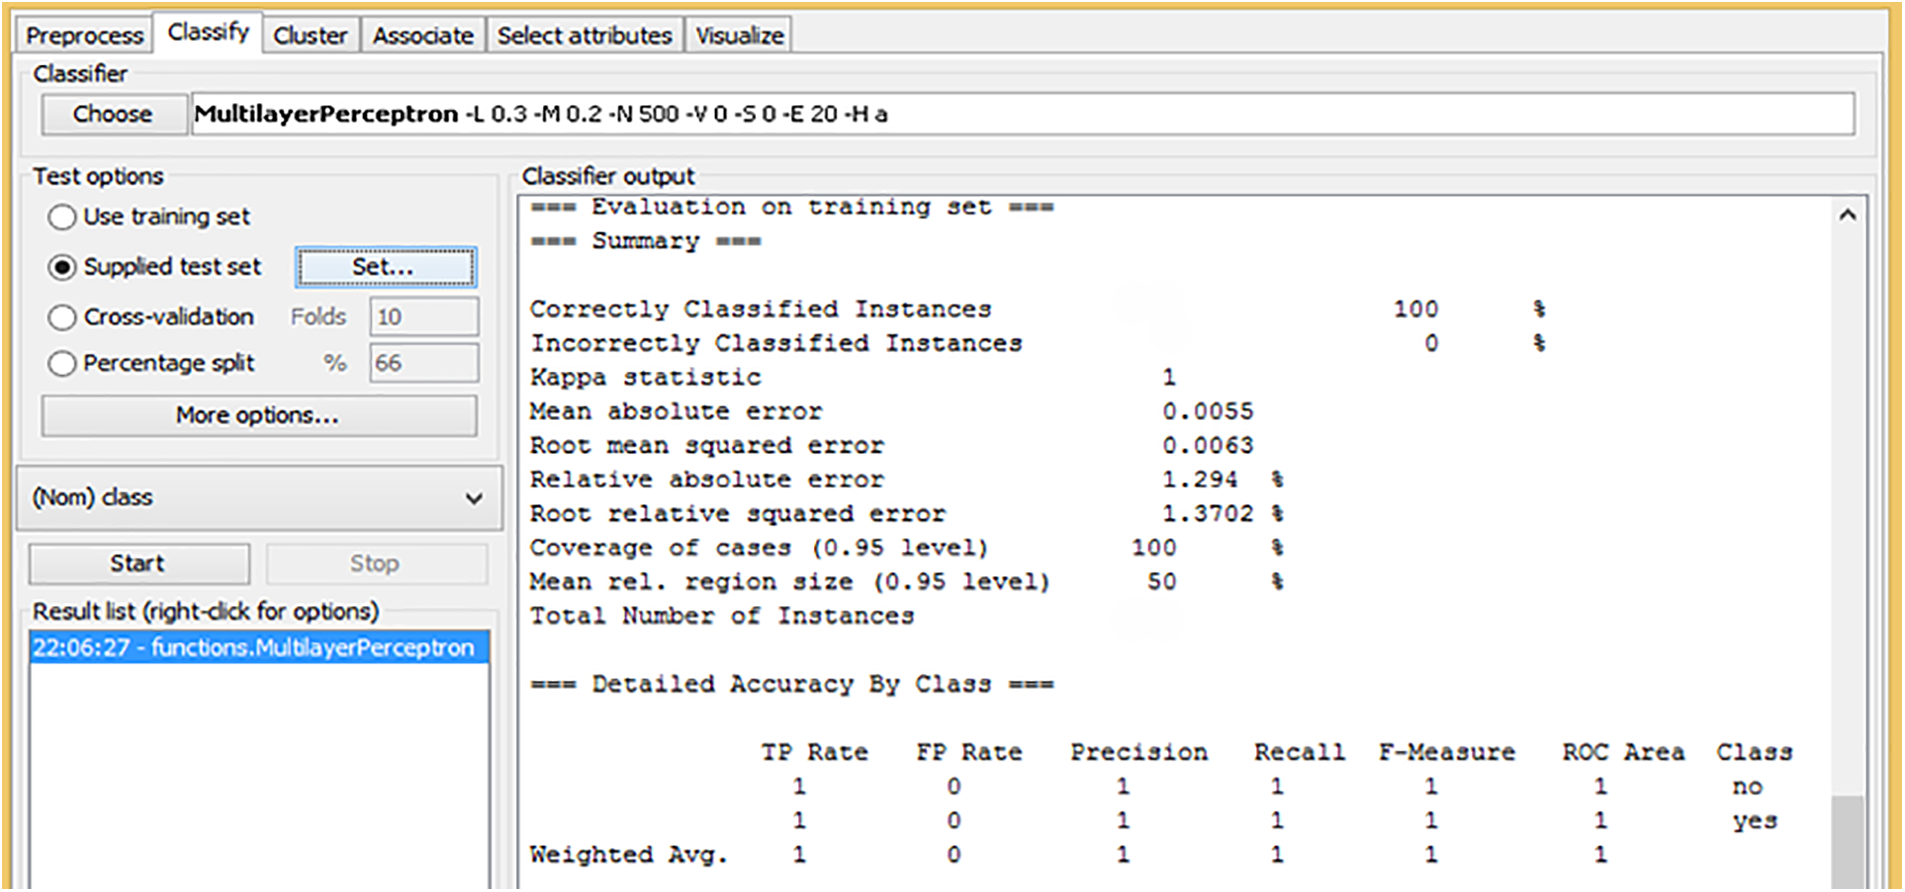
Figure 4: Training of ANN with chi-square
Fig. 5 shows the re-evaluation results of the Artificial Neural Network (ANN) model on a test dataset. The model correctly classified 91.25% of the instances, with only 8.75% misclassified. The Kappa statistic of 0.8064 reflects a strong agreement between the predicted and actual values, indicating that the model performs well but leaves room for improvement. The Mean Absolute Error (MAE) is 0.1034, which is relatively low, suggesting that the model’s predictions are generally accurate. The Root Mean Squared Error (RMSE) of 0.2686 is higher than the MAE, indicating slightly more variation in the model’s errors. For class-specific performance, the model shows a precision of 0.828 and a recall of 0.873 for the “no” class, meaning that it is good at identifying the “no” instances but might miss a few true negatives. For the “yes” class, the precision is higher at 0.961 and recall at 0.907, indicating that the model is more precise in classifying “yes” instances and has a slightly higher chance of missing them compared to the “no” class. The F-measure scores for both classes are also relatively high, with 0.873 for “no” and 0.914 for “yes”, indicating a good balance between precision and recall. The ROC Area score of 0.905 for both classes indicates the model has strong discriminatory ability. Overall, the results suggest that while the ANN model performs well on the test dataset, there is still room for refinement to improve its classification capabilities.
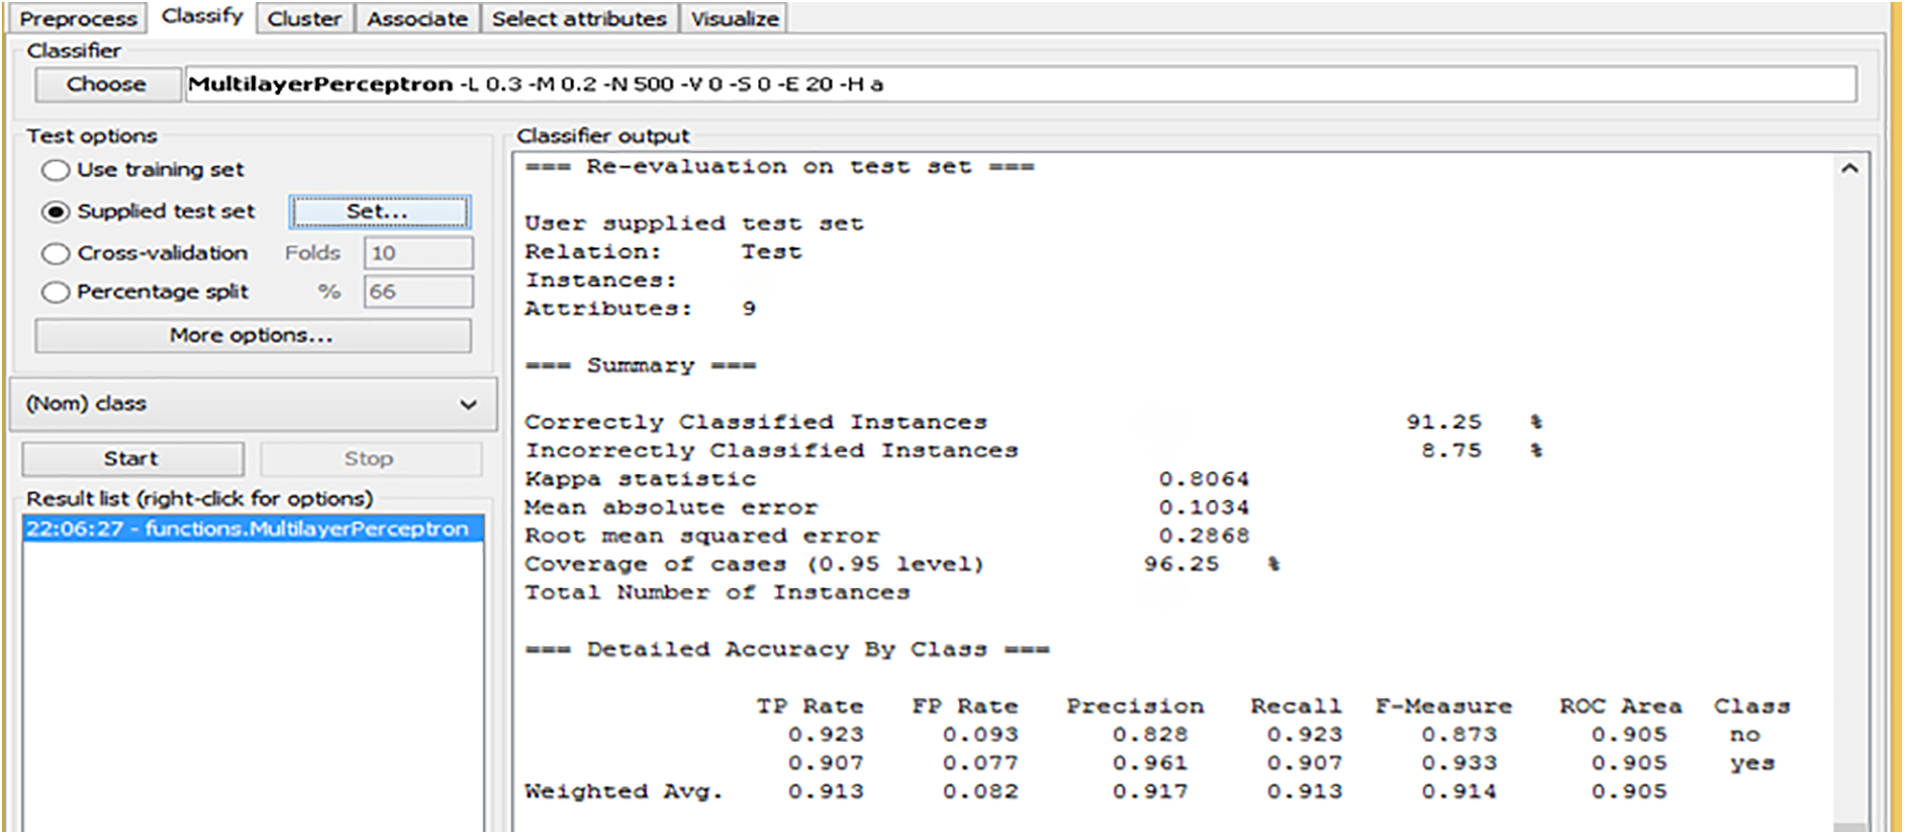
Figure 5: Re-evaluation and outcomes of the ANN Chi-Square on the test dataset
4.3 Analysis of F-KNN with Best First Search on Test and Training Data Set
Fig. 6 presents the evaluation results of the Fuzzy K-Nearest Neighbor (F-KNN) model on a training dataset. The model achieved a high level of accuracy, correctly classifying 98.33% of the instances, with only 1.67% of instances being misclassified. The Kappa statistic of 0.9597 indicates a strong agreement between the predicted and actual classifications, showing that the model performs very well. The Mean Absolute Error (MAE) is 0.0167, which is quite low, indicating that the model’s predictions are very close to the true values. Additionally, the Root Mean Squared Error (RMSE) of 0.1291 and the Relative Absolute Error (RAE) of 3.95% suggest that the model performs with high accuracy and minimal error. Looking at class-specific performance, the model shows excellent results for both classes. The “no” class achieved a precision of 0.977 and a recall of 0.944, resulting in an F-measure of 0.971. It indicates the model’s ability to correctly identify “no” instances while balancing precision and recall. For the “yes” class, the precision is slightly higher at 0.988, with a recall of 0.983 and an F-measure of 0.986. The ROC Area for both classes is very high, 0.972, demonstrating the model’s excellent ability to distinguish between the two classes. Overall, these results suggest that the F-KNN model, when applied to the training set with Best-First Search, is a highly effective and accurate classifier.
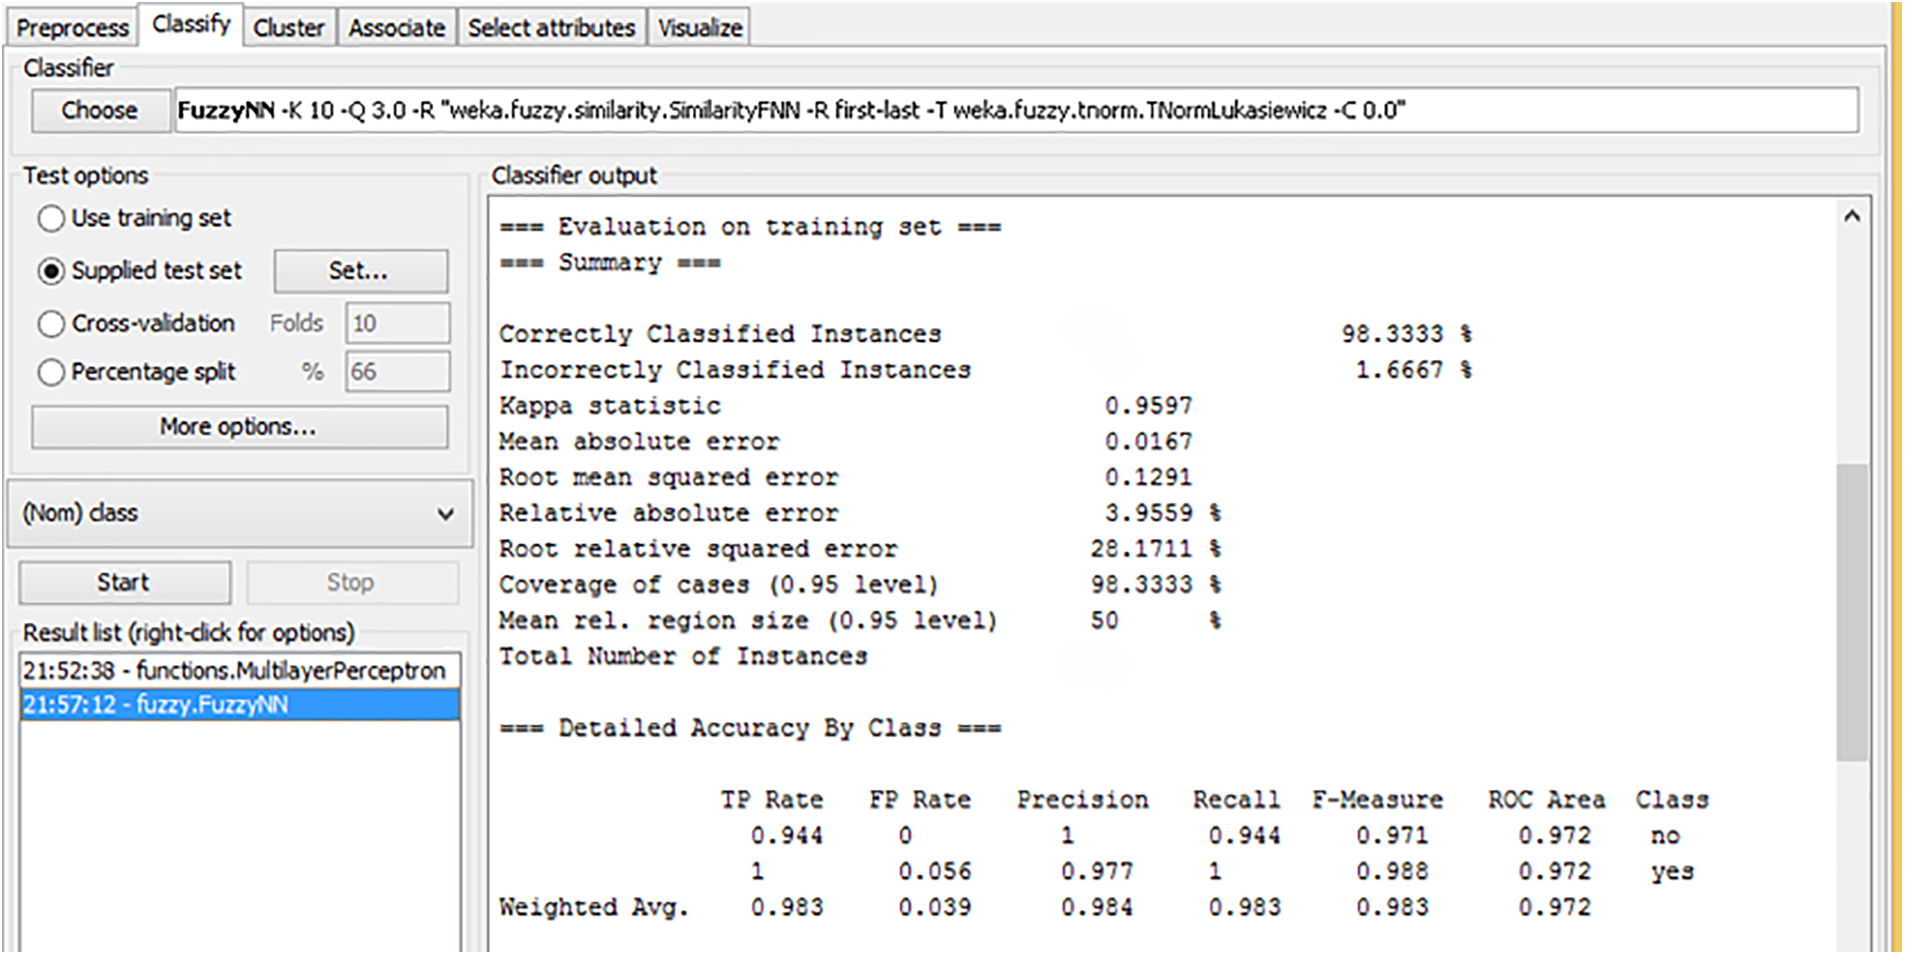
Figure 6: Training of F-KNN with best first search
Fig. 7 illustrates the re-evaluation of the Fuzzy K-Nearest Neighbor (F-KNN) model on a test dataset. The model demonstrated strong performance by correctly classifying 96.25% of the instances, leaving only 3.75% misclassified. The Kappa statistic of 0.9137 indicates a substantial agreement between the predicted and actual classifications, suggesting that the model is highly reliable. The Mean Absolute Error (MAE) is 0.0375, which is low, showing that the model’s predictions are very close to the true values. Additionally, the Root Mean Squared Error (RMSE) of 0.1936 reflects the model’s accuracy, with a relatively low error. For individual class performance, the F-KNN model achieved a precision of 0.923 and a recall of 0.964 for the “no” class, resulting in an F-measure of 0.941. It indicates that the model effectively identifies the “no” instances with a good balance between false positives and false negatives. For the “yes” class, the precision is 0.964, and the recall is 0.923, with an F-measure of 0.942. The ROC Area for both classes is 0.962, suggesting that the model has a strong discriminatory ability and can effectively distinguish between the two classes. These results demonstrate that the F-KNN model, with Best-First Search, applied to the test dataset, is an efficient and accurate classifier.
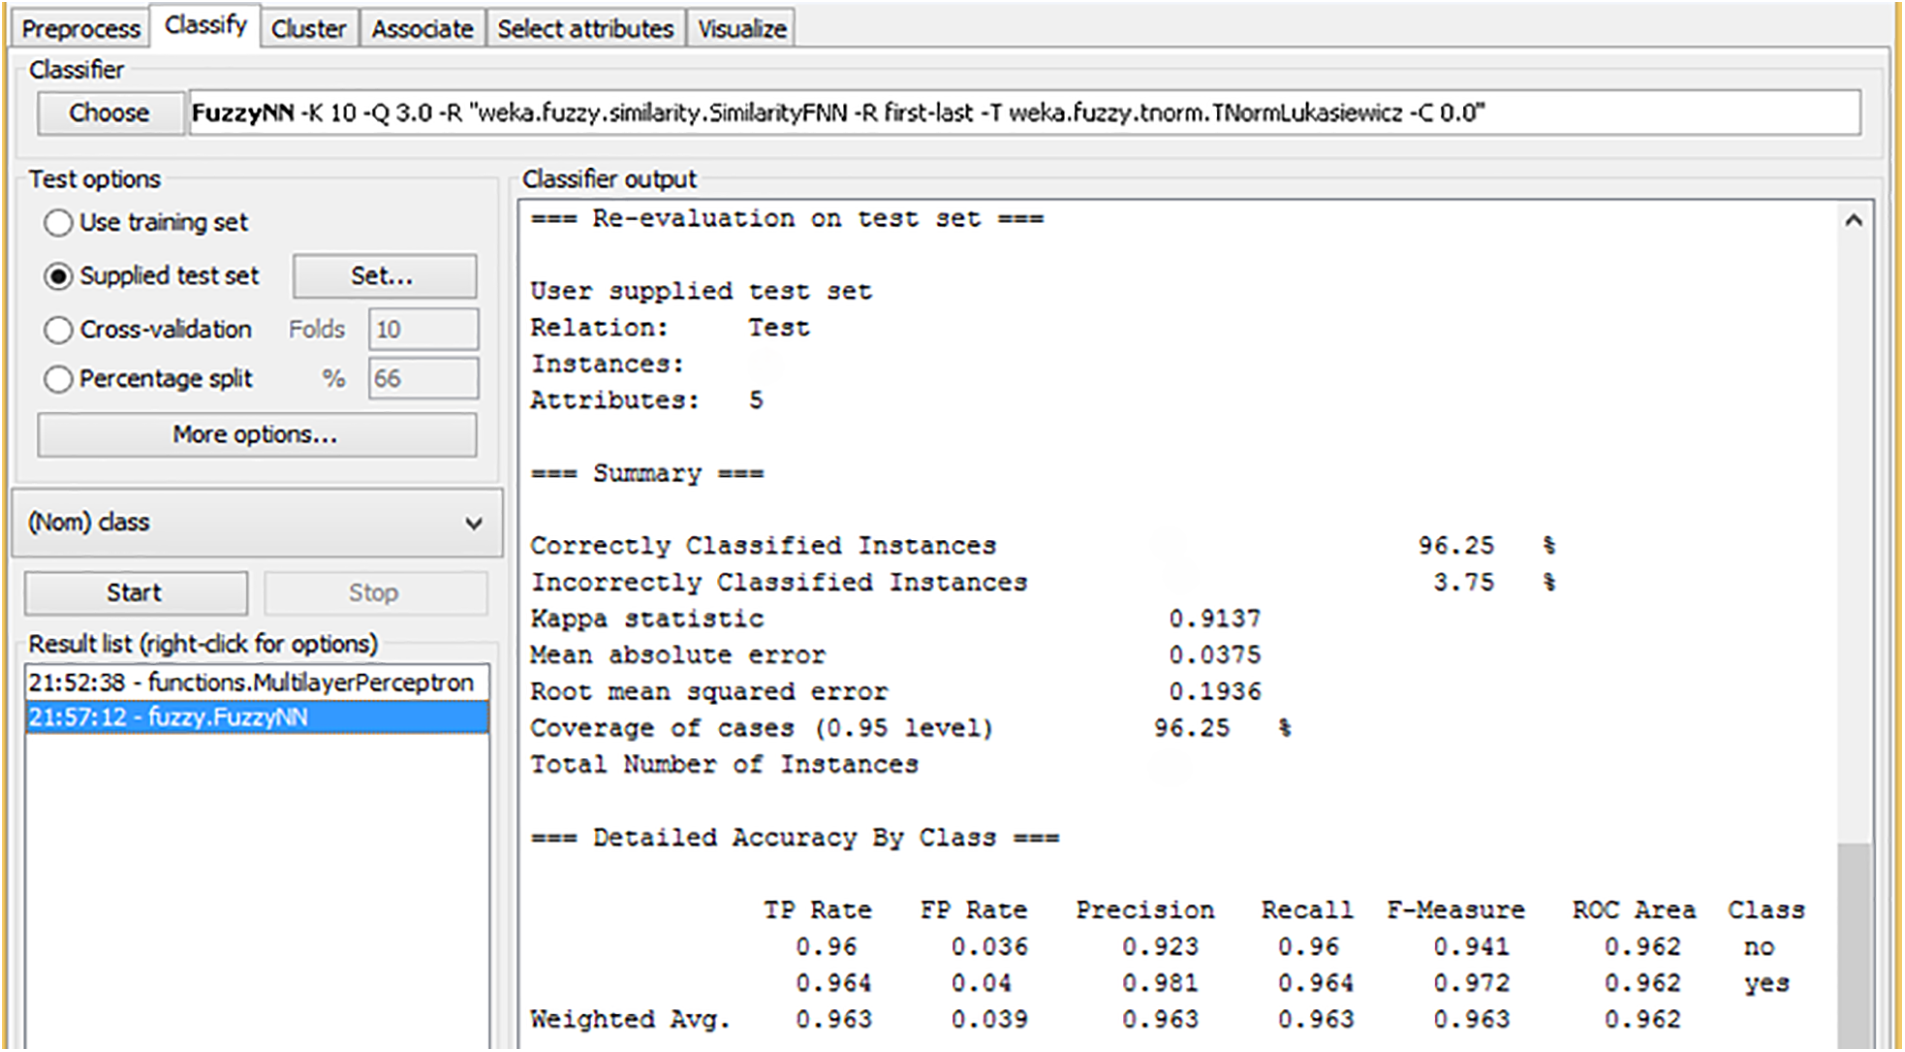
Figure 7: Re-evaluation and outcomes of F-KNN with best first search
4.4 Analysis of F-KNN with Best First Search on Test and Training Data Set
Fig. 8 presents the evaluation results of the Artificial Neural Networks (ANN) model on a training dataset. The model achieved perfect accuracy by correctly classifying all instances, as indicated by 100% correct classifications and 0% misclassifications. The Kappa statistic 1 reflects a perfect agreement between the predicted and actual classifications, highlighting that the model made no errors. The Mean Absolute Error (MAE) is 0.0061, which is very low, indicating that the model’s predictions are incredibly close to the true values. Similarly, the Root Mean Squared Error (RMSE) is 0.0069, confirming minimal error in the predictions. Looking at class-specific performance, the model shows perfect precision, recall, and F-measure values of 1 for both classes (“no” and “yes”), which means it correctly identified all instances for both classes without any false positives or false negatives. The ROC Area score for both classes is also 1, suggesting that the model has excellent discriminatory ability and can perfectly distinguish between the two classes. These results demonstrate that the ANN model, trained with the Best-First Search feature selection, is highly effective and performs flawlessly on the training dataset.
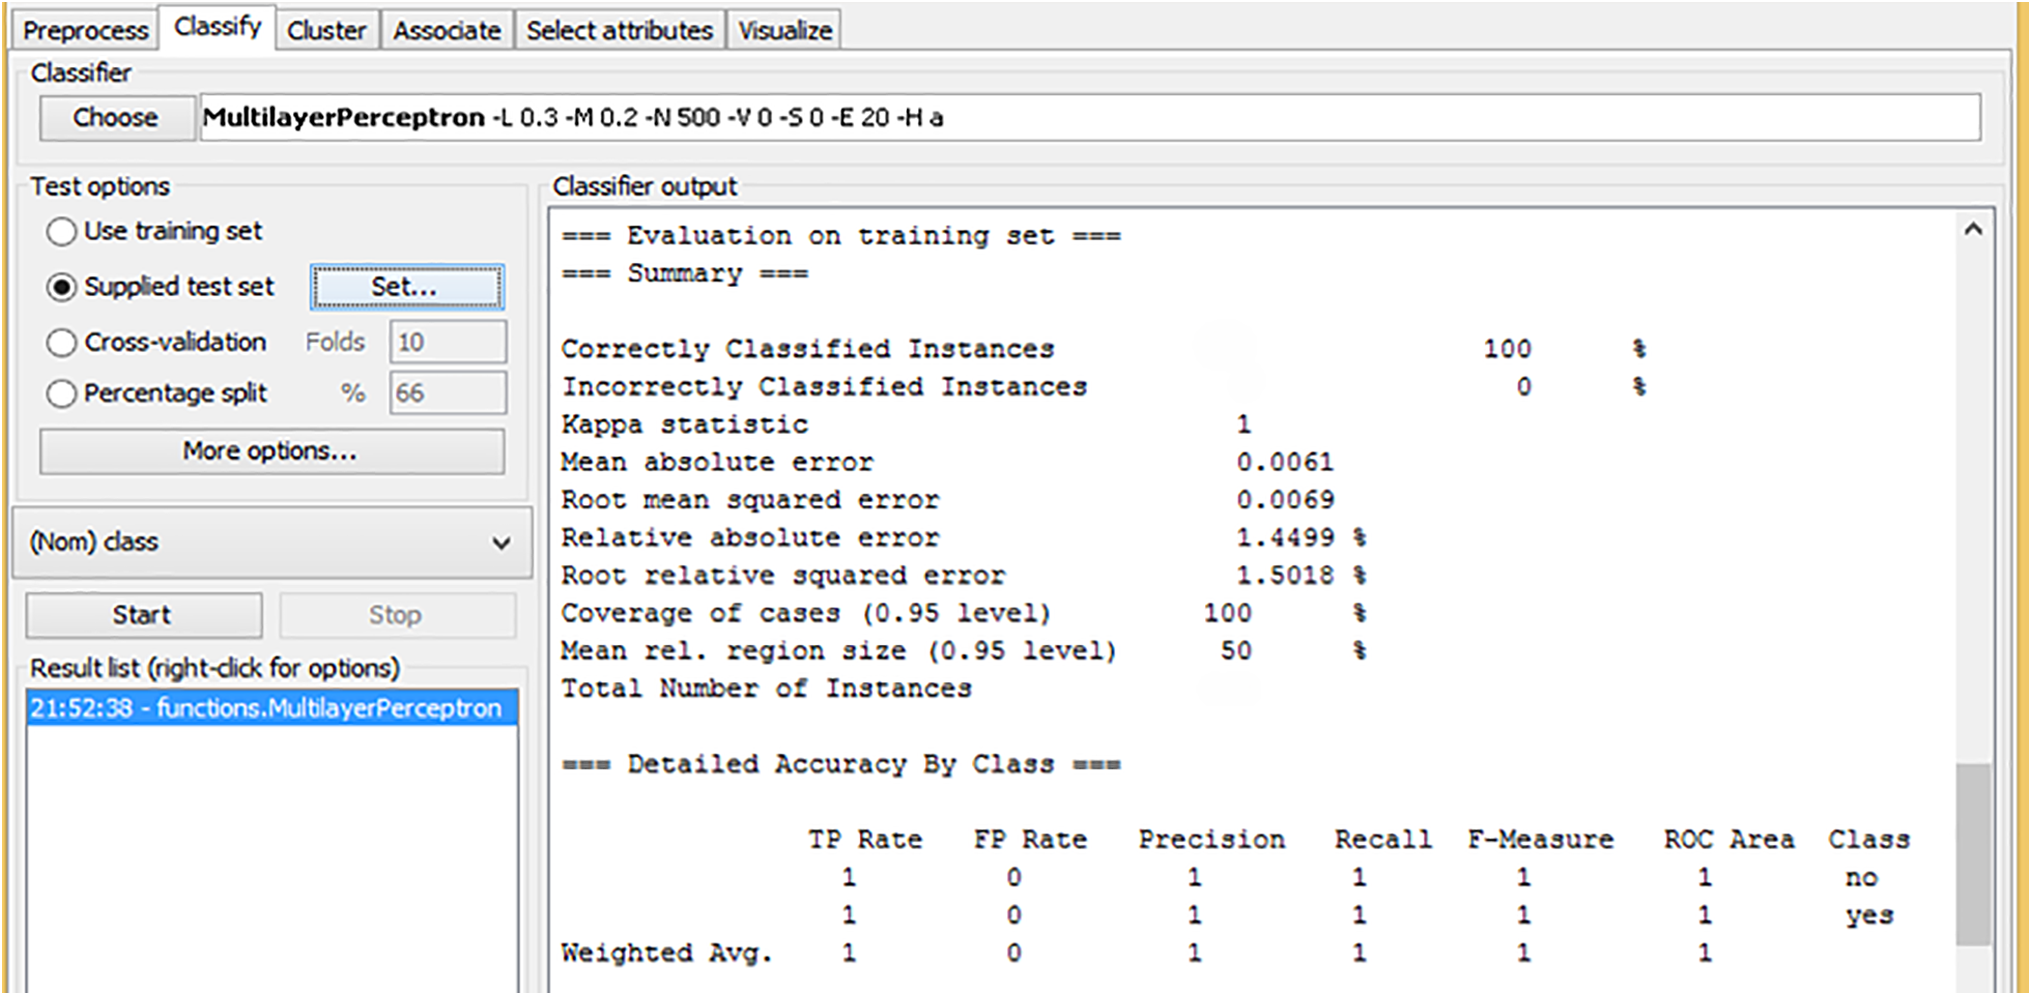
Figure 8: Training ANN with best first search
Fig. 9 shows the re-evaluation results of the Artificial Neural Networks (ANN) model on a test dataset. The model performed excellently, correctly classifying 97.5% of the instances, with only 2.5% misclassified. The Kappa statistic of 0.9418 indicates a strong agreement between the predicted and actual classifications, suggesting the model is highly reliable. The Mean Absolute Error (MAE) is 0.031, which is very low, confirming the model’s accuracy. The Root Mean Squared Error (RMSE) of 0.1571 also indicates a relatively low level of error in the predictions. Regarding class-specific performance, the model shows high precision and recall values of 0.96 for the “no” class and 0.982 for the “yes” class, indicating that it effectively identifies both classes with minimal errors. The F-measure, which balances precision and recall, is 0.96 for “no” and 0.982 for “yes,” highlighting the model’s consistency. The ROC Area score for both classes is 0.979, indicating the model has a strong discriminatory ability and can accurately distinguish between the “no” and “yes” classes. These results demonstrate that the ANN model, applied with Best-First Search, is highly effective and reliable in classifying instances in the test dataset.
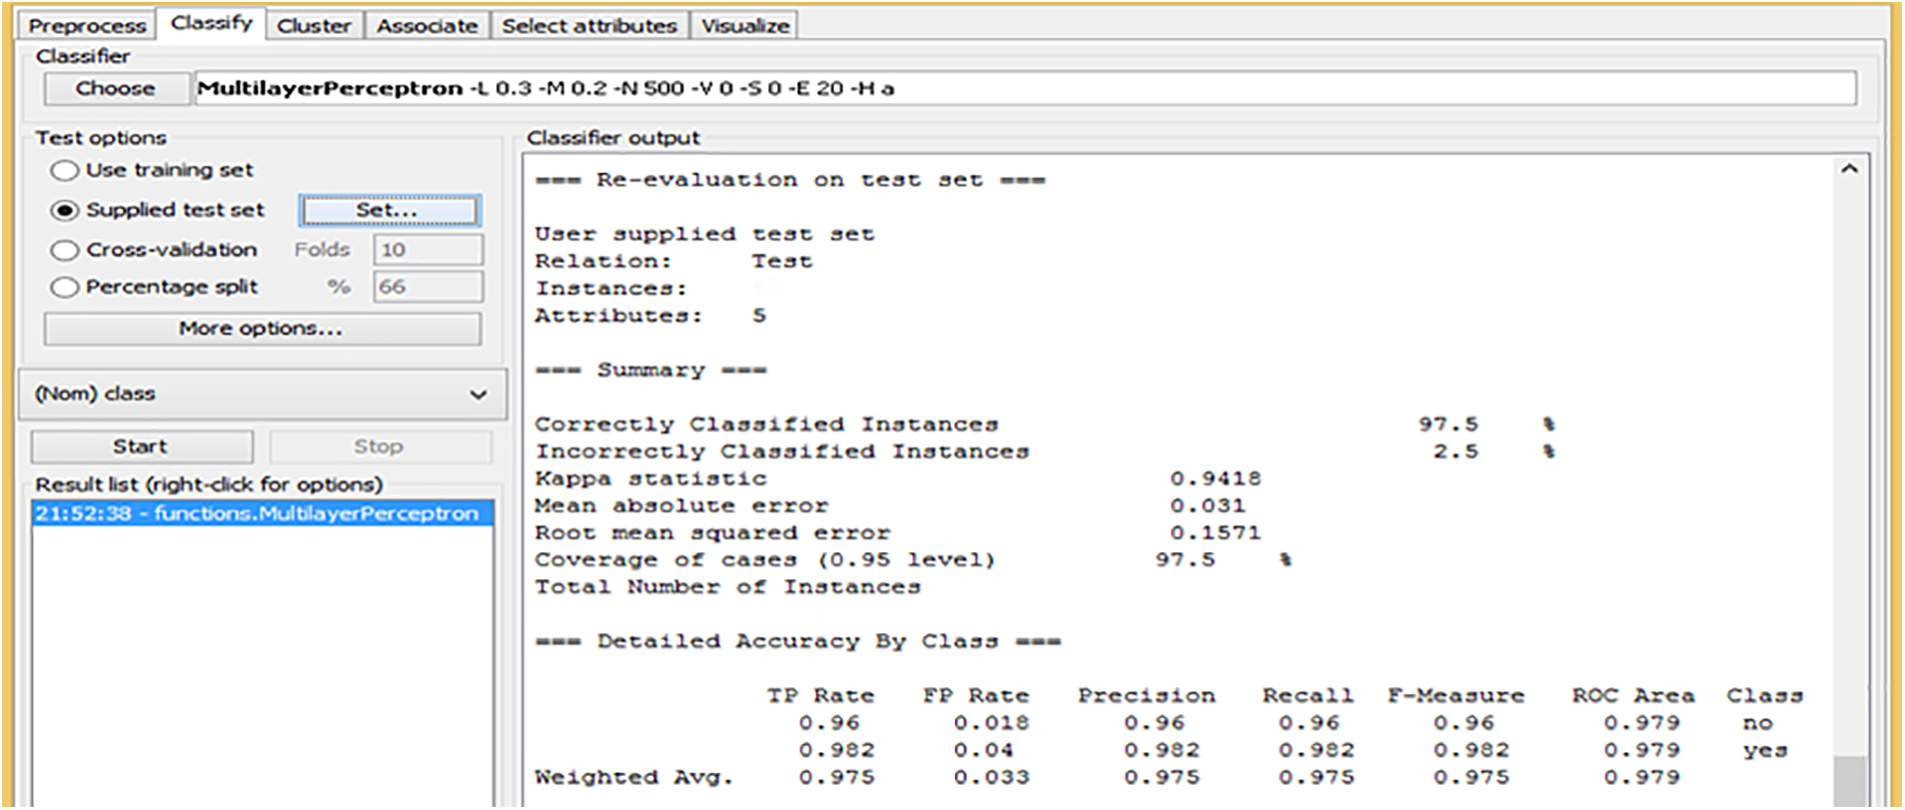
Figure 9: Re-evaluation and outcomes of ANN with BFS
The results in Table 1 highlight a comparative analysis between the Fuzz K-Nearest Neighbor (F-KNN) algorithm and the Artificial Neural Network (ANN), evaluated with two preprocessing techniques: Chi-Square and Best First Search (BFS). The comparison provides critical insights into the performance of these algorithms across multiple metrics, including accuracy, precision, recall, F-measure, ROC area, Time complexiy, and memory consumption. The results show that ANN achieves its best performance when combined with the Best First Search preprocessing technique. Specifically, ANN with BFS preprocessing achieves an impressive accuracy of 97.5%, significantly higher than the 91.4% achieved with Chi-Square. This trend extends across all other metrics, including precision, recall, and F-measure, where ANN consistently scores 97.5 with BFS compared to 91.7–91.4 with Chi-Square. Additionally, the ROC area shows a substantial improvement (97.9 for BFS vs. 90.5 for Chi-Square), reflecting superior classification capability with reduced false positives when BFS is used.
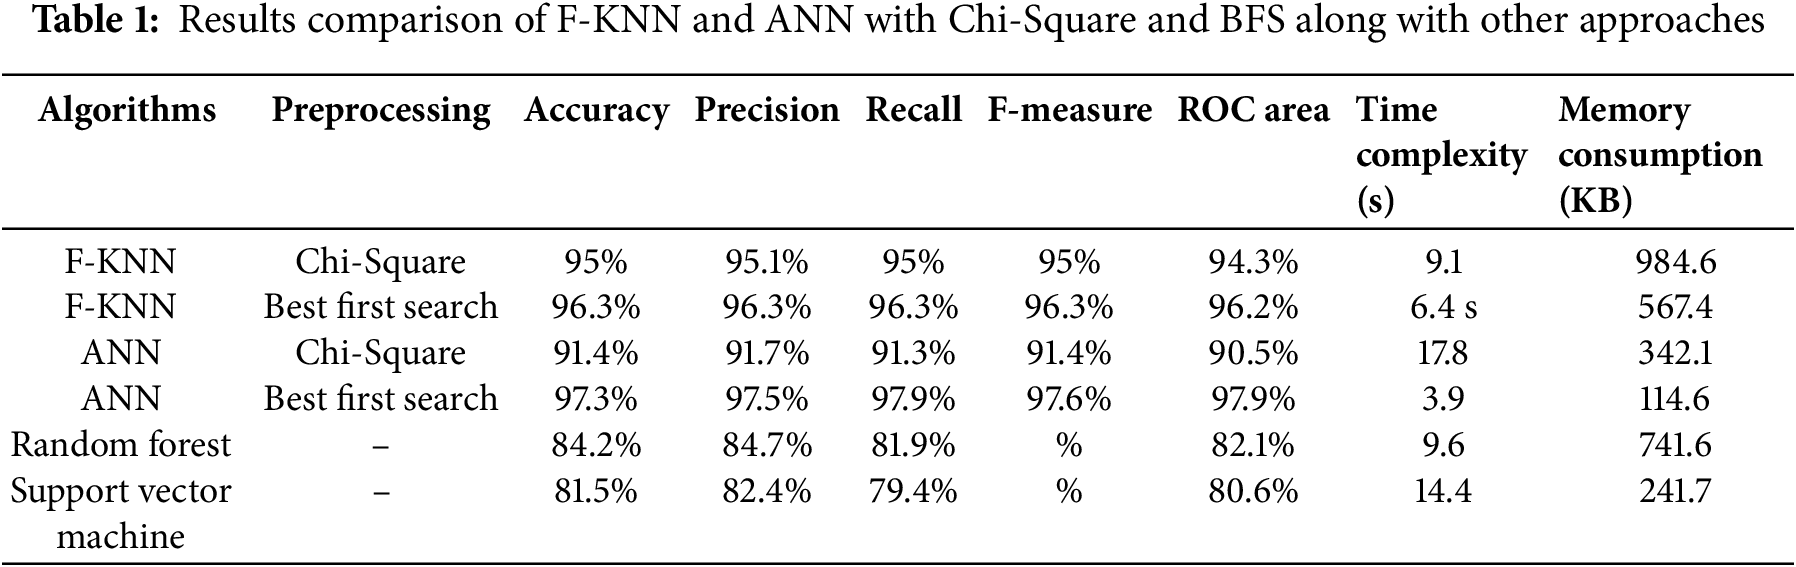
The Best First Search (BFS) method selects the best 4 features from the dataset, whereas the Chi-Square method selects 8 features. The reduction in the number of features chosen by BFS directly contributes to the observed decrease in time complexity. With fewer features, the algorithms are able to perform calculations faster, resulting in a shorter processing time. For both F-KNN and ANN, the time complexity is lower when using BFS (F-KNN with BFS: 6.4 s, ANN with BFS: 3.9 s) compared to using the Chi-Square method (F-KNN with Chi-Square: 9.1 s, ANN with Chi-Square: 17.8 s). The smaller number of features selected by BFS reduces the computational load, allowing the algorithms to run more efficiently and in less time. The memory consumption for F-KNN with Chi-Square is 984.6 KB, while for F-KNN with BFS it is reduced to 567.4 KB. Similarly, for ANN, the memory consumption with Chi-Square is 342.1 KB, whereas with BFS it decreases to 114.6 KB. The reason for this reduction in memory usage is directly tied to the number of features selected by each method. Since Chi-Square selects 8 features and BFS selects only 4, the reduced number of features with BFS results in lower memory requirements. Each feature requires a certain amount of memory to store, so by selecting fewer features, the algorithm needs less memory to process the data.
The superiority of ANN with BFS can be attributed to the inherent strengths of the Best First Search approach. BFS is a greedy search algorithm that selects the most relevant features by evaluating them iteratively, ensuring that only the most informative inputs are passed to the model. This process significantly reduces noise and irrelevant data, which can otherwise dilute the effectiveness of a complex algorithm like ANN. Neural networks thrive on high-quality input data, and BFS enhances this by narrowing the feature space to the most critical attributes. On the other hand, while Chi-Square is effective for ranking features based on their statistical relevance, it might overlook certain nonlinear relationships that BFS captures more effectively. Comparatively, F-KNN also performs well, especially with BFS preprocessing, achieving 96.3% accuracy. However, its commendable performance falls short of the ANN-BFS combination. It is likely because F-KNN relies on distance-based similarity measures, which are inherently less adaptable to complex patterns in data. As a deep learning algorithm, ANN is inherently better at capturing and learning intricate patterns, provided the input data is well-optimized-a condition BFS fulfills. These results underline the critical role of preprocessing in optimizing algorithm performance. They also reinforce the suitability of ANN as a robust algorithm for data classification tasks, particularly when paired with effective feature selection methods like BFS. This finding is pivotal, as it validates the choice of ANN for complex classification problems and demonstrates the importance of preprocessing in achieving state-of-the-art results.
The proposed methodology excels compared to existing schemes by integrating Fuzzy K-Nearest Neighbor (F-KNN) and Artificial Neural Networks (ANN) with advanced feature selection techniques like Chi-Square and Best First Search (BFS). Unlike traditional approaches that often prioritize accuracy alone, this framework ensures a comprehensive evaluation of key metrics, including precision, recall, F1-score, and ROC area. The BFS technique stands out for its iterative and heuristic evaluation, selecting only the most relevant features and thereby reducing noise and computational overhead. This refinement enables the ANN model, in particular, to capture complex nonlinear relationships more effectively than previous methods. Compared to models that rely on broader, less targeted feature selection like Principal Component Analysis (PCA) or simpler statistical techniques, the proposed approach delivers superior predictive performance with a notable accuracy of 97.5%. By addressing dataset imbalances and optimizing input quality, the proposed approach ensures reliable and interpretable stroke prediction, a critical improvement over existing schemes.
The research presented in this paper explores the application of machine learning algorithms, particularly Fuzzy K-Nearest Neighbors (F-KNN) and Artificial Neural Networks (ANN), in predicting stroke diseases. It demonstrates the effectiveness of integrating these methods with advanced feature selection techniques, such as Chi-Square and Best First Search, to improve classification models’ precision, recall, and overall accuracy. The study emphasizes the critical role of preprocessing in refining datasets and highlights how the choice of preprocessing method directly impacts model performance. The results show that F-KNN and ANN are effective classifiers for stroke prediction. F-KNN, when combined with Best First Search, achieved high accuracy and demonstrated robust performance, particularly in balancing precision and recall across classes. It provided reliable results and maintained strong discriminatory ability, as evidenced by its high ROC scores. However, ANN emerged as the superior model when paired with Best First Search, achieving the highest accuracy, precision, recall, and F-measure levels among all tested configurations. The careful selection of features significantly enhanced ANN’s ability to learn complex patterns and relationships in the data, making it a highly effective tool for medical predictions. The comparison between Chi-Square and Best First Search preprocessing methods highlights the importance of feature selection in optimizing model performance. While Chi-Square proved effective in ranking features based on statistical significance, Best First Search offered a more refined approach by identifying the most informative features through iterative evaluation. This improvement in data quality allowed the models, especially ANN, to achieve higher accuracy and reduced error rates. These findings underscore the need for tailored preprocessing strategies that align with the specific characteristics of the data and the chosen machine learning algorithm.
Future Research Directions
Future research can focus on integrating more extensive and diverse datasets, including data from different regions, healthcare systems, and demographics. It will help address potential biases and improve the models’ generalizability across various patient populations. Including additional features such as genetic markers, lifestyle factors, and detailed medical histories can further refine the predictions. Secondly, developing hybrid models that combine the strengths of multiple machine learning algorithms could enhance performance. For instance, integrating Fuzzy K-Nearest Neighbors (F-KNN) with Artificial Neural Networks (ANN) or other advanced techniques like ensemble learning or deep learning could lead to higher accuracy and robustness models.
Acknowledgement: The authors are thankful to the Information System Study Program, Faculty of Science and Technology, Universitas Airlangga, Indonesia, for the support.
Funding Statement: This work is funded by FCT/MECI through national funds and, when applicable, co-funded EU funds under UID/50008: Instituto de Telecomunicações.
Author Contributions: Abdul Ahad conceptualized the study, developed the methodology, conducted data analysis, and wrote the original draft. Ira Puspitasari, Jiangbin Zheng, and Sheikh Tahir Bakhsh provided supervision throughout the project. Shamsher Ullah contributed to data analysis, validation, and reviewing the manuscript. Farhan Ullah contributed to the conceptualization, methodology, and validation of the study. Ivan Miguel Pires contributed to the review editing, and supervision of the research. All authors reviewed the results and approved the final version of the manuscript.
Availability of Data and Materials: The data and materials used in this study can be made available upon request to the first author.
Ethics Approval: Not applicable.
Conflicts of Interest: The authors declare no conflicts of interest to report regarding the present study.
Appendix A
References
1. Dohler M, Saikali S, Gamal A, Moschovas MC, Patel V. The crucial role of 5G, 6G, and fiber in robotic telesurgery. J Robot Surg. 2025;19(1):1–12. doi:10.1007/s11701-024-02164-6. [Google Scholar] [PubMed] [CrossRef]
2. Benjamin EJ, Muntner P, Alonso A, Bittencourt MS, Callaway CW, Carson AP, et al. Heart disease and stroke statistics-2019 update: a report from the American Heart Association. Circulation. 2019;139(10):e56–28. doi:10.1161/CIR.0000000000000659. [Google Scholar] [PubMed] [CrossRef]
3. Al-Khatib SM, Singh JP, Ghanbari H, McManus DD, Deering TF, Silva JNA, et al. The potential of artificial intelligence to revolutionize health care delivery, research, and education in cardiac electrophysiology. Heart Rhythm. 2024;21(6):978–89. doi:10.1016/j.hrthm.2024.04.053. [Google Scholar] [PubMed] [CrossRef]
4. Kumar A, Kumar P, Srivastava A, Ambeth Kumar VD, Vengatesan K, Singhal A. Comparative analysis of data mining techniques to predict heart disease for diabetic patients. In: Advances in Computing and Data Sciences: 4th International Conference, ICACDS 2020; 2020 April 24–25; Valletta, Malta: Springer Singapore. p. 507–18. [Google Scholar]
5. Manonmani M, Balakrishnan S. A review of semantic annotation models for analysis of healthcare data based on data mining techniques. Emerg Res Data Eng Syst Comput Commun. 2020;1054:231–8. doi:10.1007/978-981-15-0135-7. [Google Scholar] [CrossRef]
6. Arif M, Akram MU, Minhas FA. Pruned fuzzy K-nearest neighbor classifier for beat classification. J Biomed Sci Eng. 2010;3(4):380. doi:10.4236/jbise.2010.34053. [Google Scholar] [CrossRef]
7. Dritsas E, Trigka M. Stroke risk prediction with machine learning techniques. Sensors. 2022;22(13):4670. doi:10.3390/s22134670. [Google Scholar] [PubMed] [CrossRef]
8. Fadnavis R, Dhore K, Gupta D, Waghmare J, Kosankar D. Heart disease prediction using data mining. J Phy: Conf Ser. 2021;1913:012099. doi:10.1088/1742-6596/1913/1/012099. [Google Scholar] [CrossRef]
9. Nwosu CS, Dev S, Bhardwaj P, Veeravalli B, John D. Predicting stroke from electronic health records. In: 2019 41st Annual International Conference of the IEEE Engineering in Medicine and Biology Society (EMBC); 2019; Berlin, Germany: IEEE. p. 5704–7. doi:10.1109/EMBC.2019.8857234. [Google Scholar] [PubMed] [CrossRef]
10. Preetha J, Raju S, Abhishek K, Sayyad S, Vengatesan R. Data mining technique based critical disease prediction in medical field. Intell Syst Comput Technol. 2020;37:104. [Google Scholar]
11. Alghamdi FA, Almanaseer H, Jaradat G, Jaradat A, Alsmadi MK, Jawarneh S, et al. Multilayer perceptron neural network with arithmetic optimization algorithm-based feature selection for cardiovascular disease prediction. Mach Learn Knowl Extract. 2024;6(2):987–1008. doi:10.3390/make6020046. [Google Scholar] [CrossRef]
12. Induja SN, Raji CG. Computational methods for predicting chronic disease in healthcare communities. In: 2019 International Conference on Data Science and Communication (IconDSC); 2019; Bangalore, India: IEEE. p. 1–6. doi:10.1109/IconDSC.2019.8817044. [Google Scholar] [CrossRef]
13. Daza A, Bobadilla J, Herrera JC, Medina A, Saboya N, Zavaleta K, et al. Stacking ensemble based hyperparameters to diagnosing of heart disease: future works. Resu Eng. 2024;21(12):101894. doi:10.1016/j.rineng.2024.101894. [Google Scholar] [CrossRef]
14. Narayanana J. Implementation of efficient machine learning techniques for prediction of cardiac disease using SMOTE. Procedia Comput Sci. 2024;233(1):558–69. doi:10.1016/j.procs.2024.03.245. [Google Scholar] [CrossRef]
15. Mridha K, Ghimire S, Shin J, Aran A, Uddin MM, Mridha MF. Automated stroke prediction using machine learning: an explainable and exploratory study with a web application for early intervention. IEEE Access. 2023;11:52288–308. doi:10.1109/ACCESS.2023.3278273. [Google Scholar] [CrossRef]
16. McHugh ML. The chi-square test of independence. Biochemia Medica. 2013;23(2):143–9. doi:10.11613/BM.2013.018. [Google Scholar] [PubMed] [CrossRef]
17. Ahad A, Jiangbina Z, Tahir M, Shayea I, Sheikh MA, Rasheed F. 6G and intelligent healthcare: taxonomy, technologies, open issues and future research directions. Internet Things. 2024;25(7):101068. doi:10.1016/j.iot.2024.101068. [Google Scholar] [CrossRef]
18. Butt HA, Ahad A, Wasim M, Madeira F, Chamran MK. 5G and IoT for intelligent healthcare: AI and machine learning approaches–a review. In: Smart objects and technologies for social good. 2023; October; Cham: Springer Nature Switzerland; 2023 Oct. p. 107–23. [Google Scholar]
Cite This Article
 Copyright © 2025 The Author(s). Published by Tech Science Press.
This work is licensed under a Creative Commons Attribution 4.0 International License , which permits unrestricted use, distribution, and reproduction in any medium, provided the original work is properly cited.
 Downloads
 Citation Tools