
 Submit a Paper
 Propose a Special lssue
 Open Access
ARTICLE

Metaheuristic-Driven Abnormal Traffic Detection Model for SDN Based on Improved Tyrannosaurus Optimization Algorithm
School of Computer Science, Hubei University of Technology, Wuhan, 430068, China
* Corresponding Author: Jiahui Chen. Email:
(This article belongs to the Special Issue: Metaheuristic-Driven Optimization Algorithms: Methods and Applications)
Computers, Materials & Continua 2025, 83(3), 4495-4513. https://doi.org/10.32604/cmc.2025.062189
Received 12 December 2024; Accepted 19 February 2025; Issue published 19 May 2025
 View Full Text
 Download PDF
Abstract
Nowadays, abnormal traffic detection for Software-Defined Networking (SDN) faces the challenges of large data volume and high dimensionality. Since traditional machine learning-based detection methods have the problem of data redundancy, the Metaheuristic Algorithm (MA) is introduced to select features before machine learning to reduce the dimensionality of data. Since a Tyrannosaurus Optimization Algorithm (TROA) has the advantages of few parameters, simple implementation, and fast convergence, and it shows better results in feature selection, TROA can be applied to abnormal traffic detection for SDN. However, TROA suffers from insufficient global search capability, is easily trapped in local optimums, and has poor search accuracy. Then, this paper tries to improve TROA, namely the Improved Tyrannosaurus Optimization Algorithm (ITROA). It proposes a metaheuristic-driven abnormal traffic detection model for SDN based on ITROA. Finally, the validity of the ITROA is verified by the benchmark function and the UCI dataset, and the feature selection optimization operation is performed on the InSDN dataset by ITROA and other MAs to obtain the optimized feature subset for SDN abnormal traffic detection. The experiment shows that the performance of the proposed ITROA outperforms compared MAs in terms of the metaheuristic-driven model for SDN, achieving an accuracy of 99.37% on binary classification and 96.73% on multiclassification.Keywords
Traditional networks are being pushed to their limitations by social media, mobile devices, and cloud computing [1]. The traditional network architecture model has many problems with protocols and closed models. Software-Defined Networking (SDN) [2] is an emerging networking paradigm that gives hope to change the limitations of current network infrastructures [3]. It was first described as a method for designing, constructing, and maintaining networks that divide the control and forwarding planes. It allows the network control to be directly programmable and the underlying infrastructure to be abstracted for network services and applications [4]. However, its open interfaces and programmability can also be used maliciously, allowing attackers to use these interfaces to codify network configurations. Techniques for abnormal traffic detection can pay close attention to network traffic patterns to identify and block such threats. SDN abnormal traffic detection becomes crucial as a result.
The categories of the two main SDN abnormal traffic detection methods are rule-based and Machine learning-based. In this rule-based method, abnormal traffic detection is performed by utilizing pre-defined rules. Common rules include bandwidth limitations, latency, packet loss rate, and other traffic-related parameters. However, this method may not be successful in identifying certain new types of network attacks or abnormal conditions when faced with them. As a branch of artificial intelligence, machine learning has become a helpful ally [5]. It is a promising instrument for abnormal traffic detection because of its lightweight design and capacity to process massive amounts of data [6–8]. A machine learning-based method builds models for abnormal detection by training lots of traffic data, which learns the normal traffic patterns to create a rubric in the training phase and determines the abnormal discovery in new traffic based on the learned rubric in the detection phase.
Abnormal traffic detection for SDN based on machine learning has received some attention. Niyaz et al. [9] propose a deep learning-based multi-vector DDoS detection system in an SDN environment by using deep learning to reduce the features derived from network traffic and improve attack detection accuracy. Tang et al. [10] develop a deep neural network model for an intrusion detection system and trained the model using the NSL-KDD dataset for stream-based anomaly detection. The experiments have confirmed the great potential of deep learning methods for SDN abnormal detection. Wang et al. [11] propose a deep learning hybrid model-based abnormal traffic detection system to achieve fine detection of abnormal traffic from the surface and improve accuracy, recall, and false alarm rate compared to traditional SDN abnormal traffic detection methods. Arevalo-Herrera et al. [12] propose a machine-learning algorithm for classification attacks using the CES CIC IDS2018 dataset. Their analysis evaluates the performance of traditional machine-learning techniques, including decision trees, random forests, and a neural network architecture.
In recent years, there have been notable developments in Machine learning-based aberrant traffic identification for SDN. By extracting the network traffic features and using machine learning to classify and detect the traffic, researchers can quickly identify abnormal traffic detection. However, Machine learning-based SDN abnormal traffic detection may encounter performance bottlenecks when dealing with large-scale data and require additional designs to optimize the data processing flow. As a key step in data processing, feature selection aims to reduce the number of features to deal with the problem of data redundancy. The Metaheuristic algorithm (MA), such as the Whale Optimization Algorithm (WOA) and the Particle Swarm Optimization (PSO), can efficiently filter out the most important features by searching the solution space heuristically, thus improving the performance and accuracy of the detection.
MA is widely used in the feature selection phase for the SDN abnormal traffic detection model to raise the prediction accuracy. Stein et al. [13] utilize a genetic algorithm to select a subset of input features for the decision tree classifier, using the KDDCUP 99 dataset to train and test the classifier. The generated decision tree performs better than the decision tree constructed using all available functions, increasing the detection rate and reducing the false alarm rate for network intrusion detection. Zainal et al. [14] use a wrapper method that integrates a rough set and PSO to be a 2-tier structure of the feature selection process, and the experimental findings demonstrate that the feature subset suggested by the technique is robust and provides a better representation of the data. Mojtahedi et al. [15] utilize feature selection based on a blend of WOA and genetic algorithms to create a network intrusion detection system, which makes it great to extract features related to class labels. Lin et al. [16] take advantage of support vector machines and simulated annealing, in which support vector machines and simulated annealing can find the best selection of features to improve the accuracy of the abnormal traffic detection amount. Additionally, our prior work [17–21] has introduced relevant applications of MA for feature selection. We apply MAs skillfully to the feature selection phase of network traffic detection, aiming to substantially improve the efficiency and accuracy of detection by intelligently filtering and extracting the most representative subset of features. Based on the in-depth analysis of network traffic, this paper further focuses the research on abnormal traffic detection in SDN environments, aiming to provide more targeted and accurate solutions.
As found above, metaheuristic techniques have proved to be excellent methodologies [22]. MA offers solutions that are close to optimal without ensuring a global optimum [23]. Consequently, the quest for more effective optimization solutions has spurred the continual design of new MA [24]. A new MA named Tyrannosaurus (T-Rex) Optimization Algorithm (TROA) [25] was proposed by Sahu et al. in 2023, which simulates the T-Rex’s hunting habits. The core of the TROA is to simulate the hunting process of the T-Rex to update the position of the population, which has significant advantages such as simple design, fast searching speed, and fast convergence. Sahu et al. demonstrate the significant performance advantages TROA exhibits over various other MAs. Through experiments and comparative analyses, they find that TROA converges faster in solving optimization problems. This advantage makes TROA stand out among similar MAs and become the tool of choice in our research. The TROA uses random numbers in the hunting and chasing phases, increasing the search’s randomness. It could also result in the algorithm reaching a local optimum solution too soon within the search. To solve this problem, the TROA can be improved and optimized accordingly. Because of these problems, this paper uses four improvement strategies to improve the TROA, and the Improved Tyrannosaurus Optimization Algorithm (ITROA) is proposed. Then, a metaheuristic-driven abnormal traffic detection model for SDN based on ITROA is proposed by applying ITROA to the feature selection. The next sections of this paper are organized as follows:
• Four improvement strategies are introduced to address the limitations of TROA applied to SDN abnormal traffic detection, and ITROA is proposed. It effectively solves problems such as TROA’s tendency to fall into local optimization.
• A metaheuristic-driven abnormal traffic detection model for SDN based on ITROA is proposed. In order to improve detection efficiency and address the issue of data redundancy in the abnormal traffic detection model for SDN, the model employs ITROA for feature selection.
The subsequent sections of this paper are structured as follows. Section 2 describes the basic TROA algorithm. Section 3 proposes a metaheuristic-driven abnormal traffic detection model for SDN based on ITROA. Section 4 provides the experimental design and analysis. Section 5 summarizes this paper and outlines the limitations of this research and future research directions.
2 Tyrannosaurus Optimization Algorithm
TROA is a new bionic optimization algorithm that mimics T-Rex’s hunting behavior. It has advantages, such as fast search speed and few parameters. TROA simulates the hunting behavior of a T-Rex through three main phases: position initialization, hunt and chase, selection phase, and, ultimately, the best option. This section focuses on the second and third phases, as shown in Algorithm 1.
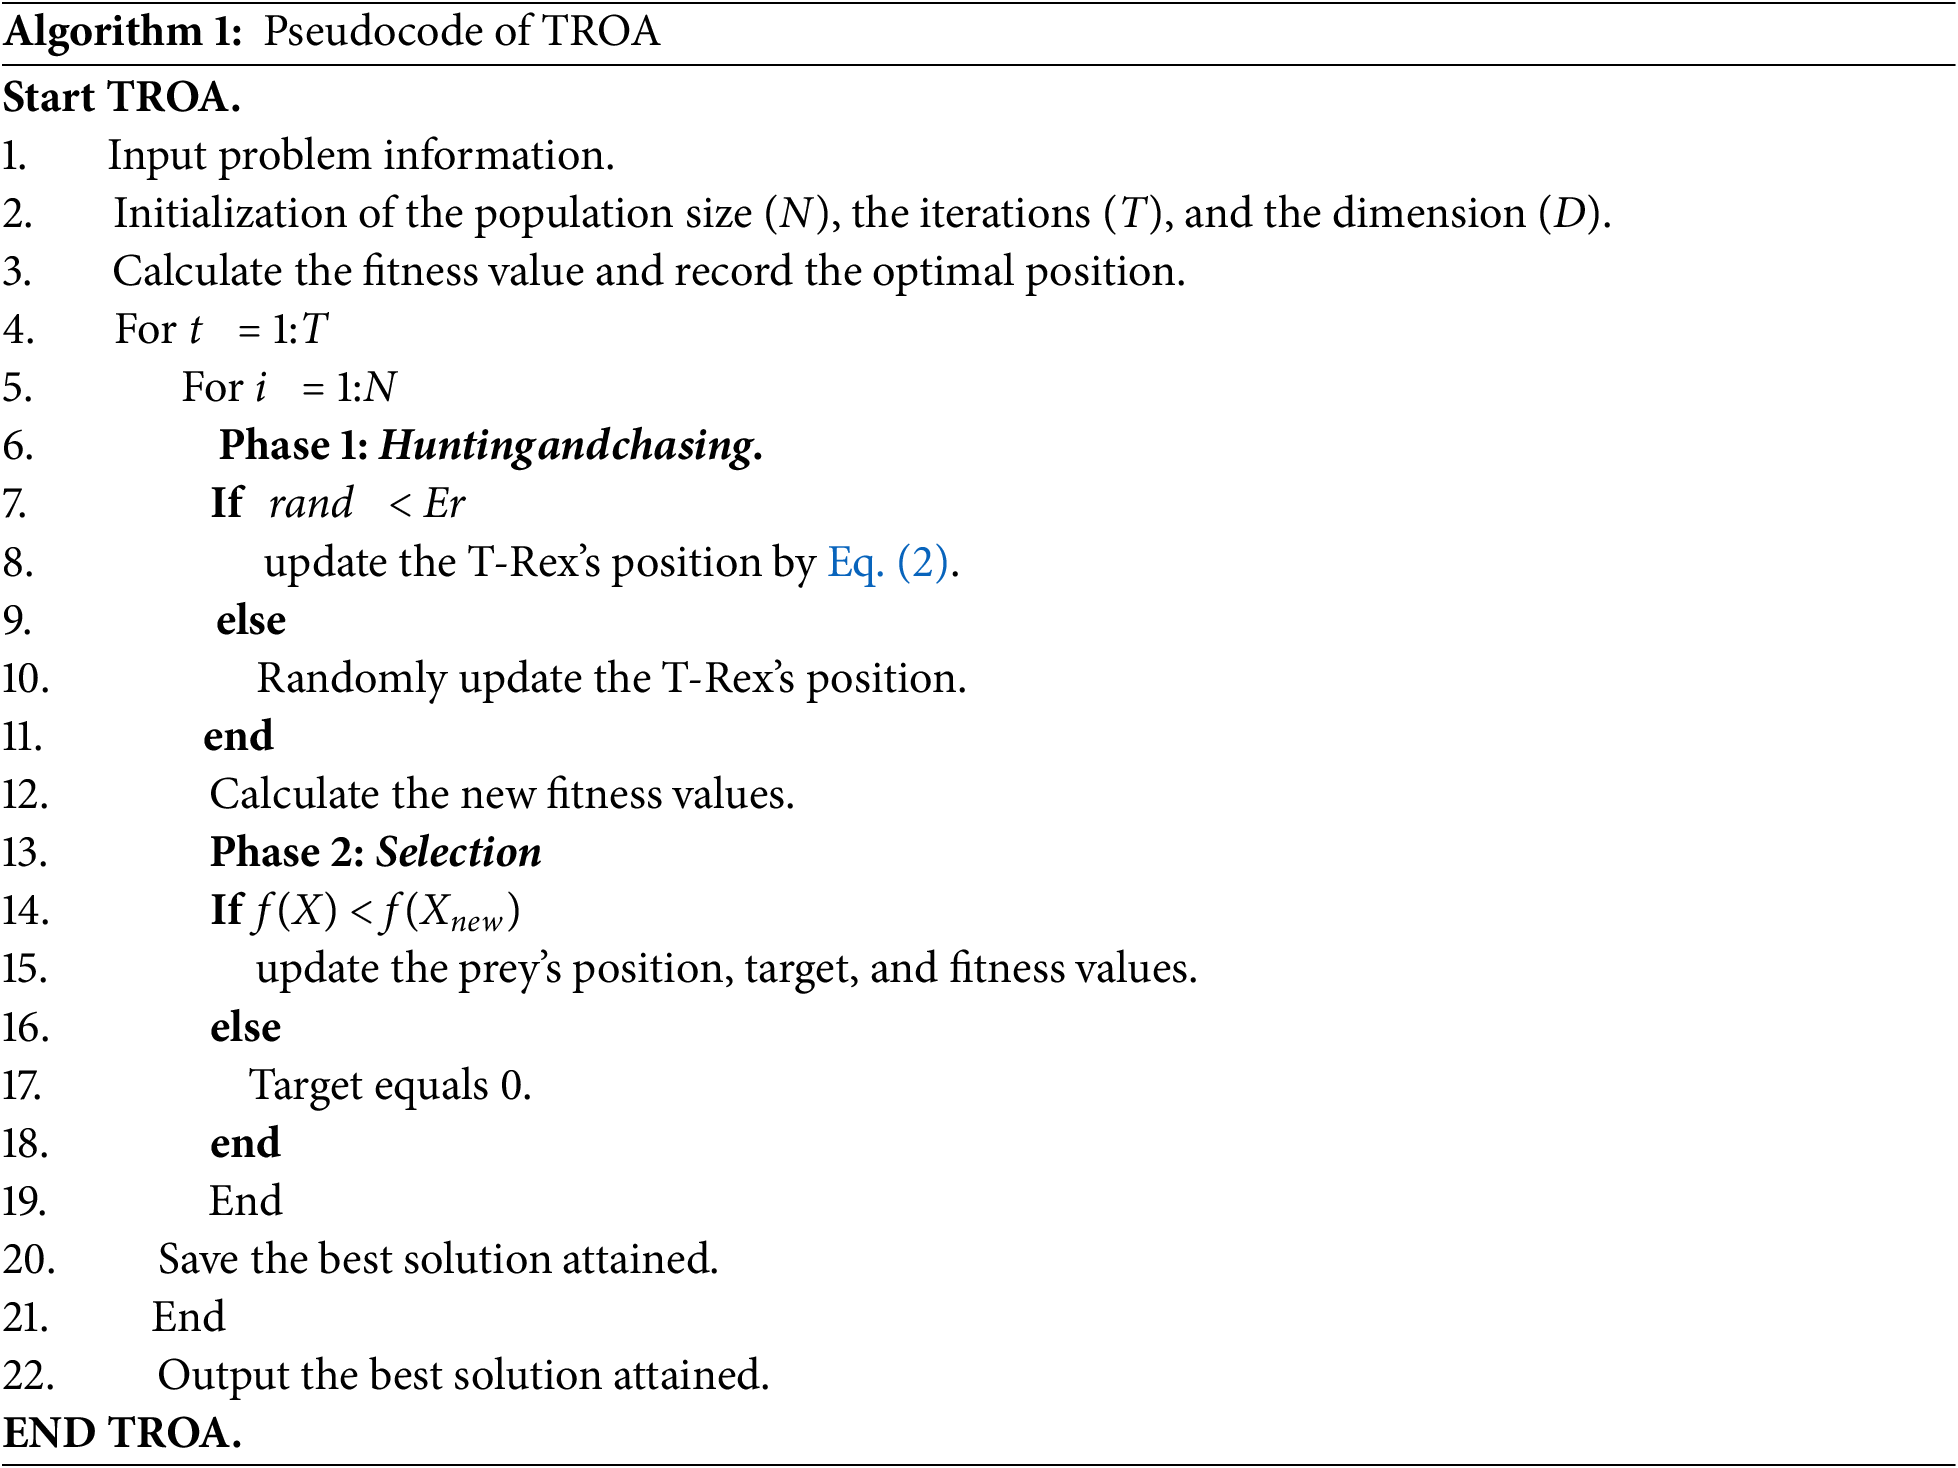
T-Rex hunting behavior resembles top predators, such as tigers and wolves. Once the nearest prey is spotted, T-Rex attempts to capture it. However, prey sometimes succeed in defending themselves or take advantage of the opportunity to escape. Therefore, T-Rex selectively attacked its prey at random during feeding.
where Er is the estimate of reaching the dispersed prey, Er = randn ∗ (1 – (t/max_Iter)). The prey starts to flee as T-Rex begins hunting, and T-Rex updates its location to hunt the prey, as indicated by Eq. (1).
In the given equation, sr represents the hunting success rate, and its value domain is [0.1, 1]. When the success rate is 0, the prey escapes, and the hunting action fails. At this time, the prey’s location information needs to be updated. Moreover, tpos is the location of the T-Rex. The running speed of the T-Rex is denoted by tr, between [0, 1]; target is the minimum distance of the prey to the T-Rex position. As for the prey, its running speed is denoted by pr, which has a value range between [0, 1].
The selection process is based on the location of the prey, which includes the current location of the prey as well as its previous location. This process is done by evaluating the fitness function. If the T-Rex hunts successfully, the target’s location information and fitness function value are updated. If the T-Rex does not hunt, the prey’s location information is zeroed out, which occurs when the prey escapes or takes self-protective measures to avoid predation.
where f(X) is the fitness function of the initial random prey position and f(Xnew) is the fitness function of the updated prey position.
Because of the influence of the random numbers and various parameters in Eq. (1), the TROA updates the position of an individual to a certain degree of randomness. Due to this update mechanism, TROA may prematurely converge to a locally optimal solution. In addition, the selection process of TROA mainly relies on conditional judgment, which may also cause TROA to stop prematurely during the search process and thus miss the global optimal solution. The architecture of TROA’s update mechanism and selection process is primarily responsible for its structural flaws, which make it simple to drift toward the local optimum. In our subsequent studies, we explored various improvement strategies to overcome this shortcoming.
3 Proposed Abnormal Traffic Detection Model for SDN
There are two sections in this section. Firstly, the ITROA is improved by TROA. Secondly, the metaheuristic-driven abnormal traffic detection model for SDN based on ITROA is proposed.
3.1 Improved Tyrannosaurus Optimization Algorithm
The circle mapping [26] strategy effectively avoids falling into local optimal solutions during the search process by introducing the randomness and traversal of chaotic sequences. It also enhances the TROA’s global search capability. Because of the distribution of individuals in it, the initial population obtained is not uniformly distributed. Thus, there can be no fundamental limitation on the algorithmic convergence. The circle mapping strategy is used to initialize the population.
Circle mapping is a chaotic mapping that can be used to generate chaotic numbers between 0 and 1. It has the following formula:
where xk represents the kth chaotic number. e = 0.5, f = 0.2. mod denotes the remainder operation. Chaotic numbers between 0 and 1 are generated by circle mapping and used as random numbers for the population’s initialization. It can enhance the diversity and exploration of the population.
Assuming an individual of N = 1000. The distribution of individuals is created by circle mapping and random sequences in the interval [0, 1]. As shown in Fig. 1, the circle mapping strategy has a more uniform population distribution.

Figure 1: Binary classification results. (a) Random; (b) Circle mapping strategy
3.1.2 Elite Reverse Learning Strategy
The elite reverse learning strategy [27,28] increases the likelihood of finding a better solution, thus overcoming the limitation of local optimality. The search using the inverse solution of the current optimal solution allows for rapid exploration of unexplored regions of the solution space. This strategy is based on the advantage that elite individuals contain more valid information than ordinary individuals and use the elite individuals in the current population to generate a reverse population, which aims to increase the diversity of the population.
Definition of elite inverse solution: assume that the current general individual in the population corresponds to an elite individual at its extremum
where rand is a random number in the range [0, 1],
3.1.3 PSO Convergence Strategy
The PSO method updates a particle’s position using its best position and the best position of the entire population. Therefore, this paper combines the idea of the PSO algorithm to introduce the optimal position information experienced by individual T-Rex into the position update formula. The new positional update formula is:
In the formula, c1 is the social learning factor, and c2 is the cognitive learning factor. Which represents the effect of the optimum experienced by an individual and the population optimum on the algorithm’s search capability; rand is a random number in the range [0, 1]. Xibest indicates where the T-Rex itself experienced the optimum.
The Lévy flight [29] has the property of having a long step size in conjunction with a short step size. It allows the algorithm to perform large step size jumps globally to explore new regions and fine search in small areas to optimize the quality of the solution. This property helps to jump out of the local optimum. This paper uses the Lévy flight strategy to optimize the TROA’s optimization process and increase the optimization accuracy. Global detection uses a Lévy flight strategy, which distributes individuals widely in the search space to improve global optimization.
The Lévy flight strategy is a stochastic search method that obeys the Lévy distribution. It is a type of walk in which short-range searches are interspersed with occasional longer-range walks, thus contributing to the good global search capability of Lévy flights.
The position update formula for Lévy’s flight is:
where xi(t) denotes the ith solution in generation t; ⊕ denotes point-to-point multiplication; L denotes control step weights. Due to the Lévy distribution’s complexity, it is often modeled using the Mantegna algorithm. The formula for calculating the step length is as follows:
where μ and ν follow a normal distribution. Definitions are as follows:
where
Fig. 2 is a flowchart of the ITROA, and the pseudocode is shown in Algorithm 2.

Figure 2: ITROA flowchart
In this paper, as shown in Fig. 2, the steps of the ITROA are shown below.
Step 1: Initialize parameters, including the population size (N), the iterations (T), and the dimension (D).
Step 2: Initialize positions by Eq. (4). Calculate the fitness value to find the nearest location of the prey. Record its location and make it a target for the T-Rex.
Step 3: Update the populations’ position by Eqs. (5)–(7).
Step 4: Initiate a T-Rex hunting process to simulate the probability problem of successful hunting by Eq. (1). If the hunt is successful, the T-Rex position is updated by Eq. (8). If the hunt fails, the location of the T-Rex is randomly updated. Then, calculate new fitness values.
Step 5: Compare the random fitness value f(X) with the updated fitness value f(Xnew) by Eq. (3). If f(X) < f(Xnew), update the prey’s position, target and fitness values. Then, the position is updated by Eqs. (9) and (10). Else, the target is equal to 0.

3.2 Metaheuristic-Driven Abnormal Traffic Detection Model
As for SDN abnormal traffic detection, Fig. 3 proposes a metaheuristic-driven abnormal traffic detection model for SDN based on ITROA. Fig. 4 shows the feature selection flowchart of ITROA. As shown in Fig. 3, the metaheuristic-driven abnormal traffic detection model for SDN based on ITROA can be divided into four phases: dataset acquisition phase, data processing phase, feature selection based on ITROA phase, and results evaluation phase.

Figure 3: The abnormal traffic detection model for SDN based on ITROA

Figure 4: Feature selection flowchart of ITROA
(1) Data acquisition phase
Use tools to acquire an abnormal traffic detection dataset for SDN to obtain data for later analysis. This paper uses an abnormal traffic dataset in an SDN environment to simulate realistic network data and validate abnormal traffic detection for SDN.
(2) Data processing phase
Typically, the collected data contains issues like incompleteness, inconsistency, and redundancy. Therefore, data processing before the experiment is crucial. The InSDN dataset should first be cleaned, which includes removing duplicate data and addressing missing or inaccurate data. Then, to prevent the occurrence of format inconsistency problems, the InSDN dataset needs to be processed uniformly, and it is converted into numerical classes. Finally, to address the significant variations in the InSDN dataset’s dimensions. A normalization function is used to process the data and map all data to [0, 1].
(3) Feature selection based on ITROA phase
Many invisible redundant features remain because of the vast amount of acquired data processed. Therefore, feature selection of the InSDN dataset effectively reduces redundant features and can improve the accuracy of abnormal traffic detection. This phase uses the ITROA for feature selection, as shown in Fig. 4. Iterative optimization search by the ITROA. The optimal subset’s index is obtained at the end of the iteration. The phase now acquires the optimal subset of features. Thus, the purpose of removing redundant features is achieved, and the efficiency of abnormal traffic detection is improved.
(4) Result evaluation phase
The classifier is an important tool for evaluating the performance. In this paper, the KNN classifier is used for evaluation. As described in Fig. 4, firstly, the feature-selected InSDN dataset is divided into training and test sets. Then, the KNN classifier is used to classify and obtain the assessment indicators, including accuracy, recall, precision, and F1-score. Finally, projected results are reflected through the assessment indicators.
4 Experimental Results and Analysis
There are three sections in this section. The benchmark functions are used in the first part to analyze the convergence of ITROA. In the second part, the efficiency of the ITROA is verified on the UCI dataset. In the third part, the performance of ITROA on abnormal traffic detection is validated on the InSDN dataset. The experiment is conducted in MATLABR2022b, using Intel(R) Core(TM) i5-8250U CPU@1.60 GHz 1.80 GHz, with a processor with Windows 11 as the software environment.
4.1 Benchmark Function Experiment
The algorithm is analyzed using simulation experiments to evaluate the ITROA’s performance for optimization search. Table 1 selects six distinct kinds of benchmark functions. Table 2 shows the test function experiment results. Table 3 verifies that ITROA significantly outperforms the original TROA regarding optimization performance using the Wilcoxon sign rank test analysis. Fig. 5 shows the fitness convergence curves of six benchmark functions.


Figure 5: Convergence curves of fitness
As presented in Table 1, three single-peak functions (F1–F3) and three multi-peak functions (F4–F6) are included. Set the parameters of the public part of the algorithm as follows: number of iterations T = 500. Considering the random nature of the algorithms, all the above algorithms are run 20 times repeatedly. Table 2 shows the calculated mean and standard deviation of the 20 results. The test results are shown in Table 3. The Wilcoxon sign rank test p < 0.05, h = 1 on the benchmark function. From the results of the Wilcoxon sign rank test, ITROA and TROA perform significantly differently. As shown in Fig. 5, comparative experiments are conducted using PSO, Whale Optimization Algorithm (WOA), TROA, and ITROA.
The findings are examined by choosing one test function at random from the optimization search procedure to give more information on the ITROA’s convergence rate. The results show that the ITROA exhibits better performance and stronger robustness under the same iterative optimization conditions.
4.2 Experiments Using UCI Datasets
The UCI datasets are used to validate the effectiveness of the ITROA. As described in Table 4, three datasets are selected for testing. The three datasets in Table 5 display the experimental outcomes of various algorithms.
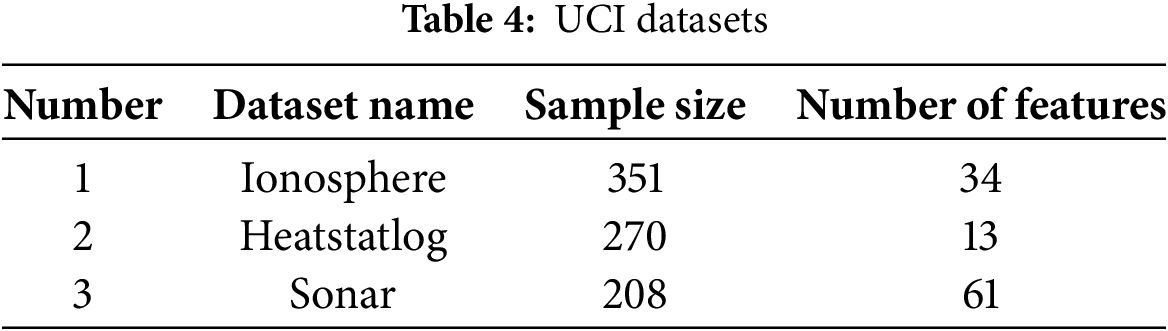

As presented in Table 5, on the Ionosphere, Heatstatlog, and Sonar datasets, ITROA achieves the best values for almost all assessment indicators. The data shown in bold are the excellent values for each indicator. In the Heatstatlog dataset, the recall of ITROA is slightly worse than the TROA algorithm. However, ITROA significantly outperforms other algorithms in other evaluation metrics. Taken as a whole, ITROA demonstrates effectiveness.
4.3 Experiment Using InSDN Dataset
The InSDN dataset is separated into normal and abnormal traffic categories. Numerous socket details, including source IP, destination IP, stream ID, and others, are included in the InSDN dataset. In addition to the labeled columns, remove all socket functions to avoid overfitting problems. There are 49 distinct features in the finished dataset. As these features have different range intervals, it is necessary to normalize these data and restrict the proportion of these values to between 0 and 1.
4.3.1 Binary Classification Results
In this section, the binary classification problem is considered. Classify input data accurately into two categories: normal and abnormal. Ten thousand data points are chosen at random from the dataset for testing. Binary encodings are utilized in computer systems to represent these two categories of data appropriately. Specifically, the data points of the normal class are coded as 0, and the data points of the abnormal class are coded as 1.
Table 6 shows the Wilcoxon signed rank test analysis between TROA and ITROA. Based on the final experimental results, the InSDN dataset exhibits a high level of effectiveness on each algorithm, as shown in Table 7. The values of the fitness convergence curves for the four algorithms PSO, WOA, TROA, and ITROA on the InSDN dataset are displayed in Fig. 6a. As shown in Fig. 6b, data visualization shows the various evaluation performance metrics, and Fig. 6c shows the confusion matrix for binary classification.


Figure 6: Binary classification results. (a) Convergence curves; (b) Histogram; (c) Confusion matrix
From Table 6, the results of 7 randomized experiments were taken, and it is known that all the results p < 0.5, h = 1. There is a significant gap between ITROA and TROA. As shown in Fig. 6a, ITROA has shown clear advantages. As described in Table 7, the ITROA achieves significant optimization in feature selection. The data shown in bold are the excellent values for each indicator. The quantity of features it selects is reduced to five, significantly reducing the data’s redundancy. Due to feature selection, which eliminates many redundant features, ITROA has the fastest prediction time. Thus, it increases the algorithm’s operational effectiveness and prediction accuracy. In terms of indicators, ITROA was the second most effective in recall. However, the ITROA shows clear advantages in terms of assessment indicators. It features an approximate 0.5% rise in accuracy, a 0.37% rise in F1-score, and a 0.53% rise in precision. The ITROA shows good classification performance with optimal results in abnormal traffic detection.
4.3.2 Multi-Classification Results
This section performs a multi-classification operation on the InSDN dataset by selecting 10,000 dates. The feature column labels of these selected data are encoded against their feature column labels, encoding them systematically as numerical labels from 0 to 7. It provides a solid basis for subsequent multi-classification operations.
Table 8, like Section 4.2, shows the Wilcoxon signed rank test analysis between TROA and ITROA. Table 9 shows the results of the multi-classification experiment. The data shown in bold are the excellent values for each indicator. Table 10 shows the model prediction times for the four algorithms after feature selections. In the process of selecting the data, it is found that the three numbers of types of data, Web-Attack, BOTNET, and UR2, are relatively small. Due to the insufficient sample size, these three data sets are not sufficiently referential and convincing in the analyses and comparisons. Therefore, they were ignored for the time being in the subsequent study. The convergence curves of the four algorithms’ fitness values are displayed in Fig. 7a. From Fig. 7c–f, it can be seen that the ITROA shows optimal results whether dealing with normal or abnormal traffic.


Figure 7: Multi-classification results
The core research in this section is to analyze and explore the abnormal traffic in depth. Table 9 shows a significant gap between ITROA and TROA based on the values of p and h. Table 10 shows the model prediction times for the four algorithms. The ITROA exhibits excellent time cost and dramatically improves the overall performance. The results are shown in Fig. 7a. TROA does not converge as well as PSO in the early stage, but it is comparable to PSO in the middle stage but outperforms PSO later on. However, the convergence of the ITROA algorithm shows a clear advantage. Fig. 7b shows the confusion matrix for abnormal traffic detection under ITROA optimization conditions. As shown in Fig. 7c–f, ITROA shows a clear advantage in recall, F1-score, precision, and accuracy in the Normal category. On the DoS attack category, ITROA also shows good detection. There was an improvement of about 1.3% in precision, 1.7% in recall, and 1% in F1-score. It also improves accuracy by about 0.4%. The Probe attack category, excluding recall, significantly improves on the other three evaluation metrics: accuracy, precision, and F1-score. ITROA shows good detection. There was an improvement of about 0.8% in precision and F1-score. On the BFA and DDos attack categories, although some of the indicators are not as good as hoped, ITROA performs better when the four indicators are combined. Although its effect is not significant regarding recall and F1 in the BFA attack category, it shows some advantages regarding precision and accuracy. In the precision rate, it increased by 1.5%. On the DoSS attack category, the combined effect of ITROA is better.
Experiments show that the ITROA improves the original algorithm and outperforms other algorithms. It shows an advantage in abnormal traffic detection.
Considering the problem of the gradual complexity of abnormal traffic detection. This paper proposes a metaheuristic-driven abnormal traffic detection model for SDN based on ITROA to improve the efficiency of abnormal traffic detection. ITROA is used during the feature selection stage of the model to solve the problem of redundant abnormal traffic data for SDN. Then, the UCI datasets and benchmark functions are used to verify the effectiveness of ITROA. Finally, the experiment on the InSDN dataset shows that compared to TROA, WOA, and PSO. In the binary classification experiments, ITROA showed excellent performance on all metrics. In the multi-classification experiments, ITROA demonstrates better results comprehensively. However, as a specific dataset for SDN, the InSDN dataset still has some limitations. Therefore, we will continue exploring new dataset construction methods for SDN abnormal traffic detection to overcome the limitations in the subsequent work.
Acknowledgement: The authors thank the editor and reviewers for their valuable comments.
Funding Statement: This work has been supported by the National Natural Science Foundation of China under Grant 61602162 and the Hubei Provincial Science and Technology Plan Project under Grant 2023BCB041.
Author Contributions: Study conception and design: Hui Xu, Jiahui Chen, and Zhonghao Hu; data collection: Jiahui Chen; analysis and interpretation of results: Jiahui Chen and Hui Xu; draft manuscript preparation: Hui Xu, Jiahui Chen, and Zhonghao Hu. All authors reviewed the results and approved the final version of the manuscript.
Availability of Data and Materials: The dataset used in this study is openly accessible and reliable. It can be obtained from the following website: http://aseados.ucd.ie/datasets/SDN/ (accessed on 1 January 2025).
Ethics Approval: Not applicable.
Conflicts of Interest: The authors declare no conflicts of interest to report regarding the present study.
References
1. Emad Ali T, Hussein Morad A, Abdala MA. Load balance in data center SDN networks. Int J Electr Comput Eng (IJECE). 2018;8(5):3084. doi:10.11591/ijece.v8i5.pp3084-3091. [Google Scholar] [CrossRef]
2. Scott-Hayward S, O’Callaghan G, Sezer S. Sdn security: a survey. In: 2013 IEEE SDN for Future Networks and Services (SDN4FNS); 2013 Nov 11–13; Trento, Italy. [Google Scholar]
3. Kreutz D, Ramos FMV, Veríssimo PE, Rothenberg CE, Azodolmolky S, Uhlig S. Software-defined networking: a comprehensive survey. Proc IEEE. 2015;103(1):14–76. doi:10.1109/JPROC.2014.2371999. [Google Scholar] [CrossRef]
4. Feamster N, Rexford J, Zegura E. The road to SDN: an intellectual history of programmable networks. ACM Sigcomm Comp Com. 2014;44(2):87–98. doi:10.1145/2602204.2602219. [Google Scholar] [CrossRef]
5. Alabdulatif A, Thilakarathne NN, Aashiq M. Machine learning enabled novel real-time IoT targeted DoS/DDoS cyber attack detection system. Comput Mater Contin. 2024;80(3):3655–83. doi:10.32604/cmc.2024.054610. [Google Scholar] [CrossRef]
6. Mihoub A, Ben Fredj O, Cheikhrouhou O, Derhab A, Krichen M. Denial of service attack detection and mitigation for Internet of Things using looking-back-enabled machine learning techniques. Comput Electr Eng. 2022;98:107716. doi:10.1016/j.compeleceng.2022.107716. [Google Scholar] [CrossRef]
7. Aljuhani A. Machine learning approaches for combating distributed denial of service attacks in modern networking environments. IEEE Access. 2021;9:42236–64. doi:10.1109/ACCESS.2021.3062909. [Google Scholar] [CrossRef]
8. Ali MH, Jaber MM, Abd SK, Rehman A, Awan MJ, Damaševičius R, et al. Threat analysis and distributed denial of service (DDoS) attack recognition in the Internet of Things (IoT). Electronics. 2022;11(3):494. doi:10.3390/electronics11030494. [Google Scholar] [CrossRef]
9. Niyaz Q, Sun W, Javaid AY. A deep learning based DDoS detection system in software-defined networking (SDN). ICST Trans Secur Saf. 2017;4(12):153515. doi:10.4108/eai.28-12-2017.153515. [Google Scholar] [CrossRef]
10. Tang TA, Mhamdi L, McLernon D, Ali Raza Zaidi S, Ghogho M. Deep learning approach for network intrusion detection in software defined networking. In: 2016 International Conference on Wireless Networks and Mobile Communications (WINCOM); Oct 26–29; Fez, Morocco. [Google Scholar]
11. Wang K, Fu Y, Duan X, Liu T, Xu J. Abnormal traffic detection system in SDN based on deep learning hybrid models. Comput Commun. 2024;216:183–94. doi:10.1016/j.comcom.2023.12.041. [Google Scholar] [CrossRef]
12. Arevalo-Herrera J, Camargo Mendoza JE, Martinez Torre JI. Network anomaly detection with machine learning techniques for SDN networks. In: 2022 the 7th International Conference on Information and Education Innovations (ICIEI); 2022 Apr 14–16; Belgrade, Serbia. [Google Scholar]
13. Stein G, Chen B, Wu AS, Hua KA. Decision tree classifier for network intrusion detection with GA-based feature selection. In: Proceedings of the 43rd Annual Southeast Regional Conference—Volume 2; 2005 Mar 19–20; Kennesaw, Georgia. [Google Scholar]
14. Zainal A, Maarof MA, Shamsuddin SM. Lecture notes in computer science. Berlin/Heidelberg, Germany: Springer; 2007. [Google Scholar]
15. Mojtahedi A, Sorouri F, Souha AN, Molazadeh A, Mehr SS. Feature selection-based intrusion detection system using genetic whale optimization algorithm and sample-based classification. arXiv:2201.00584. 2022. [Google Scholar]
16. Lin SW, Ying KC, Lee CY, Lee ZJ. An intelligent algorithm with feature selection and decision rules applied to anomaly intrusion detection. Appl Soft Comput. 2012;12(10):3285–90. doi:10.1016/j.asoc.2012.05.004. [Google Scholar] [CrossRef]
17. Xu H, Lu Y, Guo Q. Application of improved butterfly optimization algorithm combined with black widow optimization in feature selection of network intrusion detection. Electronics. 2022;11(21):3531. doi:10.3390/electronics11213531. [Google Scholar] [CrossRef]
18. Xu H, Hu Y, Cao W, Han L. An improved jump spider optimization for network traffic identification feature selection. Comput Mater Contin. 2023;76(3):3239–55. doi:10.32604/cmc.2023.039227. [Google Scholar] [CrossRef]
19. Xu H, Chai X, Liu H. A multi-controller placement strategy for hierarchical management of software-defined networking. Symmetry. 2023;15(8):1520. doi:10.3390/sym15081520. [Google Scholar] [CrossRef]
20. Li F, Xu H, Qiu F. Modified artificial rabbits optimization combined with bottlenose dolphin optimizer in feature selection of network intrusion detection. Electron Res Arch. 2024;32(3):1770–800. doi:10.3934/era.2024081. [Google Scholar] [CrossRef]
21. Wu Q, Xu H, Liu M. Applying an improved dung beetle optimizer algorithm to network traffic identification. Comput Mater Contin. 2024;78(3):4091–107. doi:10.32604/cmc.2024.048461. [Google Scholar] [CrossRef]
22. Yusta SC. Different metaheuristic strategies to solve the feature selection problem. Pattern Recognit Lett. 2009;30(5):525–34. doi:10.1016/j.patrec.2008.11.012. [Google Scholar] [CrossRef]
23. Iba K. Reactive power optimization by genetic algorithm. IEEE Trans Power Syst. 1994;9(2):685–92. doi:10.1109/59.317674. [Google Scholar] [CrossRef]
24. Hamadneh T, Kaabneh K, AbuFalahah I, Bektemyssova G, Shaikemelev G, Umutkulov D, et al. Magnificent frigatebird optimization: a new bio-inspired metaheuristic approach for solving optimization problems. Comput Mater Contin. 2024;80(2):2721–41. doi:10.32604/cmc.2024.054317. [Google Scholar] [CrossRef]
25. Sahu VSDM, Samal P, Panigrahi CK. Tyrannosaurus optimization algorithm: a new nature-inspired meta-heuristic algorithm for solving optimal control problems. e-Prime—Adv Electr Eng Electron Energy. 2023;5:100243. doi:10.1016/j.prime.2023.100243. [Google Scholar] [CrossRef]
26. Yuan W, Liao H, Yuan X. Optimization of vibration and sound insulation in GPLRC honeycomb structures based on circle chaos mapping and Levy flight-enhanced YDSE with constraints. Appl Math Model. 2024;134:752–75. doi:10.1016/j.apm.2024.06.018. [Google Scholar] [CrossRef]
27. Tumari MZM, Ahmad MA, Mohamed Z. Identification of the continuous-time Hammerstein models with sparse measurement data using improved marine predators algorithm. Arab J Sci Eng. 2024;358:4546. doi:10.1007/s13369-024-09692-1. [Google Scholar] [CrossRef]
28. Mohd Tumari MZ, Ahmad MA, Suid MH, Ghazali MR, Tokhi MO. An improved marine predators algorithm tuned data-driven multiple-node hormone regulation neuroendocrine-PID controller for multi-input-multi-output gantry crane system. J Low Freq Noise Vib Act Contr. 2023;42(4):1666–98. doi:10.1177/14613484231183938. [Google Scholar] [CrossRef]
29. Biswas S, Shaikh A, Ezugwu AE, Greeff J, Mirjalili S, Bera UK, et al. Enhanced prairie dog optimization with Levy flight and dynamic opposition-based learning for global optimization and engineering design problems. Neural Comput Appl. 2024;36(19):11137–70. doi:10.1007/s00521-024-09648-4. [Google Scholar] [CrossRef]
Cite This Article
 Copyright © 2025 The Author(s). Published by Tech Science Press.
This work is licensed under a Creative Commons Attribution 4.0 International License , which permits unrestricted use, distribution, and reproduction in any medium, provided the original work is properly cited.
 Downloads
 Citation Tools