
 Submit a Paper
 Propose a Special lssue
 Open Access
ARTICLE
FSMMTD: A Feature Subset-Based Malicious Traffic Detection Method
1 College of Air and Missile Defense, Air Force Engineering University, Xi’an, 710051, China
2 Laboratory of Intelligent Control, PLA Rocket Force University of Engineering, Xi’an, 710025, China
* Corresponding Author: Xiaodan Wang. Email:
Computers, Materials & Continua 2025, 84(1), 1279-1305. https://doi.org/10.32604/cmc.2025.064471
Received 17 February 2025; Accepted 10 April 2025; Issue published 09 June 2025
 View Full Text
 Download PDF
Abstract
With the growth of the Internet of Things (IoT) comes a flood of malicious traffic in the IoT, intensifying the challenges of network security. Traditional models operate with independent layers, limiting their effectiveness in addressing these challenges. To address this issue, we propose a cross-layer cooperative Feature Subset-Based Malicious Traffic Detection (FSMMTD) model for detecting malicious traffic. Our approach begins by applying an enhanced random forest method to adaptively filter and retain highly discriminative first-layer features. These processed features are then input into an improved state-space model that integrates the strengths of recurrent neural networks (RNNs) and transformers, enabling superior processing of complex patterns and global information. This integration allows the FSMMTD model to enhance its capability in identifying intricate data relationships and capturing comprehensive contextual insights. The FSMMTD model monitors IoT data flows in real-time, efficiently detecting anomalies and enabling rapid response to potential intrusions. We validate our approach using the publicly available ToN_IoT dataset for IoT traffic analysis. Experimental results demonstrate that our method achieves superior performance with an accuracy of 98.37%, precision of 96.28%, recall of 95.36%, and F1-score of 96.79%. These metrics indicate that the FSMMTD model outperforms existing methods in detecting malicious traffic, showcasing its effectiveness and reliability in enhancing IoT network security.Keywords
With the continuous progress of Internet of Things (IoT) technology, its application has penetrated every aspect of daily life. From smart homes, smart wearables, and other life-oriented fields to smart agriculture, smart healthcare, and other areas of industrial digitalization, to smart fire protection, smart meters, and other fields of social governance, IoT technology has shown broad application prospects. However, when sensors and actuators in IoT devices sense the surrounding environment, communicate with each other, and exchange data through the Internet, the communication protocol commonly used possesses security vulnerabilities [1]. These vulnerabilities make IoT devices inevitably exposed to many potential security threats (such as man-in-the-middle attacks, botnets, denial of service attacks, and ransomware attacks) when linking to the global Internet. When network malicious traffic is generated, it is particularly important to detect it in time and stop it before it reaches the host.
In the high-speed network environment, network traffic exhibits high data flow characteristics. The malicious traffic detection method based on traditional methods has high computational complexity, and there may be delays when processing network traffic, which cannot meet the current needs. Because there are a lot of irrelevant/redundant features in the data extracted from the original network, which reduces the performance of the classifier, the study of feature dimensionality reduction methods plays an important role in reducing the computational complexity and improving the model generalization ability. The feature selection method is to rank the feature importance from the original features, and then select the most important feature subset. Feature selection methods generally include filtering, wrapping, and embedded methods [2]. The embedded method integrates feature selection into the model training process. During training, the model selects features that are beneficial to performance according to the criteria and adjusts the weight. It combines the advantages of both filtering and wrapping methods and considers data characteristics and model training. These characteristics make embedded methods uniquely valuable in the field of malicious traffic detection on the Internet of Things. The embedded feature selection method selects the features that are most helpful to the malicious traffic detection model, reduces the feature dimension, and thus enables more efficient malicious traffic detection.
In recent years, deep learning has developed rapidly and achieved great success in automatic target recognition [3], computer vision [4], malicious code detection [5,6], and intrusion detection [7]. At the same time, malicious traffic detection based on deep learning technologies, such as CNN, RNN, and Transformer, has become a research hotspot in recent years. For input data, different deep learning models have different processing methods. CNN can bypass complex state calculations and conduct parallel training through convolutional kernels, so its training efficiency is relatively high. Because RNN trains information serially, it cannot process information in parallel during training, leading to slower training efficiency for the RNN model. When reasoning (or inferring), it only considers the information from the previous time step, so its reasoning efficiency is fast; however, the model’s ability to retain previous information is relatively poor, as RNNs tend to forget earlier information. The attention mechanism of the Transformer displays and stores the entire context information. The information is trained and reasoned about in an uncompressed manner, which results in relatively high computational power consumption during both training and reasoning, leading to slower training and reasoning efficiencies. Since the Transformer needs to recalculate the whole sequence every time, its model capability is very high. In the field of malicious traffic detection in the Internet of Things (IoT), it is crucial to study a model that balances both detection efficiency and accuracy.
To sum up, IoT traffic has the characteristics of high data flow, high dimension, and class imbalance. Existing Internet of Things malicious traffic detection technology has the following shortcomings:
(1) The redundant features and unimportant features are screened for the effectiveness of model training.
(2) Because the existing models cannot consider both efficiency and detection accuracy, the model is studied.
(3) As for the imbalance of IoT traffic samples, the malicious traffic data is far less than the normal sample and the model is not sensitive to small sample data.
To solve the above problems, this paper proposes a Feature Subset-Based Malicious Traffic Detection (FSMMTD) malicious traffic detection method for the Internet of Things. The main contributions of this paper are:
(1) To realize the adaptive selection of features, the feature selection method is first screened by using the Internet of Things dataset to reduce the feature dimension.
(2) To consider the detection efficiency and accuracy, the state space model combined with the advantages of CNN and RNN models can improve efficiency while selectively retaining features and ensuring high accuracy.
(3) To overcome the imbalance problem of malicious samples, this paper improves the cross-entropy loss function, to adaptively adjust the loss weight value of sample categories and improve the generalization of malicious traffic detection methods.
(4) To verify the effectiveness of the method, experiments, and evaluation verification are carried out on the public Internet of Things dataset.
The hierarchy of this paper is as follows: First, Section 2 introduces the related work, including the recent work on malicious traffic detection of the Internet of Things. Section 3 introduces the Internet of Things malicious traffic detection method proposed in this paper, which is divided into four main steps: data preprocessing, feature selection, feature extraction and classification, and model evaluation. Section 4 analyzes the experimental results, first introduces the data set used in this paper, then explains the evaluation indicators, and finally analyzes the experimental results in depth. Section 5 summarizes the advantages and disadvantages of the model proposed in this paper and proposes the direction of future improvement and promotion.
This section reviews the relevant research in the field of malicious traffic detection in deep learning and the Internet of Things, with a focus on the development history and status of malicious traffic detection technology.
2.1 Based on Deep Learning Research
In recent years, deep learning has attracted much attention in various industries, and related applications have begun to enter millions of households, making it a current research hotspot.
A convolutional Neural Network (CNN) is a multi-layer feedforward neural network composed of multiple single-layer convolutional neural networks. The CNN model can effectively extract local features of network traffic through local receptive fields, such as packet length, interval, protocol type, etc. These features are crucial for the analysis and recognition of network traffic. However, it has limitations in global feature extraction, long-distance dependency modeling, and complex pattern recognition, making it difficult to comprehensively capture all key information of network traffic, and convolutional neural networks have a large computational load.
Recurrent Neural Network (RNN) is different from traditional feedforward neural networks in that it performs cyclic connections between hidden layers. This cyclic connection enables the network to process sequential data, as the hidden state of each time step depends not only on the current input but also on the hidden state of the previous time step. Due to the issues of vanishing and exploding gradients, RNNs may encounter difficulties in effectively capturing long-range dependencies when dealing with long sequences. And the training speed is slow, making it difficult to parallelize processing.
In 2017, the Google research team proposed a Transformer architecture based on a self-attention mechanism [8], which immediately demonstrated significant advantages in tasks such as sequence modeling and machine translation in the field of Natural Language Processing (NLP). It has now become the mainstream deep learning model in the NLP field.
For the input information, different models of deep learning have different processing methods. Because RNN trains information serially, it cannot process information in parallel while training, so the training efficiency of the RNN model is slow; When reasoning, only the information of the previous time step is seen, so the reasoning efficiency is fast; The ability of the model is relatively poor because RNN forgets the pre-information. The attention mechanism of the Transformer displays and stores the entire context information. The information is trained and reasoned in an uncompressed manner, which results in a relatively large amount of computational power consumption in training and reasoning handsets with slow training efficiency and reasoning efficiency.
In December 2023, Albert and Tri Dao proposed the Mamba [9] model based on the State Space Model (SSM) and selection mechanism, which immediately demonstrated significant advantages in long sequence tasks in the field of Natural Language Processing (NLP). Mamba’s unique linear attention mechanism enables it to efficiently process large amounts of information, solving the problems of high computational complexity, large memory usage, and long-distance dependency modeling that traditional Transformers face when processing long sequences.
At present, the Mamba model has become an important deep learning model in the field of sequence modeling. In January 2024, Vision Mamba [10] first applied Mamba to the field of computer vision, and since then, more and more teams have applied Mamba models to practical scenarios such as computer vision, time series, fault diagnosis, and multimodal tasks. In May 2024, based on Mamba, the Mamba-2 [11] model proposed by the original author was published in ICML 2024, which further sparked corresponding research. The development process and typical models of the Mamba model are shown in Fig. 1.
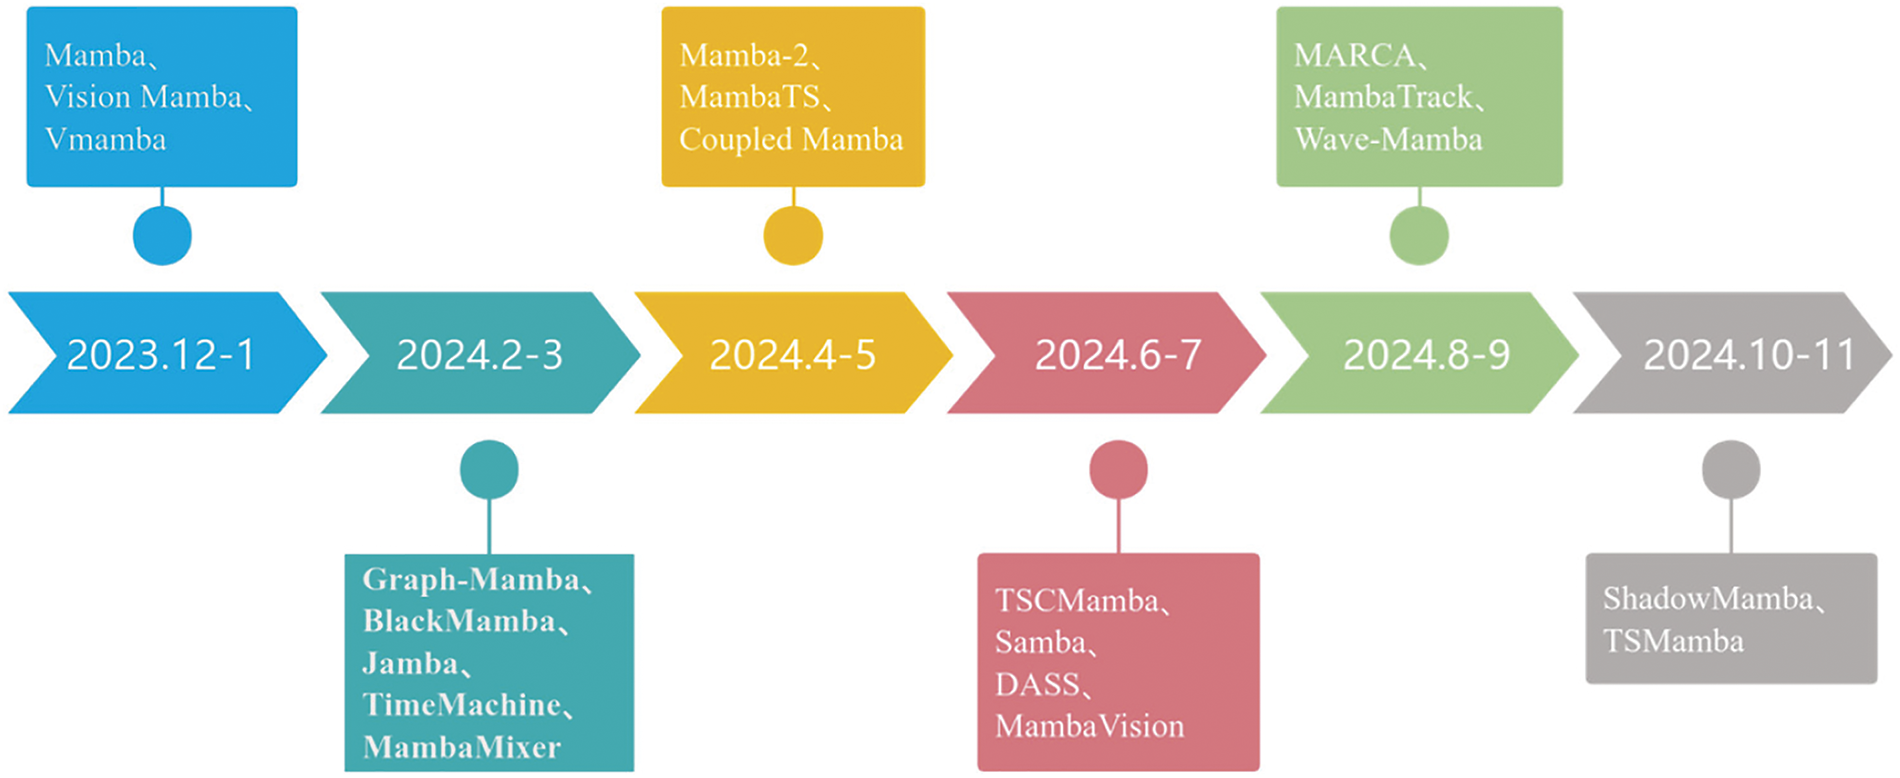
Figure 1: The development history of Mamba
Mamba is an improved State Space Model (SSM) designed for efficient processing of complex data-intensive sequences. Initially, SSM was used as a mathematical tool in modern control theory to describe dynamic systems. With the emergence of HiPPO initialization, the Linear State Space Layer (LSSL) has demonstrated the ability to handle long-term dependencies. However, due to the high computational and memory overhead of LSSL, its use in large-scale applications is limited. The Structured State Space Models (S4) model improves computational efficiency by reparametrizing and effectively replacing traditional attention mechanisms. In terms of implementing linear time research, S4 has multiple variants, such as H3, gated state space, Hyena, and RWKV. Among them, Mamba significantly improved the ability to capture remote context by introducing a data dependency selection mechanism, and demonstrated good linear time efficiency and performance, surpassing traditional Transformer models.
2.2 Internet of Things Malicious Traffic Detection Technology Based on Deep Learning
Compared with the mobile Internet, the Internet of Things has large-scale devices, multi-source heterogeneous traffic, and many new types of attacks, resulting in the unsatisfactory application effect of traditional malicious traffic detection technology in the Internet of Things. In traditional IoT research, traditional machine learning-based malicious traffic detection methods have limitations in improving detection accuracy, relying on feature engineering, resulting in an exceptionally complex classification process. In recent years, some researchers have successfully achieved efficient detection by selecting low-dimensional features and simplifying algorithm complexity, providing strong support for the security protection of the Internet of Things.
It is particularly important to enhance the accuracy and efficiency of malicious traffic detection in response to security challenges in the Internet of Things environment. In recent years, researchers have proposed various malicious traffic detection methods based on deep learning and other technologies. Alsaffar [12] combines mixed feature selection (MI Bruta method) and stacked ensemble learning (using random forest, CatBoost, and XGBoost as base learners, and multilayer perception as meta learners) to improve the performance of intrusion detection systems. Laghrissi et al. [13] proposed a malicious traffic detection system based on LSTM. In the preprocessing stage, principal component analysis and mutual information were used to extract features from the data. The top three features in the principal component analysis were used as inputs to explain the variance proportion. The model achieved good detection results. Lo et al. [14] applied graph neural networks to IoT intrusion detection systems and proposed an intrusion detection model based on EGraphSAGE. To address the challenge of noisy labels, Yuan et al. [15] introduced a unified solution based on the Multi-dimensional Constraint-driven Representation (MCRe) framework. Unlike traditional approaches, MCRe employs a triple constraint mechanism—informational integrity, inter-class separability, and core proximity—to guide the model in learning more robust feature representations. This innovative framework effectively avoids the limitations of conventional methods, particularly the discarding of hard samples in data-cleaning processes and the excessive suppression of hard samples in weighted training schemes.
Regarding the optimization of algorithm complexity, Yuan et al. [16] designed a lightweight convolutional neural network (LCNN) to solve the memory limitation problem of IoT devices. By converting the original bytes of binary files into Markov images, deep convolution, and channel shuffling are added to CNN, and the convolutional layer is further optimized based on the number of ShuffleNetV2 units, achieving more efficient computational performance. Compared to other deep learning methods, the size of the LCNN model is only 1 MB, which effectively reduces the resource consumption of training the model while maintaining prediction accuracy, thereby improving the training efficiency of the model.
Wang et al. [7] proposed a transformer-based IoT intrusion detection method called TransIDS to address the issue of class imbalance. TransIDS introduces a multi-head self-attention mechanism that can adaptively adjust attention to high-dimensional features. To address the impact of imbalanced datasets, label smoothing techniques are used to add noise to sample labels, enhancing the model’s generalization ability. Alabduallah et al. [17] proposed the HSSADL-CAC method to solve the problem of class imbalance data processing in network attack classification, and to detect malicious traffic by optimizing deep learning models to solve the problem of class imbalance processing. Method: The ADASYN method is used to deal with class imbalance problems, the HSSA-based feature selection method is applied, and the deep extreme learning machine (DELM) model is used to detect network attacks.
Compared with the mobile Internet, the Internet of Things has multi-source heterogeneous traffic and many new attack types, resulting in the unsatisfactory application effect of traditional malicious traffic detection technology in the Internet of Things. Traditional machine learning-based malicious traffic detection methods have limitations in improving detection accuracy, overly relying on feature engineering, resulting in an exceptionally complex classification process. In addition, current deep learning models are not suitable for the special environment of the Internet of Things in malicious traffic detection due to their complexity and high computational costs. To solve this problem, researchers have studied methods to reduce computing resource consumption. By selecting low dimensional features and simplifying algorithm complexity, efficient detection results have been successfully achieved, providing strong support for the security protection of the Internet of Things.
3 A Malicious Traffic Detection Method for the Internet of Things Based on the FSMMTD Model
The FSMMTD IoT malicious traffic detection method proposed in this article is illustrated in Fig. 2. This method comprises three parts: data preprocessing, feature selection, and feature extraction and training.
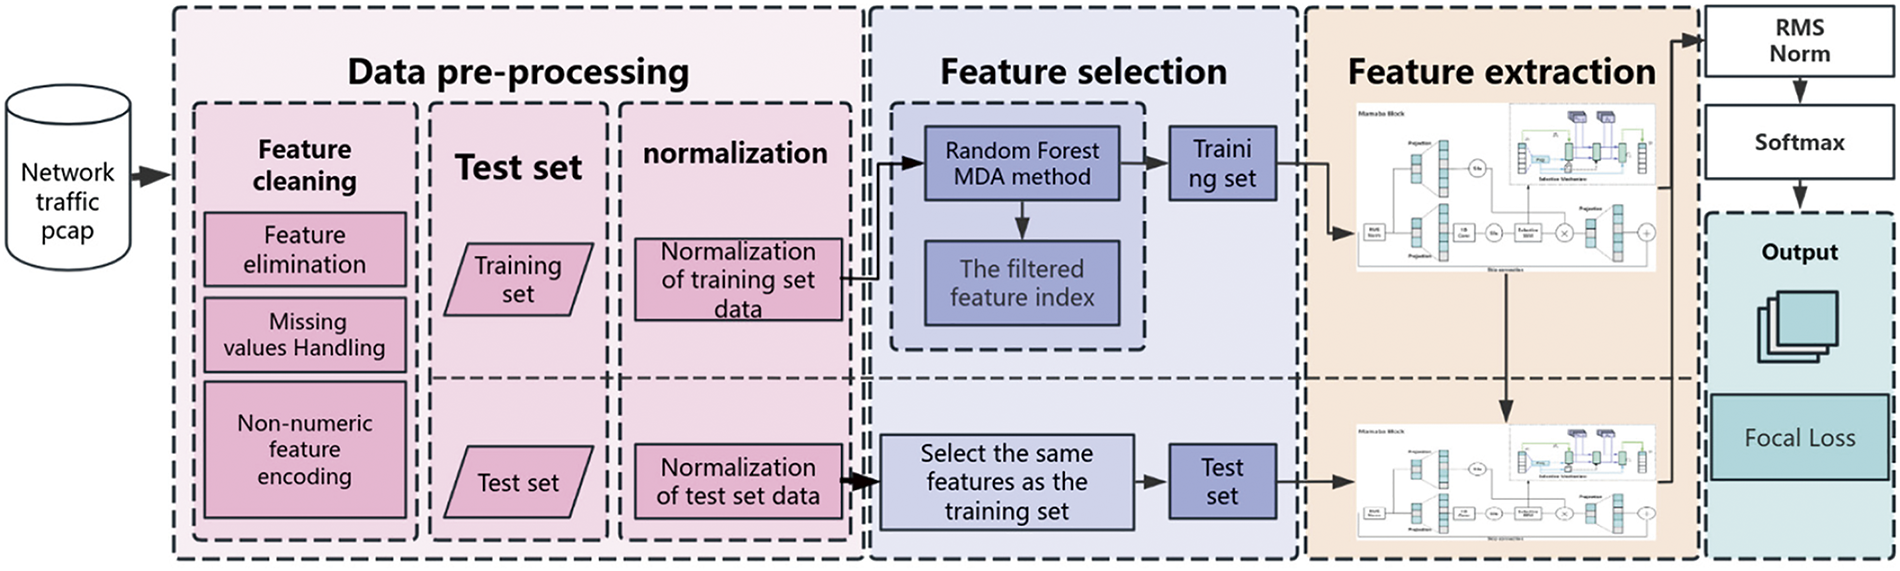
Figure 2: FSMMTD model framework
In the data preprocessing stage, data cleaning and normalization are performed to standardize the data format. The dataset is divided into two main parts: one for feature dimensionality reduction and the other for model training, testing, and validation. This ensures that the model exhibits generalization on unknown data flows.
During the feature dimension reduction stage, key features are identified through the application of random forest feature selection and feature extraction techniques. The importance of data features is ranked, and the most suitable feature dimensions are selected to reduce the data dimension. Subsequently, the data transformed by the feature dimension reduction method is utilized in subsequent classification and detection tasks.
During the model training phase, the Focal Loss function is established, and the FSMMTD model is trained through an optimizer. In the testing phase, the trained FSMMTD model is used for feature extraction, and finally, a SoftMax classifier is employed for classification evaluation.
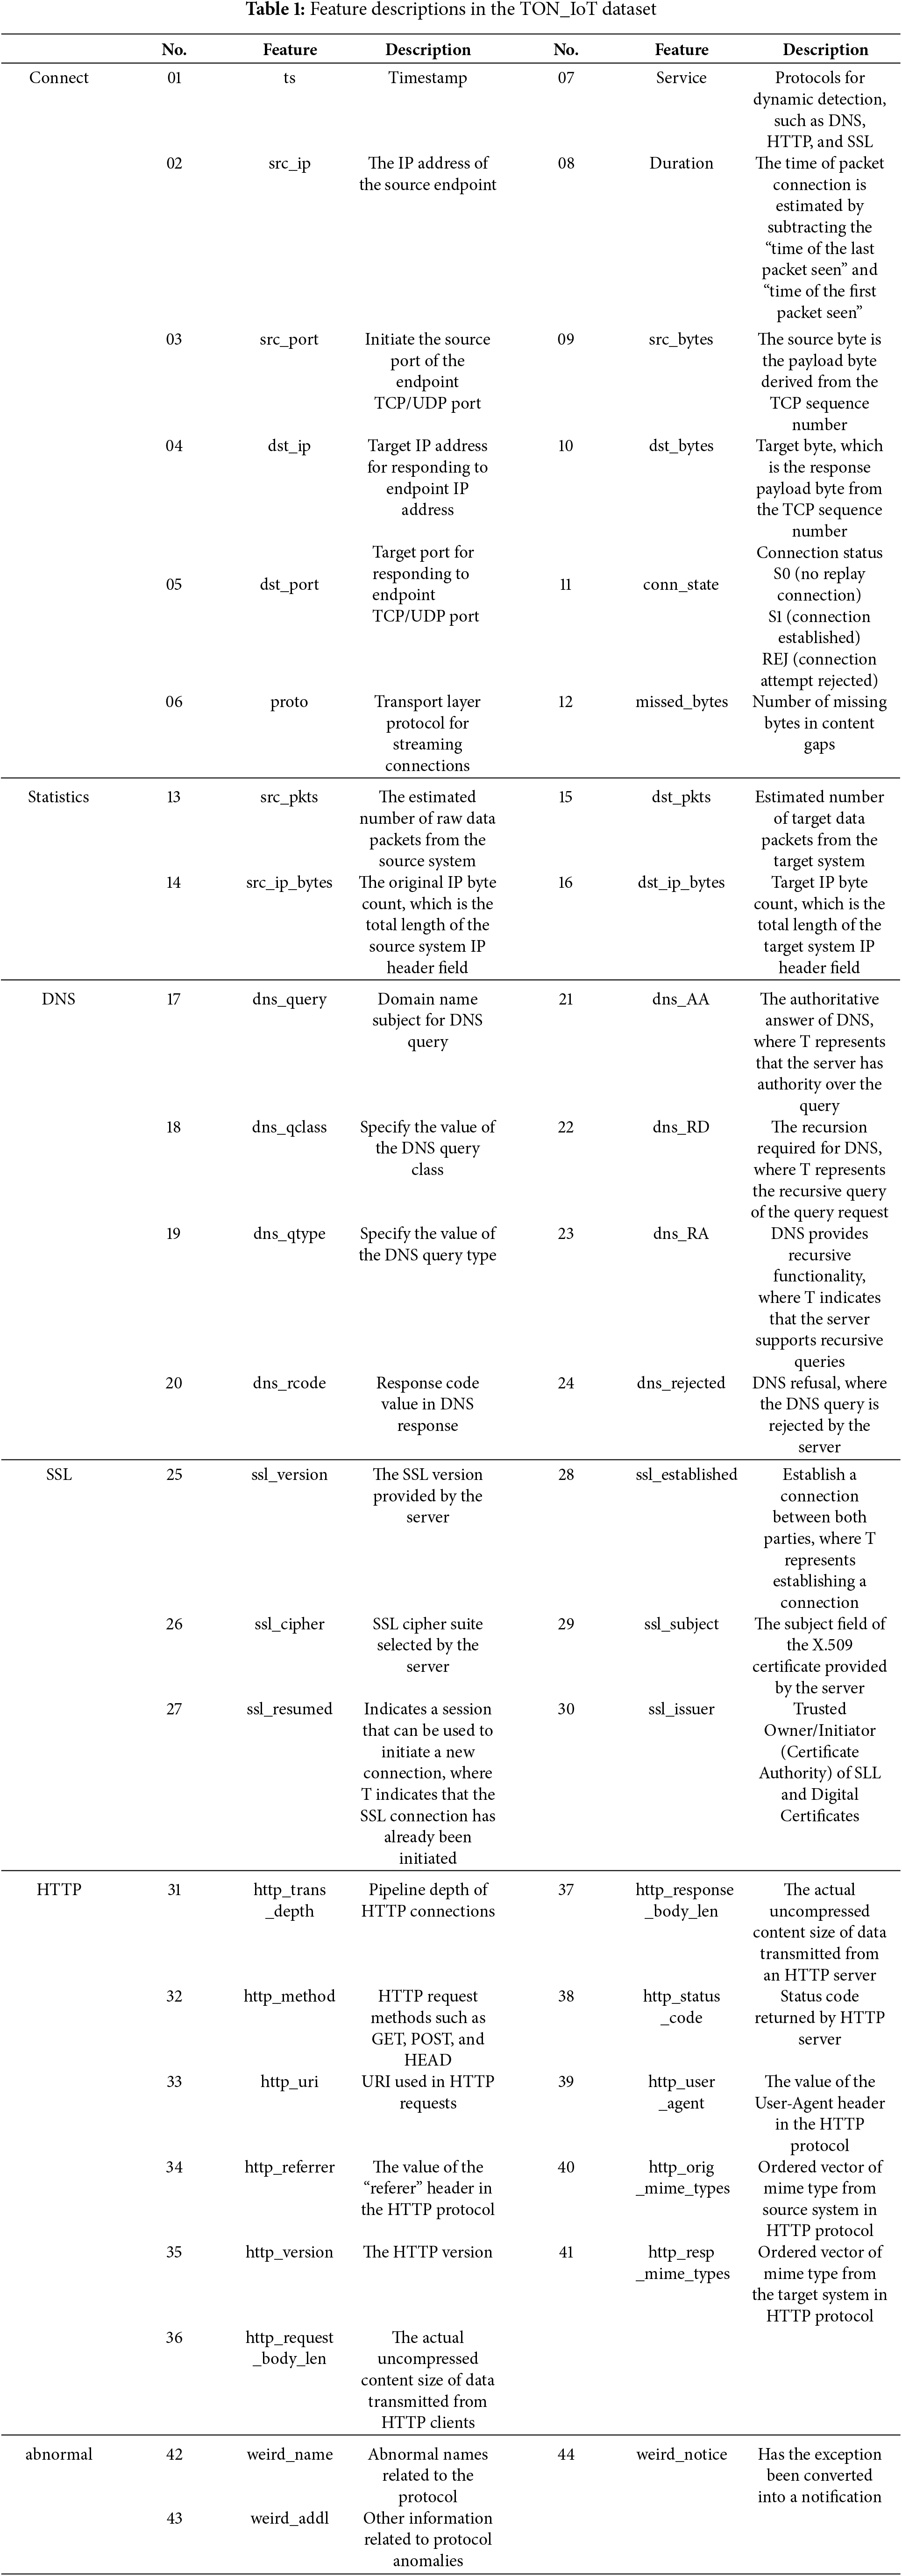
The TON_IoT dataset [18–21] is a data sample collected by the University of New South Wales from real IoT environments such as IoT sensors and Windows systems, as shown in Fig. 3. It integrates heterogeneous data sources generated from telemetry data from IoT and IIoT sensors, Windows operating system data, and Ubuntu network traffic data. The dataset comprises a total of 22,339,021 samples and is categorized into two classification methods. One is anomaly data detection, which belongs to binary classification, distinguishing between normal traffic and malicious traffic; the other is a nine-class classification of malicious traffic, which divides malicious traffic into Backdoor, DDoS, DoS, Injection, Password, Ransomware, Scanning, XSS, and MITM. The dataset includes six functional groups: connectivity, statistics, DNS, SSL, HTTP, violations, and labels, encompassing a total of 44-dimensional features. This article primarily focuses on the “Train_Test_Network.csv” dataset for data analysis, which comprises a total of 461,043 data stream samples. Fig. 3 illustrates the label distribution of the two categories and the types of multiple categories, while Table 1 lists the respective features of the dataset.
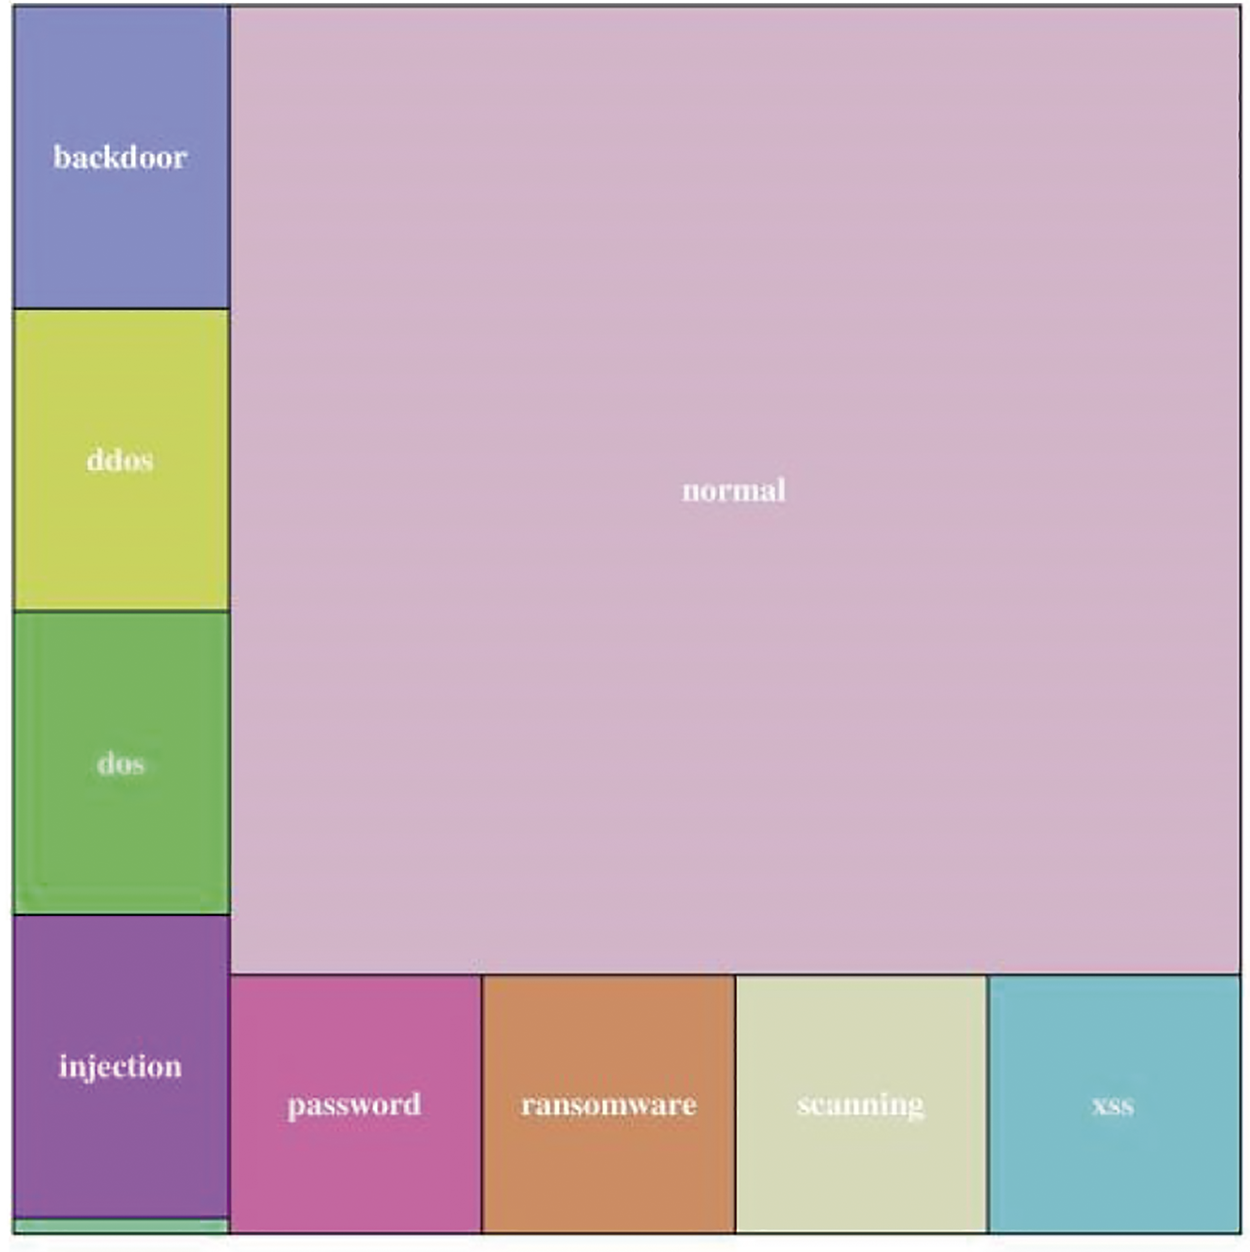
Figure 3: TON_IoT dataset
The original network traffic contains many duplicate, invalid, or incorrect data, such as noise data and missing values. The sample quality is improved by cleaning and converting the original data, and the data is processed into a form suitable for data analysis or model input. In this study, data preprocessing includes missing value processing, duplicate data elimination, non-numerical feature coding, and feature normalization. These steps are the basis for ensuring that the dataset is suitable for in-depth analysis.
Feature elimination: To ensure the generalization ability of the model under network traffic detection, remove the features of the test environment identifier that only represents the generated data. The “ts” feature records the timestamp information of each connection, while the “HTTP referrer” feature represents the value of the “referer” header in the HTTP protocol. These features are not important for prediction tasks in subsequent model training [22]. Therefore, in the pretreatment phase, these non-critical features are eliminated. After feature elimination, 42 key features were retained in the dataset except for two classification labels.
Missing value processing: in the network traffic characteristic information, all “-” symbols in the characteristic value indicate that the data is unavailable. For example, if the connection feature “service” is displayed as “-”, it means that the corresponding sample is missing a value. Similarly, the “-” value in the DNS function indicates that these samples do not support the DNS function. Similarly, SSL, HTTP, and other functions with a “-” value indicate that the corresponding sample does not support these functions. Therefore, this study replaced these “-” values with “N/A” to indicate that the value does not apply to specific functions and created a new binary feature “<feature name>_” for each feature to identify whether the original feature value is “N/A”. In this way, the problem of missing values in data can be effectively handled, providing accurate data support for subsequent model training and analysis.
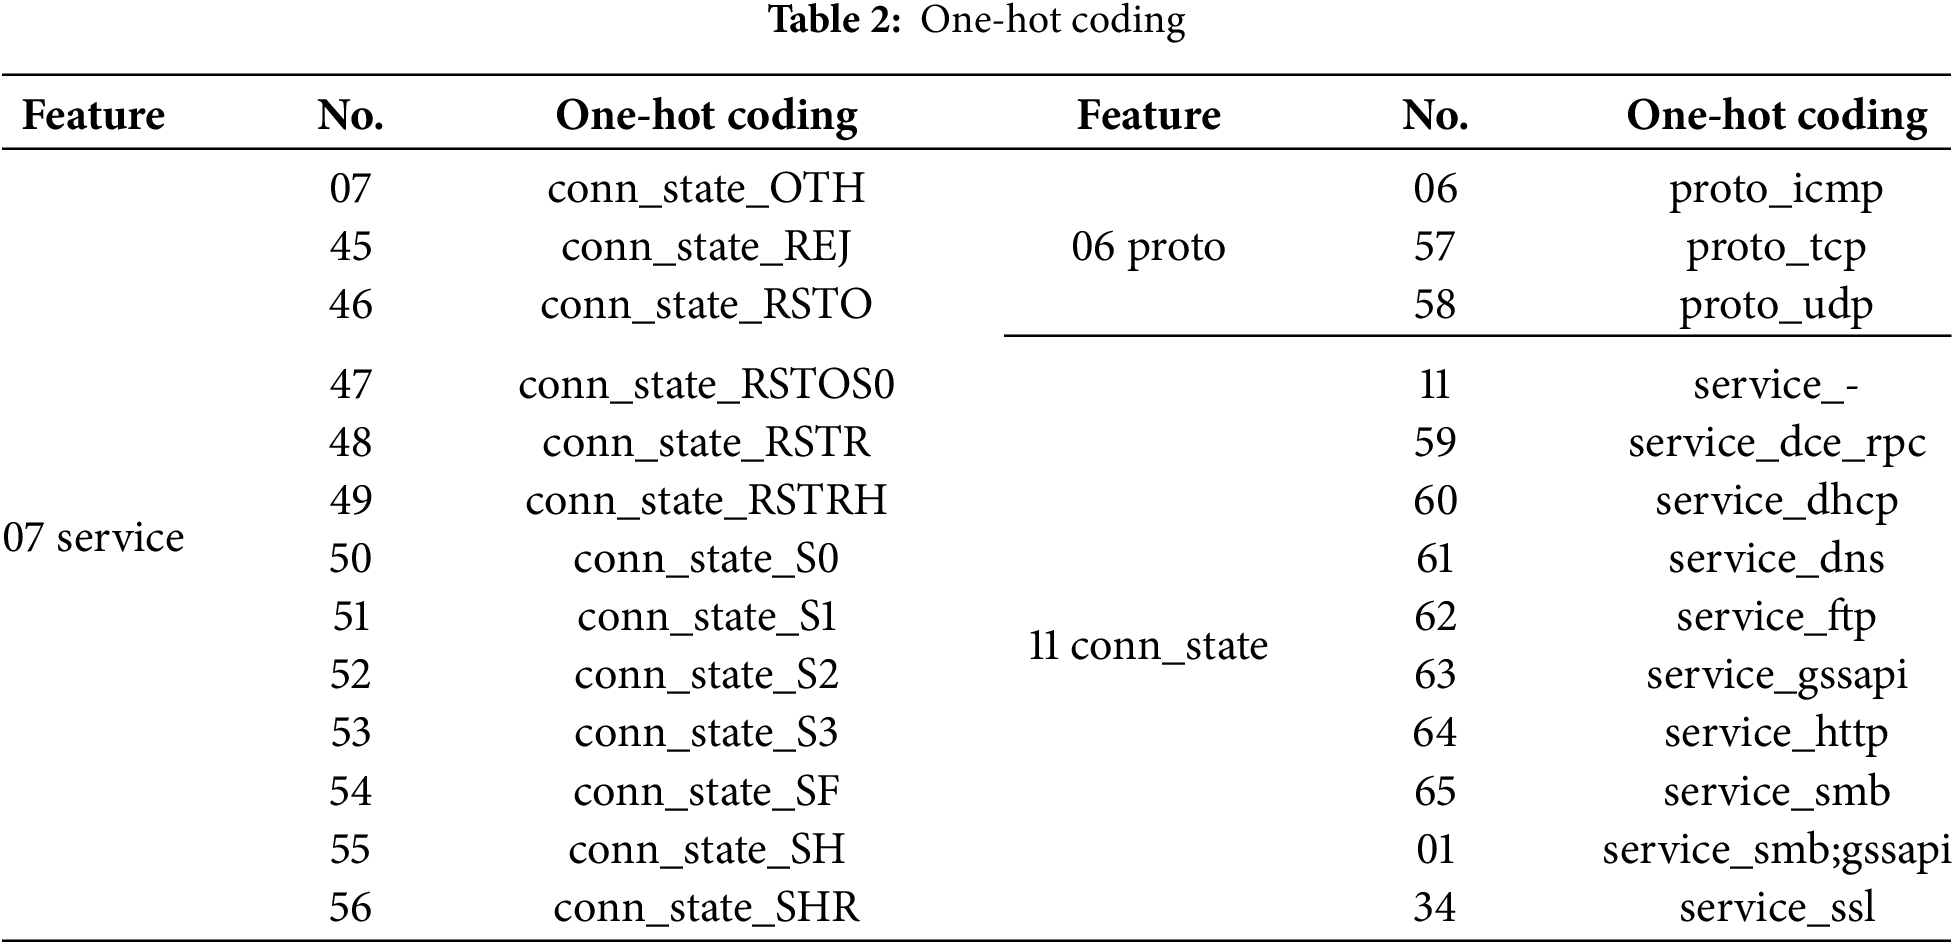
Nonnumeric feature coding: Label Encoding is simpler and more space-saving, but it may introduce arbitrary order for classified values. One Hot Encoding avoids this problem by creating binary columns for each category, but it will lead to high-dimensional data [22]. In this paper, by considering the characteristics of different traffic characteristics, two main coding technologies are used: One Hot Encoding and Label Encoding to convert classified variables into numerical data. Unique hot coding realizes the digitization of classification variables by creating a new binary column for each category, but this method may lead to a sharp expansion of the feature space, which will adversely affect the feature extraction and generalization capabilities of the model. The three feature data of 06 proto, 07 service, and 11conn_state in the service configuration file connection have different limitations, and it is suitable to use unique hot coding numerical to maintain the rationality of the feature space and optimize the feature extraction process. In the encoding process, the feature space needs to be expanded according to the number of different labels in the feature, and the corresponding label position is marked as 1, and other positions are marked as 0. Therefore, the new features corresponding to the three features after unique heat coding are shown in Table 2. For other non-numerical features that do not use unique heat coding, this study uses the tag coding method, that is, by assigning a unique digital identifier to each different category to achieve numerical value. This method simplifies feature representation and reduces feature dimensions, thus improving the efficiency of model training. There are 23 features in DNS, such as 17dns_query, 21dns_AA, and 44weird_notice in exceptions. The tag encoding method is used to assign a digital tag to each category to realize the feature digitization. The missing value processing strategy ensures that the numerical characteristics of the dataset can accurately represent the original non-numerical information without increasing the burden of model training. This processing method improves the efficiency of model training and helps to improve the performance and accuracy of the model in malicious traffic detection tasks.
Data division: The purpose of data division is to divide the original data set into two independent parts: one part is used as the training set for model training, and the other part is used as the test set to evaluate the test performance or final effectiveness of the model. To prevent data leakage in subsequent data preprocessing steps (such as normalization and feature dimensionality reduction) and deep learning, data partitioning should be completed before these steps. In addition, to ensure that the trained model has good generalization ability, the category proportion of the test set should be consistent with the category distribution of the training set, to simulate the real environment of the Internet of Things network. Based on this, this paper uses a stratified sampling method to divide the data into the training set and test set according to the proportion of 8:2. 80% of the data is used for feature selection and model training to optimize the model performance; The remaining 20% is used for the effective evaluation of the model. This data division method ensures the model is more accurate and reliable in practical applications.
Data normalization: Data normalization maintains the relative proportion between features and avoids the deviation of the model from features with a large range of values. Relevant research shows that [21], normalization technology can effectively scale features. Therefore, this study uses the Min-Max scaling method to normalize data and scale the value of each feature to [0, 1] interval to ensure that different features have the same influence in the model training process. The calculation process of the Min-Max standardized formula is as follows:
where
For example, the traditional Pearson correlation coefficient ranking can only deal with linear relationships is sensitive to outliers, and cannot consider the impact of interaction between variables on target variables. As an integrated learning method, random forest evaluates the importance of features by constructing multiple decision trees. Compared with traditional feature selection techniques, random forests have unique advantages in detection accuracy and model complexity. Therefore, in the research of malicious traffic characteristics, a random forest algorithm is used to select the importance of features.
The random forest constructs each decision tree by randomly selecting samples and feature subsets to provide a more comprehensive way to evaluate the importance of features. The threshold value is set iteratively through the feature importance score in the random forest algorithm, the uncertainty of samples is measured by entropy, and the descending order is sorted according to the feature’s impact on the model prediction ability.
An entropy-based method can effectively measure the effectiveness of data. The entropy
where
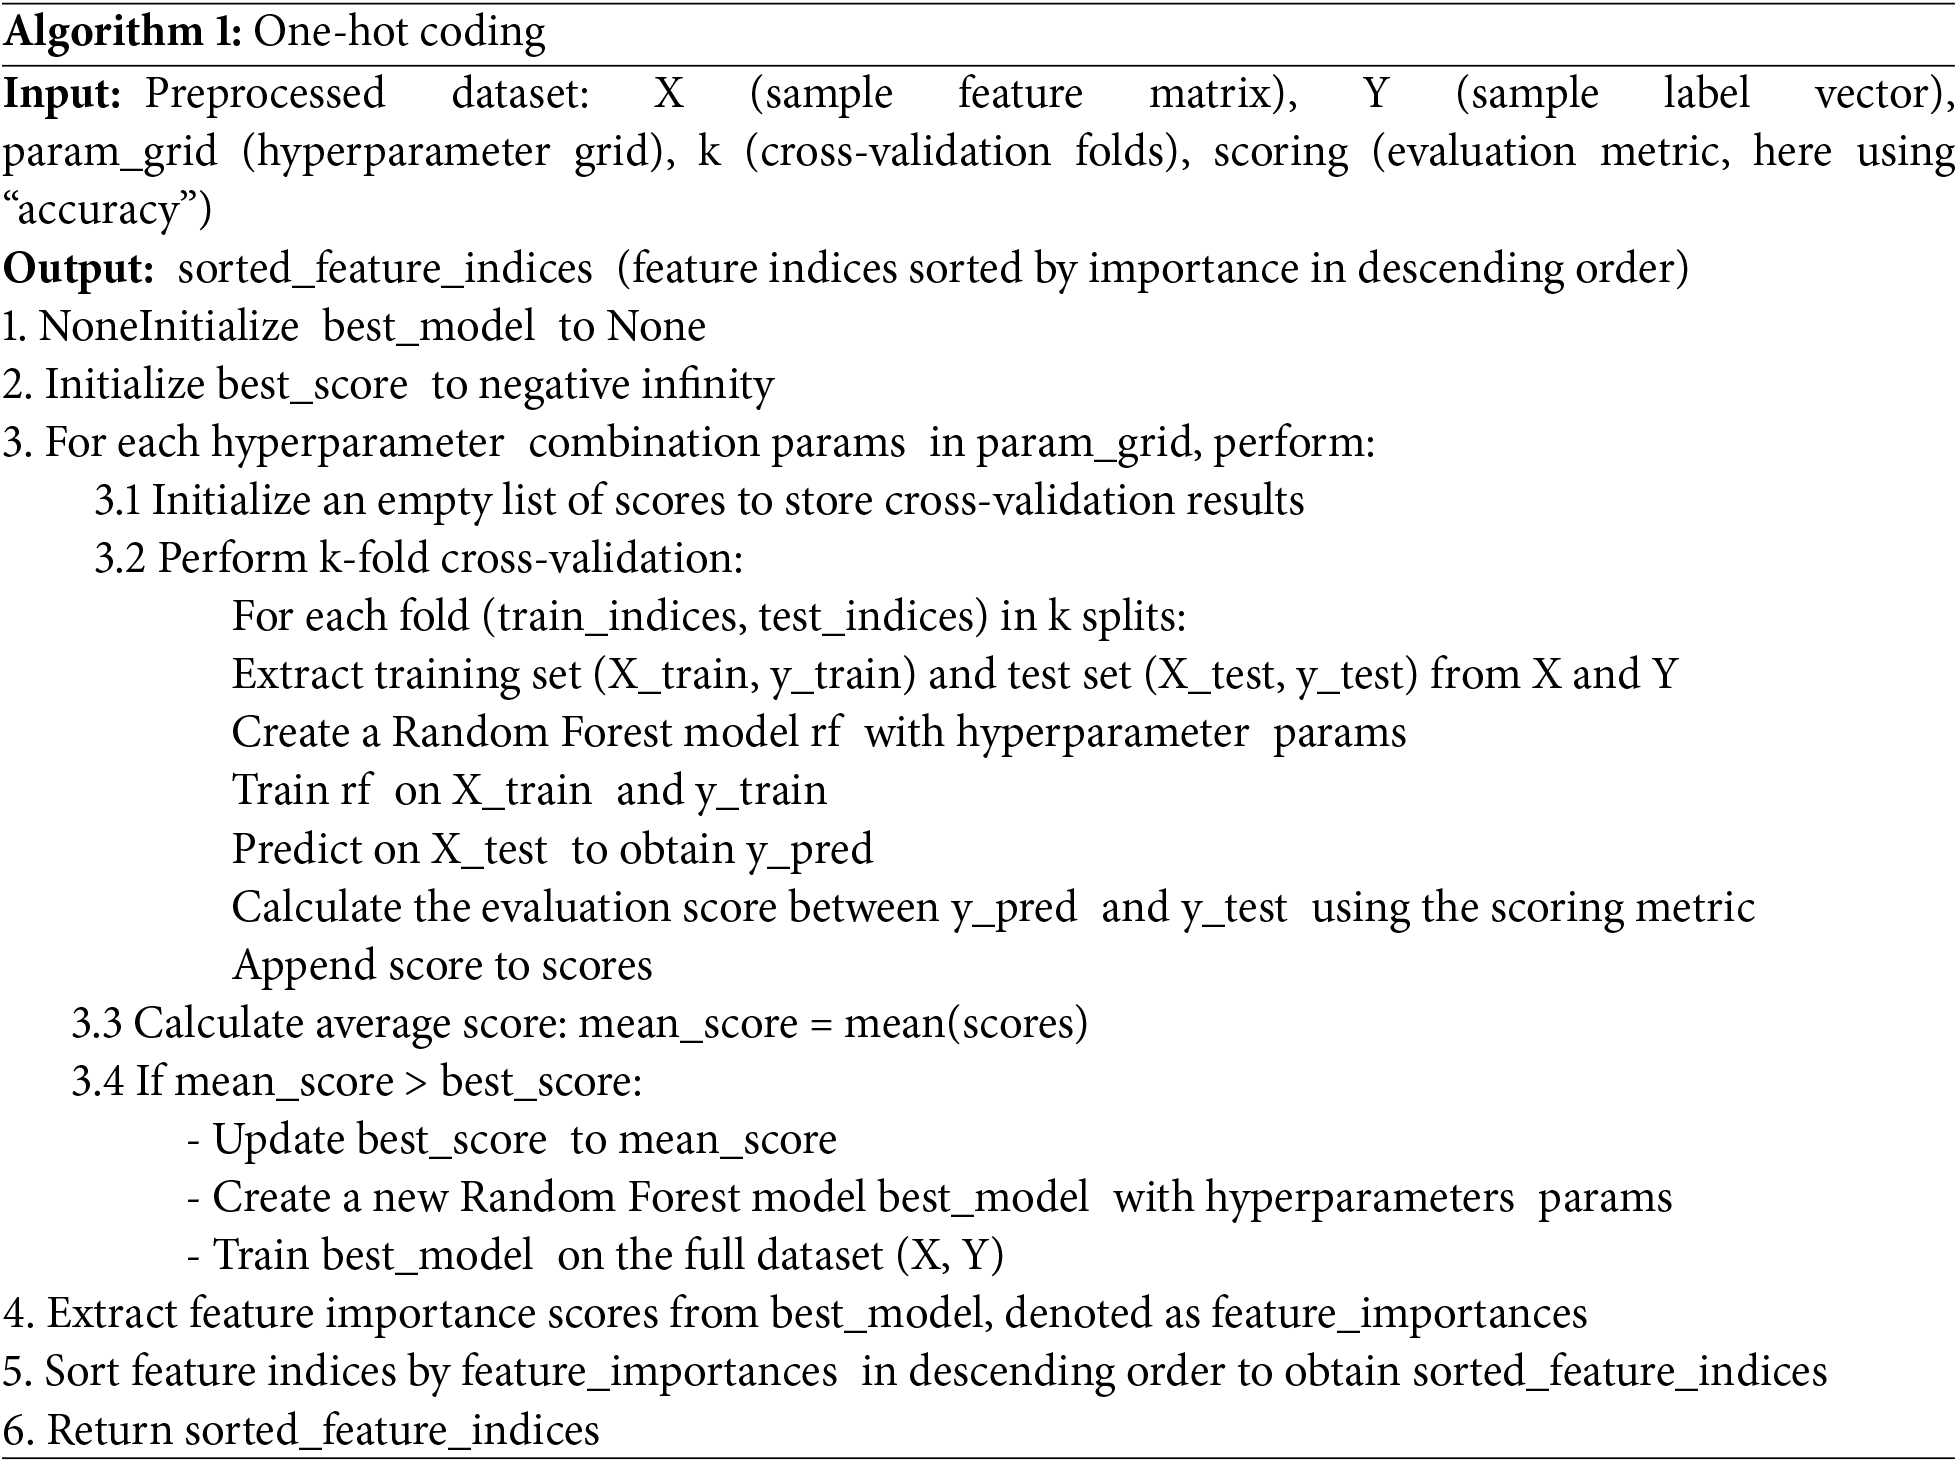
The feature selection algorithm, as shown in Algorithm 1, uses the preprocessed dataset as input.
To synthesize the advantages of the above three models, this paper studies the state space model (SSM). SSM can be seen as the combination of a convolutional neural network and cyclic neural network, which is composed of a linear layer, gating unit, and selective state space model. The model block is shown in Fig. 4. First, after the normalization of data, linear projection is performed, respectively. Then, one-dimensional CNN is used to extract local features to achieve parallel training. Then, after Silu is activated, a selection state space model is adopted, in which the SSM layer is selected to map the input sequence
1. Linear mapping: the input data is first transformed into a new space through a linear projection layer.
2. Layer normalization, one-dimensional convolution, and Silu activation: the model captures local features and enhances its understanding of sequence data. Currently, the input sequence is:
where
3. Select the SSM layer, which comprises the state update formula and the output formula. The details of these two formulas are as follows:
here
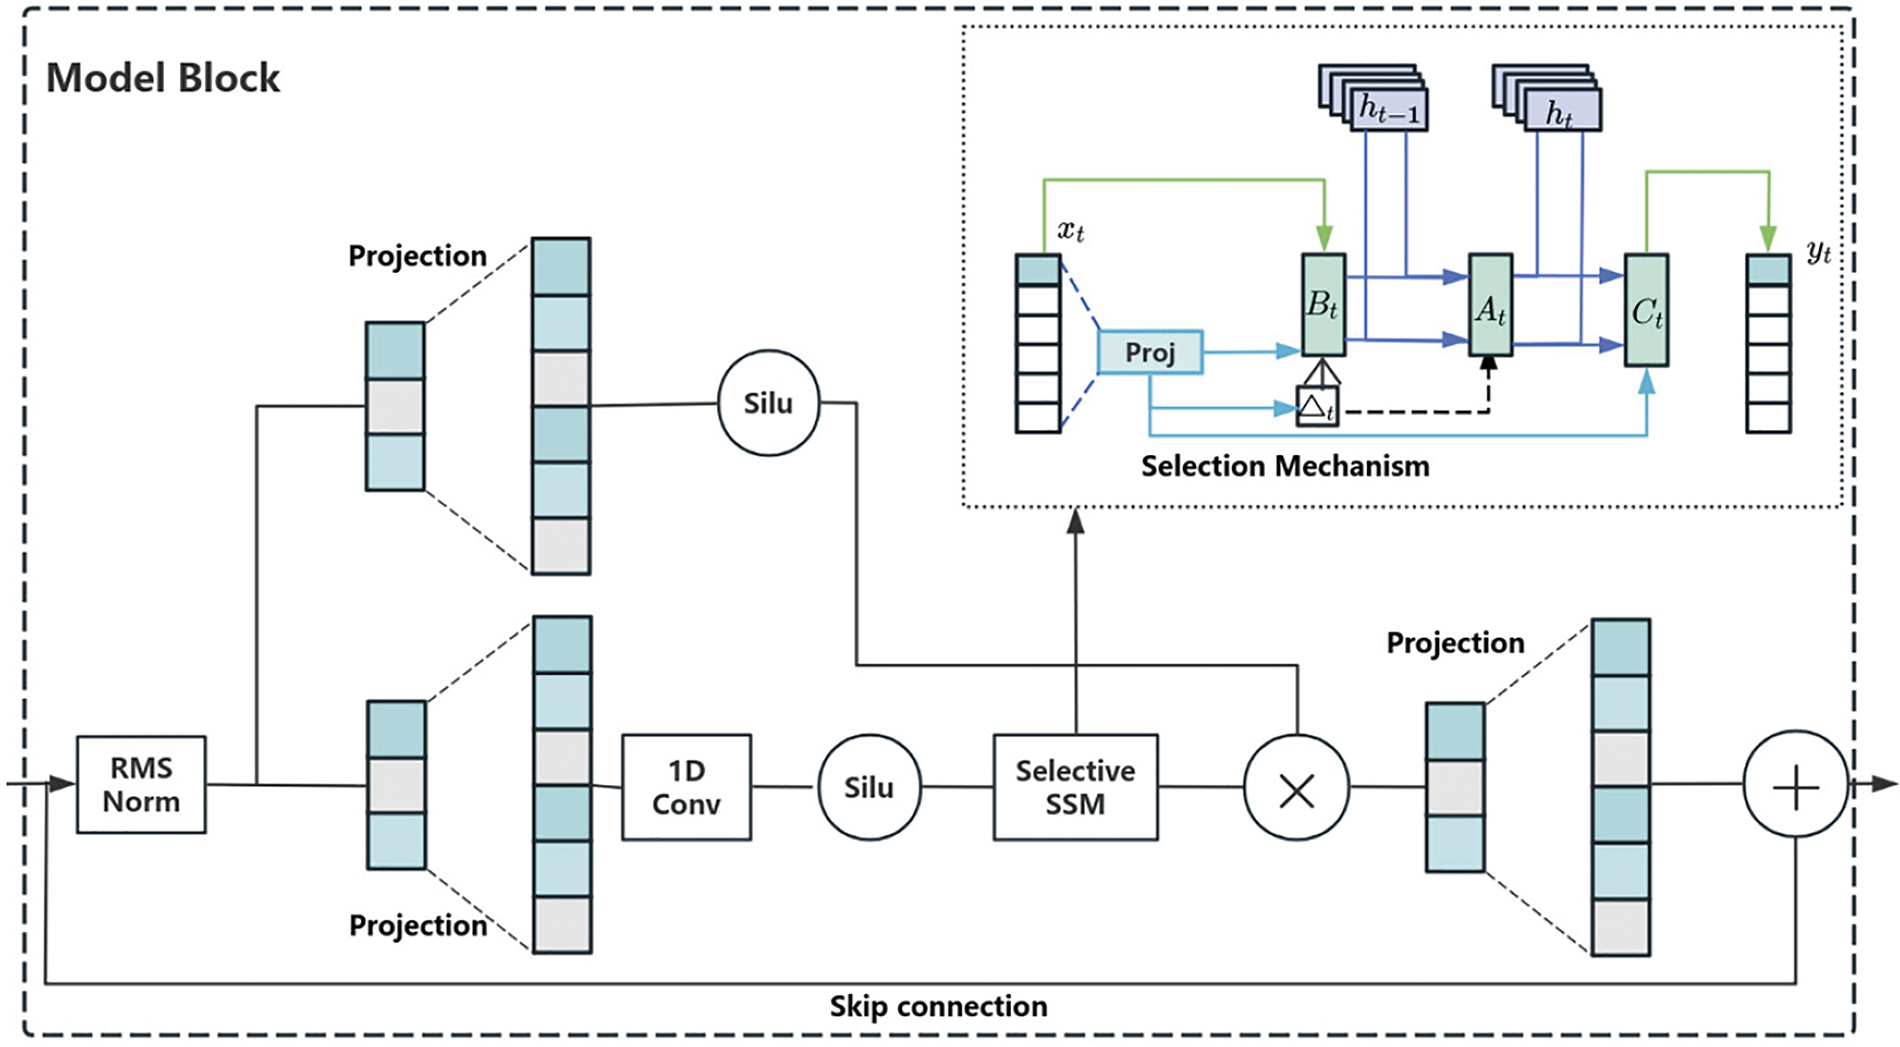
Figure 4: Schematic diagram of model block
During training, a convolutional structure is employed to bypass the state function, leveraging GPUs to facilitate parallel computation throughout the training process. When the input data
here,
Given an input
During prediction, we use an RNN with a nonlinear activation function to obtain
Matrices
here,
where
Selection Mechanism: Traditional SSM exhibits time invariance, treating all features equally without distinguishing between important and unnecessary ones. To enhance performance in handling complex tasks, a time-varying selection mechanism has been devised on top of the traditional SSM, parameterizing the weight matrix based on model inputs. This innovation enables SSM to filter out irrelevant information while retaining key information over the long term. Formally, the selection mechanism involves setting the interval
where
here, SSM is the state space model function. The final output is:
here,
3.5 Loss Function Construction
The cross-entropy loss function is based on the probability of samples belonging to various categories and typically has a high computational complexity. IoT edge devices have limited computational resources, and in the process of traffic detection, the proportion of positive samples is relatively large, which is a practical problem.
Due to the significant class imbalance problem in the training set, it is necessary to prevent the loss function from optimizing one class while suppressing other classes. Instead of using cross-entropy, the
here,
3.6 Testing and Detection Stage
In the testing phase, the test set is first subjected to data preprocessing, namely data normalization, to ensure consistency between the test data and the training data in terms of feature distribution. Subsequently, feature selection is performed on the test data based on the subset of features selected during the training phase to ensure consistency with the features of the training set. Finally, load the optimized training model and perform malicious traffic detection and classification on the test samples to evaluate the model.
4 Experiment and Result Analysis
In this section, we introduce the datasets used in the experimental design and their characteristics and provide a detailed description of the key metrics for evaluating the model performance. Meanwhile, experiments are designed to illustrate the validation of the methodology of this paper, and the experimental part includes the evaluation of the model with feature selection, feature selection experiments, and comparison experiments of models with different classification methods.
4.1 Experimental Environment and Dataset
This experiment was conducted on a server cluster based on the x86-64 architecture, equipped with an Intel Xeon Silver 4214R processor supporting the IA-32/x86-64 dual instruction set and AVX2/AES-NI accelerated instructions. The system integrates 48 logical processors with 2 × DDR4-2666 memory controllers, configured with a 512 GB NVMe SSD system disk and a 10 × 4 TB SATA HDD storage array, and achieves high-speed network interconnection through 2 × 10 GbE interfaces. The graphics card used is a Tesla V100-SXM2-32 GB. The programming environment includes Python 3.10, Mamba-ssm2.2.2, Torch2.3.1 + cu118, and Scikit-learn version 1.5.
To validate the effectiveness and detection performance of FSMMTD in real IoT environments, we utilized two datasets: the public IoT intrusion detection dataset ToN_IoT and the private dataset Malicious_TLS. The ToN_IoT dataset, which is the primary focus of this paper, consists of traffic captured in real IoT environments. It contains 44-dimensional features and 9 categories of attack classes. The Malicious_TLS dataset [15], used as supplementary validation, is a four-year dataset of malicious traffic captured from real edge network devices, where all benign traffic is encrypted using TLS technology. This dataset includes 87-dimensional features and 21 categories of attack classes.
The experiment selects four common evaluation criteria in the field of malicious traffic detection and classification: Accuracy (Acc), Precision (Pr), Recall (Rc), and F1 score (F1) to evaluate the classification performance of the model. The calculation method of evaluation indicators is shown in Formulas (16)–(19):
here,
TP is the true class (referring to correctly classifying malicious samples as malicious samples), FN is the false negative class (referring to incorrectly classifying malicious samples as normal samples), FP is the false positive class (referring to incorrectly classifying normal samples as malicious samples), and TN is the true negative class (referring to correctly classifying normal samples as normal samples).
The model loss function can be used to measure the difference between the predicted and actual results of the model. This article uses the cross-entropy loss function for evaluation, and the calculation method is shown in the formula:
4.3 Comparative Experiment of Different Feature Selection Methods
This section presents a comparative analysis conducted on the TON_IoT dataset. Five machine learning models—Naive Bayes (NB), K-Nearest Neighbors (kNN), Multilayer Perceptron (MLP), Decision Tree (DT), and Random Forest (RF)—are employed for evaluation. All models are implemented using their default hyperparameter settings. A five-fold cross-validation strategy is applied across all features, with the average performance metrics computed over the five iterations. Table 3 provides a summary of the performance metrics for the machine learning models when utilizing all features, where the best-performing results are indicated in bold font.
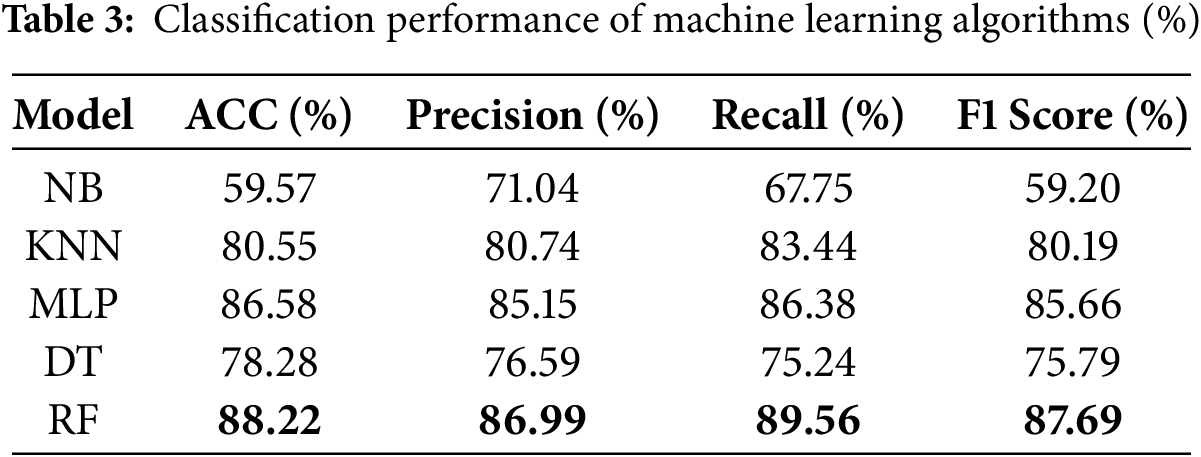
As shown in Table 3, the Random Forest (RF) model exhibits superior performance metrics compared to other classifiers when using all features. Specifically, the accuracy, precision, recall, and F1-score of the RF model are enhanced by 1.64%, 1.84%, 3.18%, and 2.03%, respectively, over the Multilayer Perceptron (MLP) model, which ranks second in accuracy.
To validate the effectiveness of the feature selection algorithm proposed in this study, performance comparison experiments were conducted based on multi-classification tasks. The proposed FSMMTD method was evaluated alongside the Pearson Correlation Coefficient (Pearson) algorithm and the Principal Component Analysis (PCA) algorithm, with the feature dimension reduced to 30 dimensions in all cases. The experimental results, presented in Table 4, highlight the best-performing feature selection and extraction results in bold.
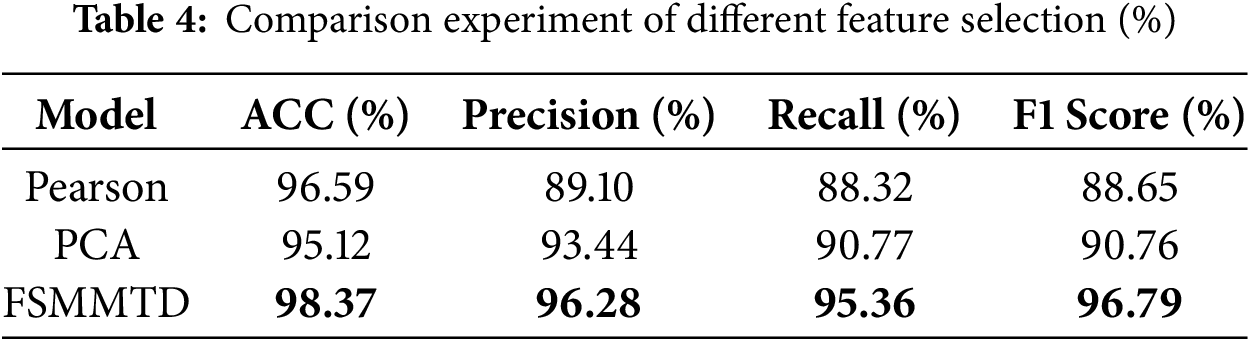
The experimental results demonstrate that the FSMMTD method proposed in this study significantly outperforms the traditional Pearson Correlation Coefficient (Pearson) algorithm and Principal Component Analysis (PCA) algorithm across all evaluation metrics. Specifically, FSMMTD achieves optimal performance in accuracy, precision, recall, and F1-score, surpassing the Pearson algorithm by 1.78%, 7.18%, 7.04%, and 8.14%, and the PCA algorithm by 3.25%, 2.84%, 4.59%, and 6.03%, respectively.
The Pearson algorithm is limited to measuring only linear relationships between variables, and its performance heavily depends on the characteristics of the training data, which directly influences the model’s training effectiveness. Similarly, the PCA algorithm relies primarily on variance during dimensionality reduction, which may exclude non-principal components with low variance but significant information about sample differences, thereby impacting subsequent data processing. These limitations explain why neither method achieves superior results.
In contrast, the proposed FSMMTD method leverages the intrinsic properties of the data itself to more accurately capture nonlinear feature relationships and effectively filter redundant information. This approach enables the selection of more discriminative features, ultimately enhancing the classification accuracy of the model.
The optimal parameter combination was determined using the grid search algorithm with five-fold cross-validation, and the specific configuration is provided in Table 5.
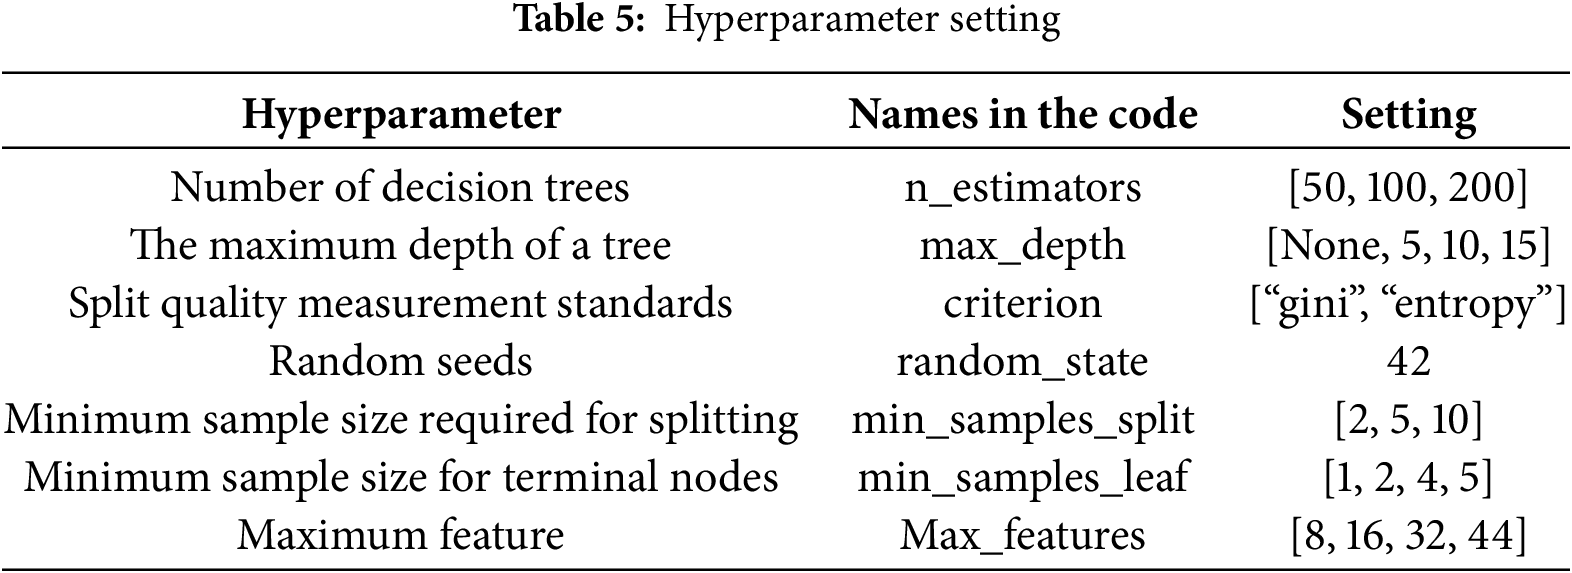
As shown in Table 5, the number of decision trees ranges from 50 to 200 with a step size of 10; the maximum depth of the tree includes “None” and integer values from 3 to 14; the minimum number of samples required for splitting ranges from 2 to 10. The optimal hyperparameters selected for the final experiment are as follows: the number of decision trees is 150, the split quality measure is “entropy”, the maximum depth of the tree is 12, the minimum number of samples required for splitting is 5, the minimum number of samples at the terminal nodes is 5, and the maximum number of features used in constructing each tree is 34.
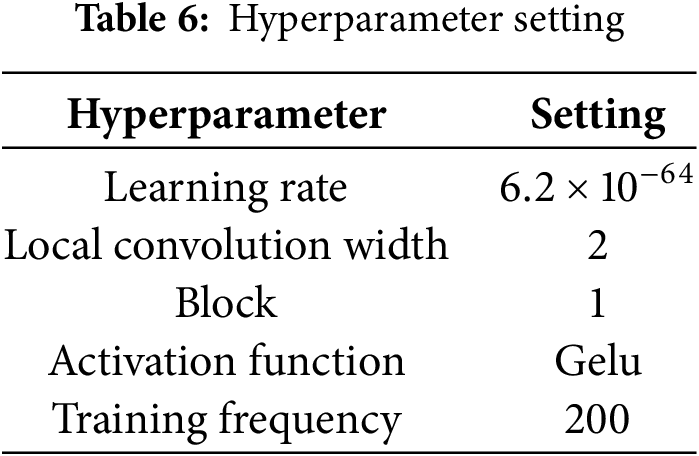
The hyperparameters of the FSMMTD model are selected as shown in Table 6. In actual training, when the accuracy of the model evaluation index is not optimized within 50 rounds, the training is stopped.
4.5 Feature Selection Experiment
For the malicious traffic dataset, the random forest method is used to calculate and rank the importance of the 65-dimensional features mentioned above, and the importance values are normalized within the range of [0, 1]. During the calculation process, eliminate the features with the importance of 0 [‘sslw_version’, ‘ssl_Subject’, ‘ssl_issuer’, ‘service_gssapi’]. Due to the significant difference in feature importance, it is difficult to distinguish smaller values after visualization. Therefore, the first 35 dimensions of important feature data are visualized, as shown in Fig. 5.
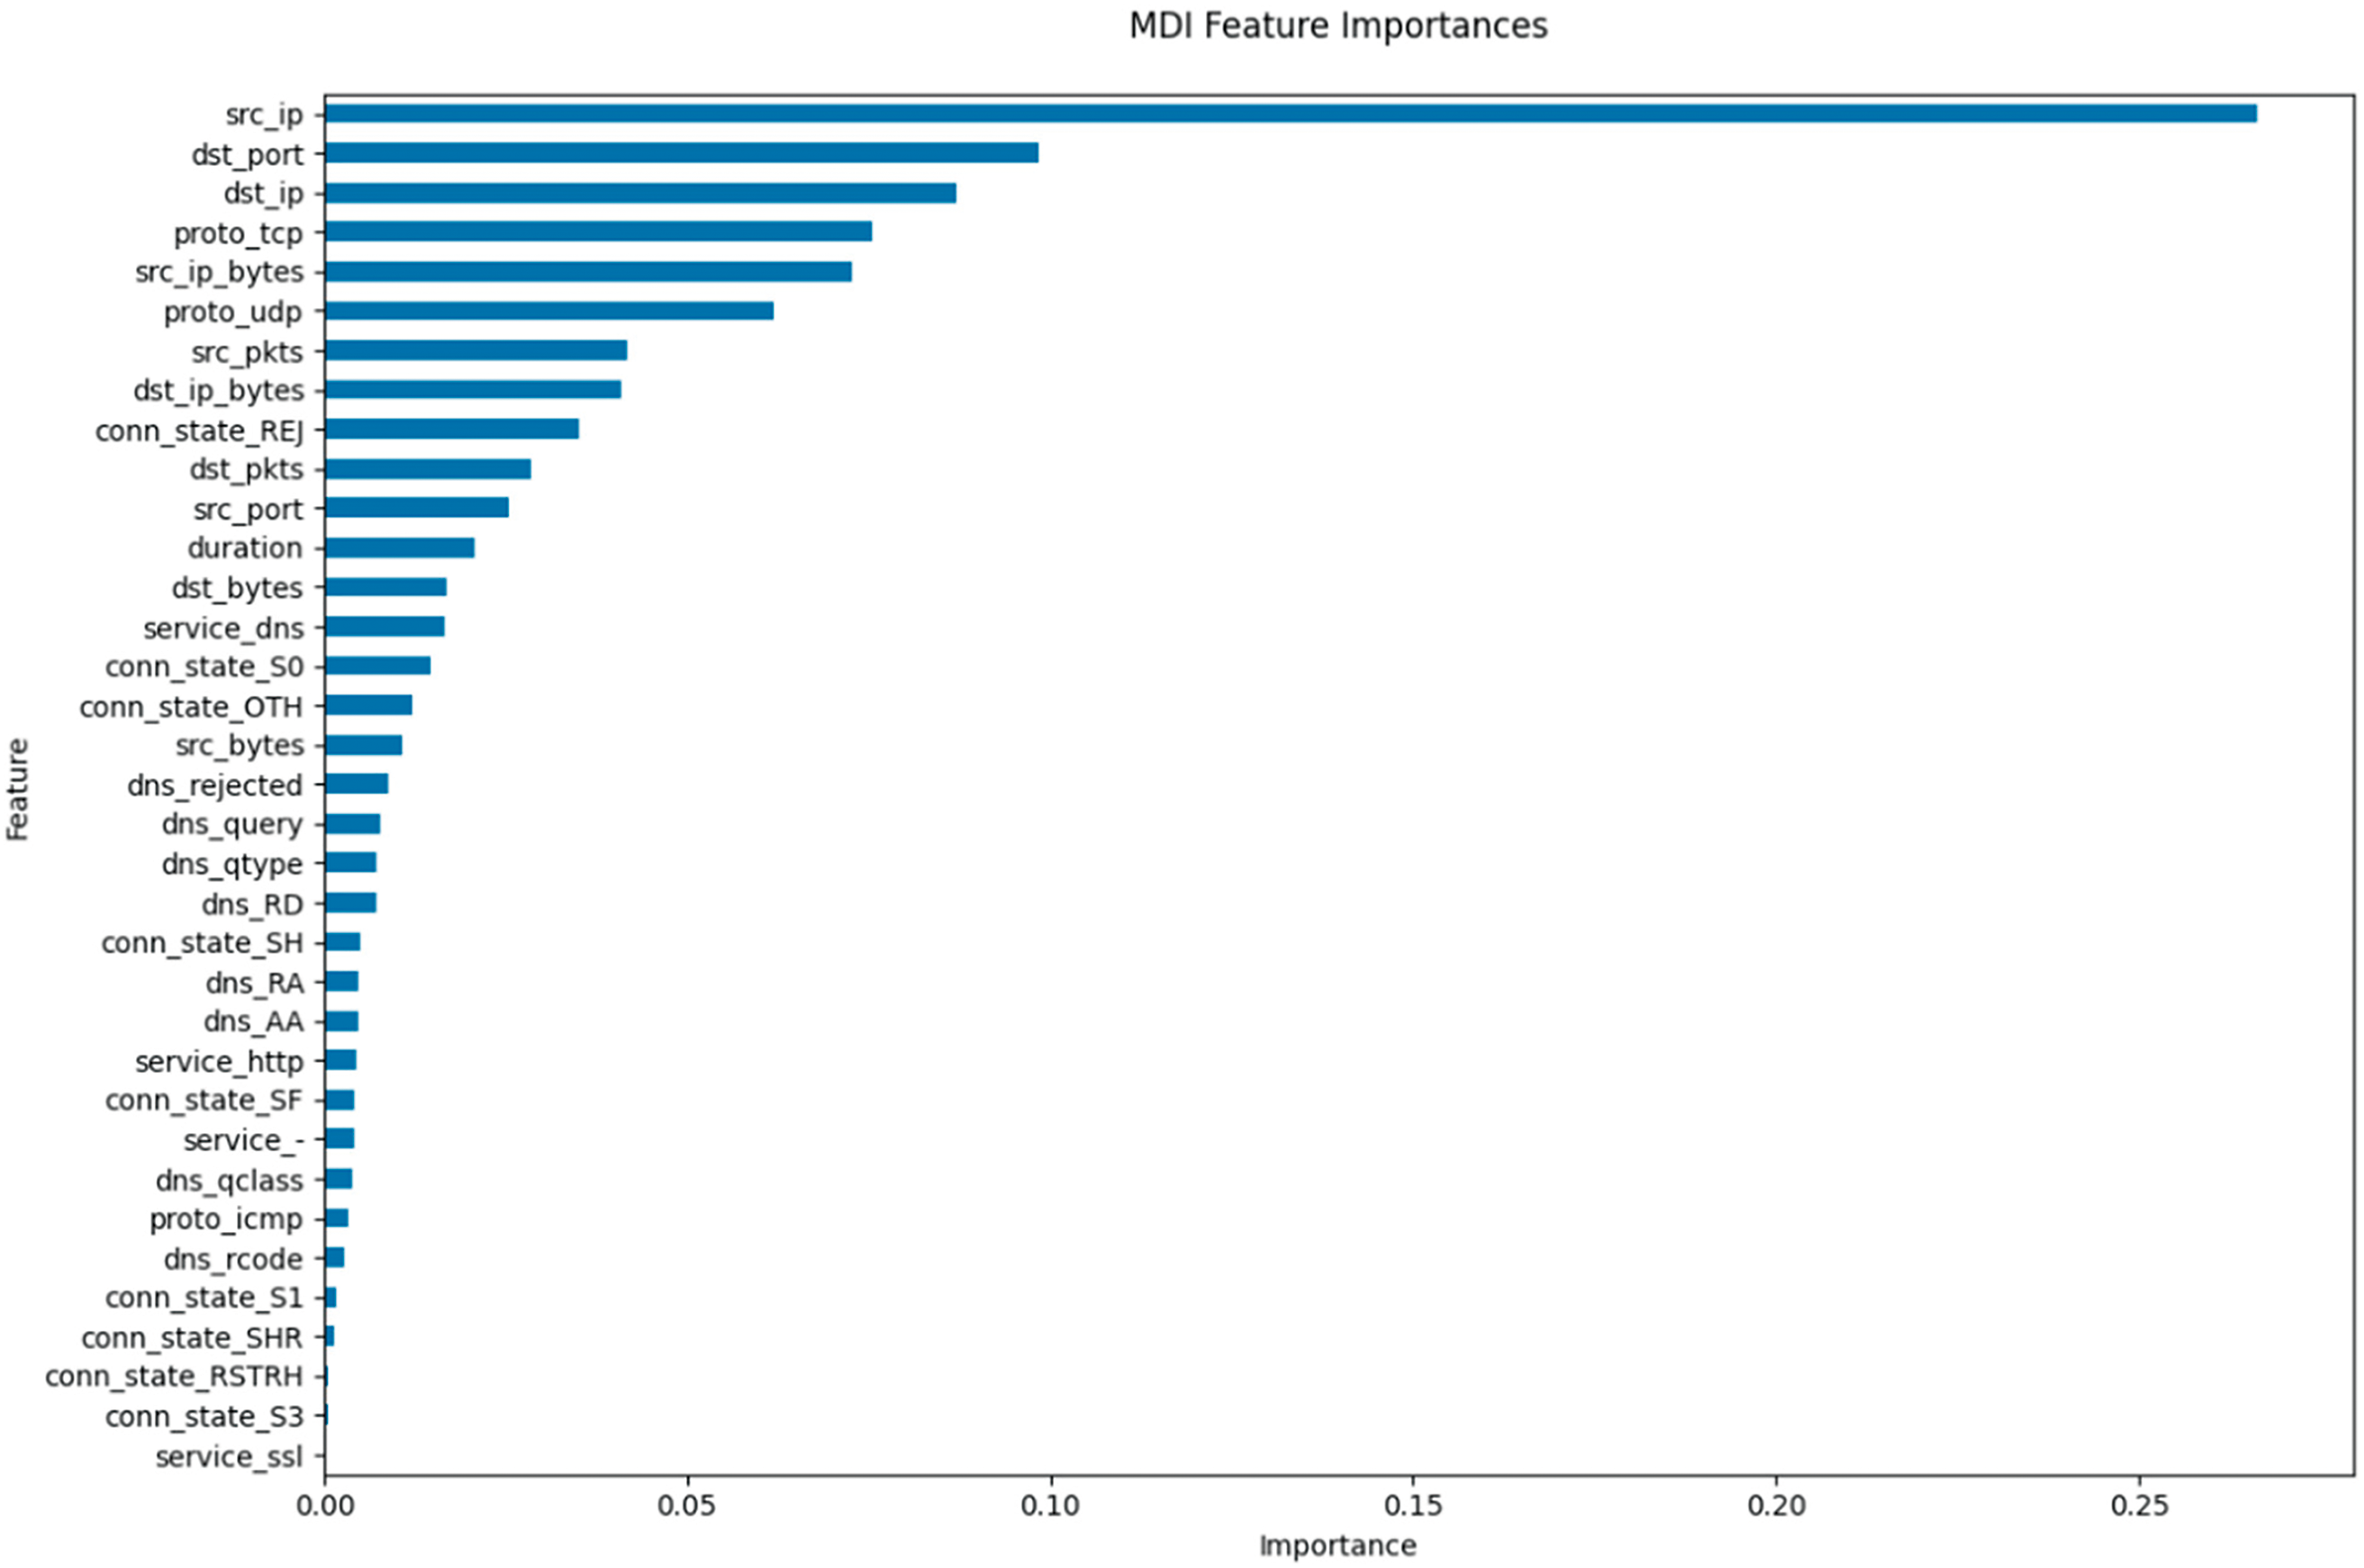
Figure 5: Selection of important features
As shown in Fig. 5, the top 35-dimensional features are ranked in descending order of importance, spanning the network layer, transport layer, application layer, and anomaly detection-related features. Feature importance exhibits a highly skewed distribution: src_ip (source IP) dominates with an importance score approaching 0.25—significantly higher than other features confirming its role as a critical identifier for malicious traffic detection. Subsequent network layer features include dst_port (destination port), dst_ip (destination IP), and proto_tcp (TCP protocol), collectively emphasizing the significance of network connectivity patterns.
Within the transport layer, statistical metrics such as src_pkts (source packet count), dst_pkts (destination packet count), and duration (connection duration) demonstrate notable importance, highlighting traffic behavioral characteristics. Application-layer protocol identifiers like service_dns (DNS service) and service_http (HTTP service) exhibit moderate relevance, suggesting their auxiliary role in traffic classification. Conversely, anomaly detection markers such as conn_state_REJ (connection rejected) and dns_rejected (DNS query rejection) show limited individual importance yet retain utility in flagging aberrant behaviors.
SSL-related attributes (e.g., ssl_version) display weak malicious traffic correlations, likely due to encryption obfuscation. Features like service_gssapi (GSSAPI service) were excluded from the analysis owing to their low dataset prevalence and minimal classification impact.
The importance spectrum of these 35 features ranges from 0.25 to near-zero values, necessitating grouped visualization for clearer interpretation, as shown in Fig. 6. They were categorized into six groups according to the importance intervals. Among them, it can be analyzed that the features with importance values in the interval [0.016, 0.5] rank from 1 to 12 in importance; Features with importance values in the range of [0.0002, 0.012], ranked from 13 to 23 in importance; Features with importance values in the range of [0.0001, 0.0015], ranked between 24 and 34 in importance; The importance of the following features is infinitely close to zero. Further observation from the figure reveals that the first group is dominated by the network layer and transport layer, with significantly higher feature importance than the other groups, which plays a dominant role in model decision-making; the second group mainly contains DNS-related features and connection state features; the third group involves application layer protocols and complex connection states; and after that, features such as SSL-related protocols are of relatively low importance. The grouped histograms visually highlight the differences in feature importance levels, enabling the rapid identification of key features.
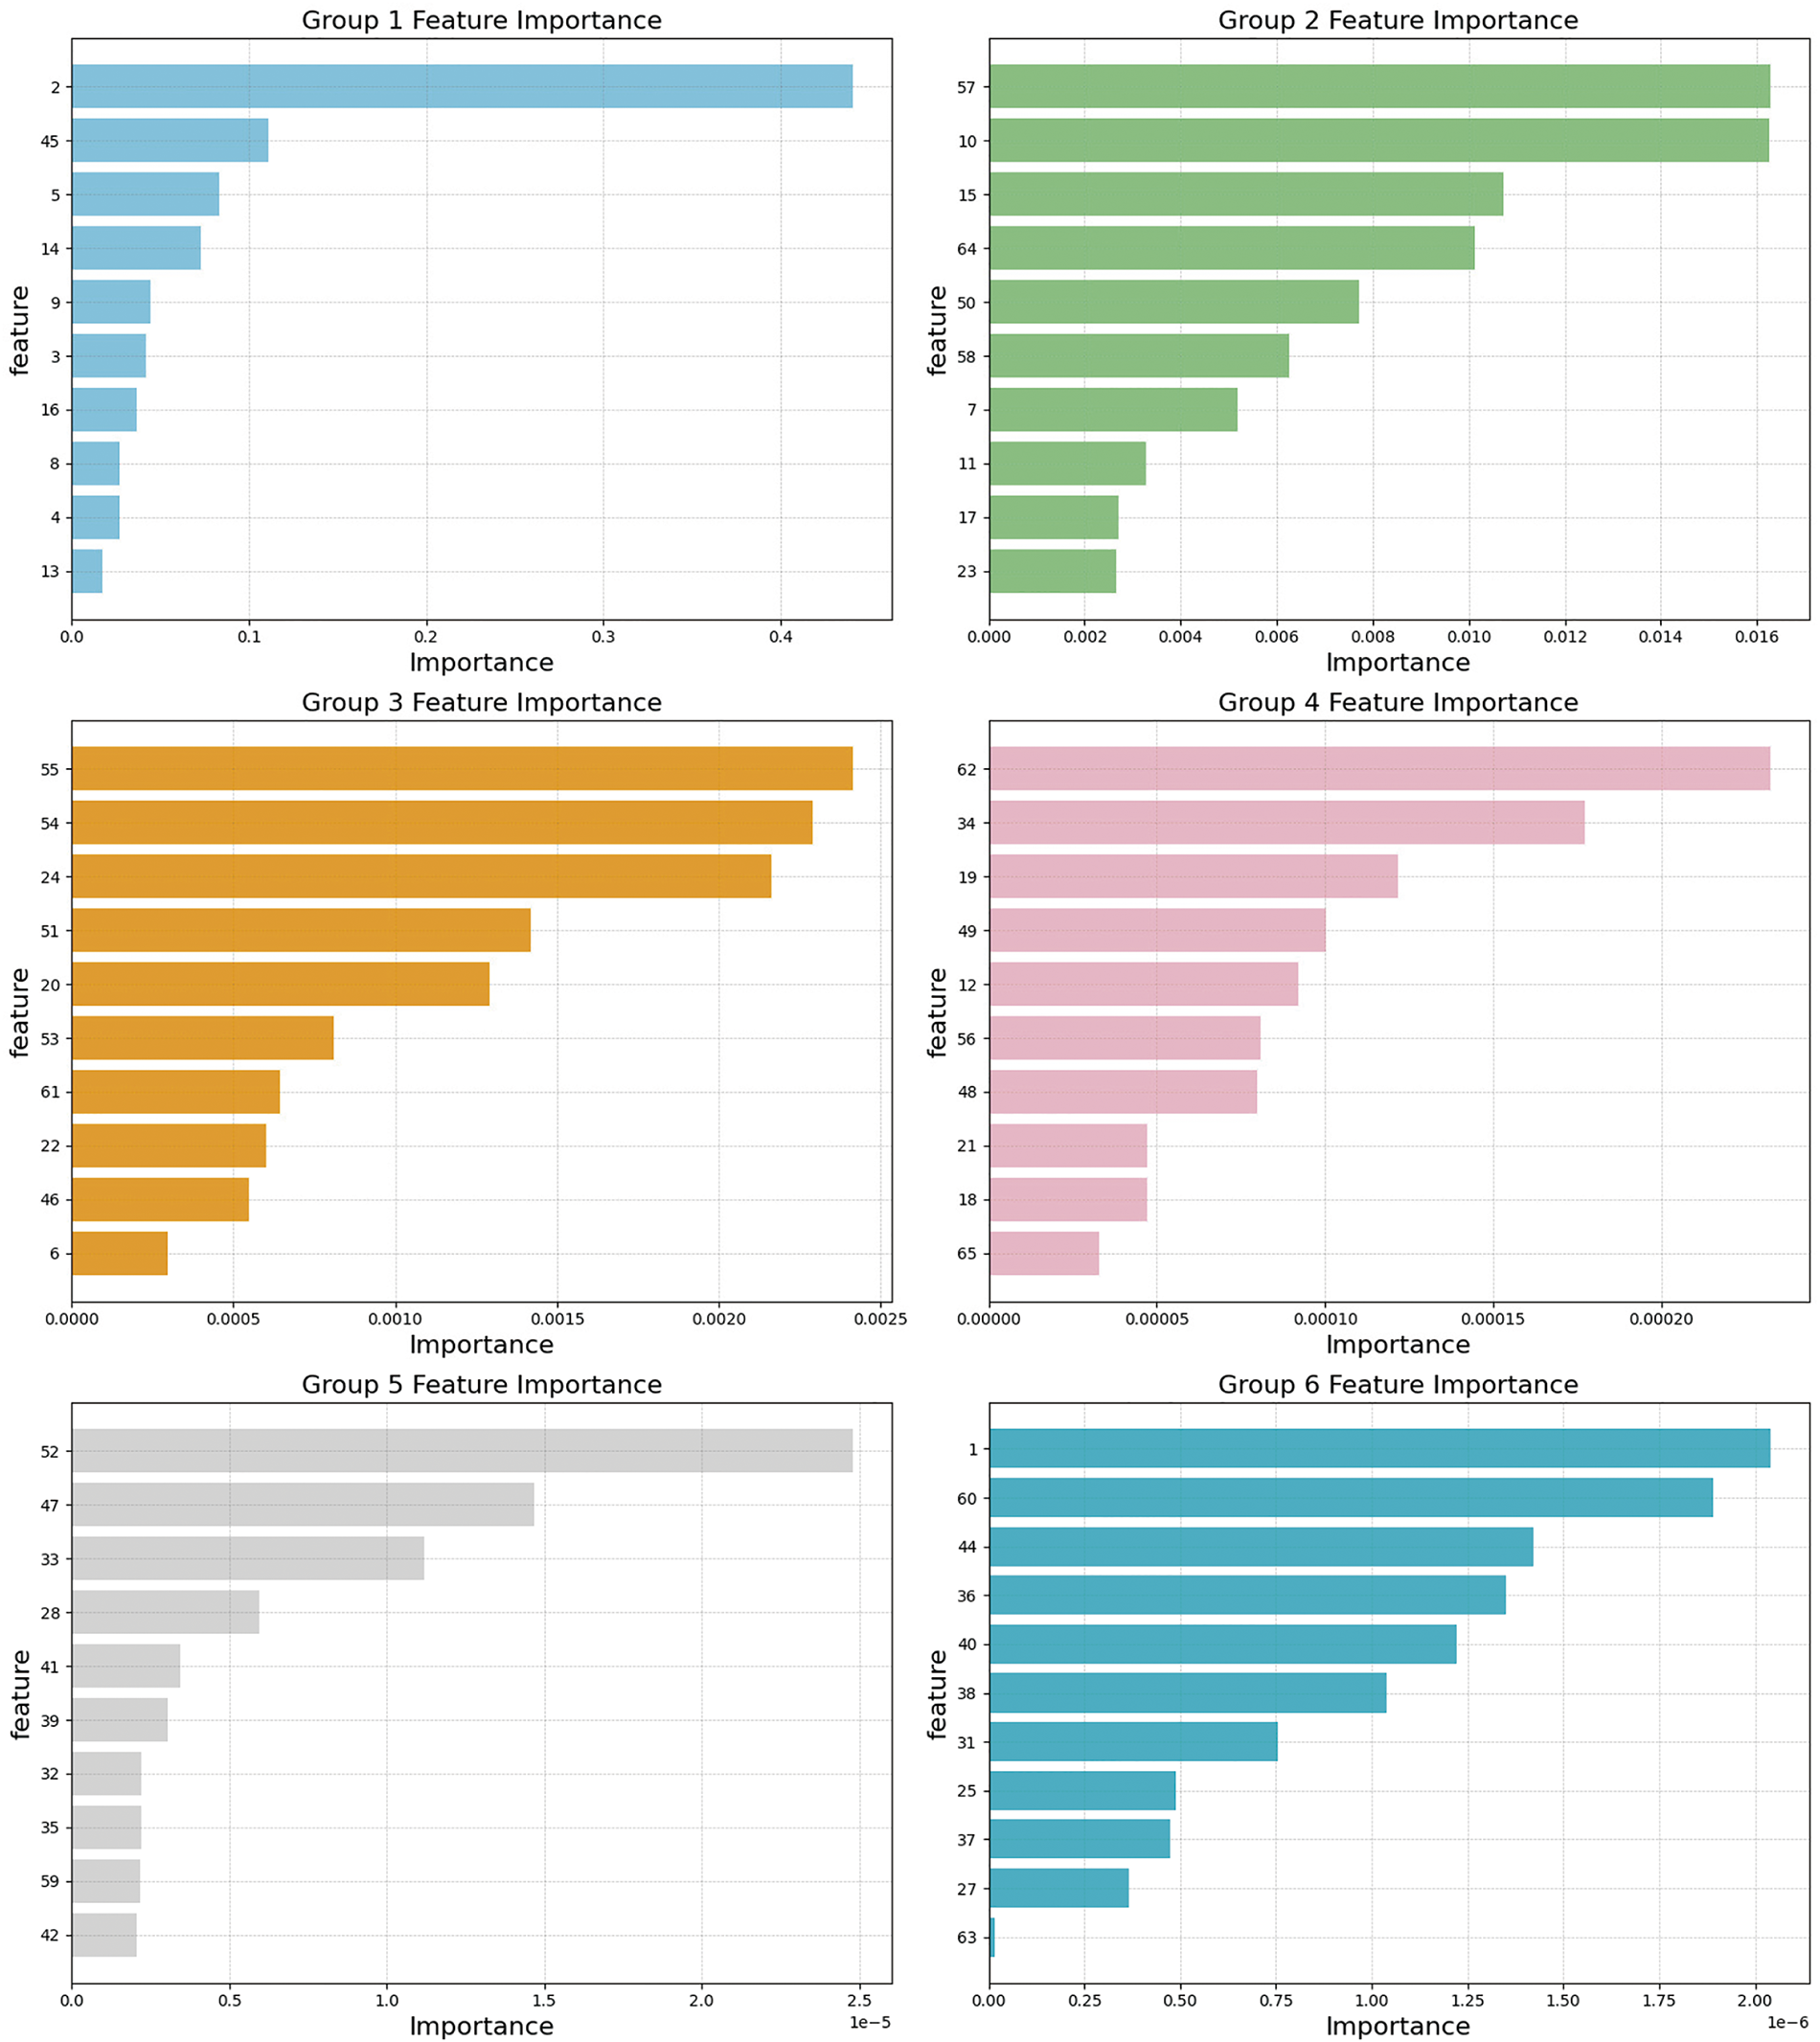
Figure 6: Selection of important features
Feature selection based solely on feature importance is relatively limited. To further select features, a correlation matrix was drawn for the first 35 dimensions of features, as shown in Fig. 7. From the graph, there are relationships and dependencies between different variables. The darker the color, the higher the correlation, the highest correlation is 1, dark green is used, green indicates a positive correlation; the closer the correlation is to 0, the closer it is to white; the lowest correlation is −1, dark red is used, red indicates a negative correlation. The correlation graph uses different colors to annotate the strength of the relationship between two variables, visually enhancing the interpretability of the correlation between variables.
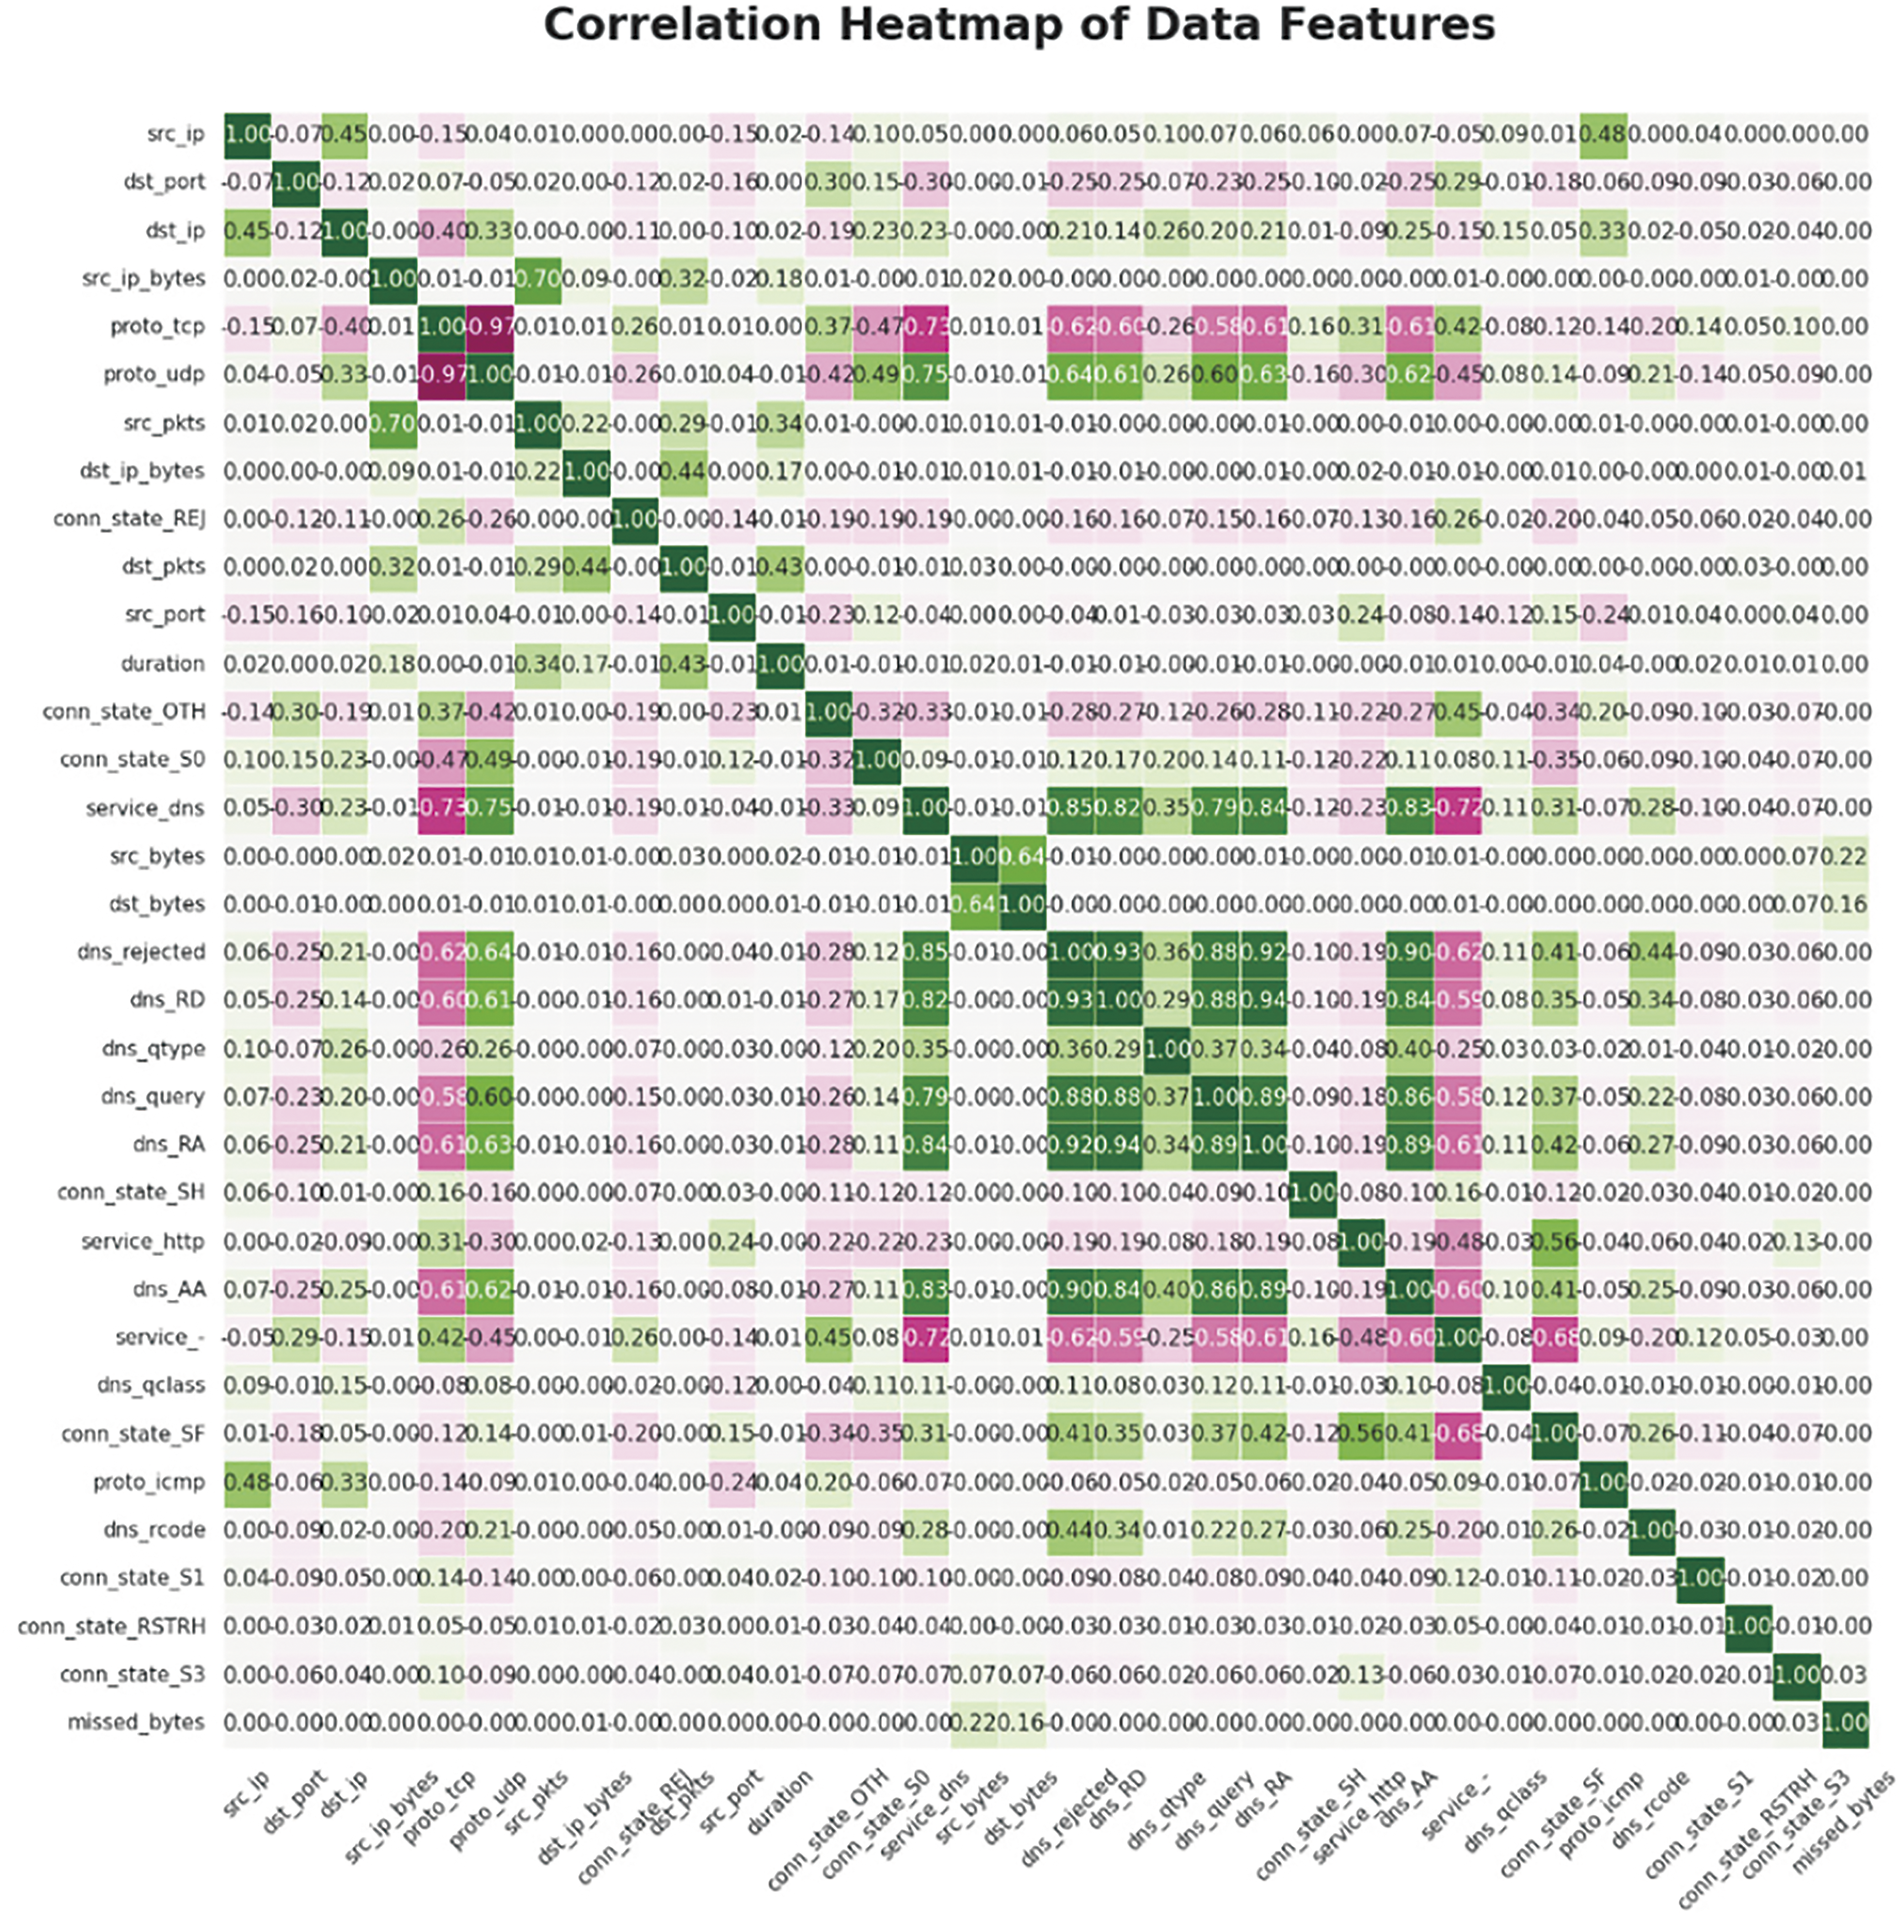
Figure 7: Correlation coefficient diagram of important features
Then, based on the correlation coefficients of important features, calculate the average correlation score for each feature, as shown in Fig. 8. Select features within the range of
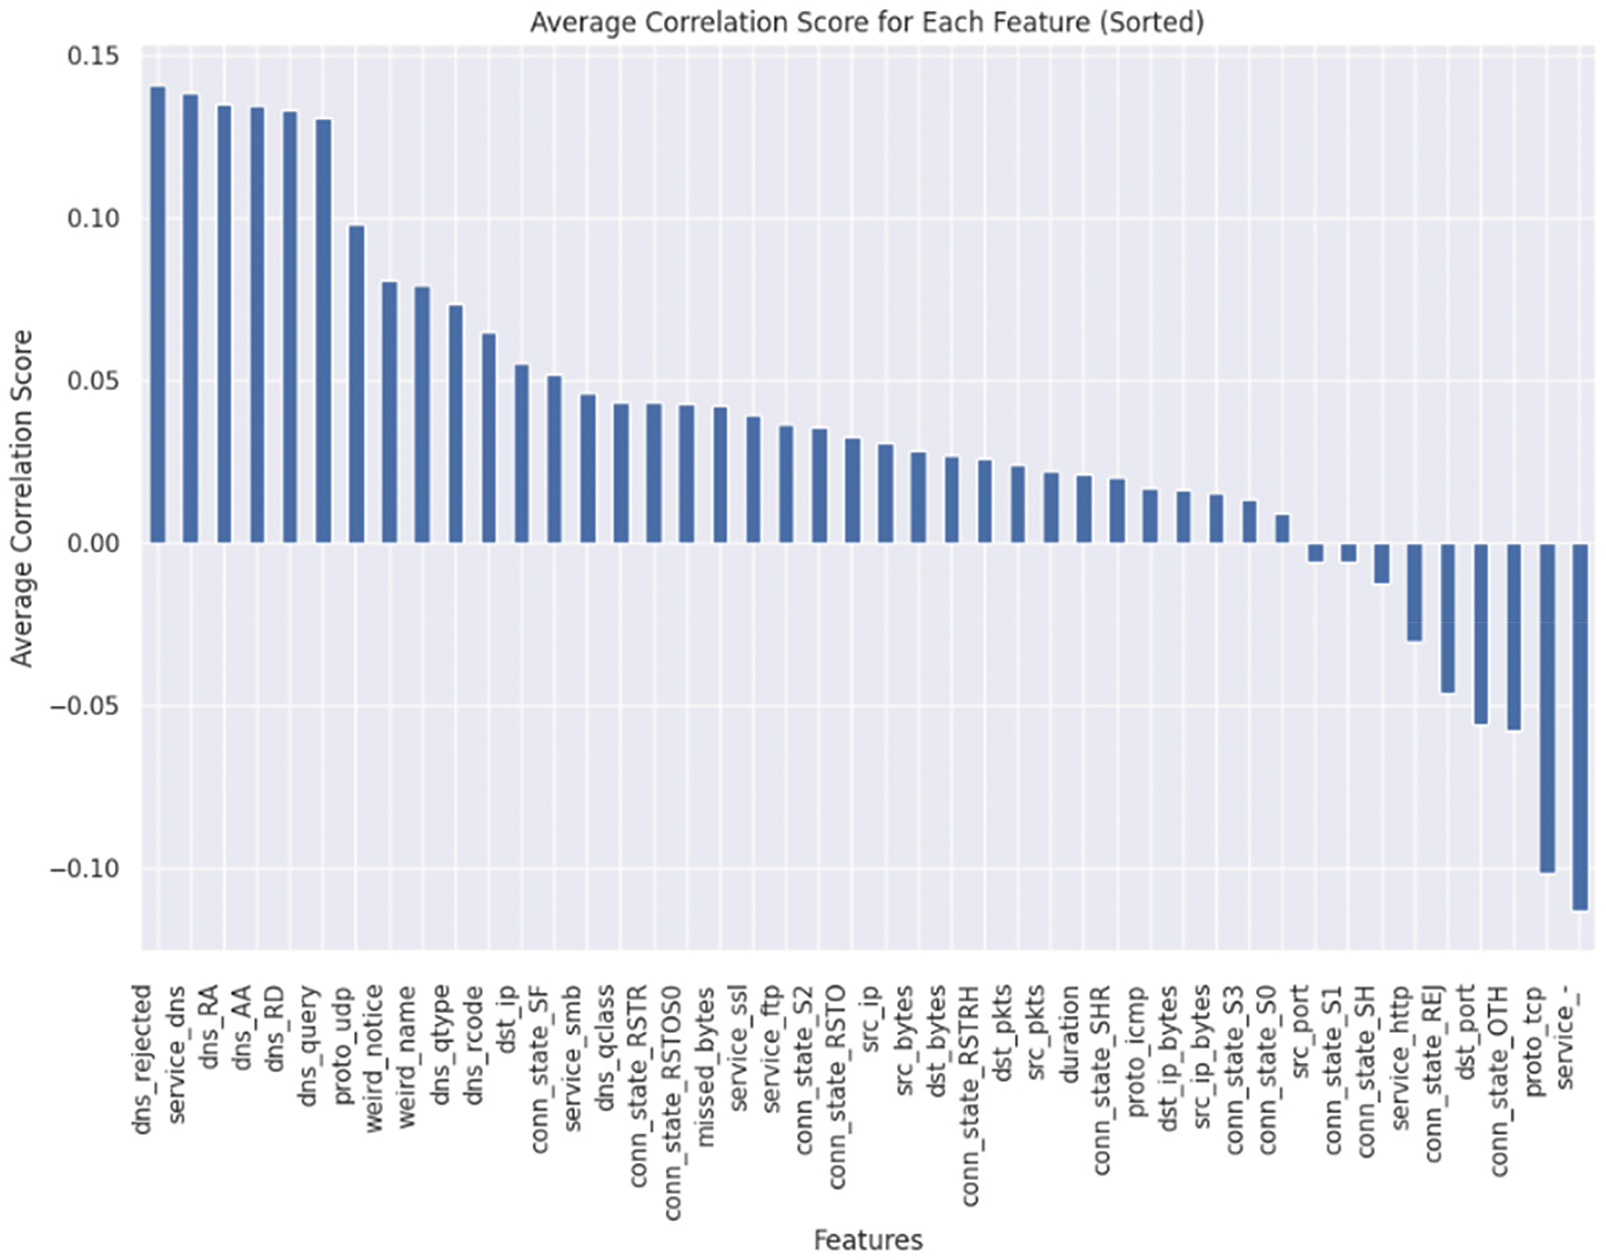
Figure 8: Correlation coefficient diagram of important features
Using the FSMMTD method proposed in this article, the model loss and accuracy as shown in Fig. 9 were obtained, with a learning rate of
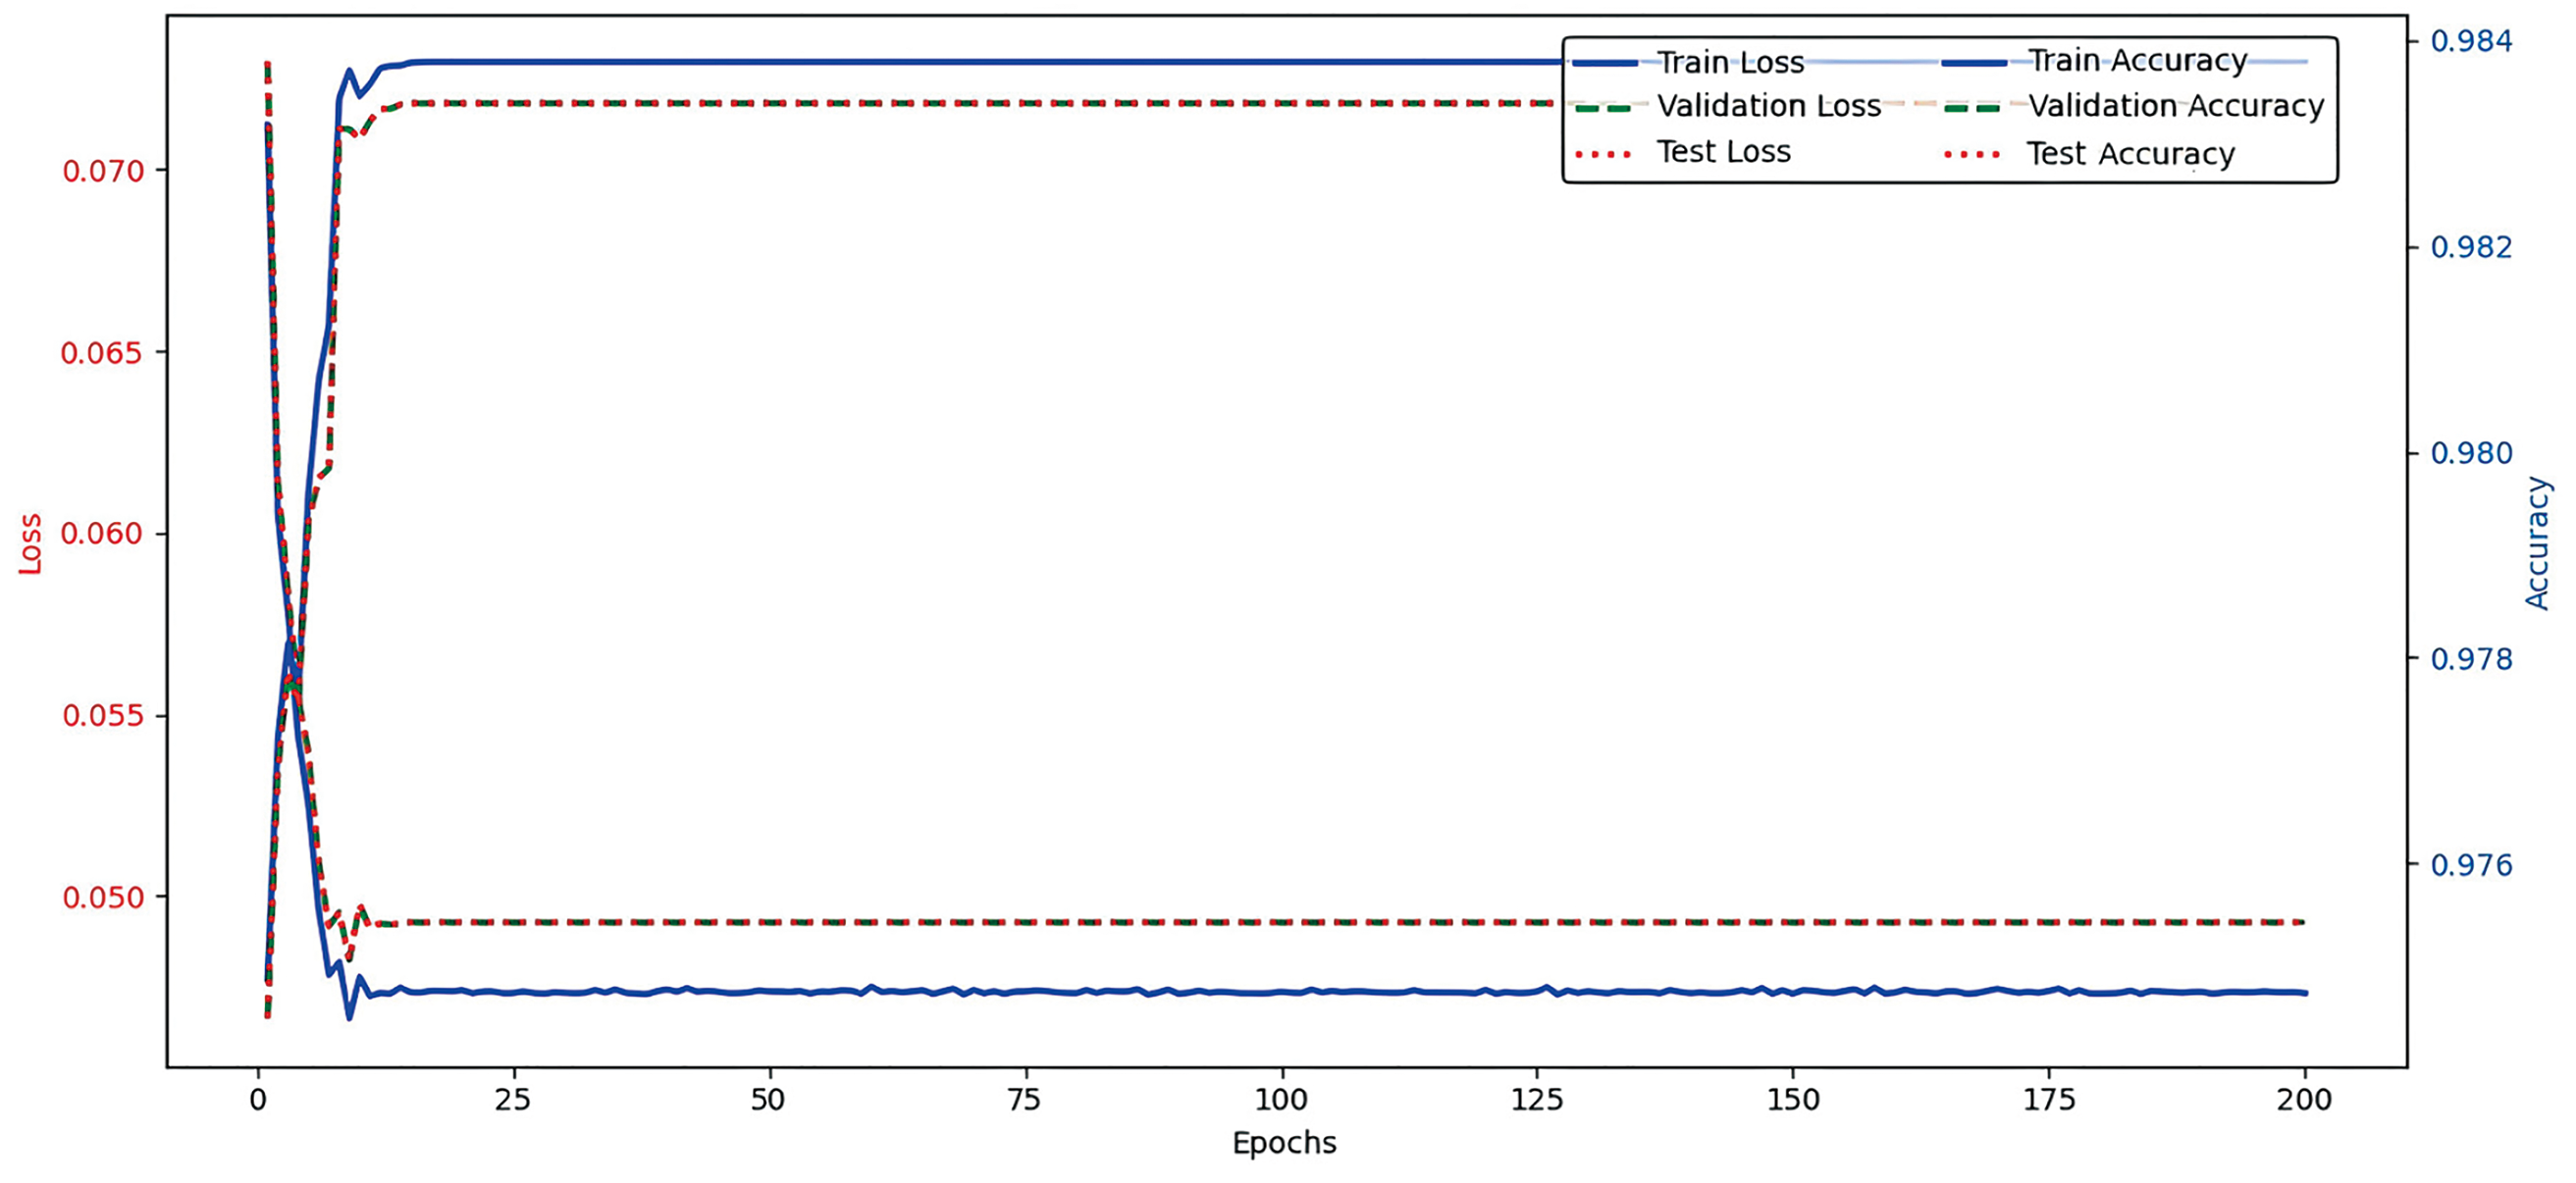
Figure 9: Model loss function and accuracy
As shown in Fig. 9, the FSMMTD model exhibits the evolving trends of training loss, training accuracy, validation loss, and validation accuracy across training epochs: the training loss progressively decreases from an initial value of 0.070 to stabilize around 0.050, while the training accuracy rapidly increases to 98.4% with sustained stability. The validation metrics demonstrate synchronized trajectories with the training curves, where the validation accuracy achieves 98.37%, collectively indicating effective training data fitting and robust generalization capability without observable overfitting. After 50 epochs, the loss curves plateau with accelerated convergence rates and strong tolerance to hyperparameter perturbations. The smooth optimization patterns in Fig. 9 empirically validate FSMMTD’s architectural efficacy.
4.6 Comparative Experiment of Different Classification Methods
To verify the detection performance of the proposed method, the classification performance of multi-classification was validated on the TON_IoT dataset. Four evaluation metrics, Accuracy (ACC), Precision, Recall, and F1 score, were used to compare the performance of the proposed method on nine network traffic detection methods. The test results are shown in the Table 7 below. This article selects six methods, RF, ExtraTrees IDS [23], E-GraphSAGE [14], LSTM, GRU-FCN [24], and XCM [25], for comparative experiments. Bold values denote the optimal results under each specified evaluation metric.
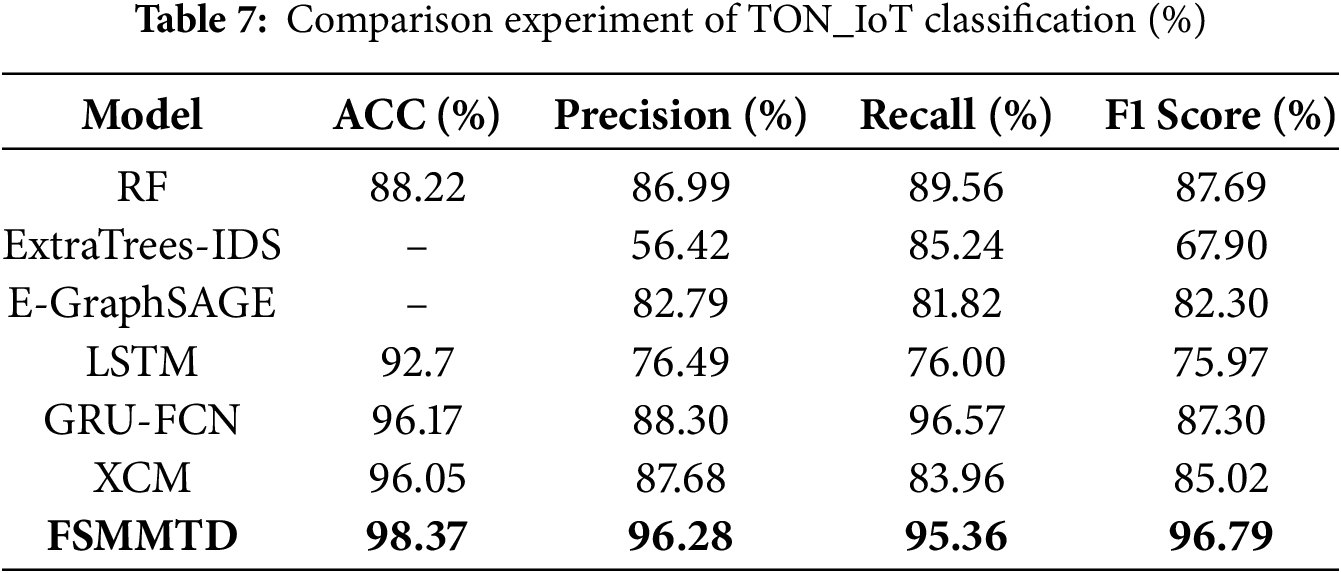
As shown in Fig. 3, despite the severe imbalance of various types of traffic samples in the TON_IoT dataset and the high requirements for detection methods, FSMMTD still achieved excellent detection performance. As shown in Table 7, the FSMMTD proposed in this paper achieved 98.37%, 96.28%, 95.36%, and 96.79% in accuracy, precision, recall, and F1 score, respectively, achieving the best detection performance in comparative experiments. Compared with the second-ranked GRU-FCN, it improved by 2.2%, 7.98%, and 9.49% in accuracy, precision, and F1 score, respectively; The recall rate is slightly lower by 1.21%, indicating that the FSMMTD model is slightly inferior to the GRU-FCN model in distinguishing positive samples, and the model is more cautious in predicting malicious traffic. Compared with RF, ExtraTrees IDS, E-GraphSAGE, and XCM, the four advanced methods have improved accuracy, precision, recall, and F1 score by over 2.32%, 8.6%, 5.8%, and 9.1%, respectively. Compared to traditional LSTM-based IoT malicious traffic detection methods, FSMMTD has improved accuracy, precision, recall, and F1 score by over 5.67%, 19.79%, 19.36%, and 20.82%, respectively, demonstrating its superiority and effectiveness.
To ensure the generalization of the model, 22 classification performance experiments are conducted on the Malicious_TLS dataset to validate the experimental results, which are shown in the following table (Table 8).
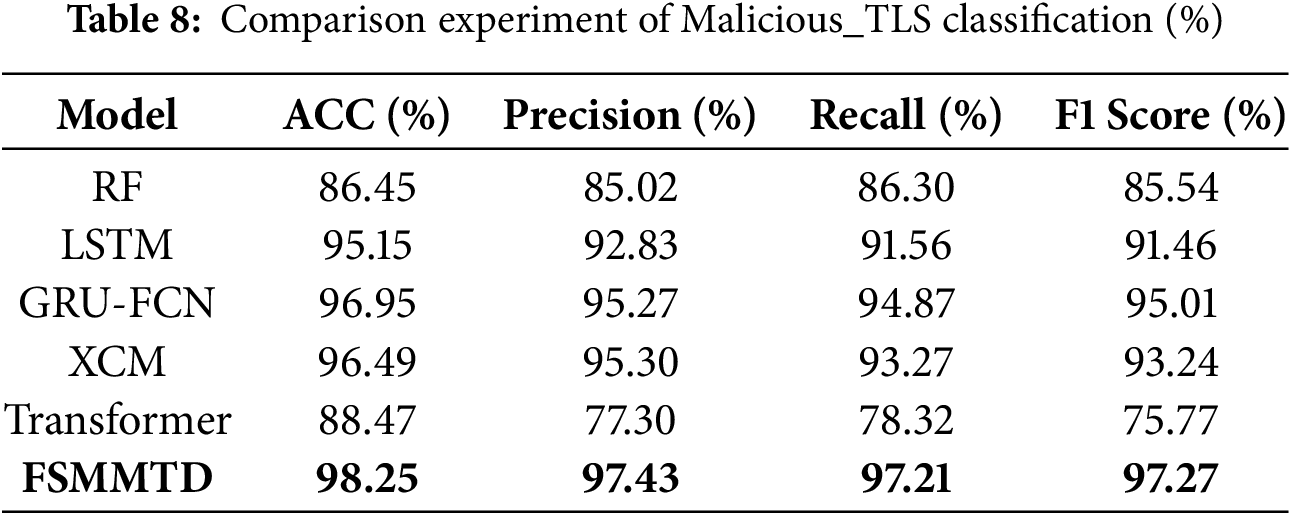
From Table 8, it can be seen that the FSMMTD proposed in this paper achieves 98.25%, 97.43%, 97.21%, and 97.27% in accuracy, precision, recall rate, and F1 score, respectively, and demonstrates the best detection performance in the comparative experiments. Compared with the second-ranked GRU-FCN, the accuracy, precision, recall rate, and F1 score show improvements of 1.3%, 2.16%, 2.34%, and 2.2%, respectively. Compared with RF, XCM, and Transformer, the accuracy, precision, recall rate, and F1 score improved by 1.76%, 2.13%, 3.94%, and 4.03%, respectively. Compared with the traditional LSTM-based malicious traffic detection methods, FSMMTD improves the accuracy, precision, detection rate, and F1 score by 3.1%, 4.6%, 5.65%, and 5.81%, respectively, which demonstrate its superiority and effectiveness. Bold values denote the optimal results under each specified evaluation metric.
This paper proposes an IoT malicious traffic detection method called FSMMTD, which uses a random forest method for feature selection, and then uses Mamba block to process high-dimensional features of IoT network traffic, efficiently extracting deep global features of network traffic. Focal Loss is used to solve the class imbalance problem faced by IoT intrusion detection and enhance the model’s attention to minority class samples. To verify the effectiveness of the proposed method, it was validated on the publicly available dataset ToN_IoT for detecting malicious traffic in the Internet of Things. Compared with other advanced methods, it has achieved better performance in all indicators.
Although this paper has achieved some results in detecting malicious traffic, further research is needed for scenarios with unlabeled data where only positive samples are available. The next step will focus on addressing this challenge to enhance the model’s generalization capability in such cases.
Acknowledgement: Not applicable.
Funding Statement: This research was funded by the National Natural Science Foundation of China, grant numbers 61876189, 61703426, and 61273275.
Author Contributions: Xuan Wu: Conceptualization, methodology, resources, writing—original draft. Yafei Song: Funding acquisition, project administration, supervision. Xiaodan Wang: Methodology, funding acquisition, project administration, supervision. Peng Wang: Software, validation. Qian Xiang: Methodology. All authors reviewed the results and approved the final version of the manuscript.
Availability of Data and Materials: The datasets related to this study can be obtained from the website: https://research.unsw.edu.au/projects/toniot-datasets (accessed on 1 January 2025). Other data information can be obtained from the corresponding author upon reasonable request.
Ethics Approval: Not applicable.
Conflicts of Interest: The authors declare no conflicts of interest to report regarding the present study.
References
1. Thakkar A, Lohiya R. A review on machine learning and deep learning perspectives of IDS for IoT: recent updates, security issues, and challenges. Arch Comput Methods Eng. 2021;28(4):3211–43. doi:10.1007/s11831-020-09496-0. [Google Scholar] [CrossRef]
2. Thakkar A, Lohiya R. A review on challenges and future research directions for machine learning-based intrusion detection system. Arch Comput Methods Eng. 2023;30(7):4245–69. doi:10.1007/s11831-023-09943-8. [Google Scholar] [CrossRef]
3. Wang X, Wang P, Song Y, Xiang Q, Li J. Recognition of high-resolution range profile sequence based on TCN with sequence length-adaptive algorithm and elastic net regularization. Expert Syst Appl. 2024;248(1):123417. doi:10.1016/j.eswa.2024.123417. [Google Scholar] [CrossRef]
4. Yang M, Wang Z. Image synthesis under limited data: a survey and taxonomy. Int J Comput Vis. 2025;2025(4):1–38. doi:10.1007/s11263-025-02357-y. [Google Scholar] [CrossRef]
5. Vasan D, Akram J, Hammoudeh M, Ahmed AF. An Advanced Ensemble Framework for defending against obfuscated Windows, Android, and IoT malware. Appl Soft Comput. 2025;173(3–4):112908. doi:10.1016/j.asoc.2025.112908. [Google Scholar] [CrossRef]
6. Wang F, Chen Y, Gao H, Li Q, Wang C. Self-supervised contrastive representation learning for classifying Internet of Things malware. Eng Appl Artif Intell. 2025;150(1):110299. doi:10.1016/j.engappai.2025.110299. [Google Scholar] [CrossRef]
7. Wang P, Wang X, Song Y, Huang J, Ding P, Yang Z. TransIDS: a transformer-based approach for intrusion detection in internet of things using label smoothing. In: 4th International Conference on Computer Engineering and Application (ICCEA); 2023 Apr 7–9; Hangzhou, China. p. 216–22. doi:10.1109/ICCEA58433.2023.10135426. [Google Scholar] [CrossRef]
8. Vaswani A, Shazeer NM, Parmar N, Uszkoreit J, Jones L, Gomez AN, et al. Attention is all you need. In: 31st Conference on Neural Information Processing Systems (NeurIPS); 2017 Dec 4–9; Long Beach, CA, USA. [Google Scholar]
9. Gu A, Dao T. Mamba: linear-time sequence modeling with selective state spaces. In: Conference on Language Modeling (COLM 2024); 2024 Oct 7–9; Philadelphia, PA, USA. [Google Scholar]
10. Zhu L, Liao B, Zhang Q, Wang X, Liu W, Wang X. Vision mamba: efficient visual representation learning with bidirectional state space model. In: 41st International Conference on Machine Learning (ICML 2024); 2024 Jul 15–20; Vienna, Austria. p. 1–14. doi:10.5555/3692070.3694654. [Google Scholar] [CrossRef]
11. Dao T, Gu A. Transformers are SSMs: generalized models and efficient algorithms through structured state space duality. In: 41st International Conference on Machine Learning (ICML 2024); 2024 Jul 15–20; Vienna, Austria. p. 1–31. doi:10.5555/3692070.3692469. [Google Scholar] [CrossRef]
12. Alsaffar AM, Nouri-Baygi M, Zolbanin HM. Shielding networks: enhancing intrusion detection with hybrid feature selection and stack ensemble learning. J Big Data. 2024;11(1):133. doi:10.1186/s40537-024-00994-7. [Google Scholar] [CrossRef]
13. Laghrissi F, Douzi S, Douzi K, Hssina B. Intrusion detection systems using long short-term memory (LSTM). J Big Data. 2021;8(1):65. doi:10.1186/s40537-021-00448-4. [Google Scholar] [CrossRef]
14. Lo WW, Layeghy S, Sarhan M, Gallagher M, Portmann M. E-GraphSAGE: a graph neural network based intrusion detection system for IoT. In: NOMS 2022-2022 IEEE/IFIP Network Operations and Management Symposium; 2022 Apr 25–29; Budapest, Hungary. doi:10.1109/NOMS54207.2022.9789878. [Google Scholar] [CrossRef]
15. Yuan Q, Gou G, Zhu Y, Zhu Y, Xiong G, Wang Y. MCRe: a unified framework for handling malicious traffic with noise labels based on multidimensional constraint representation. IEEE Trans Inf Forensic Secur. 2023;19(6):133–47. doi:10.1109/TIFS.2023.3318962. [Google Scholar] [CrossRef]
16. Yuan B, Wang J, Wu P, Qing X. IoT malware classification based on lightweight convolutional neural networks. IEEE Internet Things J. 2022;9(5):3770–83. doi:10.1109/JIOT.2021.3100063. [Google Scholar] [CrossRef]
17. Alabduallah B, Maray M, Alruwais N, Alabdan R, Darem AA, Alallah FS, et al. Class imbalanced data handling with cyberattack classification using Hybrid Salp Swarm Algorithm with deep learning approach. Alex Eng J. 2024;106(12):654–63. doi:10.1016/j.aej.2024.08.061. [Google Scholar] [CrossRef]
18. Moustafa N. A new distributed architecture for evaluating AI-based security systems at the edge: network TON_IoT datasets. Sustain Cities Soc. 2021;72:102994. doi:10.1016/j.scs.2021.102994. [Google Scholar] [CrossRef]
19. Booij TM, Chiscop I, Meeuwissen E, Moustafa N, den Hartog FTH. ToN_IoT: the role of heterogeneity and the need for standardization of features and attack types in IoT network intrusion data sets. IEEE Internet Things J. 2022;9(1):485–96. doi:10.1109/JIOT.2021.3085194. [Google Scholar] [CrossRef]
20. Moustafa N, Keshky M, Debiez E, Janicke H. Federated TON_IoT windows datasets for evaluating AI-based security applications. In: 2020 IEEE 19th International Conference on Trust, Security and Privacy in Computing and Communications (TrustCom); 2021 Dec 29–Jan 1; Guangzhou, China. p. 848–55. doi:10.1109/TrustCom50675.2020.00114. [Google Scholar] [CrossRef]
21. Ashraf J, Keshk M, Moustafa N, Abdel-Basset M, Khurshid H, Bakhshi AD, et al. IoTBoT-IDS: a novel statistical learning-enabled botnet detection framework for protecting networks of smart cities. Sustain Cities Soc. 2021;72(10):103041. doi:10.1016/j.scs.2021.103041. [Google Scholar] [CrossRef]
22. Li J, Othman MS, Chen H, Yusuf LM. Optimizing IoT intrusion detection system: feature selection versus feature extraction in machine learning. J Big Data. 2024;11(1):36. doi:10.1186/s40537-024-00892-y. [Google Scholar] [CrossRef]
23. Sharma J, Giri C, Granmo OC, Goodwin M. Multi-layer intrusion detection system with ExtraTrees feature selection, extreme learning machine ensemble, and softmax aggregation. EURASIP J Inf Secur. 2019;2019(1):15. doi:10.1186/s13635-019-0098-y. [Google Scholar] [CrossRef]
24. Čeponis D, Goranin N. Investigation of dual-flow deep learning models LSTM-FCN and GRU-FCN efficiency against single-flow CNN models for the host-based intrusion and malware detection task on univariate times series data. Appl Sci. 2020;10(7):2373. doi:10.3390/app10072373. [Google Scholar] [CrossRef]
25. Fauvel K, Lin T, Masson V, Fromont É, Termier A. XCM: an explainable convolutional neural network for multivariate time series classification. Mathematics. 2021;9(23):3137. doi:10.3390/math9233137. [Google Scholar] [CrossRef]
Cite This Article
 Copyright © 2025 The Author(s). Published by Tech Science Press.
This work is licensed under a Creative Commons Attribution 4.0 International License , which permits unrestricted use, distribution, and reproduction in any medium, provided the original work is properly cited.
 Downloads
 Citation Tools