
 Submit a Paper
 Propose a Special lssue
 Open Access
ARTICLE
A Clustering Model Based on Density Peak Clustering and the Sparrow Search Algorithm for VANETs
1 School of Computer Science and Engineering, Hunan University of Science and Technology, Xiangtan, 411201, China
2 Changsha Institute of Technology, Changsha, 410200, China
* Corresponding Author: Chaoliang Wang. Email:
Computers, Materials & Continua 2025, 84(2), 3707-3729. https://doi.org/10.32604/cmc.2025.062795
Received 27 December 2024; Accepted 13 May 2025; Issue published 03 July 2025
 View Full Text
 Download PDF
Abstract
Cluster-based models have numerous application scenarios in vehicular ad-hoc networks (VANETs) and can greatly help improve the communication performance of VANETs. However, the frequent movement of vehicles can often lead to changes in the network topology, thereby reducing cluster stability in urban scenarios. To address this issue, we propose a clustering model based on the density peak clustering (DPC) method and sparrow search algorithm (SSA), named SDPC. First, the model constructs a fitness function based on the parameters obtained from the DPC method and deploys the SSA for iterative optimization to select cluster heads (CHs). Then, the vehicles that have not been selected as CHs are assigned to appropriate clusters by comprehensively considering the distance parameter and link-reliability parameter. Finally, cluster maintenance strategies are considered to tackle the changes in the clusters’ organizational structure. To verify the performance of the model, we conducted a simulation on a real-world scenario for multiple metrics related to clusters’ stability. The results show that compared with the APROVE and the GAPC, SDPC showed clear performance advantages, indicating that SDPC can effectively ensure VANETs’ cluster stability in urban scenarios.Keywords
In recent years, with the development of communication technology, research interest in intelligent transportation systems has gradually increased. As an important component of intelligent transportation systems, vehicular ad-hoc networks (VANETs) have become a topic of interest [1–3]. However, owing to the annual increment in the number of vehicles and the development of autonomous driving technology, the amount of information that needs to be transmitted in VANETs has increased rapidly, augmenting the network’s burden significantly [4,5]. To address this issue, many researchers have introduced clustering strategies. That is, vehicles in the network are divided into multiple clusters, each with a cluster head (CH) and the remaining nodes as cluster members (CMs). CMs only communicate with the CH, which is responsible for managing CMs and conducting intra-cluster and inter-cluster communication [6]. This strategy helps reduce the network burden and improve the success rate of information transmission in the network. Based on such advantages, clustering strategies have numerous application scenarios in VANETs [7], including target tracking [8], road-traffic management [9], routing [10], misbehavior detection [11], and authentication [12].
However, the network topology of VANETs changes frequently owing to the high mobility of vehicles in an urban scenario, thus affecting cluster stability and clustering strategies’ performance. Therefore, when designing clustering strategies, it is important to focus on cluster stability and related metrics. In the meantime, clustering strategies that combine clustering methods from machine learning and intelligent optimization methods have exhibited good performance [13–15], and some studies have applied such strategies to VANETs [16,17]. Therefore, we proposed a clustering method called SDPC, based on the density peak clustering (DPC) method and the sparrow search algorithm (SSA), and evaluated the performance of the method based on multiple metrics related to clusters’ stability. The principle of the DPC method is simple, and it does not require pre-specification of the number of clusters. Moreover, the SSA has strong optimization capabilities and fast convergence speed. The SDPC combines the advantages of these two methods. In the CH selection phase, the DPC method is used to obtain key parameters and construct a fitness function first, and then the SSA is used to search iteratively to find vehicles with optimal positions as CHs. In the cluster formation phase, a parameter is introduced related to link reliability based on considering the distance parameter, enabling non-CH vehicles to be assigned to appropriate clusters. Finally, cluster-maintenance strategies are considered to tackle situations where CHs or members leave their clusters and new vehicles join clusters.
The main contributions of this paper are as follows:
(1) We propose a clustering algorithm that integrates the DPC with the SSA. During the CH selection phase, a fitness function is constructed based on DPC parameters, and SSA is employed for iterative optimization to identify optimal cluster head nodes.
(2) A link reliability parameter REL is introduced in the cluster formation phase to address scenarios where non-cluster-head nodes receive multiple requests from cluster heads.
(3) To mitigate instability caused by changes in cluster heads or member nodes, a cluster maintenance strategy is incorporated.
(4) Comparative experiments and the ablation study are conducted to validate the proposed algorithm’s performance in ensuring clustering stability in VANETs.
The rest of this paper is organized as follows. Section 2 offers a literature review, mainly introducing some work related to this study. The theoretical basis of this study is clarified in Section 3. Section 4 provides a detailed description of the model proposed in this study. Section 5 introduces the simulation environment and performance evaluation metrics used to evaluate the model proposed in this study and analyzes the simulation results. Finally, Section 6 provides a summary of the entire study and introduces future research directions briefly.
For the numerous clustering models in the VANET environment, models based on fuzzy logic and those based on intelligent optimization methods are two important components.
2.1 Models Based on Fuzzy Logic
Researchers [18] introduced a fuzzy-logic-based CH selection method (CHSA), which selects CHs by evaluating multiple parameters related to user preferences, network conditions, and application requirements, thereby improving the performance of VANETs. In [19], the researchers proposed a fuzzy-based cluster-management system (FBCMS) for vehicle clustering in VANETs to enhance connectivity and safety among vehicles, and they compared two fuzzy system models: FBCMS1 and FBCMS2. Moreover, scholars [20] described a new k-hop fuzzy-logic-based distributed clustering strategy, considering the safety distance between vehicles as an important criterion for selecting CHs, which improves cluster stability in VANETs by reducing the overhead of re-clustering and extending the clusters’ lifetime. Others [21] introduced a multi-criteria decision-making strategy that uses fuzzy logic to evaluate candidate nodes and employs game theory to simulate spectrum price competition, effectively supporting various applications. The authors of another study [22] proposed a safety-oriented fuzzy-logic-based clustering strategy (SOFCluster), which generates relatively stable cluster structures by considering the mobility parameters of vehicles and emphasizes the importance of considering safe vehicle distances in the CH selection process. In [23], the authors suggested a fuzzy-logic-and-reinforcement-learning-based V2V routing method (FLHQRP) and proposed a new heuristic function to guide the forwarding process of CHs to improve the efficiency of data transmission in VANETs.
2.2 Models Based on Intelligent Optimization Methods
The authors of [24] proposed a probability-based whale optimization algorithm (p-WOA) for cluster formation in vehicle communication. This method considers multiple parameters, such as communication range, number of nodes, and speed, and in-corporates probability into the fitness function to reduce randomness. Scholars also [25] introduced a moth flame optimization (MFO)–based clustering method called AMONET, aimed at achieving reliable and efficient communication. The results of an experiment show that AMONET was more efficient in generating clusters compared with other known models and that it could cover the entire network and generate the minimum number of clusters. In [26], the authors introduced an ant colony optimization (ACO)–based VANET clustering method called CACONET, which enhances communication by optimizing clustering and demonstrated CACONET’s significant advantage in clustering efficiency compared with baseline technologies such as MOPSO and CLPSO. Researchers also [27] described a particle swarm optimization (PSO)–based multi-hop clustering method, which can select the best route, find stable CHs, and remove malicious nodes from the network. Others [28] and [29] focused on the Harris Hawk Optimization (HHO) method. In [28], the authors suggested an HHO method–based clustering-optimization technique, considering factors such as communication range, number of nodes, velocity, and direction to create and evaluate ideal CHs. The authors demonstrated the superiority of the proposed model in terms of the number of clusters and other aspects by comparing it with other models. The model proposed in [29] is a HHO method–based VANET clustering method (HHOCNET), which creates a clustering strategy capable of adapting to dynamic network environments by simulating the cooperative hunting strategy of Harris Hawk. The authors demonstrated the advantages of HHOCNET in optimizing multi-objective clustering problems by comparing it with existing methods.
This section mainly introduces the theoretical basis of the proposed strategy in this study. First, the process and advantages of the DPC method are illustrated. Then, the principle of the SSA is described.
3.1 Density Peak Clustering Method
The DPC method was proposed by Alex Rodriguez and Alessandro Laio in [30]. It is an unsupervised clustering method that can discover density peak points in data automatically and cluster the data based on these peak points. Its principle is relatively simple but effective. The method is based on two basic assumptions: the local density of the cluster center is greater than the local density of its surrounding neighbors, and the cluster center should be farther away from points with greater density. The method defines two important variables: the local density
3.1.1 Calculating Density and Distance
For the local density
Model one:
where
Model two:
where
If a node’s density is the maximum, then
3.1.2 Generating the Decision Graph and Selecting Cluster Centers
Based on the
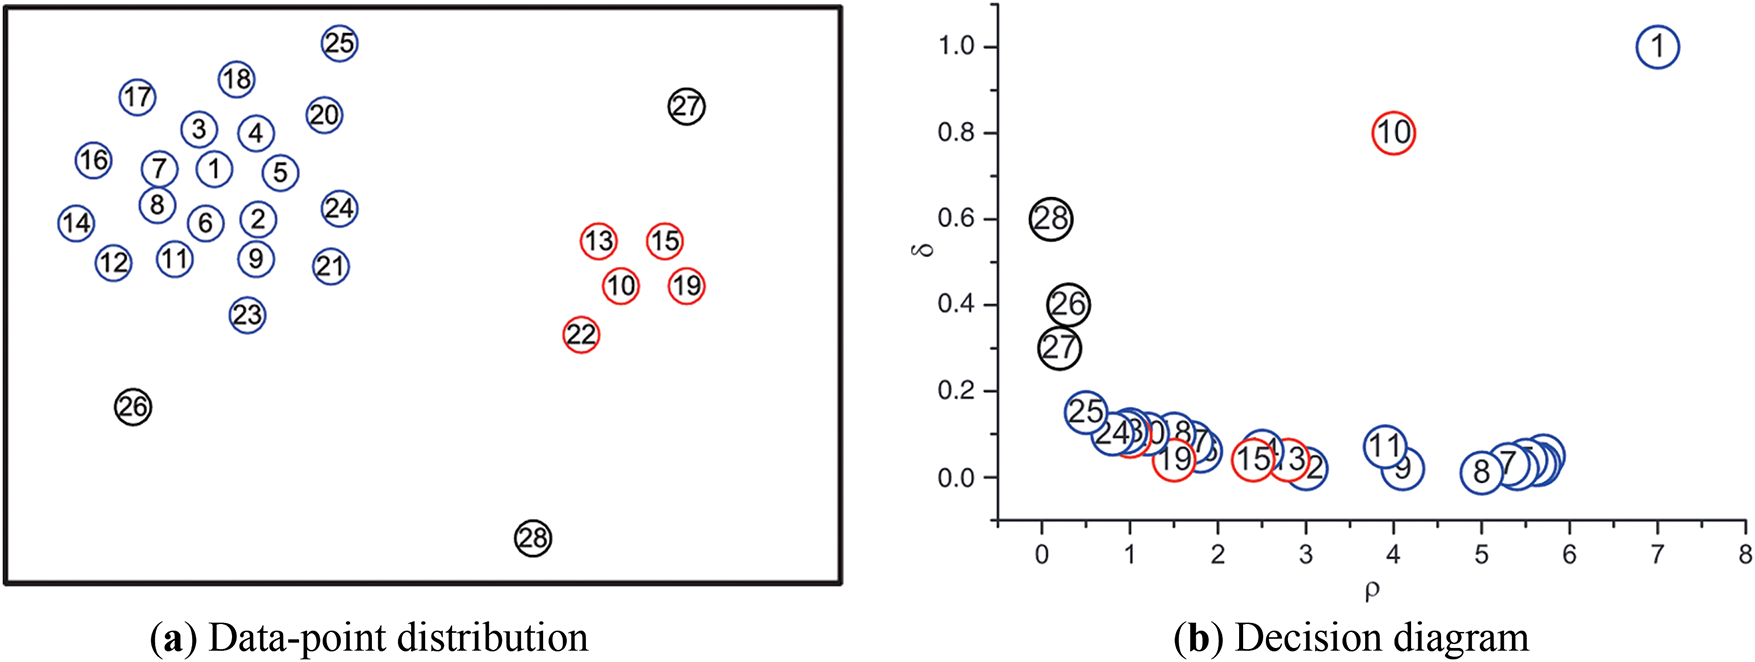
Figure 1: An example of selecting cluster centers
After the cluster centers are determined, the DPC method assigns the remaining nodes to the cluster of the nearest cluster center, and the final clustering results can be obtained after the assignment is completed.
The DPC method has many advantages, including its simple principle and ease of implementation. Moreover, it does not require a predetermined number of clusters, offering great flexibility, and it can discover clusters of any shape.
The sparrow search algorithm is a swarm intelligence optimization method proposed by Xue et al. in [31], inspired by the foraging and anti-predation behaviors of sparrows. The method refers to biological behaviors, dividing sparrows into two types: producers and scroungers. Producers are responsible for finding food and providing information on foraging areas for the population, while scroungers use the food found by producers. Meanwhile, a certain proportion of individuals in the population are selected for reconnaissance and forewarning. If danger is detected, the sparrows abandon the food, prioritizing safety.
Assuming the number of sparrows in the population is
where
where each row of
In the SSA, producers with better fitness values prioritize obtaining food during the search process. In addition, because producers are responsible for finding food for the entire sparrow population and providing the foraging direction for all scroungers, producers can obtain a larger search range for foraging than scroungers. In each iteration process, the position update equation for producers is as follows:
where
Scroungers are individuals besides producers. Scroungers use producers to obtain food so that scroungers have lower fitness values. Moreover, scroungers always follow the producer with the highest fitness value to obtain food, and they even compete with producers for food. The position update equation for scroungers is as follows:
where
When danger is perceived, the sparrow population exhibits anti-predation behavior. In the method, it is assumed that sparrows that perceive danger account for 10%–20% of the population. These sparrows’ initial positions are randomly generated within the population, and their position update equation is as follows:
where
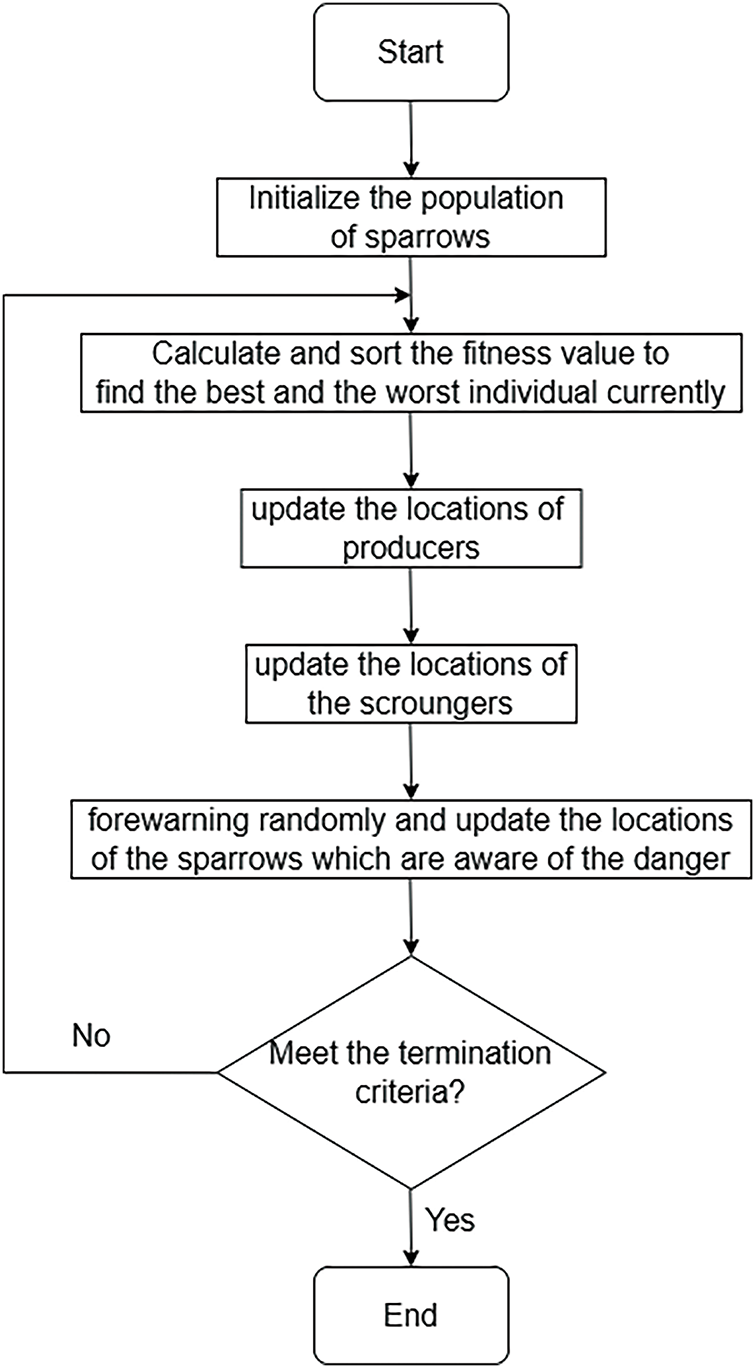
Figure 2: Flow chart of the SSA
In this part, a new clustering method that combines the DPC method and SSA is proposed for the urban–road scenario. This section describes the scenario model of the method briefly and then details the execution process of the method.
The scenario considered in this study is an urban traffic scenario, as depicted in Fig. 3. Vehicles on the road can communicate with other vehicles or road side units (RSUs) within their communication range through V2V or V2I models, transmitting their own information, including their ID, location, velocity, and direction of motion, which are used in the clustering process. Besides, the following assumptions are made for the scenario: vehicles on the road all use dedicated short-range communication (DSRC) to transmit information, with a communication range of R. All vehicles are equipped with a global positioning system (GPS) to obtain their own status information, including location and velocity, which is stored in their own dedicated cache. They send HELLO packets periodically to exchange this information with other vehicles or RSUs within their communication range. In addition, all vehicles have a neighbor table to store information about nearby vehicles. If a HELLO packet from a neighbor vehicle is not received within a certain period of time, the information about that vehicle will be deleted from the neighbor table.
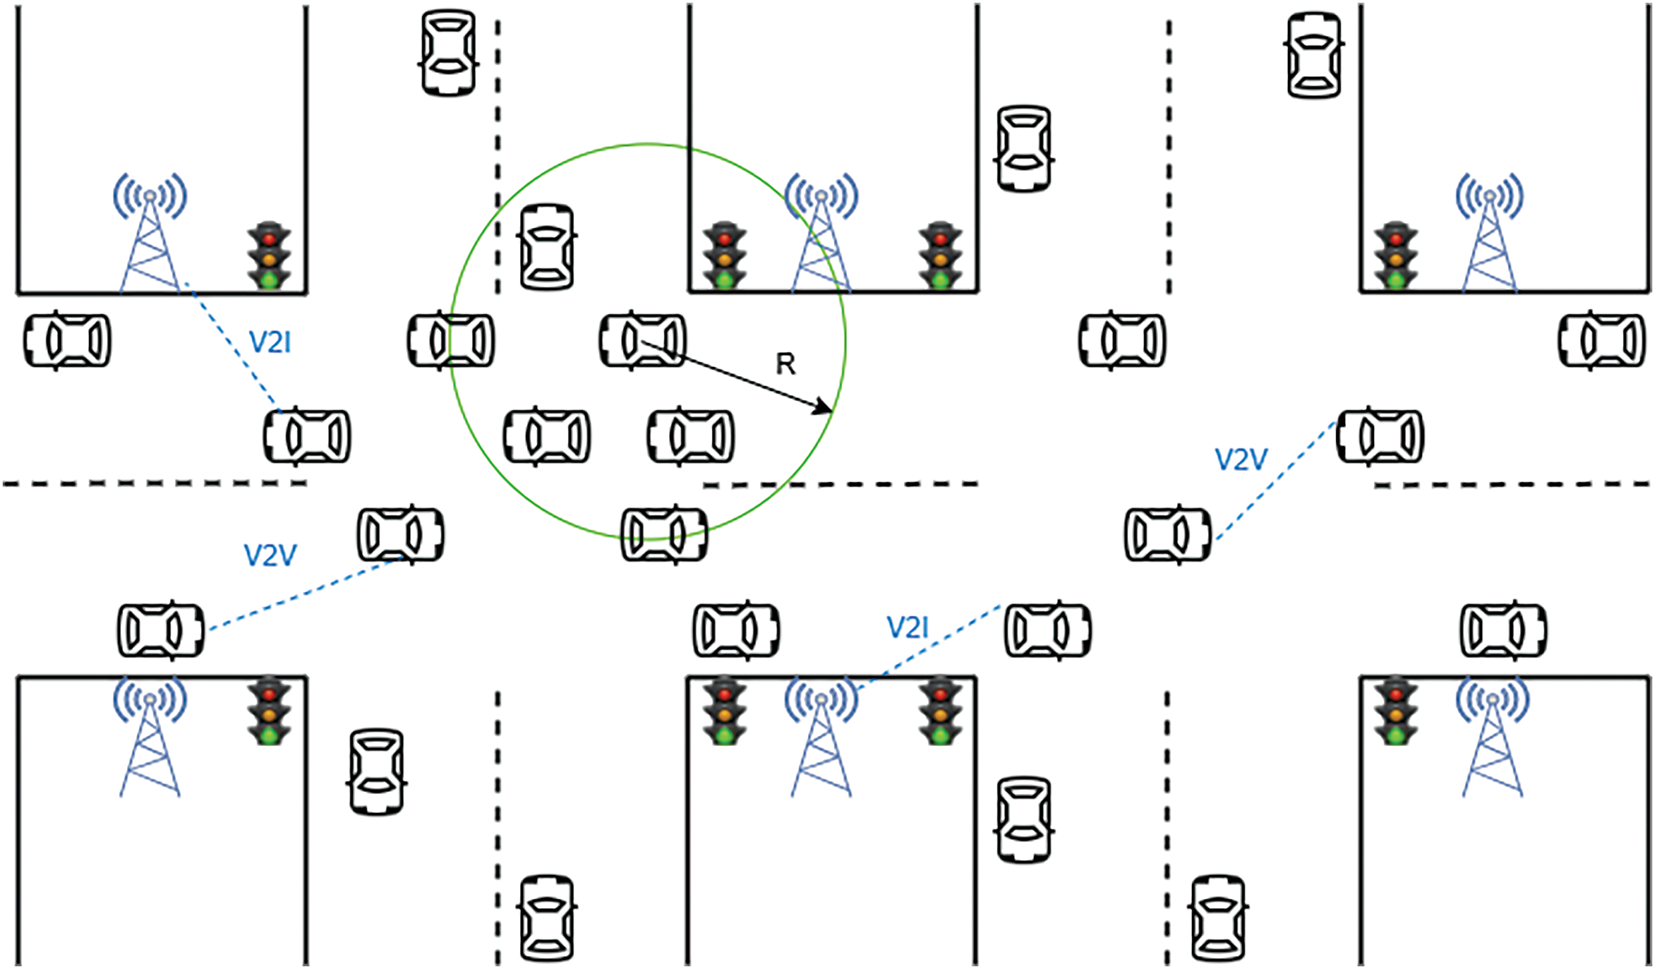
Figure 3: Traffic scenario model
In VANETs, the dynamic changes in the velocity and position of vehicles pose a significant challenge to the clustering process and cluster stability. To address this challenge, the proposed model considers the following three aspects.
First, the selection of CHs influences the attribution of CMs in the subsequent cluster formation process, and each CH is responsible for inter-cluster communication and intra-cluster management, which affects cluster stability directly. Thus, the selection of CHs is particularly important and is the first aspect considered in this study.
Second, during the cluster formation process, previously developed models often only focus on the distance parameter and rarely consider the link reliability between the CH and CMs. If the link between the CH and CMs does not have sufficient reliability, reliable information transmission between the CH and CMs cannot be guaranteed, affecting cluster stability. Therefore, based on the distance parameter, we further introduce the link reliability parameter.
Finally, in urban scenarios, the frequent changes in the moving direction of vehicles can disrupt clusters’ organizational structure. Hence, we also consider cluster updating and maintenance in such cases.
The model proposed in this study applies the DPC method to calculate the density parameter
It can be seen from Section 3 that before calculating the parameter
First, calculate the Gaussian distance between each pair of nodes, with the following equation:
where
Next, select the maximum and minimum Gaussian distances, represented by
Finally, take the average of the two as the value of the cut-off distance, with the equation as follows:
However, the model mentioned in [32] is not used for CH selection in VANETs and does not consider the relevant parameters of vehicles. In the urban traffic environment set in this study, to ensure cluster stability as much as possible, the model ensures that the vehicle selected as the CH is close to other vehicles in the cluster in terms of position, velocity, and direction of motion. The model in [33] introduces these parameters of vehicles and has achieved good results. Thus, we modify the model in [32] based on it, and the modified model is as follows.
Introduce a new parameter
where the parameter
where
where
Hence, similar to Eq. (10), the new equation for calculating the cut-off distance can be obtained as follows:
After obtaining the cut-off distance, we can calculate the parameter
Similarly, when calculating parameter
If a node has the maximum density, then
After attaining the calculation models for parameters
The smaller the fitness value of a node, the better its position, and the greater the possibility of being selected as a CH. In addition, we set a convergence condition for the SSA to ensure the performance of the method. During the search process, if the calculated fitness value satisfies Eq. (19), it indicates that the SSA has reached the convergence condition. This means the current vehicle has the optimal position, so it can be selected as a CH. Before the SSA reaches the maximum number of iterations, if the absolute value of the difference between the fitness value of a vehicle and the fitness value when the method converges is less than or equal to
where
After completing the CH selection, the next step is to assign the remaining vehicles to appropriate CHs to construct several clusters, and each CH manages its own cluster. Conventional models mostly only consider the distance parameter, and the distance between vehicles does not fully reflect the reliability of the link between vehicles. Link reliability is an important parameter for evaluating system performance and stability [34], so we also introduce the link reliability parameter
After the network is initialized, as described in Section 4.1, vehicles in the network send HELLO packets to vehicles and RSU within their transmission range periodically to exchange their information. The data format of the HELLO packet is displayed in Fig. 4.

Figure 4: Format of HELLO packet
The information is used in various stages of the clustering process. During the cluster formation stage, the information is used to calculate the link reliability parameter

Figure 5: Format of REQUEST packet
For the non-CH vehicles, if they receive only one REQUEST packet, they send a JOIN packet to the sender, which includes their own location and velocity information. The format of the JOIN packet is depicted in Fig. 6.

Figure 6: Format of JOIN packet
If a non-CH node
where
where
The flowcharts of the CH selection and cluster formation stages are shown in Fig. 7.
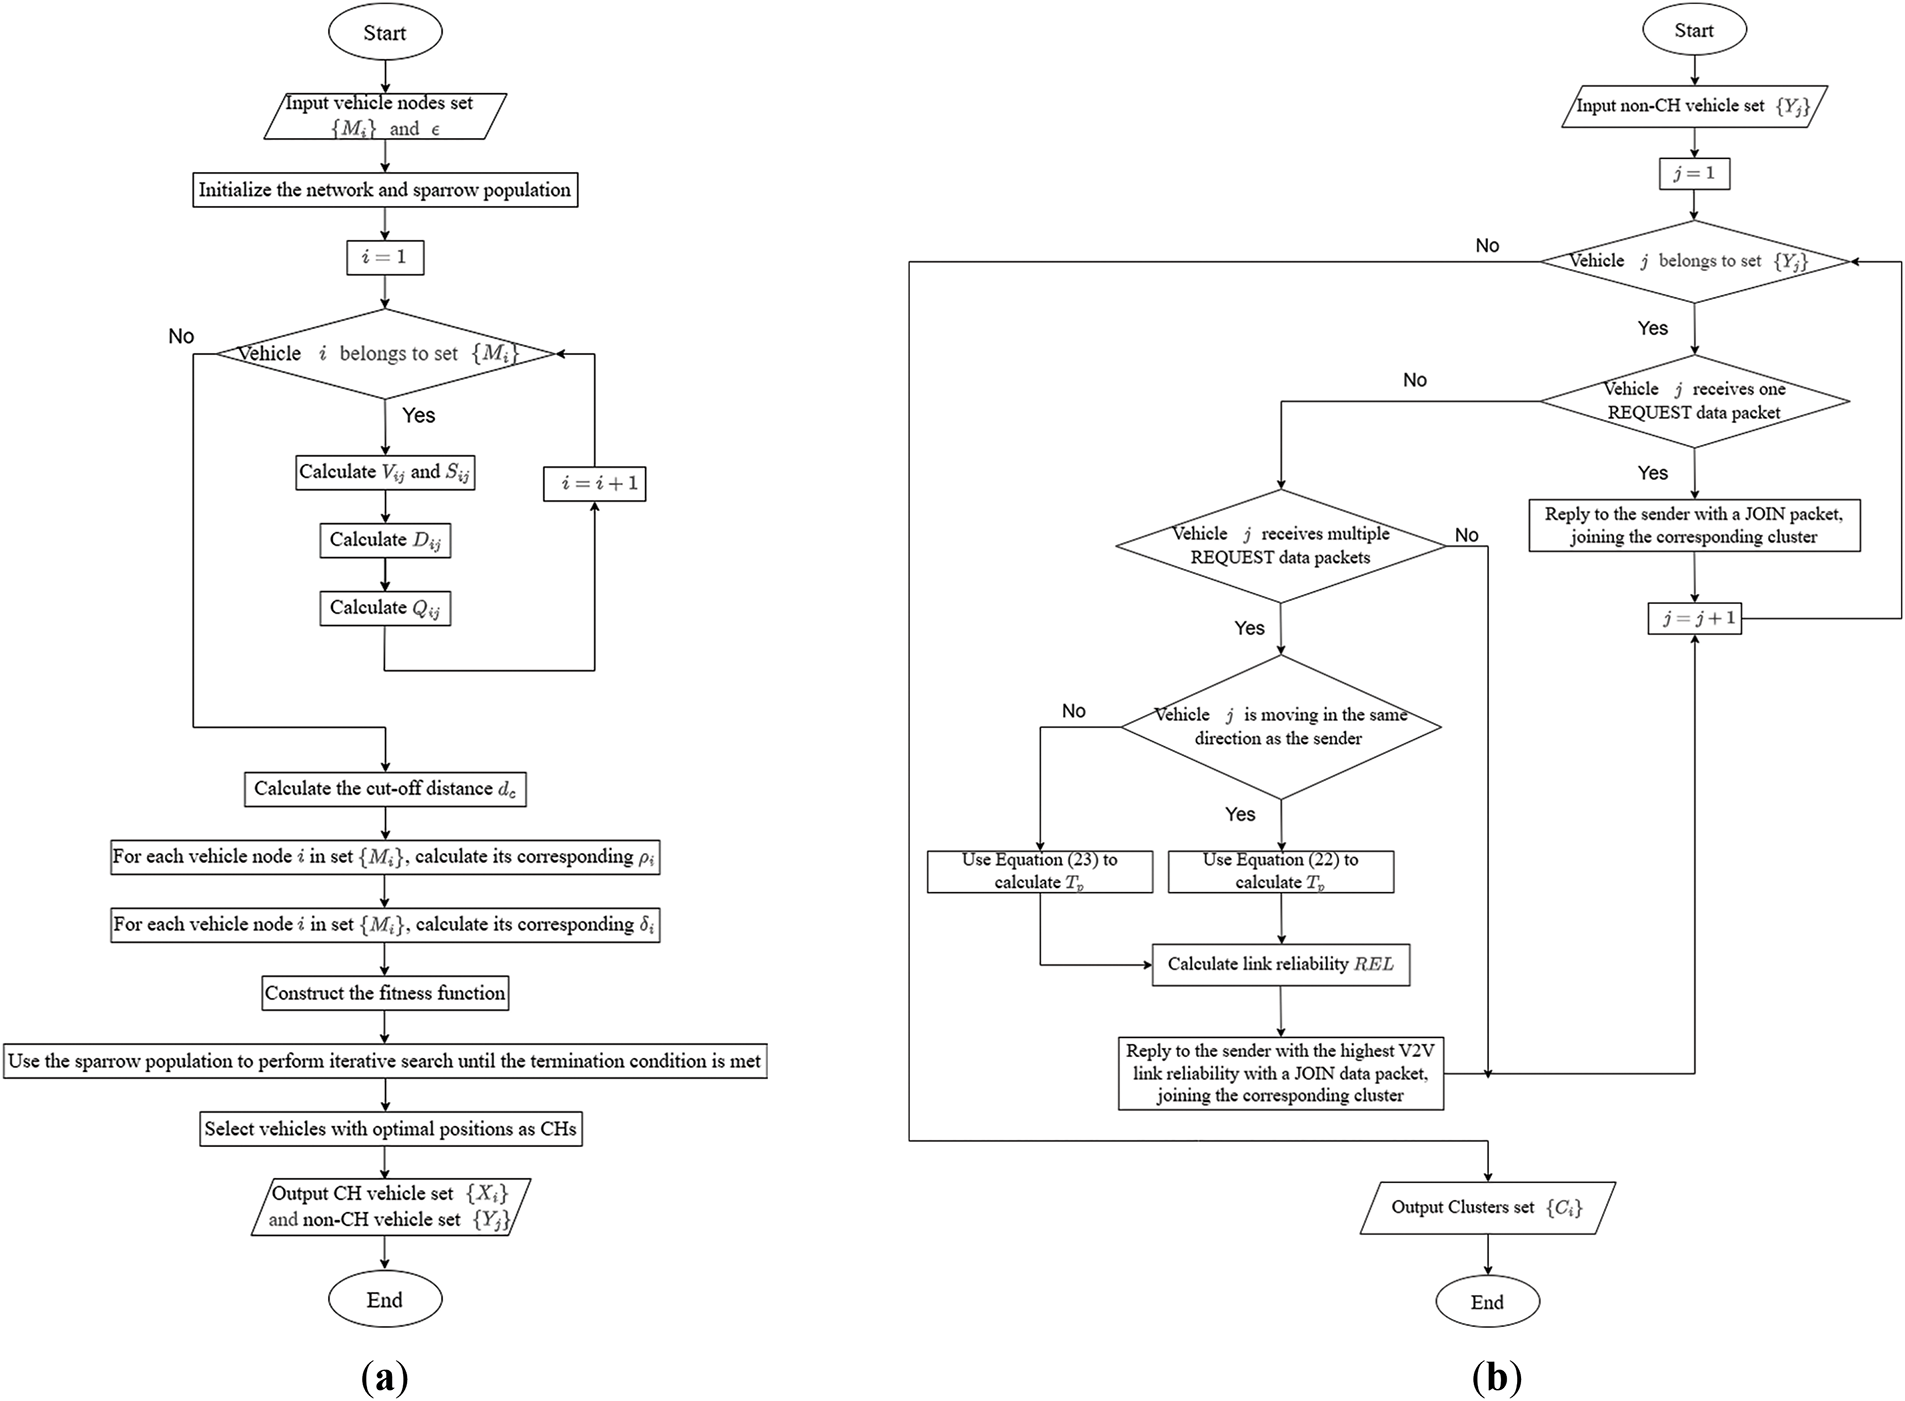
Figure 7: (a) Flowchart of the CH selection stage; (b) Flowchart of the cluster formation stage
In an urban traffic environment, frequent changes in the position and velocity of vehicles can lead to changes in the cluster structure, which affects cluster stability. To address this issue, we propose corresponding cluster-maintenance measures for possible situations in the urban traffic scenario.
CH Replacement. When the CH vehicle leaves its original cluster, the CH selection process needs to be executed among the remaining vehicles to select a new CH. The new CH vehicle takes on the responsibility of managing the members within the cluster and communicating between clusters. The remaining vehicles join the cluster of the new CH vehicle by default and send a JOIN packet to the CH vehicle.
CM Replacement. When a CM vehicle leaves its original cluster or a new vehicle wants to join a cluster, the CH vehicle sends a REQUEST packet to vehicles within its transmission range periodically. Vehicles that have not left their original cluster reply with a JOIN packet, and vehicles that have left do not reply. If a reply from a certain CM vehicle is not received within a certain period of time, the CH vehicle deletes the information of that CM vehicle from the neighbor table. New vehicles also receive a REQUEST packet, and the process for joining a cluster is the same as the cluster formation process mentioned above.
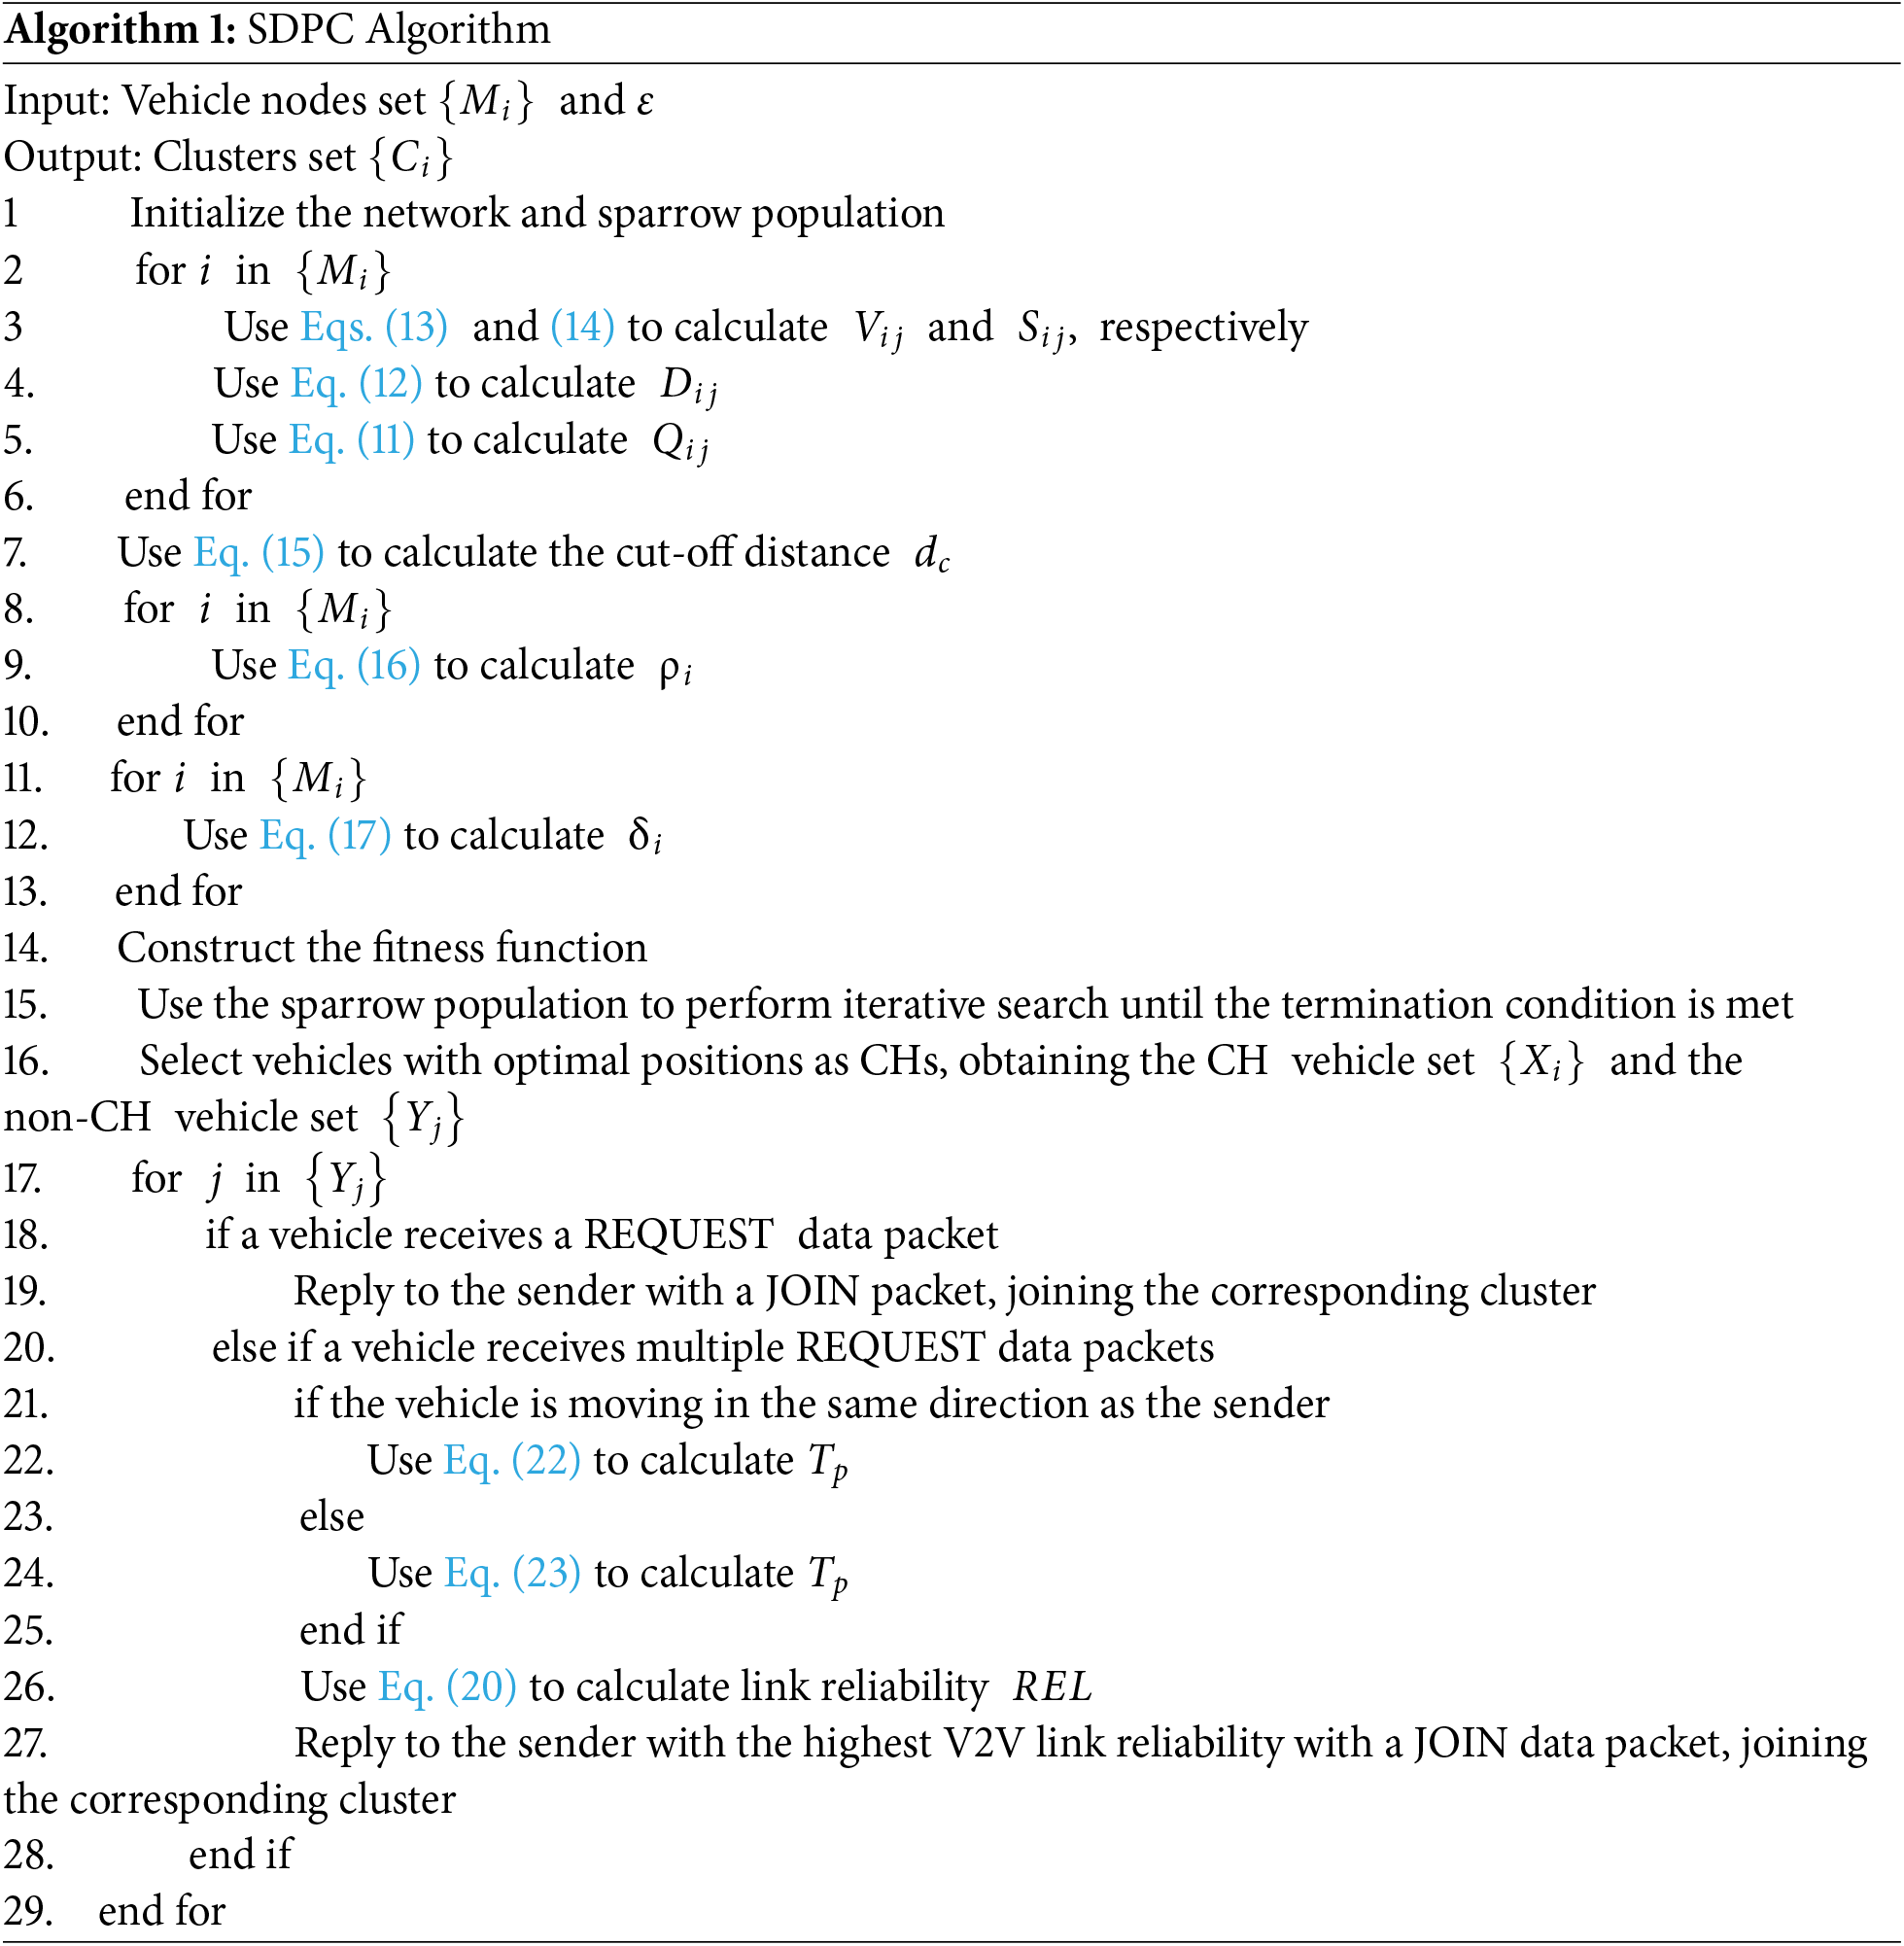
Based on the previous description, the specific steps of SDPC are given in Algorithm 1.
Intending to evaluate the performance of the model proposed in this study, we conducted simulation experiments.
First, we compared it with models from two other references. The two models compared are GAPC [35] and APROVE [36], both of which are clustering models based on affinity propagation. The difference lies in the former’s introduction of communication-related parameters and weight mechanisms to improve cluster stability. The reason for choosing these two models for comparison is that affinity propagation-based clustering models do not need to specify the number of clusters, and both models can be deployed in urban traffic environments, similar to the model proposed in this study.
Subsequently, to validate the adaptability of SDPC in various dynamic environments, we adjusted the maximum vehicle velocity based on the previous experiment and tested its performance.
Then, we compared SDPC with two classical clustering algorithms, K-means and DBSCAN. K-means is a partition-based clustering algorithm that groups data points into a predefined number of clusters. DBSCAN is a density-based clustering algorithm that identifies clusters based on data point density.
Finally, we conducted an ablation study. Since SDPC primarily integrates DPC and SSA, we first replaced SSA with PSO to construct a method combining DPC and PSO. Afterward, based on [37], we developed a method integrating DBSCAN and SSA. We then compared SDPC with these two constructed methods to validate its performance.
This section mainly introduces the simulation environment and some performance-evaluation metrics and analyzes the simulation results.
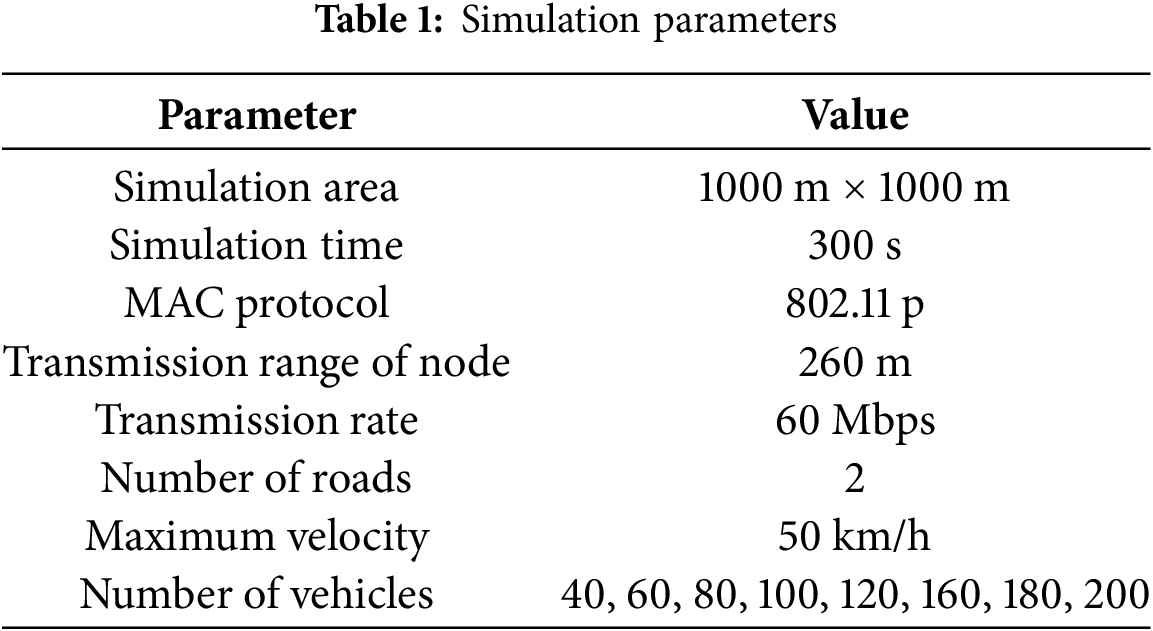
The simulation experiments in this study were conducted in an environment integrated with the network-simulation software OMNeT++, vehicle network-simulation framework Veins [38], and traffic simulator SUMO [39]. The simulation scenario was generated based on the real traffic network of Berlin, Germany, as depicted in Fig. 8, and the relevant parameters are given in Table 1.
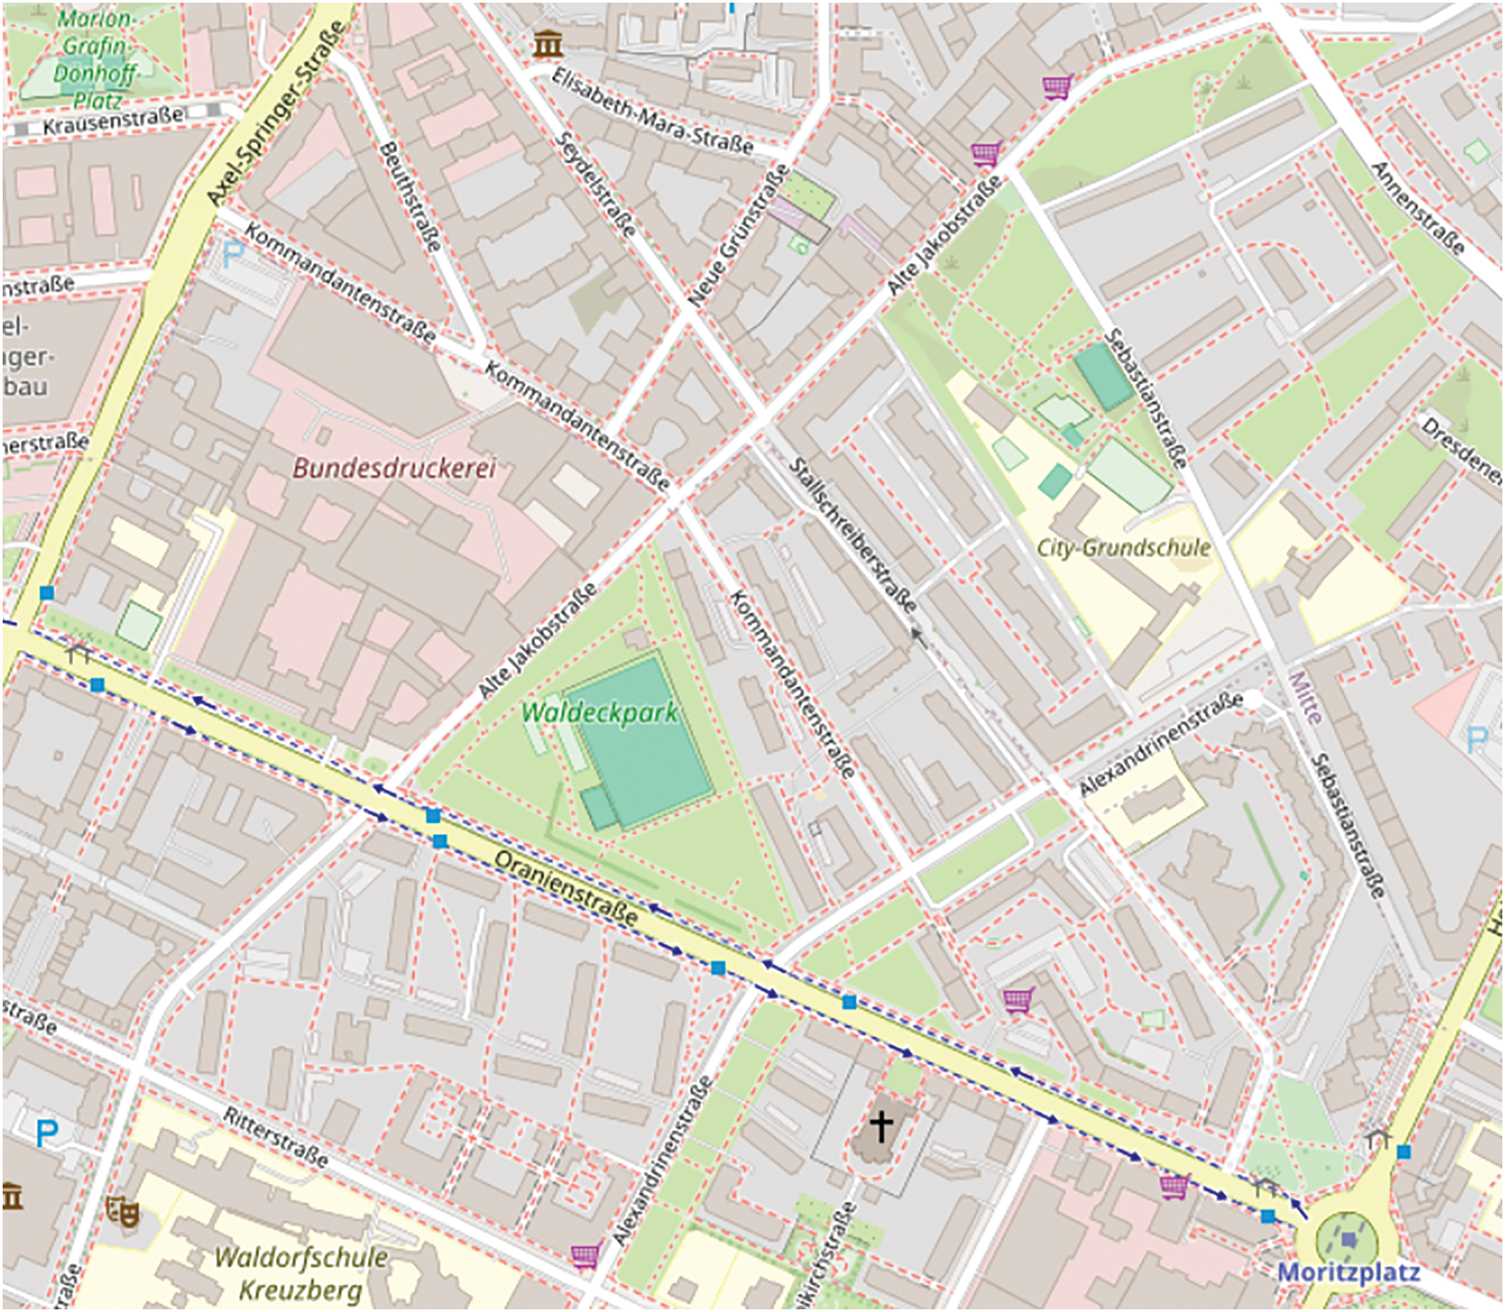
Figure 8: Simulation scenario
5.2 Performance Evaluation Metrics
To measure the effect of the clustering method and the obtained clusters’ stability as accurately as possible, we evaluated the performance of the method from the following six aspects.
Number of CHs. The number of CHs represents the number of CH vehicles selected after the clustering method is executed. Since only one vehicle in a cluster is the CH, the number of CHs is also equal to the number of clusters. If the number of clusters formed is relatively small and the fluctuation range of the number of clusters is small as the total number of vehicles in the network increases, it exhibits a better clustering effect.
Number of Isolated Vehicles. This metric represents the number of vehicle nodes that are not assigned to any cluster after the clustering process. A clustering method with a good effect should have a relatively small number of isolated nodes after execution.
Clustering Efficiency. Clustering efficiency is the proportion of vehicles that fully participate in the entire clustering process to the total number of vehicles in the network. It is calculated by dividing the number of vehicles involved in the clustering process by the total number of vehicles. Corresponding to the previous metric, a better clustering method should have higher clustering efficiency.
Average Duration of CHs. This metric represents the average value of the time that all CH vehicles in the network maintain a normal working state. It is derived by dividing the sum of the duration that all cluster head vehicles maintain their cluster head status in the network by the total number of cluster head vehicles. When a CH vehicle leaves its cluster, it leaves the normal working state, and the CH working-state time elapses. The longer the duration of a CH, the stronger the cluster stability.
Average Duration of CMs. This metric represents the average duration that vehicles in the network act as CMs. It is obtained by dividing the cumulative duration during which all cluster member vehicles retain their cluster membership status across the network by the total count of cluster member vehicles. Corresponding to the previous metric, CMs may also leave their clusters. A stable cluster should have a longer duration for its members.
Change Rate of CH. This metric is the number of times the state of CH vehicles changes in unit time during the clustering process. It is calculated as the total number of times cluster head vehicles alter their state divided by the simulation time duration. The fewer the changes in the CH vehicle, the stabler the cluster.
5.3 Simulation Result Analysis
First, we compared the performance of SDPC with APROVE and GAPC on the six performance evaluation metrics mentioned above. The trend of the number of CHs obtained by the three methods as the total number of vehicles in the network increases is illustrated in Fig. 9a. From the figure, it can be seen that as the total number of vehicles in the network increased, the number of CHs obtained by the three methods all increased. However, the fluctuation of the number of CHs obtained by APROVE was significantly greater than the other two methods. GAPC achieved fewer CHs when the total number of vehicles was small, but when the total number of vehicles exceeded 100, SDPC achieved a 5.1% higher number of CHs. This reveals that SDPC could maintain stability in the number of clusters while forming fewer clusters and also performed better than the other two methods.
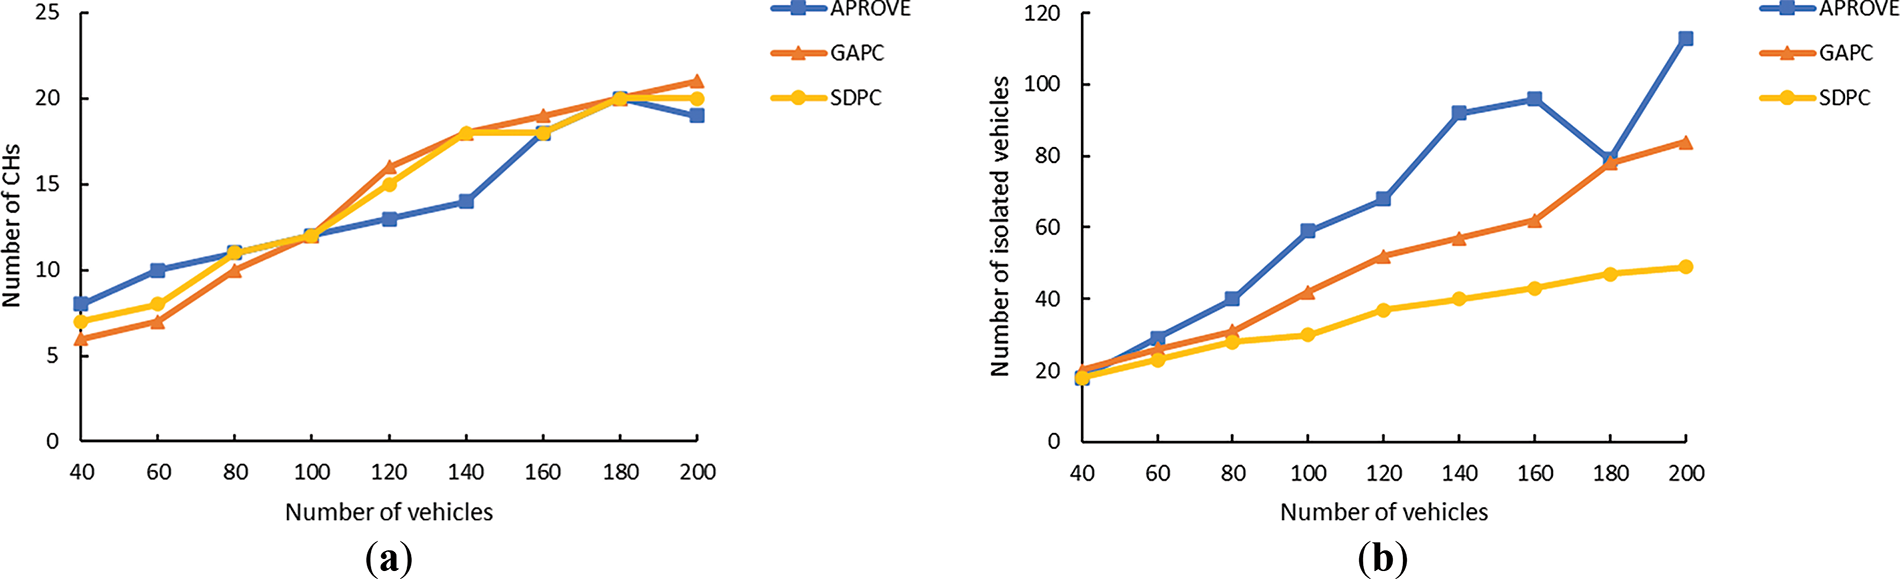
Figure 9: (a) Number of CHs vs. number of vehicles; (b) Number of isolated vehicles vs. number of vehicles
Fig. 9b depicts the trend of the number of isolated vehicles in the network as the total number of vehicles increased. The results show that when the total number of vehicles in the network was small, the number of isolated vehicles obtained by the three methods was similar. As the total number of vehicles in the network increased, the number of isolated vehicles obtained by APROVE and GAPC significantly increased, while the change in the number of isolated vehicles obtained by SDPC was smaller. This indicates that a large number of vehicles were not assigned to clusters during the execution of the former two methods, and that the execution effect of the two methods was unsatisfactory, but that the execution effect of SDPC was better than these two methods.
According to Fig. 10a, compared with APROVE and GAPC, SDPC had higher clustering efficiency. The clustering efficiency of SDPC was maintained between 60% and 70%, while the clustering efficiency of the other two methods was below 60%. This indicates that a majority of vehicle nodes participated in the entire clustering process during the execution of SDPC, and that it had a better performance in terms of method coverage.
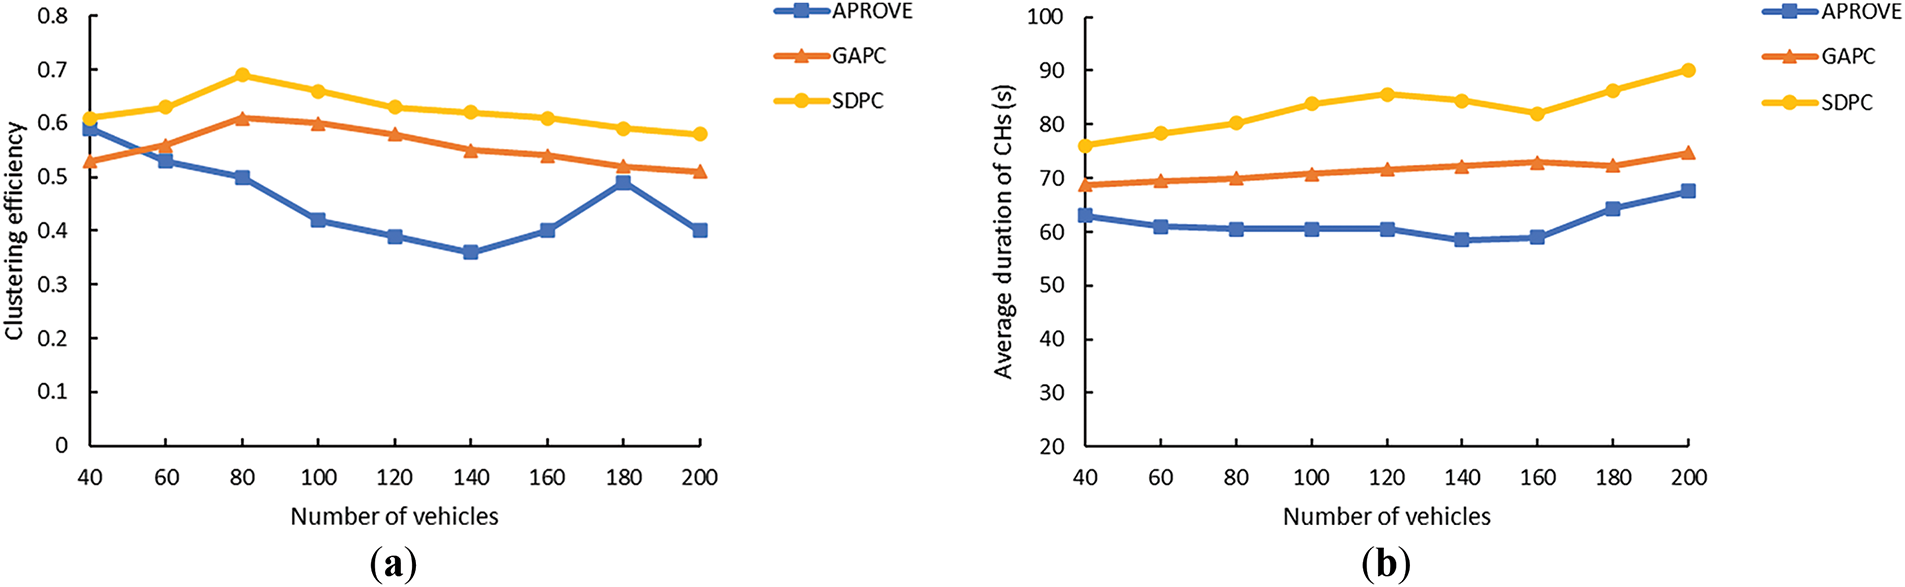
Figure 10: (a) Clustering efficiency vs. number of vehicles; (b) Average duration of CHs vs. number of vehicles
Fig. 10b describes the change in the average duration of CHs obtained by the three methods under different total numbers of vehicles. It can be seen from the figure that under different total numbers of vehicles, compared with the other two methods, the average duration of CHs in SDPC was longer, with an average duration of more than 75 s. The CH is the core of a cluster, and the duration of the CH has a great impact on the entire cluster’s stability. Therefore, the selection of CH vehicles in SDPC was more appropriate, which helped improve the formed clusters’ stability.
Fig. 11a depicts that the average duration of CMs obtained by SDPC was longer than that obtained by APROVE and GAPC. In urban environments, owing to changes in vehicles’ moving direction, CMs often leave their clusters. However, the model proposed in this study introduces link-reliability parameters during the cluster-formation process, and the links between CMs and CHs can maintain high reliability, indicating that CMs will not leave their clusters easily. Combined with the good performance of SDPC in the average duration of CHs mentioned above, it can be seen that SDPC could effectively improve cluster stability.
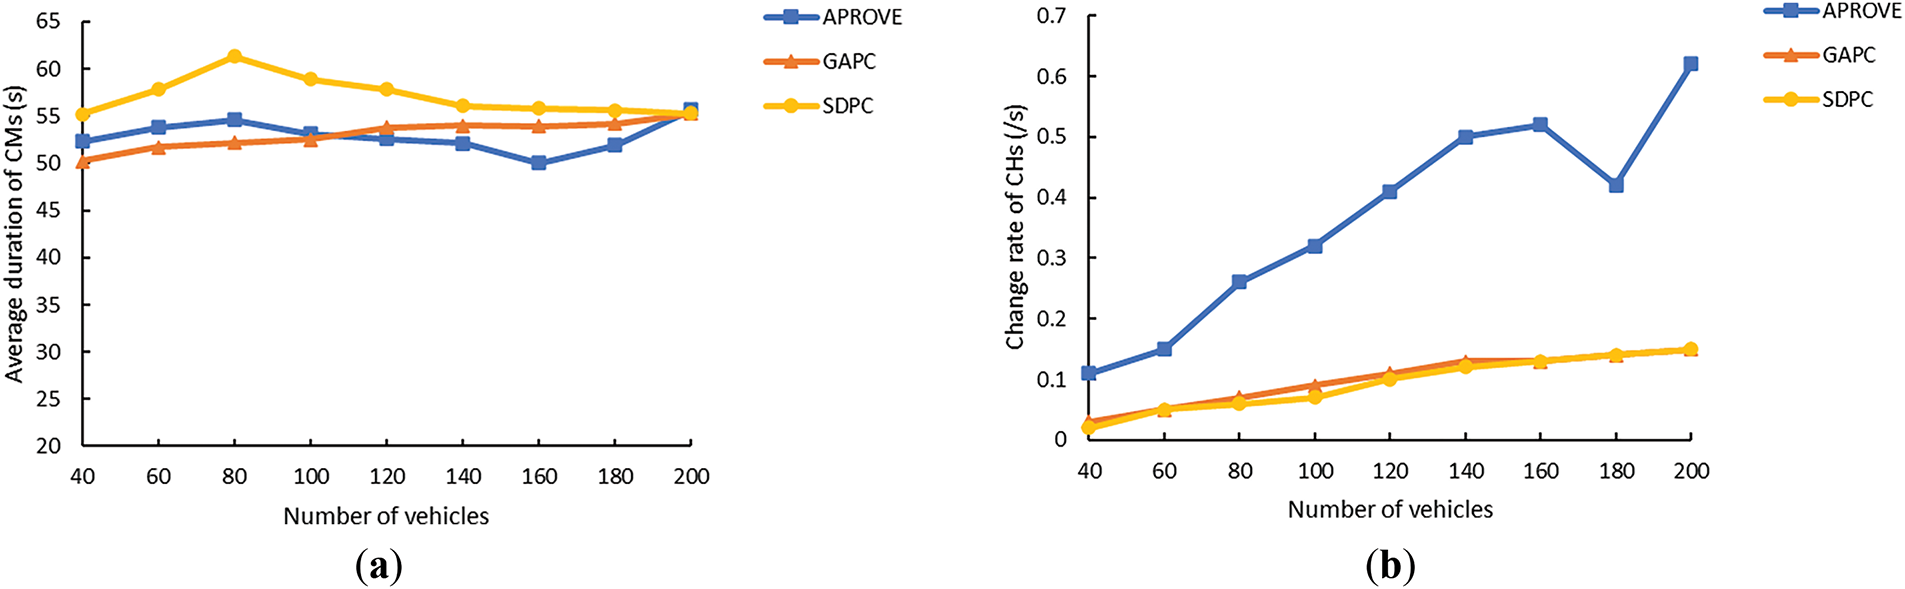
Figure 11: (a) Average duration of CMs vs. number of vehicles; (b) Change rate of CHs vs. number of vehicles
Fig. 11b depicts that APROVE had a significantly higher CH change rate, revealing that the cluster stability formed by this method was low. In addition, the CH change rates of GAPC and SDPC were lower, and the fluctuations caused by the increase in the total number of vehicles in the network were smaller. When the total number of vehicles in the network was around 100, SDPC demonstrated a 22.2% lower change rate of CHs compared to GAPC. This means that even when there were more vehicles in the network, the clusters formed by SDPC would maintain high stability.
Building on the aforementioned experiment, we adjusted the maximum vehicle velocity to 40 km/h and 60 km/h, respectively. Under these conditions, the performance of SDPC, APROVE, and GAPC was tested in terms of the average duration of CHs and CMs. The experimental results are illustrated in Figs. 12 and 13.
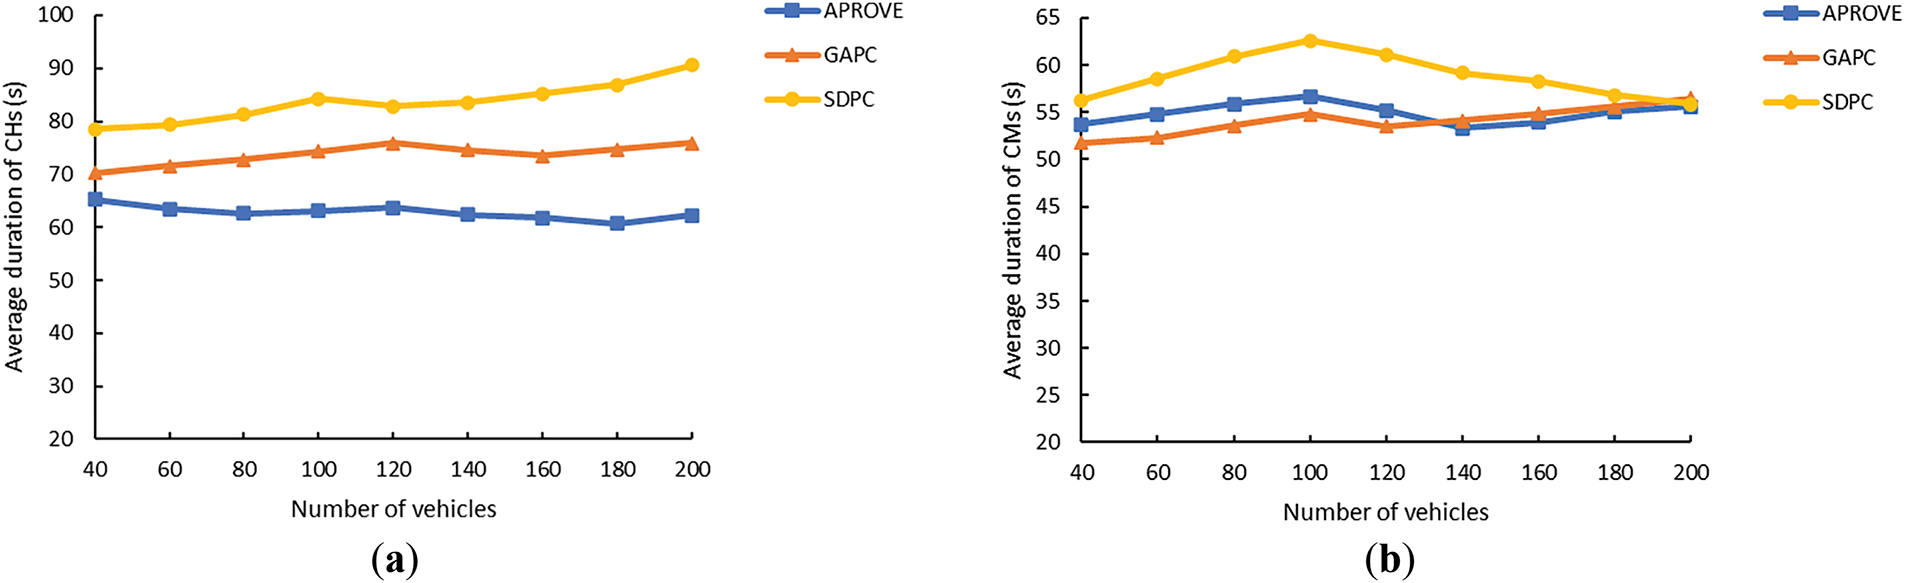
Figure 12: (a) Average duration of CHs vs. number of vehicles (40 km/h); (b) Average duration of CMs vs. number of vehicles (40 km/h)
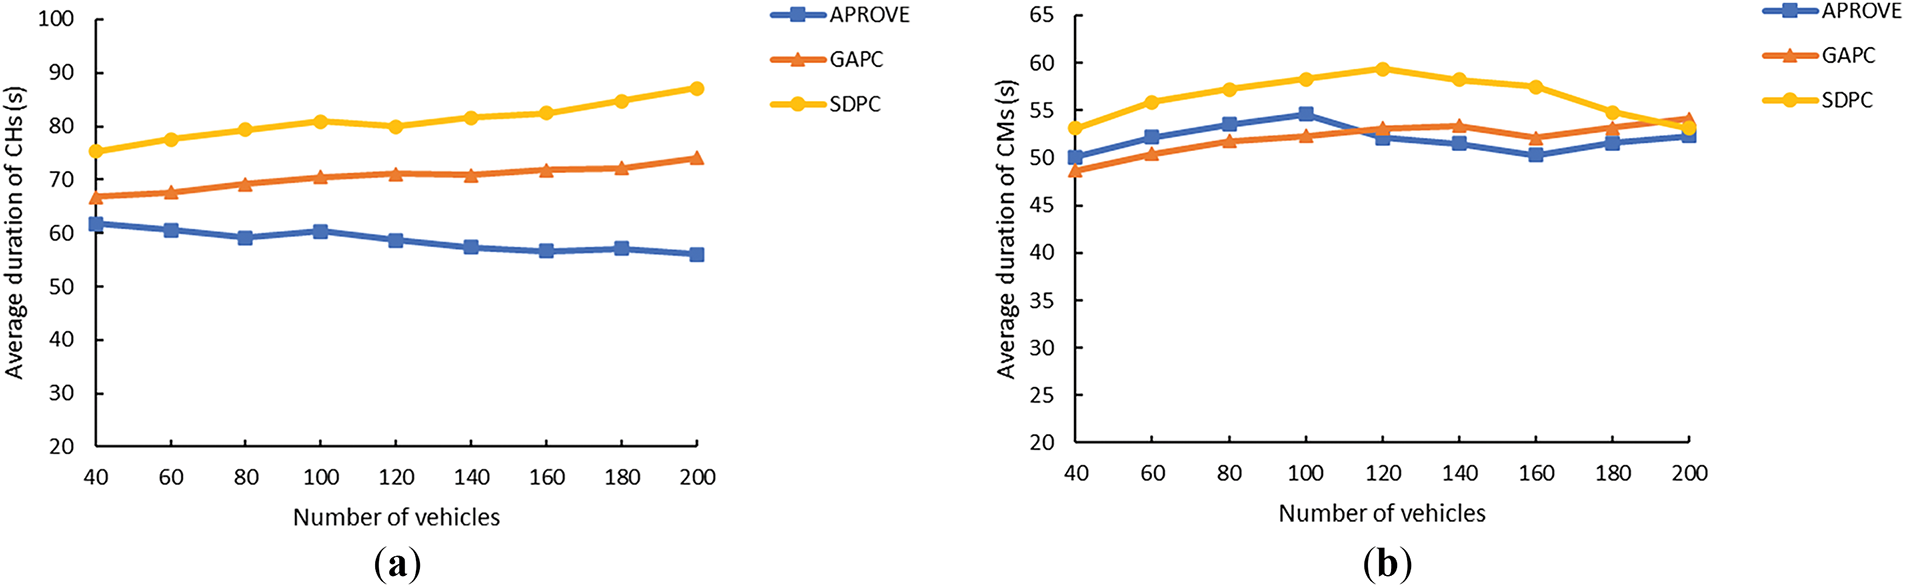
Figure 13: (a) Average duration of CHs vs. number of vehicles (60 km/h); (b) Average duration of CMs vs. number of vehicles (60 km/h)
Fig. 12 demonstrates the performance of the three methods when the maximum vehicle speed in the network is 40 km/h. Compared to experimental results with a maximum vehicle speed of 50 km/h, the performance of all three algorithms shows about 3% improvement at most due to the reduced vehicle mobility. As shown in Fig. 12a, as the number of vehicles increases, the average duration of CHs obtained by SDPC consistently remains longer than those achieved by APROVE and GAPC, demonstrating clear superiority in this metric. From Fig. 12b, when the number of vehicles is below 180, SDPC also outperforms APROVE and GAPC in the average duration of CMs. However, when the number of vehicles reaches 180 or more, the average durations of CMs across all three algorithms become comparable, though SDPC still maintains its advantage.
Fig. 13 presents the performance of the three methods when the maximum vehicle speed increases to 60 km/h. Compared to the 50 km/h scenario, all algorithms exhibit a performance degradation of up to approximately 4%. The trends of relevant metrics with increasing vehicle density remain broadly similar to those observed at 40 and 50 km/h. Both Fig. 13a,b confirms that SDPC significantly outperforms APROVE and GAPC in terms of both CH and CM average durations.
Subsequently, we compared SDPC with two classical clustering algorithms, K-means and DBSCAN, in terms of CH and CM durations. Experimental results are shown in Fig. 14. As vehicle density increases, the average durations of CHs and CMs obtained by K-means and DBSCAN continuously decline, while SDPC consistently demonstrates superior performance with significant advantages across both metrics.
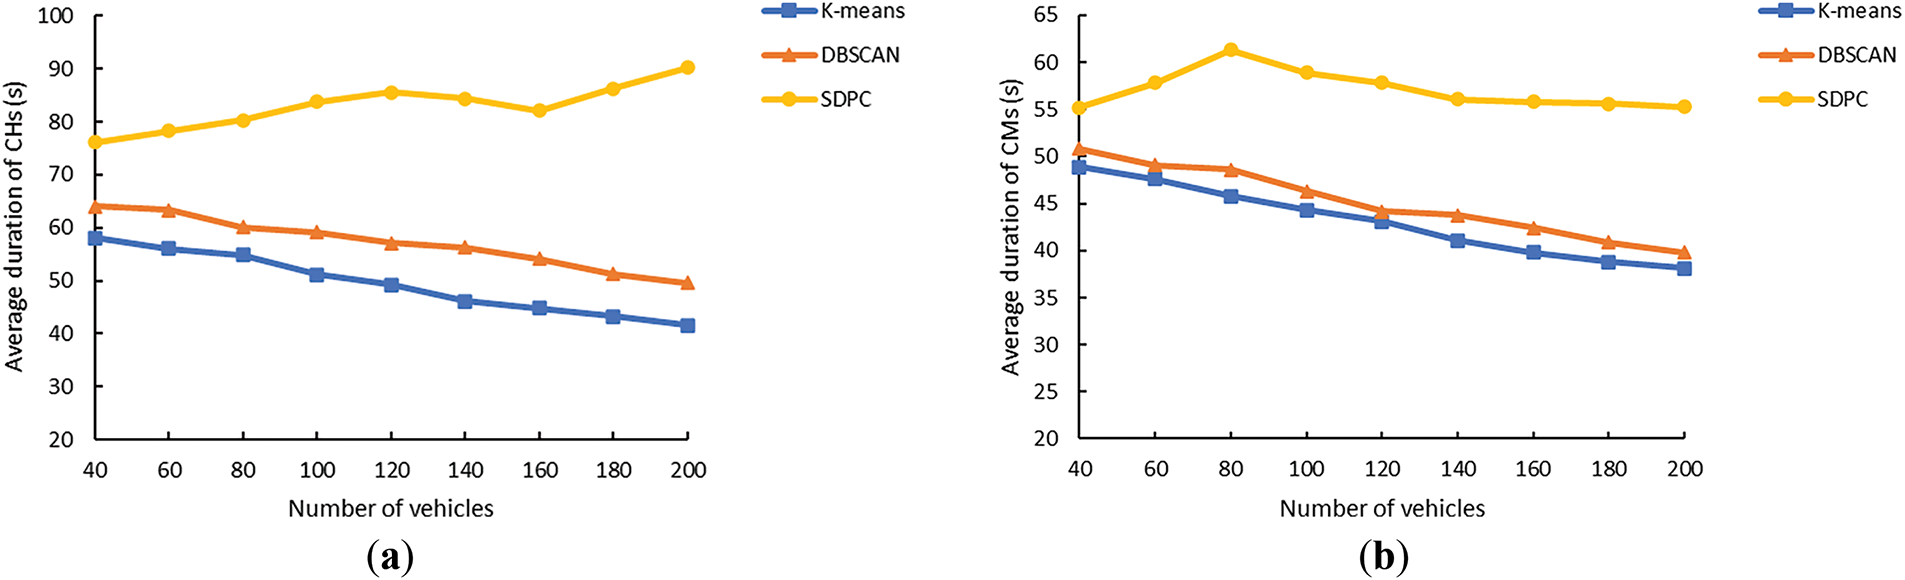
Figure 14: (a) Average duration of CHs vs. number of vehicles (50 km/h); (b) Average duration of CMs vs. number of vehicles (50 km/h)
Finally, the ablation study was conducted by designing two variants for comparison with SDPC: one combining DBSCAN with SSA, and another integrating DPC with PSO. Results in Fig. 15 reveal that while the SSA-optimized DBSCAN achieves improvements in CH/CM durations compared to standalone DBSCAN, it still lags significantly behind SDPC. Meanwhile, the PSO-optimized DPC produces results closer to SDPC, as DPC inherently requires fewer parameters than DBSCAN for clustering. However, SSA’s advantages in faster convergence and higher optimization precision ultimately ensure SDPC’s overall superiority.
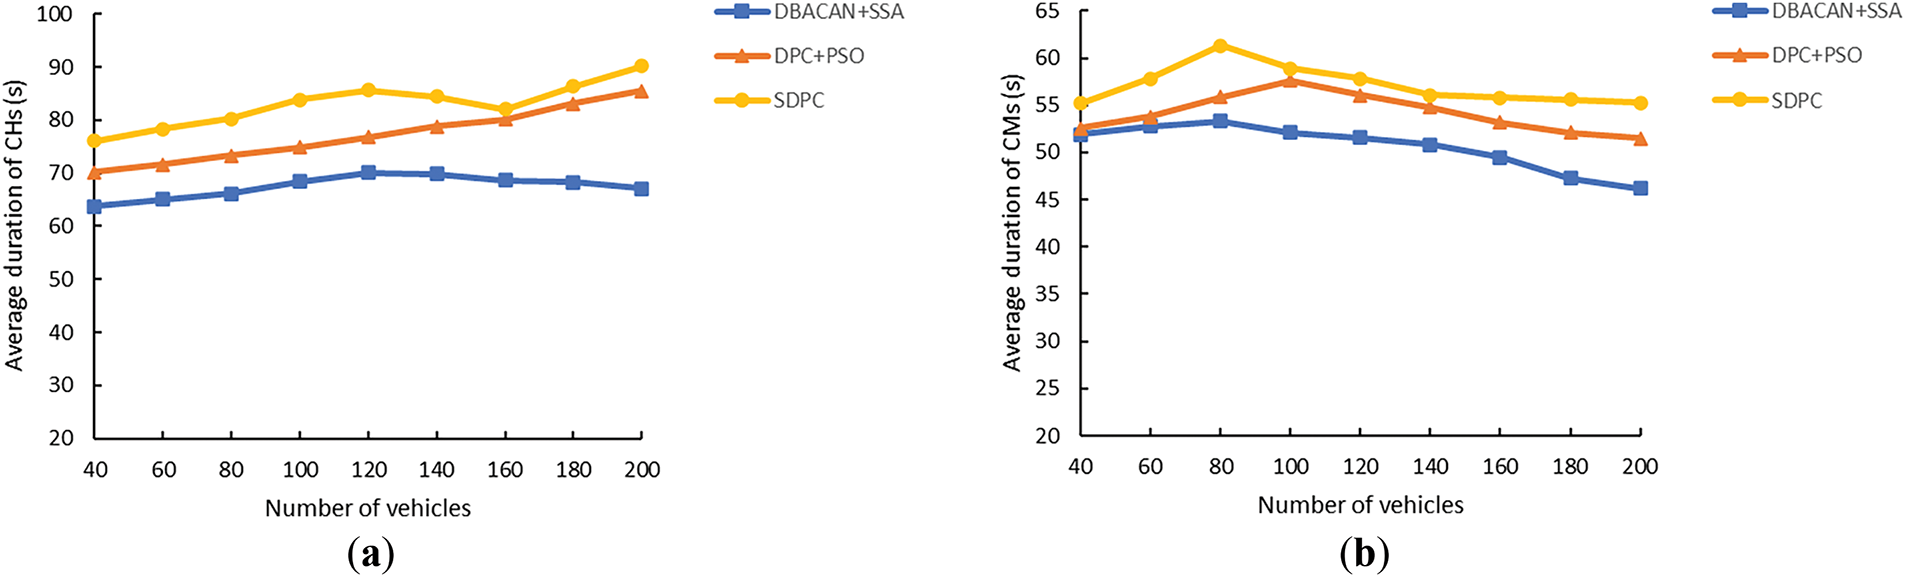
Figure 15: (a) Average duration of CHs vs. number of vehicles (50 km/h); (b) Average duration of CMs vs. number of vehicles (50 km/h)
In summary, SDPC could control the cluster scale while ensuring that most vehicles in the network participated in the entire clustering process so that there were not too many clusters in the network. Moreover, it could ensure that the formed clusters had high stability; that is, CHs and CMs had a long duration and did not leave their clusters easily. Compared with APROVE and GAPC, the overall performance of SDPC was better than APROVE; it was also superior to GAPC in most metrics. In contrast to classical algorithms like K-means and DBSCAN, SDPC exhibits substantial advantages. The ablation study further validates that SDPC achieves robust and commendable performance.
In VANETs, clustering strategies’ introduction has exhibited promising effects in reducing the communication load, improving packet-delivery rates, and enhancing routing efficiency. However, in urban scenarios, cluster stability is challenging owing to frequent changes in vehicles’ velocity, position, and direction of motion. To address this challenge, we proposed a clustering method named SDPC, which combines the DPC method with SSA, making the selection of CHs more accurate and reasonable. In the cluster-formation process, not only is the distance parameter considered, but the link-reliability parameter is also introduced. The cluster maintenance process is considered to tackle changes in network topology. Comparative experiments reveal that SDPC significantly outperforms APROVE and GAPC and exhibits notable advantages over classical algorithms like K-means and DBSCAN. The ablation study further confirms that SDPC demonstrates strong capabilities in forming stable clusters.
In future work, to address the limitations of current CH selection mechanisms, we propose three concrete research directions:
(1) Implementing reinforcement learning (RL) frameworks to enable dynamic CH election through reward mechanisms (e.g., using Q-learning to optimize energy-delay tradeoffs).
(2) Developing hybrid metaheuristics combining genetic algorithms with simulated annealing to handle multi-objective optimization in large-scale networks.
(3) Integrating federated learning approaches to preserve node privacy during CH coordination.
In addition, specific application scenarios for the method can be sought, such as routing and task offloading in VANETs.
Acknowledgement: The authors would like to thank editors and reviewers for their valuable work.
Funding Statement: The authors received no specific funding for this study.
Author Contributions: The authors confirm contribution to the paper as follows: Conceptualization, Chaoliang Wang and Zhaohui Li; methodology, Chaoliang Wang; investigation, Chaoliang Wang and Zhaohui Li; writing—original draft preparation, Chaoliang Wang; writing—review and editing, Qi Fu. All authors reviewed the results and approved the final version of the manuscript.
Availability of Data and Materials: Data available on request from the authors.
Ethics Approval: Not applicable.
Conflicts of Interest: The authors declare no conflicts of interest to report regarding the present study.
References
1. Fatemidokht H, Rafsanjani MK, Gupta BB, Hsu CH. Efficient and secure routing protocol based on artificial intelligence algorithms With UAV-assisted for vehicular ad hoc networks in intelligent transportation systems. IEEE Trans Intell Transport Syst. 2021 Jul;22(7):4757–69. doi:10.1109/TITS.2020.3041746. [Google Scholar] [CrossRef]
2. Ramya Devi M, Jasmine Selvakumari Jeya I, Lokesh S. Adaptive scheduled partitioning technique for reliable emergency message broadcasting in VANET for intelligent transportation systems. Automatika. 2023 Apr 3;64(2):341–54. doi:10.1080/00051144.2022.2140392. [Google Scholar] [CrossRef]
3. Ghaemi Y, El-Ocla H, Yadav NR, Madana MR, Raju DK, Dhanabal V, et al. Intelligent transport system using time delay-based multipath routing protocol for vehicular ad hoc networks. Sensors. 2021 Nov 19;21(22):7706. doi:10.3390/s21227706. [Google Scholar] [PubMed] [CrossRef]
4. Ren M, Zhang J, Khoukhi L, Labiod H, Vèque V. A review of clustering algorithms in VANETs. Ann Telecommun. 2021 Oct;76(9–10):581–603. doi:10.1007/s12243-020-00831-x. [Google Scholar] [CrossRef]
5. Zhang C, Zhang W, Wu Q, Fan P, Fan Q, Wang J, et al. Distributed deep reinforcement learning based gradient quantization for federated learning enabled vehicle edge computing. IEEE Internet Things J. 2024;12(5):4899–913. doi:10.1109/jiot.2024.3447036. [Google Scholar] [CrossRef]
6. Mukhtaruzzaman M, Atiquzzaman M. Clustering in vehicular ad hoc network: algorithms and challenges. Comput Electr Eng. 2020 Dec;88(11):106851. doi:10.1016/j.compeleceng.2020.106851. [Google Scholar] [CrossRef]
7. Katiyar A, Singh D, Yadav RS. State-of-the-art approach to clustering protocols in VANET: a survey. Wireless Netw. 2020 Oct;26(7):5307–36. doi:10.1007/s11276-020-02392-2. [Google Scholar] [CrossRef]
8. Khakpour S, Pazzi RW, El-Khatib K. Using clustering for target tracking in vehicular ad hoc networks. Veh Commun. 2017 Jul;9(12):83–96. doi:10.1016/j.vehcom.2017.02.002. [Google Scholar] [CrossRef]
9. Ahmad I, Noor RM, Zaba MR, Qureshi MA, Imran M, Shoaib M. A cooperative heterogeneous vehicular clustering mechanism for road traffic management. Int J Parallel Prog. 2020 Oct;48(5):870–89. doi:10.1007/s10766-019-00629-y. [Google Scholar] [CrossRef]
10. Rivoirard L, Wahl M, Sondi P, Berbineau M, Gruyer D. Chain-Branch-Leaf: a clustering scheme for vehicular networks using only V2V communications. Ad Hoc Netw. 2018 Jan;68(3):70–84. doi:10.1016/j.adhoc.2017.10.007. [Google Scholar] [CrossRef]
11. Wahab OA, Mourad A, Otrok H, Bentahar J. CEAP: SVM-based intelligent detection model for clustered vehicular ad hoc networks. Expert Syst Appl. 2016 May;50(4):40–54. doi:10.1016/j.eswa.2015.12.006. [Google Scholar] [CrossRef]
12. Sugumar R, Rengarajan A, Jayakumar C. Trust based authentication technique for cluster based vehicular ad hoc networks (VANET). Wireless Netw. 2018 Feb;24(2):373–82. doi:10.1007/s11276-016-1336-6. [Google Scholar] [CrossRef]
13. Paul S, De S, Dey S. A novel approach of data clustering using an improved particle swarm optimization based k-means clustering algorithm. In: 2020 IEEE International Conference on Electronics, Computing and Communication Technologies (CONECCT) [Internet]. Bangalore, India: IEEE; 2020. p. 1–6. [cited 2024 Nov 26] Available from: https://ieeexplore.ieee.org/document/9198685/. doi:10.1109/conecct50063.2020.9198685. [Google Scholar] [CrossRef]
14. Ibrahim C, Mougharbel I, Kanaan HY, Abou Daher N, Georges S, Saad M. Two stages K-means and PSO-based method for optimal allocation of multiple parallel DRPs application & deployment. IET Smart Grid. 2020 Apr;3(2):216–25. doi:10.1049/iet-stg.2019.0019. [Google Scholar] [CrossRef]
15. Sun L, Tao T, Zheng X, Bao S, Luo Y. Combining density peaks clustering and gravitational search method to enhance data clustering. Eng Appl Artif Intell. 2019 Oct;85(1):865–73. doi:10.1016/j.engappai.2019.08.012. [Google Scholar] [CrossRef]
16. Bin Ramlee SR, Hasan S, Subramaniam SK. Cluster optimization in VANET using MFO algorithm and K-means clustering. In: 2023 13th International Conference on Information Technology in Asia (CITA) [Internet]. Kota Samarahan, Malaysia: IEEE; 2023. p. 70–5. [cited 2024 Nov 26] Available from: https://ieeexplore.ieee.org/document/10262579/. doi:10.1109/cita58204.2023.10262579. [Google Scholar] [CrossRef]
17. Kandali K, Bennis L, Bannay OE, Bennis H. An intelligent machine learning based routing scheme for VANET. IEEE Access. 2022;10:74318–33. doi:10.1109/ACCESS.2022.3190964. [Google Scholar] [CrossRef]
18. Çalhan A. A fuzzy logic based clustering strategy for improving vehicular ad-hoc network performance. Sadhana. 2015 Apr;40(2):351–67. doi:10.1007/s12046-014-0315-9. [Google Scholar] [CrossRef]
19. Ozera K, Bylykbashi K, Liu Y, Barolli L. A fuzzy-based approach for cluster management in VANETs: performance evaluation for two fuzzy-based systems. Internet of Things. 2018 Oct;3-4(2):120–33. doi:10.1016/j.iot.2018.09.011. [Google Scholar] [CrossRef]
20. Aissa M, Bouhdid B, Mnaouer AB. Enhanced fuzzy logic-based cluster stability in vehicular ad hoc network. In: 2021 International Symposium on Networks, Computers and Communications (ISNCC) [Internet]. Dubai, United Arab Emirates: IEEE; 2021. p. 1–6. [cited 2024 Nov 26] Available from: https://ieeexplore.ieee.org/document/9615872/. doi:10.1109/isncc52172.2021.9615872. [Google Scholar] [CrossRef]
21. Alsarhan A, Kilani Y, Al-Dubai A, Zomaya AY, Hussain A. Novel fuzzy and game theory based clustering and decision making for VANETs. IEEE Trans Veh Technol. 2020 Feb;69(2):1568–81. doi:10.1109/TVT.2019.2956228. [Google Scholar] [CrossRef]
22. Aissa M, Bouhdid B, Ben Mnaouer A, Belghith A, AlAhmadi S. SOFCluster: safety-oriented, fuzzy logic-based clustering scheme for vehicular ad hoc networks. Trans Emerging Tel Tech. 2022 Mar;33(3):e3951. doi:10.1002/ett.3951. [Google Scholar] [CrossRef]
23. Zhang W, Yang X, Song Q, Zhao L. V2V Routing in VANET based on fuzzy logic and reinforcement learning. Int J Comput Commun Control. 2021 Jan 17;16(1). [cited 2024 Nov 26] Available from: http://univagora.ro/jour/index.php/ijccc/article/view/4123. doi:10.15837/ijccc.2021.1.4123. [Google Scholar] [CrossRef]
24. Husnain G, Anwar S, Sikander G, Ali A, Lim S. A bio-inspired cluster optimization schema for efficient routing in vehicular ad hoc networks (VANETs). Energies. 2023 Feb 1;16(3):1456. doi:10.3390/en16031456. [Google Scholar] [CrossRef]
25. Shah YA, Aadil F, Khalil A, Assam M, Abunadi I, Alluhaidan AS, et al. An evolutionary algorithm-based vehicular clustering technique for VANETs. IEEE Access. 2022;10(4):14368–85. doi:10.1109/ACCESS.2022.3145905. [Google Scholar] [CrossRef]
26. Aadil F, Bajwa KB, Khan S, Chaudary NM, Akram A. CACONET: ant colony optimization (ACO) based clustering algorithm for VANET. Du WB, editor. PLoS ONE. 2016 May 5;11(5):e0154080. doi:10.1371/journal.pone.0154080. [Google Scholar] [PubMed] [CrossRef]
27. Temurnikar A, Verma P, Dhiman G. A PSO enable multi-hop clustering algorithm for VANET. Int J Swarm Intell Res. 2021 Aug 25;13(2):1–14. doi:10.4018/IJSIR.20220401.oa7. [Google Scholar] [CrossRef]
28. Husnain G, Anwar S, Shahzad F, Sikander G, Tariq R, Bakhtyar M, et al. An intelligent harris hawks optimization based cluster optimization scheme for VANETs. J Sens. 2022 Oct 7;2022:1–15. doi:10.1155/2022/6790082. [Google Scholar] [CrossRef]
29. Ali A, Aadil F, Khan MF, Maqsood M, Lim S. Harris hawks optimization-based clustering algorithm for vehicular ad-hoc networks. IEEE Trans Intell Transport Syst. 2023 Jun;24(6):5822–41. doi:10.1109/TITS.2023.3257484. [Google Scholar] [CrossRef]
30. Rodriguez A, Laio A. Clustering by fast search and find of density peaks. Science. 2014 Jun 27;344(6191):1492–6. doi:10.1126/science.1242072. [Google Scholar] [PubMed] [CrossRef]
31. Xue J, Shen B. A novel swarm intelligence optimization approach: sparrow search algorithm. Syst Sci Cont Eng. 2020 Jan 1;8(1):22–34. doi:10.1080/21642583.2019.1708830. [Google Scholar] [CrossRef]
32. Cai J, Wei H, Yang H, Zhao X. A novel clustering algorithm based on DPC and PSO. IEEE Access. 2020;8:88200–14. doi:10.1109/ACCESS.2020.2992903. [Google Scholar] [CrossRef]
33. Bao X, Li H, Zhao G, Chang L, Zhou J, Li Y. Efficient clustering V2V routing based on PSO in VANETs. Measurement. 2020 Feb;152(4):107306. doi:10.1016/j.measurement.2019.107306. [Google Scholar] [CrossRef]
34. Moridi E, Barati H. RMRPTS: a reliable multi-level routing protocol with tabu search in VANET. Telecommun Syst. 2017 May;65(1):127–37. doi:10.1007/s11235-016-0219-6. [Google Scholar] [CrossRef]
35. Bi X, Guo B, Shi L, Lu Y, Feng L, Lyu Z. A new affinity propagation clustering algorithm for V2V-supported VANETs. IEEE Access. 2020;8:71405–21. doi:10.1109/ACCESS.2020.2987968. [Google Scholar] [CrossRef]
36. Hassanabadi B, Shea C, Zhang L, Valaee S. Clustering in vehicular ad hoc networks using affinity propagation. Ad Hoc Netw. 2014 Feb;13(4):535–48. doi:10.1016/j.adhoc.2013.10.005. [Google Scholar] [CrossRef]
37. Zhang X, Zhou S. WOA-DBSCAN: application of whale optimization algorithm in DBSCAN parameter adaption. IEEE Access. 2023;11(11):91861–78. doi:10.1109/access.2023.3307412. [Google Scholar] [CrossRef]
38. Sommer C, Eckhoff D, Brummer A, Buse DS, Hagenauer F, Joerer S, et al. Veins: the open source vehicular network simulation framework. In: Virdis A, Kirsche M, editors. Recent advances in network simulation [Internet]. Cham: Springer International Publishing; 2019. p. 215–52. [cited 2024 Nov 26] Available from: http://link.springer.com/10.1007/978-3-030-12842-5_6. doi:10.1007/978-3-030-12842-5_6. [Google Scholar] [CrossRef]
39. Krajzewicz D. Traffic simulation with SUMO–simulation of urban mobility. In: Barceló J, editor. Fundamentals of traffic simulation [Internet]. New York, NY: Springer New York; 2010. p. 269–93. [cited 2024 Nov 26] Available from: http://link.springer.com/10.1007/978-1-4419-6142-6_7. doi:10.1007/978-1-4419-6142-6_7. [Google Scholar] [CrossRef]
Cite This Article
 Copyright © 2025 The Author(s). Published by Tech Science Press.
This work is licensed under a Creative Commons Attribution 4.0 International License , which permits unrestricted use, distribution, and reproduction in any medium, provided the original work is properly cited.
 Downloads
 Citation Tools