
 Submit a Paper
 Propose a Special lssue
 Open Access
ARTICLE
Rethinking Chart Understanding Using Multimodal Large Language Models
Department of Economic Informatics and Cybernetics, Bucharest University of Economic Studies, no. 6 Piaţa Romană, Bucharest, 010374, Romania
* Corresponding Author: Simona-Vasilica Oprea. Email:
Computers, Materials & Continua 2025, 84(2), 2905-2933. https://doi.org/10.32604/cmc.2025.065421
Received 12 March 2025; Accepted 06 June 2025; Issue published 03 July 2025
 View Full Text
 Download PDF
Abstract
Extracting data from visually rich documents and charts using traditional methods that rely on OCR-based parsing poses multiple challenges, including layout complexity in unstructured formats, limitations in recognizing visual elements, and the correlation between different parts of the documents, as well as domain-specific semantics. Simply extracting text is not sufficient; advanced reasoning capabilities are proving to be essential to analyze content and answer questions accurately. This paper aims to evaluate the ability of the Large Language Models (LLMs) to correctly answer questions about various types of charts, comparing their performance when using images as input versus directly parsing PDF files. To retrieve the images from the PDF, ColPali, a model leveraging state-of-the-art visual language models, is used to identify the relevant page containing the appropriate chart for each question. Google’s Gemini multimodal models were used to answer a set of questions through two approaches: 1) processing images derived from PDF documents and 2) directly utilizing the content of the same PDFs. Our findings underscore the limitations of traditional OCR-based approaches in visual document understanding (VrDU) and demonstrate the advantages of multimodal methods in both data extraction and reasoning tasks. Through structured benchmarking of chart question answering (CQA) across input formats, our work contributes to the advancement of chart understanding (CU) and the broader field of multimodal document analysis. Using two diverse and information-rich sources: the World Health Statistics 2024 report by the World Health Organisation and the Global Banking Annual Review 2024 by McKinsey & Company, we examine the performance of multimodal LLMs across different input modalities, comparing their effectiveness in processing charts as images versus parsing directly from PDF content. These documents were selected due to their multimodal nature, combining dense textual analysis with varied visual representations, thus presenting realistic challenges for vision-language models. This comparison is aimed at assessing how advanced models perform with different input formats and to determine if an image-based approach enhances chart comprehension in terms of accurate data extraction and reasoning capabilities.Keywords
There is a clear need to quickly extract data and understand the content of the visuals from diverse documents: financial reports, health reports [1], traffic [2], and so on. However, there are multiple ways to do that, from rule-based and structured approaches, then Deep Learning (DL)-based OCR, to now multi-modal document understanding leveraging Vision-Language Models (VLMs) [3]. Traditional approaches in document understanding used to have two steps: document parsing (extracting the text by converting it into a structured format) and interpretation (using a language model that leverages the structured text to respond to the queries posed). OCR (Optical Character Recognition) is used to detect text and transcribe it, with different models used for each task [4]. The OCR process can take three paths: 1) the document goes through a language detection model, then a transcription model to extract the text from the bounding boxes found previously; 2) the document goes through a text instance segmentation model which colors the pixels containing text black, then a transcription model; 3) the document goes through a segmentation model which outputs the character a pixel corresponds to [5]. Among the limitations of the traditional methods, it can be mentioned: 1) unstructured documents, which lack a predefined, fixed schema, as there is a growing need to process all types of documents, many of them having different formats and complex layouts; 2) atypical documents which deviate from the norm either through their layout, format or type of content; they can be unstructured or structured documents with a novel template than what the system was trained on (e.g., processing fails for an invoice with an unforeseen design/structure); 3) dependency on context understanding and proper interpretation of the relationship between elements—most documents contain a combination of text and different visual elements (charts, diagrams, pictures, figures, etc.) that the model should integrate equally in the outcome; 4) domain specificity and semantic understanding. More focus should be on semantics rather than syntax, on specialized terminology, especially important when processing domain-specific documents, where a proper interpretation should take into account the implications of a sentence over the overall situation [6].
Therefore, document understanding shifted towards DL-based models once large pre-trained models such as Bidirectional Encoder Representations from Transformers (BERT) have gained popularity due to their capabilities after fine-tuning. BERT is a Google-developed model based on transformer architecture, and it can capture contextual information because it processes text from left to right and right to left [7]. However, these types of language models still struggle with long sequences. The interest in Chart Understanding (CU) increased significantly due to the focus on multimodal models and the rise of Visual Language Processing (VLP) [8,9]. VLP refers to methods (e.g., models) designed to make use of both visual understanding (visual data such as images and charts) and language understanding (textual information) for a comprehensive interpretation. It is considered a subdomain of VLP and has a multidisciplinary nature, and among the tasks, it is worth mentioning Chart Question Answering (CQA), Chart Captioning, and Chart-to-Text Summarization [10]. One of the DL techniques, the transformer architecture (transformers), has an essential role in moving further away from rule-based methods, with Convolutional Neural Networks (CNNs) and Graph Neural Networks (GNNs) having their limits [11,12]. Transformers were first introduced in 2017, and they rely on an attention mechanism that draws global dependencies between input and output without making use of the recurrent layers, which have been most commonly used in encoder-decoder architectures [13].
Visually Rich Document Understanding (VrDU) is aimed at properly leveraging all the elements of a document: a mix of text with tables, charts, graphics, and other visual elements. Text extraction is not enough; reasoning capabilities are necessary for a proper analysis of the content to answer the questions. VrDU has three important stages: 1) encode the document through methods that incorporate all the elements or use vision-only approaches, taking into account also multi-page situations; 2) integrate the embeddings with Large Language Models (LLMs); 3) train the VrDU models with a focus on modalities alignment [4]. Since one of the challenges of the models is using different modalities, the newest studies investigated processing VrDs as images, where the document pages are divided into image patches with smaller patches, thus more patches altogether, being more efficient at capturing fine details. Such a model is ColPali, a cutting-edge document retrieval model that harnesses VLMs to efficiently index and retrieve information by directly analyzing the visual features of documents, such as PDFs. There was a gap noticed in the evaluation of VrDU—it should be done taking into account not only the text but also the context and visual elements of the retrieved document. To bridge this shortcoming, ViDoRe (Visual Document Retrieval Benchmark) was introduced, a benchmark aimed at evaluating multimodal retrieval methods and, more clearly, the capabilities of such systems to match queries to page-level retrieval tasks [14].
In this paper, our goal is to evaluate the question-answering abilities of LLMs aimed at understanding different chart types by comparing their performance when using two input formats: first, when providing the full-page image renderings of the PDF pages containing the relevant charts as a knowledge base, and second, when processing the entire original PDF documents directly. To obtain the images, ColPali, a model that leverages the latest VLM, is used to pinpoint the correct chart for each question, and then the latest multimodal models from Google’s Gemini family are used to generate the answers to the questions asked as prompts. The primary focus is to assess the performance of advanced models when given different input types, but also to see if using an additional processing step of processing the documents as images improves the overall chart understanding, focusing on accurate data extraction and also stronger reasoning capabilities.
The contributions of this paper consist of:
1. Evaluation of LLMs for chart understanding. Our research systematically assesses the ability of LLMs to answer questions related to different types of charts by comparing their performance when processing images extracted from PDFs vs. directly parsing the PDF content.
2. Comparison of input modalities. It investigates whether processing documents as images enhances chart comprehension, not only in terms of accurate data extraction but also in improving reasoning capabilities, which is a challenge in VrDU.
3. Use of ColPali for chart retrieval. Our research utilizes ColPali, a state-of-the-art VLM-based document retrieval model, to efficiently extract relevant charts from PDFs, contributing to improved multimodal document understanding.
4. Application of multimodal models. By employing the latest Google Gemini multimodal models, our research explores the impact of advanced vision-language processing techniques in answering questions about charts.
5. Advancing VrDU. Our research highlights the limitations of traditional OCR-based methods and showcases the benefits of multimodal approaches in extracting meaning from unstructured and domain-specific documents.
6. Benchmarking CQA. Our research contributes to the broader field of CU by benchmarking the reasoning and interpretation capabilities of multimodal models in a structured comparison of different input formats.
This research advances the field of multimodal document understanding by demonstrating the effectiveness of vision-based approaches in improving the accuracy and reasoning depth of LLMs for chart-based question answering. The paper is structured into five sections. The Section 1 outlines the motivation for the study, emphasizing the challenges of extracting and interpreting charts from visually rich documents and introducing the research objectives. The Section 2 discusses previous work on document understanding, OCR-based methods, multimodal AI, and advances in chart comprehension, highlighting the role of VLMs and retrieval techniques like ColPali. The Section 3 details the experimental setup, including dataset selection, the comparison between image-based and text-based processing, the role of ColPali in chart retrieval, and the evaluation metrics used to assess model performance. The Section 4 presents the main findings, demonstrating that ColPali outperforms traditional OCR-based methods, Gemini 2.0 Flash Experimental achieves superior reasoning and accuracy, and image-based processing enhances CU. Finally, the Section 5 summarises the main insights, reinforcing the benefits of multimodal AI (Artificial intelligence) for document interpretation and suggesting future research directions in visually rich document analysis.
Unlike traditional information extraction techniques, such as OCR, keyword spotting, and rule-based parsers, which predominantly focus on textual content extraction and encounter difficulties in interpreting varied layouts, discerning logical structures, or inferring document behavior (e.g., correct reading order) in complex documents, VrDU adopts a multimodal methodology. This integrated approach allows not only for enhanced content extraction but also for a more accurate interpretation of complex document structures through comprehensive layout understanding, which becomes essential when the placement of key text fields varies based on document format and design. Moreover, this understanding aids in determining the correct reading behavior and more robust metadata extraction, irrespective of the field’s position, a task often challenging for conventional systems. To enhance accuracy, VrDU models must integrate multiple data types into a unified learning framework that can effectively process the cross-modal nature of documents as mentioned in [15,16]. VrDU focuses on two main tasks: Key Information Extraction (KIE) and Question Answering (QA). KIE extracts values based on predefined keys and can be performed through entity retrieval or sequence tagging. VrD-QA answers natural language questions by locating relevant information within the document. Both KIE and VrD-QA can use extractive or generative methods to retrieve or generate responses [17,18]. Visually rich business document understanding is essential for extracting structured data and automating workflows, yet current multimodal language models struggle with real-world document complexities. Existing benchmarks do not comprehensively evaluate the diverse structures found in industry applications, prompting the introduction of the VrDU benchmark [19]. Chart analysis methods are classified into rule-based approaches, chart captioning, and CQA. The effectiveness of these methods depends on accurate object detection, OCR-based text recognition, and robust feature extraction, which face challenges with font variability and layout complexity [20]. Chart captioning relies on DL models like encoder-decoder architectures and attention mechanisms, but struggles with capturing fine-grained details, while CQA combines image analysis and Natural Language Processing (NLP) using transformers and co-attention networks to answer user queries.
Recent advancements in VrDU have introduced two primary approaches: shallow fusion, which combines pre-trained NLP and computer vision models but struggles with generalization, and deep fusion, which leverages large-scale unlabeled data to enhance cross-modal learning and adaptability. LayoutLMv2 focuses on the second approach, being a multi-modal transformer model designed to improve VrDU by integrating text, layout, and image data into a single framework. The model incorporates a spatially aware self-attention mechanism that helps to capture the relative positioning of different text elements. Unlike earlier approaches that separately processed textual and visual features, LayoutLMv2 deeply fuses these modalities for more effective learning, which has minimized the need for retraining when applied to new domains [15]. Another approach to extracting information from VrDs is using weighted graph representations that better capture diverse relationships between text units, leading to richer semantic representations. It models VrDs as weighted graphs where nodes encode visual, textual, and spatial features, while edges represent relationships between text regions. Information extraction is treated as a node classification problem, utilizing Graph Convolutional Networks (GCNs) to analyze document structures more effectively [20,21]. The introduction of transformer-based models has brought significant improvements in CU tasks and has greatly improved performance over traditional heuristic and rule-based approaches.
In [10], researchers have investigated different pre-training techniques aimed at equipping models with the ability to comprehend charts while incorporating mathematical reasoning capabilities, which are significant for accurate data interpretation. However, despite these advancements, several key challenges remain, including a heavy reliance on OCR, difficulties in processing low-resolution images, and the ongoing need to strengthen visual reasoning skills for more robust chart analysis.
A systematic review of VLMs for visual recognition was presented in [3], addressing the limitations of traditional Deep Neural Networks (DNNs) that rely on crowd-labeled data and require training separate models for each task. Unlike conventional approaches, VLMs leveraged web-scale image-text pairs to learn vision-language correlations, enabling zero-shot predictions across multiple recognition tasks with a single model. The review explored the evolution of visual recognition paradigms, the foundational aspects of VLMs, including architectures, pre-training objectives, and downstream tasks, as well as the commonly used datasets for training and evaluation. It also categorized existing methodologies in VLM pre-training, transfer learning, and knowledge distillation, followed by benchmarking and analysis of these methods.
Multimodal language models integrate diverse data types like text, images, audio, and other inputs to enhance machine understanding beyond text-based processing, overcoming the limitations of initial LLMs by combining multiple modalities, and enabling richer and more comprehensive data interpretation [22]. The field is shifting away from two-step pipelines toward unified representations that allow LLMs to directly process documents. Modern VrDU models embed document parsing into their weights, training on structured document representations to capture layout, text, and visual attributes effectively. Multi-modal approaches, which integrate all three modalities, are particularly effective for multi-page documents, but present challenges in aligning these features. Emerging techniques using sparse attention mechanisms for inter-page connections show promise for handling multi-page documents more effectively [23]. Early VrDU models were primarily encoder-only, such as LayoutLM, which used self-supervised pretraining tasks like masked visual-language modeling to capture spatial dependencies. However, encoder-decoder frameworks emerged to overcome input length limitations and improve generative capabilities, enabling tasks such as document-based QA and KIE. Multimodal transformers integrate text, layout, and visual cues using pre-trained backbones like BERT for text, Faster-RCNN for vision, and positional encoding for layout. Hierarchical transformer architectures, such as Hi-VT5, have been developed to handle multi-page document QA by enhancing document-level understanding. Spatial-aware self-attention mechanisms introduce bias terms and positional encodings to better align textual, visual, and layout features. Some encoder-decoder models allow OCR-free document understanding, reducing dependencies on text recognition systems. Additionally, prompt-based frameworks leverage transformers for in-context learning, using structured prompts to improve zero-shot and few-shot KIE. Graph-enhanced transformers introduce relation-aware mechanisms, encoding spatial and logical relationships between document entities, while attention-based feature fusion techniques improve multimodal learning by better aligning different modalities within encoder-decoder architectures. Hybrid transformer architectures are also explored, integrating CNN-based visual feature extraction with transformer-based text encoders to capture document structures effectively. However, scalability remains a challenge for transformer-based VrDU models, as large-scale multimodal training demands computationally efficient architectures like sparse attention transformers [18].
LLMs have excelled in NLP tasks using in-context learning, but their ability to perform Document Information Extraction (DIE) has not been explored. To address this, the authors propose ICL-D3IE [24], a novel framework that enables LLMs to handle DIE by leveraging hard demonstrations (which are the most challenging segments from training data) and positional relationship demonstrations to improve structural understanding. The framework proved that LLMs can perform DIE without extensive fine-tuning, making them more efficient for real-world applications. By bridging the modality and task gap, ICL-D3IE expands the potential of LLMs beyond traditional NLP tasks. This research contributes to the broader field by demonstrating that structured data extraction can be achieved through in-context learning. Recent language models can process long input contexts, but their ability to effectively use this information remains uncertain. Researchers analyzed model performance on multi-document QA and key-value retrieval to assess how well they identified relevant information. The study found that models struggle when the position of relevant information changes, with performance degrading significantly. Notably, models perform best when information appears at the beginning or end of the context, but struggle when it is located in the middle. Controlled experiments further confirmed that models do not robustly access and use long-context information [25].
Two of the most used multimodal models (GPT-4o and Gemini Flash-1.5) were tested on labeled charts and unlabeled charts, the findings being that while they excel at summarization and inference, both models struggle with specific reading and estimation tasks when it comes to charts. On labeled charts, where data is annotated, both models showed similar error patterns with significant inaccuracies, particularly in complex formats. Human error rates in reading these charts were below 5%, whereas GPT-4o and Gemini Flash had error rates of 16% and 14%, respectively, which is a common issue, such as misreading numbers or failing to recognize negative values correctly. The performance gap widened further when models were tested on unlabeled charts, leading to error rates of 79% for Gemini Flash and 83% for GPT-4o. Deviations in estimated values were significant, with Gemini Flash averaging a 53% error and GPT-4o averaging 55%, compared to a human benchmark of 10%–20%. These deviations were caused by both minor estimation errors and major misreadings, such as mistaking years on a time-series chart [14].
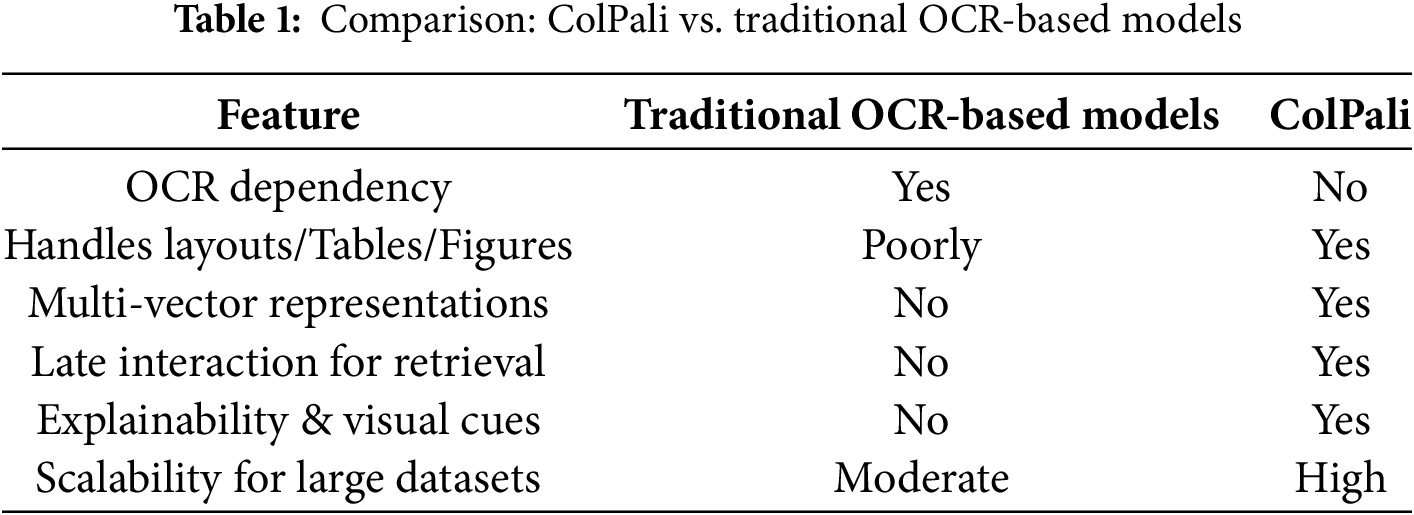
Unlike traditional retrieval systems that depend on OCR, which can struggle with complex layouts and visual elements, ColPali works directly with document images. It captures both visual cues (e.g., layout, tables, and figures) and textual meaning without the need for text extraction. Furthermore, instead of matching documents at a global level, ColPali performs fine-grained, token-level matching. This improves retrieval quality, particularly for long, multi-section documents. The ColPali architecture integrates the PaliGemma-3B model with a late interaction mechanism inspired by ColBERT. During the indexing phase, the model processes document pages by dividing them into image patches, which are then analyzed by a vision transformer. These patch embeddings are subsequently passed through a language model to generate contextualized representations. By leveraging multi-vector representations, ColPali ensures highly efficient and accurate retrieval, making it well-suited for visually rich and structured documents. By looking at Table 1, which compares traditional retrieval models with ColPali, it is clear that the latter exceeds the performance for all the metrics.
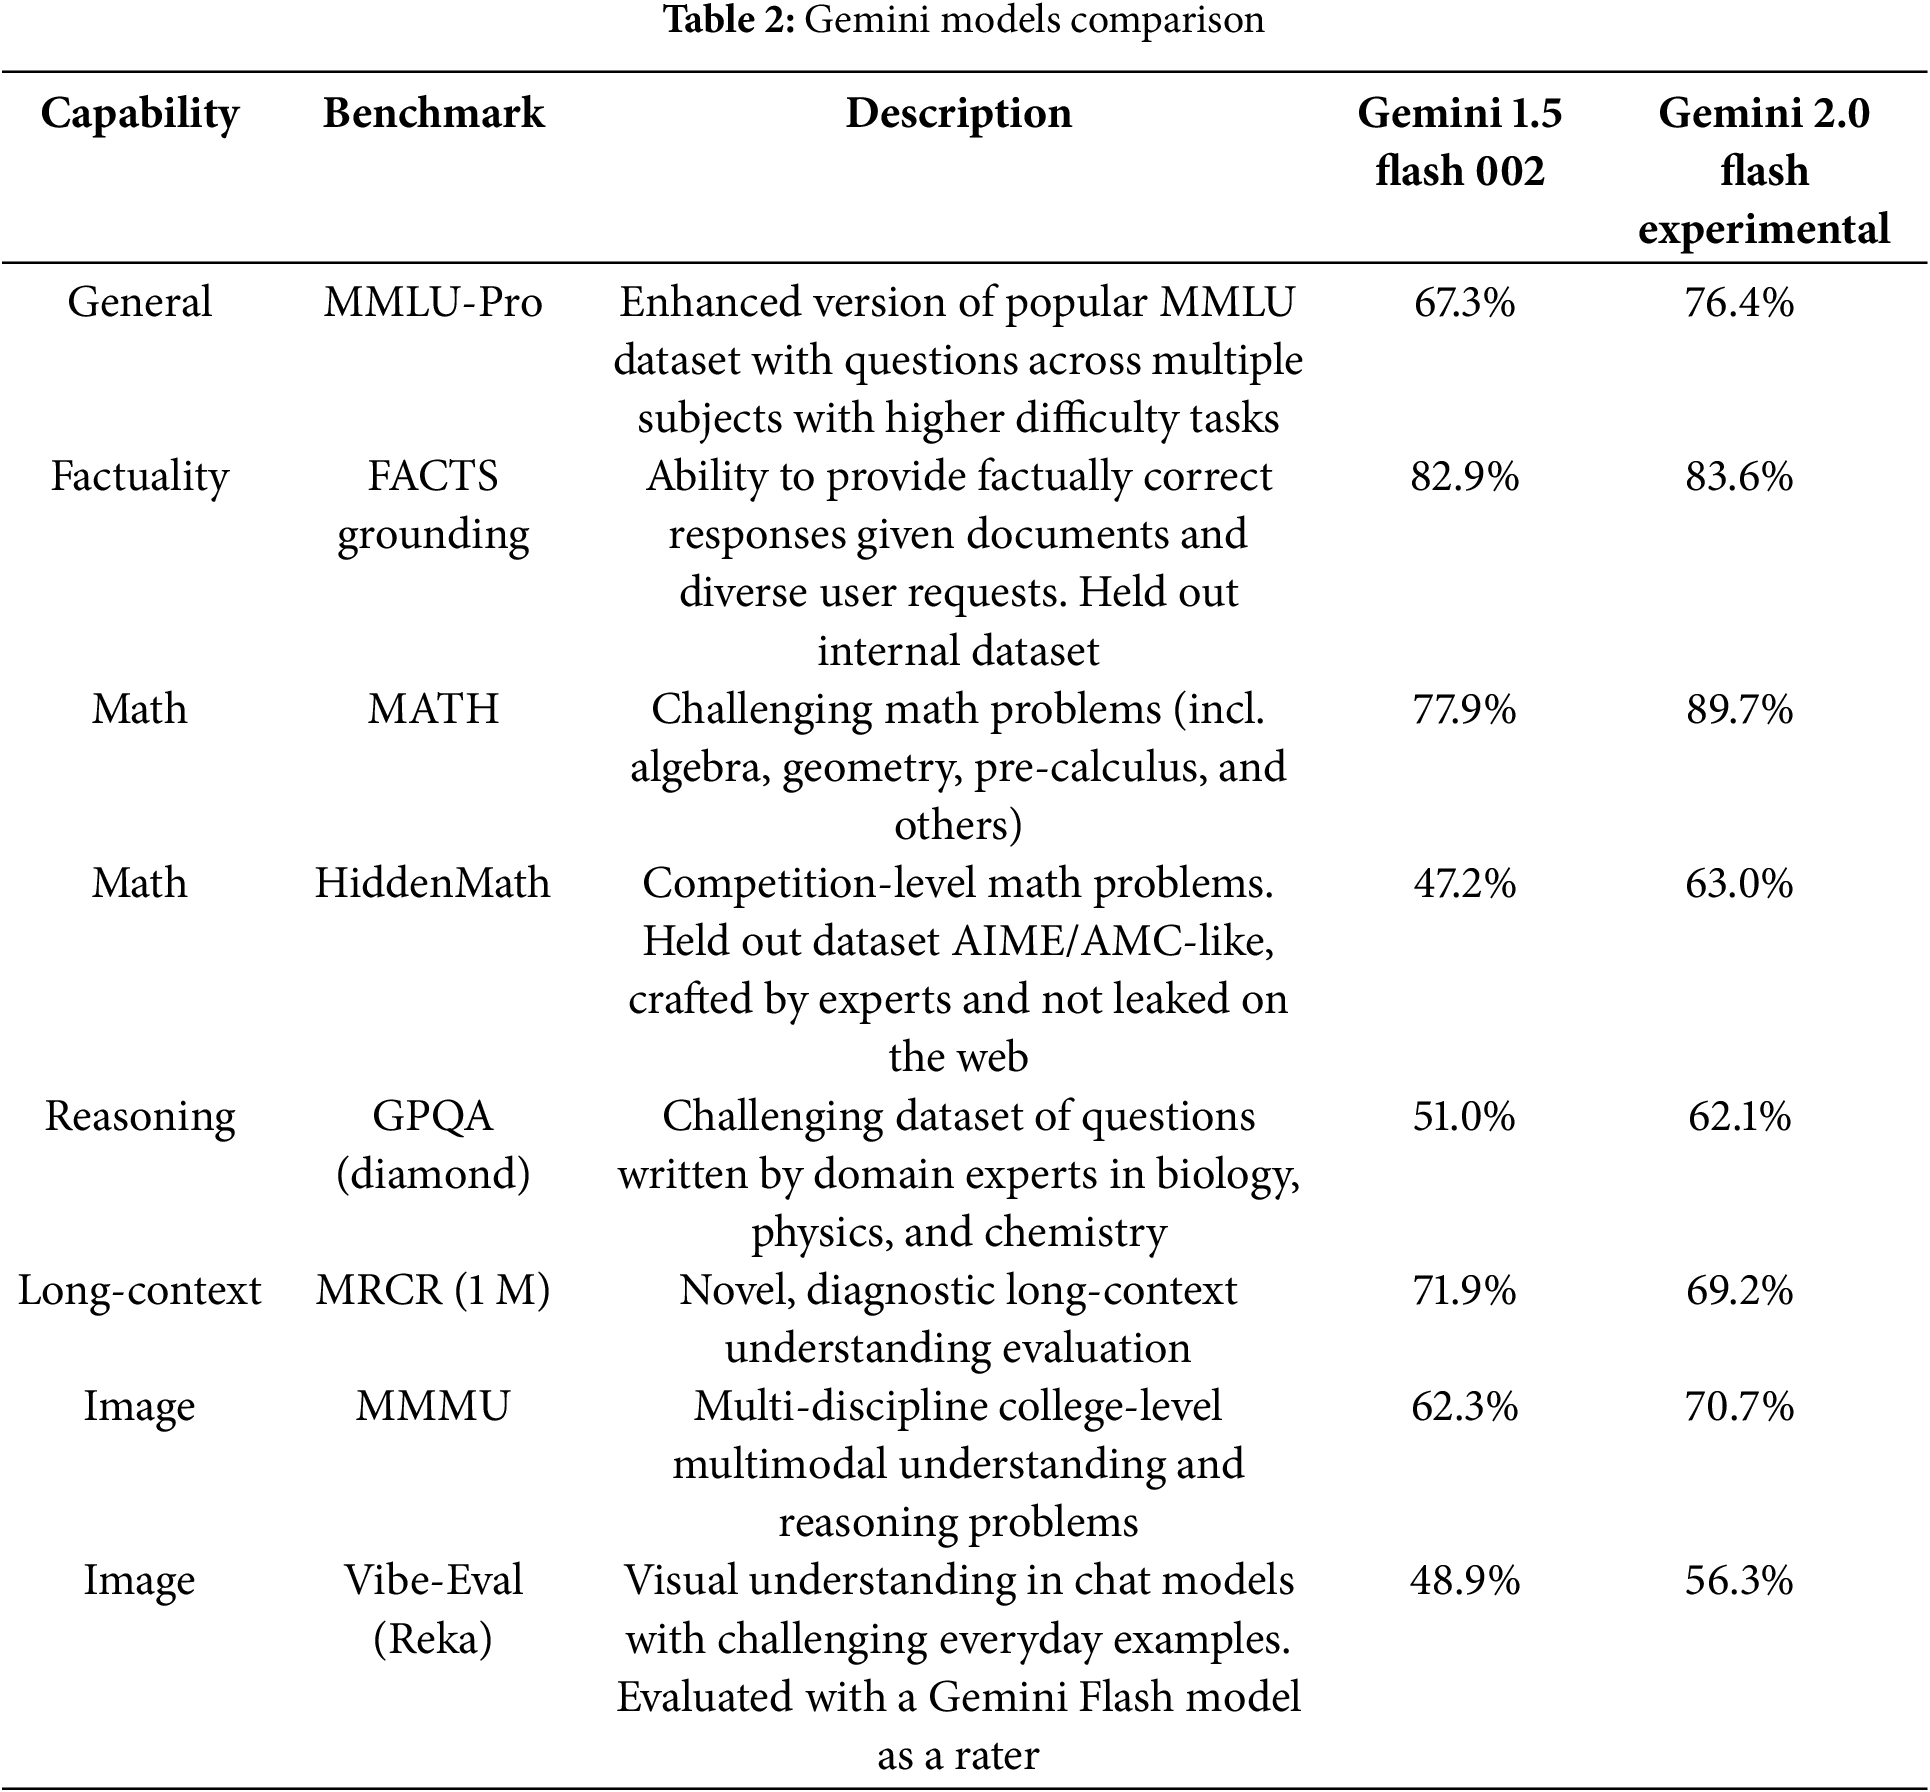
The focus of LLMs switched more to multimodal models, allowing for pictures or videos to be sent as input, due to the increasing need for vision-language tasks. Google created the Gemini 1.5 family of models “capable of recalling and reasoning over fine-grained information from millions of tokens of context, including multiple long documents and hours of video and audio” [26] having reasoning capabilities of up to at least 10 M tokens. Gemini 1.5 Flash was created to be a lighter model than Gemini 1.5 Pro, but with the same quality, having lower latency, but high efficiency at lower costs due to the efficient utilization of the TPUs (Tensor Processing Units). It is a transformer decoder model having multimodal capabilities (it can receive text, image, video, and audio as input). The latest release of the Gemini Family is Gemini 2.0 Flash Experimental, a model that introduces new features now, among the new features the most notable ones being: new native multimodal outputs, image and audio, a Multimodal Live API to build applications with real-time video streaming and audio, much better performance with the same efficiency, spatial understanding and reasoning performance enabling more accurate image understanding, building agentic experiences by using native tools such as Google Search [27]. Table 2 highlights one of the most important benchmarks for our investigation, and it is clear that Gemini 2.0 Flash Experimental has a better performance in all the capabilities, apart from the long context one, with 2.7% lower.
Our research is conducted using the “World Health Statistics 2024—Monitoring Health for the SDGs, Sustainable Development Goals”,1 a report released yearly by WHO (World Health Organization), which is a 86-page document containing 4 chapters to detail indicators from the SDGs and the Thirteenth General Programme of Work (GPW13). This report has a mix of visuals and textual information, which makes it a good candidate for this paper as data for both the ColPali model and the Gemini Flash models. It was purposefully chosen due to this variety and poses challenges not only to the data extraction but also to the reasoning capabilities of the LLMs. A second document used for this research—the “Global Banking Annual Review 2024” by McKinsey & Company2.
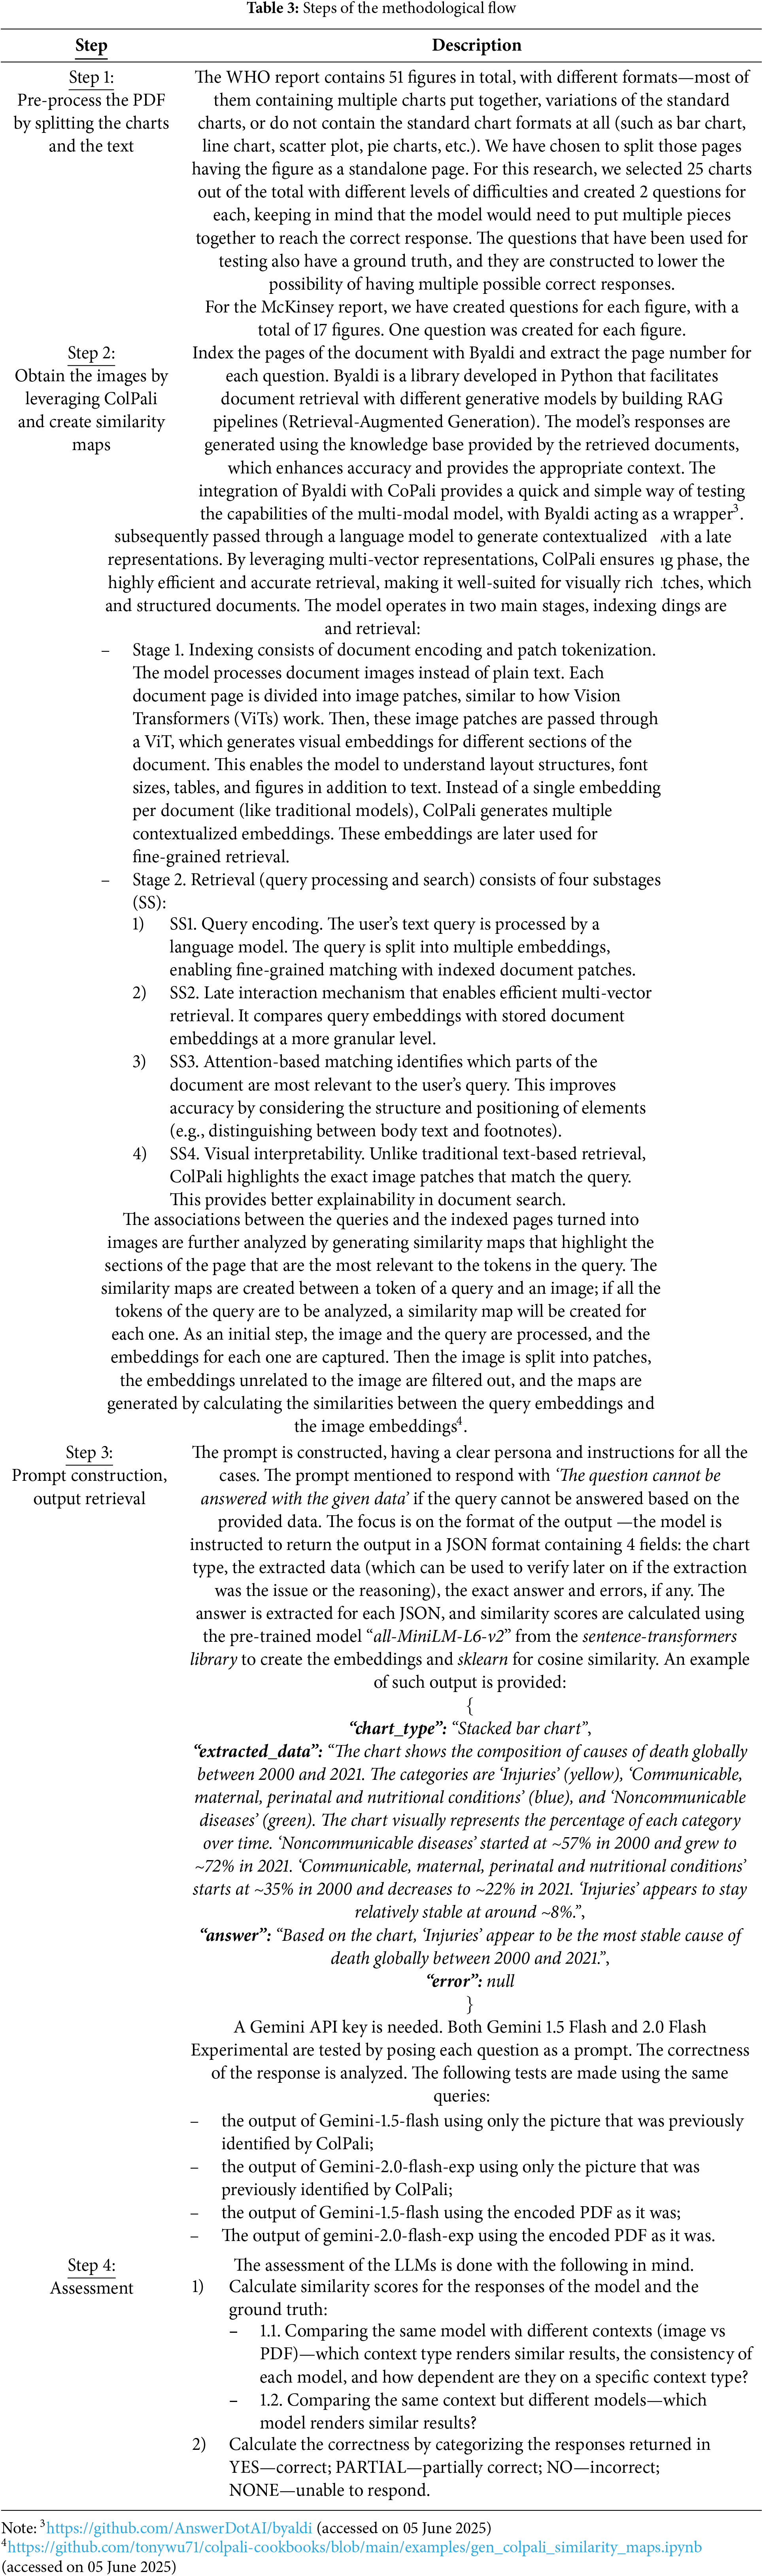
Two situations are considered for our research: 1) process the PDF, use ColPali to get the image of the page used to respond to the question, use Gemini 1.5 Flash and Gemini 2.0 Flash and pass the image when asking the question; 2) directly use Gemini 1.5 Flash and Gemini 2.0 Flash and pass the content of the whole PDF as it is. The main steps of the process are mentioned in Table 3.
Overall, once the images from ColPali are obtained, the process is presented in Fig. 1. The long context is ready (either the PDF or images of the pages), and it is used alongside the prompt, together with the Gemini API, to retrieve the responses to the queries.

Figure 1: Process using the Gemini API
Out of the 50 questions tested, 49 questions pointed to the correct pages that are used as a reference to create them, and 1 question pointed to a page that only had textual information and could not be used standalone to answer it, however, the correct page was found third by the model, leading us to understand that the model considered it to have less pertinent information.
The performance can be impacted by LLM errors, when mentioning LLM errors, the most common one is hallucination, which can be caused by multiple situations. Having as input screenshots of PDF pages can lead to inaccurate value extraction from charts depending on the chart complexity and clarity, wrong interpretation of visual relationships (e.g., wrongly grouping values close together or associating the legend to the data), wrong element identification (e.g., confusing grid lines and data lines, misunderstanding overlapping or hidden elements, missing atypical chart elements), inventing data points or labels when it cannot fully recognize them leading to visual estimations instead of actual extraction. Normally, image quality is another point that leads to errors, but in our situation, all images were of high quality.
When parsing native PDFs to the LLM the errors focus more on issues with incorrect character encoding, misunderstanding reading order or flow (e.g., when having multiple charts next to each other, complex structures with numerous elements), misinterpretation of semantic relationships (e.g., wrong linking of data points to labels due to the previously mentioned issues), wrong interpretation of meaning for chart shapes leading to missing purely visual information. The image quality error may transform into possible PDF and text embedding quality.
Each question from Table 4 was searched using the indexed pages, and the most relevant 3 pages that the model saw as containing the most relevant information were returned as output. The columns are explained below: figure—the id of the figure as stated in the PDF file; the question—the query tested; correct_page—the ground truth established for the question; page_num_1—the first page extracted by the model; score_1—the matching score of the first page extracted by the model; page_num_2—the first page extracted by the model; score_2—the matching score of the first page extracted by the model; page_num_3—the first page extracted by the model; score_3—the matching score of the first page extracted by the model; dif_1_2—the percentual difference between the matching score of the first page and the one of the second page; dif_2_3—the percentual difference between the matching score of the second page and the one of the third page.

When performing the same steps for the McKinsey document, which had 17 figures and one question for each, we obtained the results in Table 5. For all the questions, the correct page was retrieved as the first option.

Fig. 2 compares the differences between the first 2 scores versus the last 2 ones for the same question, pointing out the highest and lowest points. Overall, there are bigger differences between scores 1 and 2 than scores 2 and 3 which can mean the information in the identified pages is farther away from each other (and from the question in the case of the second score), as opposed to questions where the difference was close to 0 thus a particular question was as relevant for multiple pages, which had similar information.

Figure 2: Differences between scores McKinsey document
By comparison, an OCR retrieval method was used with the PDF-Tesseract OCR, an engine developed by Google. Each page of the PDF was converted into an image, each image was preprocessed to improve the performance by converting it to grayscale, and finally, the text was extracted using Tesseract (time taken: 290.26 s, extracted text length: 188,611). Part of the extracted text can be seen in Fig. 3, which is a side-by-side check between an actual page containing a chart and the extracted text. We can see that the text on the page is split into 2 columns, and the OCR output fails to separate the content accordingly, resulting in clear mix-ups; in terms of the chart, the description of the figure is correct, but the text on the axis and the legend are wrongly extracted.

Figure 3: OCR text extraction output
For further comparison of the LLM performance against a traditional system, we chose 2 pages containing different charts more similar to the standard ones: a line chart and a stacked bar chart. This approach needs to focus on extracting and analyzing the data differently for each chart type since even minor changes can lead to wrong results. OCR was used in combination with rules based on pixel positions to estimate the plot area, extract axes, the data, titles, and sources, and properly identify each element; a color mask was used to isolate the lines. However, even if the text was extracted, multiple tries did not result in a clear split on elements that could be further used to understand the content of the chart.
Extracted text from the left chart in Fig. 4, as seen in the highlighted text boxes: “Health-related SDGs Fig. 2.5 in the reported number of people requiring mass or individual treatment and care for NTDs, and its relative reduction, 2010–2022 2300 26% 2200 4 25% +24 2100 ~ +22 = 2000~ 20% 3 20% 21% 19% +20 20% 1900-4 18% 3B 5 2 2 3 2 2 & 5 12% = ‘> 15004 14004 8 3 13004 1% 5 2 1200 L4 1100 3% 1% 1000 0% 2010 2011 2012 2013 2014 2015 2016 2017 2018 2019 2020 2021 2022 Number of people (millions) Percentage reduction Source: WHO (17).”

Figure 4: Text boxes detected by OCR for a line chart (left) and a stacked bar chart (right)
Extracted text from the right chart from Fig. 4, as seen in the highlighted text boxes: “World health statistics 2024: Monitoring health for the SDGs, Sustainable Development Goals 58 Fig. 3.3 Contribution of tracer indicators to the HPOP billion, 2019–2025 Sanit Road deaths Trans-fat policy Safe water-rural ‘Safe water Tobacco Use Clean air (pm 2.5) service Contribution (Clean fuel use = == obesity ‘Adolescent-child obesity consumption 2019 2020 2021 2022 2023 2024 2025 Net contribution Other indicators below 1% of the total Child violence Sanitation Suicide mortality Child stunting absolute contribution in 2030 Child overweight Safe water Source: WHO (5).”
The number of pages returned can be easily changed through a parameter, and the result is a list of dictionaries, each one containing a match, meaning a page number and the matching score with the returned page. The score (score_column) highlights how relevant the content of the returned page is to the question’s goal, comparing the embeddings of the indexed pages to the ones of each question posed.
Table 4 shows that the initial scores for all 50 questions have an average of 26.39%, with a minimum of 19.13% and a maximum of 38.75%. The difference (diff_ columns) between the top 3 scores is small and, along with the scores themselves, which are less than 39%, it means that the information from the question can be easily found on multiple pages, bearing in mind that the pages were split, and the charts were separated from the text.
Fig. 5 represents a pair plot with 9 cells that facilitate the visualization of any relationships between the three scores from the data frame: 6 off-diagonal cells with individual scatter plots comparing different score columns, and 3 histograms on the diagonal showing the distribution of each score variable. By paying attention to the scatter plots, in each one, the points stand for the 50 questions, and their coordinates correspond to the scores written on each axis. All scatter plots point towards a positive correlation due to the clear cluster tendency, indicating that the scores agree on the questions with high or low scores. The three diagonal cells show the overall distribution for scores of the same column—it can be seen that in all the cases the scores are concentrated towards the left, with a peak between 20 and 22.5 for scores 2 and 3 and a slightly higher peak at around 22.5–24 for score 1, as expected since the first score should have the highest values. There is more of an abrupt passing once we are going higher on the ox axis for scores 2 and 3, whilst score 1 seems to have a more scaled descent. There is a stronger correlation between scores 2 and 3 compared to scores 1 and 2.

Figure 5: Pair-plot score 1, score 2, and score 3
The same analysis for the scores is done in Fig. 6, which compares the differences between the first 2 scores versus the last 2 ones for the same question. It can be noticed again that there are bigger differences between scores 1 and 2 than between scores 2 and 3. There is a maximum difference of 6%, followed by 4% in the first category (“Which World Bank income group had a lower health spending as a proportion of government total percentage in 2021 than in 2000?”, “What is the average across the country for the tobacco products smoked daily risk factor when talking about European countries between 2018 and 2022?” whereas the maximum two values for the second one are 3.88%, followed by 3.38% (“Which WHO regions had a similar percentage, bigger than 30%, in terms of birth rate change in the category 10–14 years, being the two highest of all the regions?”, “Which WHO regions had a close to 0 percentage in terms of birth rate change in the category 10–14 years, being the two lowest of all the regions?”). The difference between scores 1 and 2 has an average of 1.27%, a min of 0, and a max of 6%, whereas the difference between scores 2 and 3 has an average of 0.97%, a min of 0, and a max of 3.88%.

Figure 6: Differences between scores WHO document
The similarity maps are created for each token of the query, hence, Fig. 7a represents the similarity map for the token “regions” with a max score of 0.81, while Fig. 7b represents the map for the token “migrant” with a max score of 0.79. The questions asked were in order: “What death cause ranked third place for the following WHO regions: African Region, Region of the Americas, European Region, and Southeast Asia Region?” and “How does the ‘overcrowding rate’ differ between the migrant and non-migrant populations in the 35 European countries studied?”. The maximum similarity score represents the strongest association between a particular token and any region within the image, and it has a max value of 1. Judging by both scores, it means each token has a strong link to the image.

Figure 7: Similarity maps
The similarity maps can be compared to a heatmap, as the highlighted points are the most important patches that have been used in the association. The first map represents a figure talking about the top causes of death, split by regions. It can be seen that this token appears on numerous occasions on the page, for the smaller charts, and in the figure’s title, and the patches are strongly highlighted. Five out of six charts have “region(s)” in the title, which is highlighted, whereas the last one does not have it and it is not highlighted. The second map is built on an image containing both text and a visual representation. It can be seen that words from the same semantic family are also highlighted: “migratory status”, “migration-related”, and “non-migrants”. It can also be noticed that other patches (even blank spots) have been highlighted, which do not seem to have a link, but this was explained as it seems the patches are being repurposed for internal computations, and they are storing global information of the image, thus are relevant [14].
4.3 Gemini 1.5 Flash vs. Gemini 2.0 Flash Experimental
For each question, there are 4 categories of answers: 1) the model is Gemini-1.5-flash, and the input type is an image; 2) the model is Gemini-1.5-flash, and the input type PDF; 3) the model is Gemini-2.0-flash-exp and the input type image; 4) model is Gemini-2.0-flash-exp and the input type PDF.
Before checking the correctness of the responses, an initial analysis can be done on the extracted information. The LLM is instructed to write the chart type used to answer that question based on its understanding and it can be noticed in Fig. 8 that in 30% of the questions the chart types extracted were the same, noticeably those chart types were the more standard ones: line chart, bar chart, stacked (bar) chart, radar chart.

Figure 8: Extracted the chart type percentage for the 4 situations
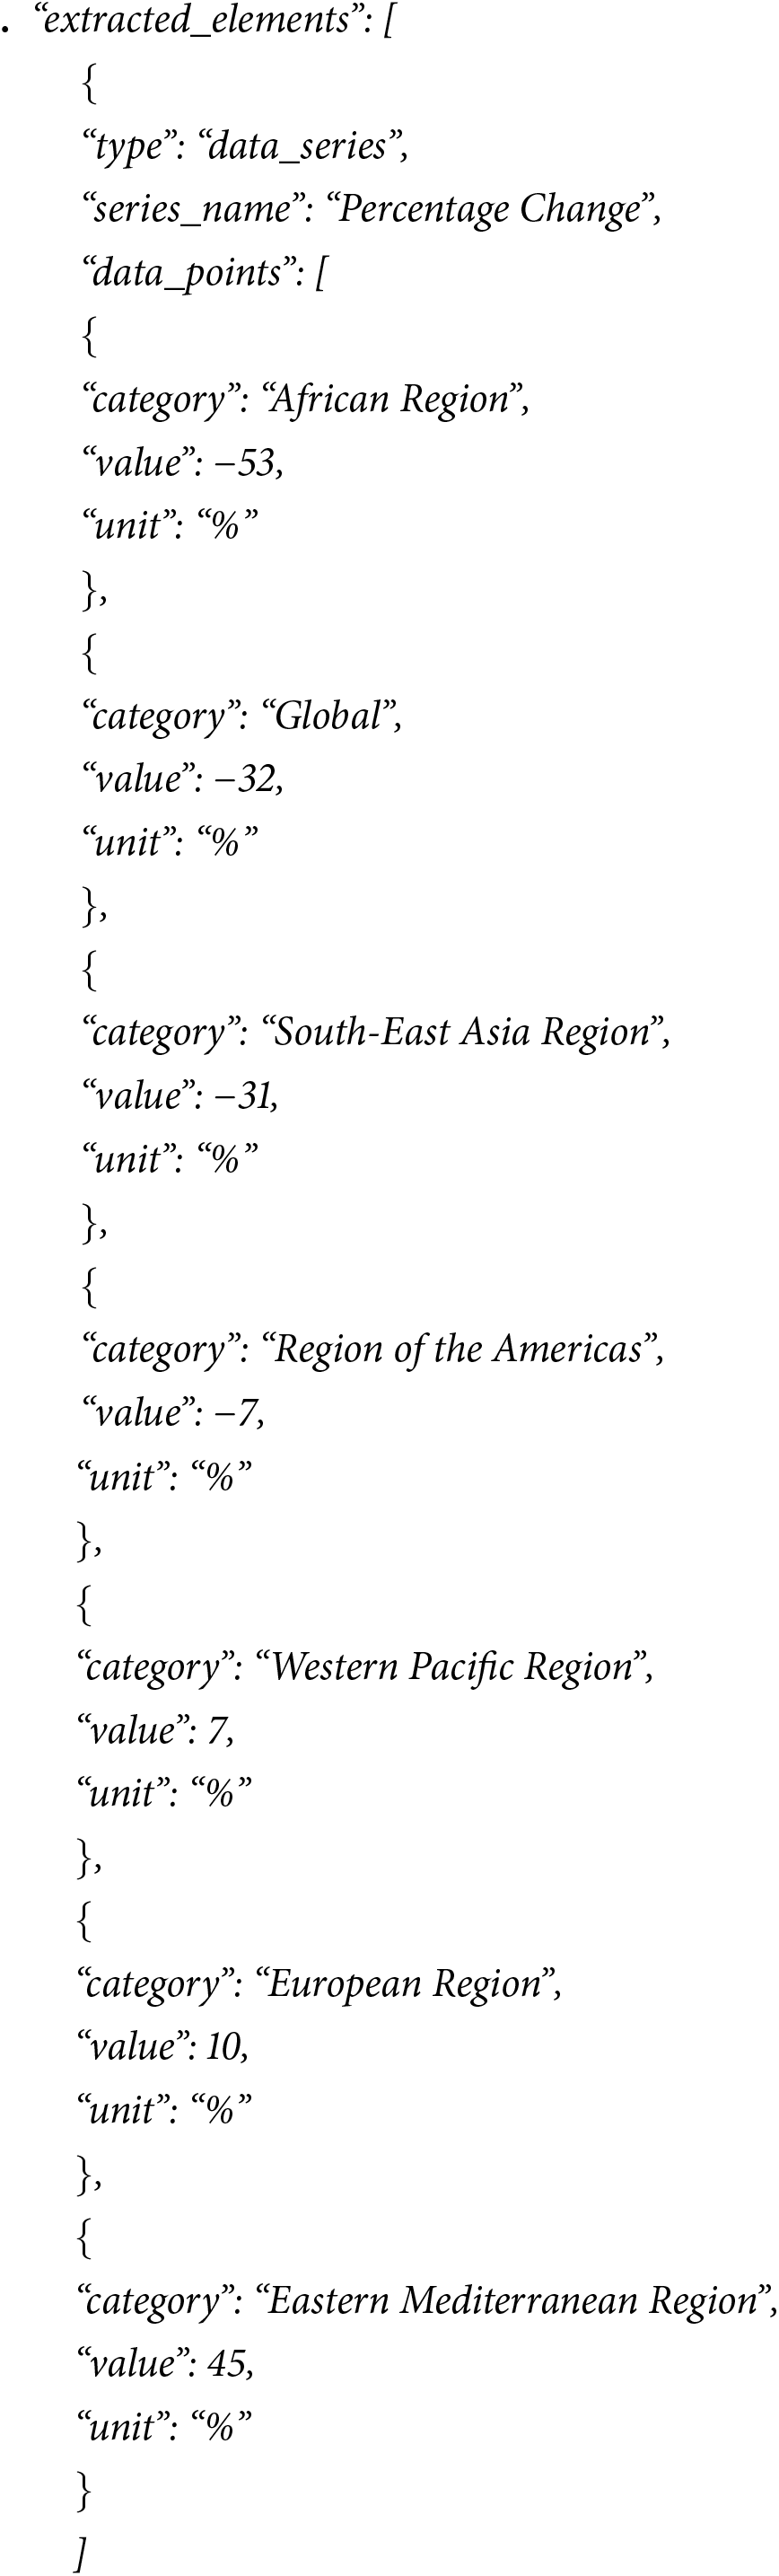
Another check can be done on the extracted data points. The analysis was done taking into account the generated JSONs for the image input type with both models. The “extracted_data” field from the JSON response was split into data series or key points depending on its content. For example, the response was transformed from “extracted_data”: “African Region: −53%, Global: −32%, South-East Asia Region: −31%, Region of the Americas: −7%, Western Pacific Region: 7%, European Region: 10%, Eastern Mediterranean Region: 45%.” into the following JSON where each bar has a category and value, which will be used to calculate precision, recall and accuracy for each of the extracted data compared to the ground truth.
The metrics from Table 6 belong to the chosen chart—Fig. 2.1—from the PDF document, which had 2 possible ground truths due to being a complex chart, where for the same regions, different numbers could be extracted. In the extracted data, it was clear that based on the question, the model focused on either extracting only the pertinent part of the chart or trying to extract everything, this is clear in the difference in metrics between the first and second questions with the same model.

BLEU, ROUGE-L, and the Levenshtein distance metrics were calculated for each pair of responses, and the aggregation from Table 7 is the outcome.

A few mentions are needed to properly interpret the results:
– The metrics BLEU and ROUGE-L have values between 0 and 1, with higher values being considered closer to a perfect match
– Levenshtein distance can be translated in the following way: 0—the strings are identical, 5—5 character changes are needed for a perfect match
– “% High Sim” represents the percentage of rows where the BLEU or ROUGE-L score for the mentioned pair was at least 0.9, thus indicating how often the answers given by that pair were very similar
– “% Very Close” represents the percentage of rows where the calculated Levenshtein distance for that pair was less than 5; a higher percentage means the generated answers were closer in similarity
Based on the above metrics, we can draw the following conclusions:
– Overall, the answers from any given pair of the 4 sources are rarely identical, and by looking at the percentages of the “High Sim” column, they are also rarely highly similar; based on the percentages from the “Very Close” column, the answers often significantly differ at the character level
– The same flash version and different input type tend to be more similar than answers from different model versions; the pair with flash 2.0 image vs PDF has the highest ROUGE-L mean, median, and percentage of the high similarity column, whilst having the lowest mean/median Levenshtein distance. The pair flash 1.5 image vs PDF has the highest percentage of perfect matches, a high similarity of 10%, and a 10% Levenshtein distance.
– Different flash version tends to lead to lower similar answers; flash 1.5 vs flash 2 PDF has the lowest percentage of a perfect match, quite a low high similarity percentage, and low means/medians, whilst the same models but with image as input type lead to a low similarity and only a 4% perfect match.
The charts below were created by grouping the 4 answers as follows: (a) same model but different context types; to see which input types render similar results, the consistency of each model, and how dependent are they on a specific input type; (b) same context type, but different models; purpose—seeing which model renders similar results.
The x-axis represents the similarity scores with values between 0 and 1, and the y-axis represents the number of questions that fit into each similarity score interval. For both charts in Fig. 9, the distribution is skewed to the right, suggesting that many answers have a very high similarity (between 0.9 and 1.0), but more responses are similar in Flash 2.0 than in 1.5. Also, around 76% of the responses have a similarity above 0.6 for Flash 2.0, suggesting the model is more robust and has better reasoning capabilities that do not rely on the input type, compared to Flash 1.5, which has a similarity of only approximately 56% above 0.6.
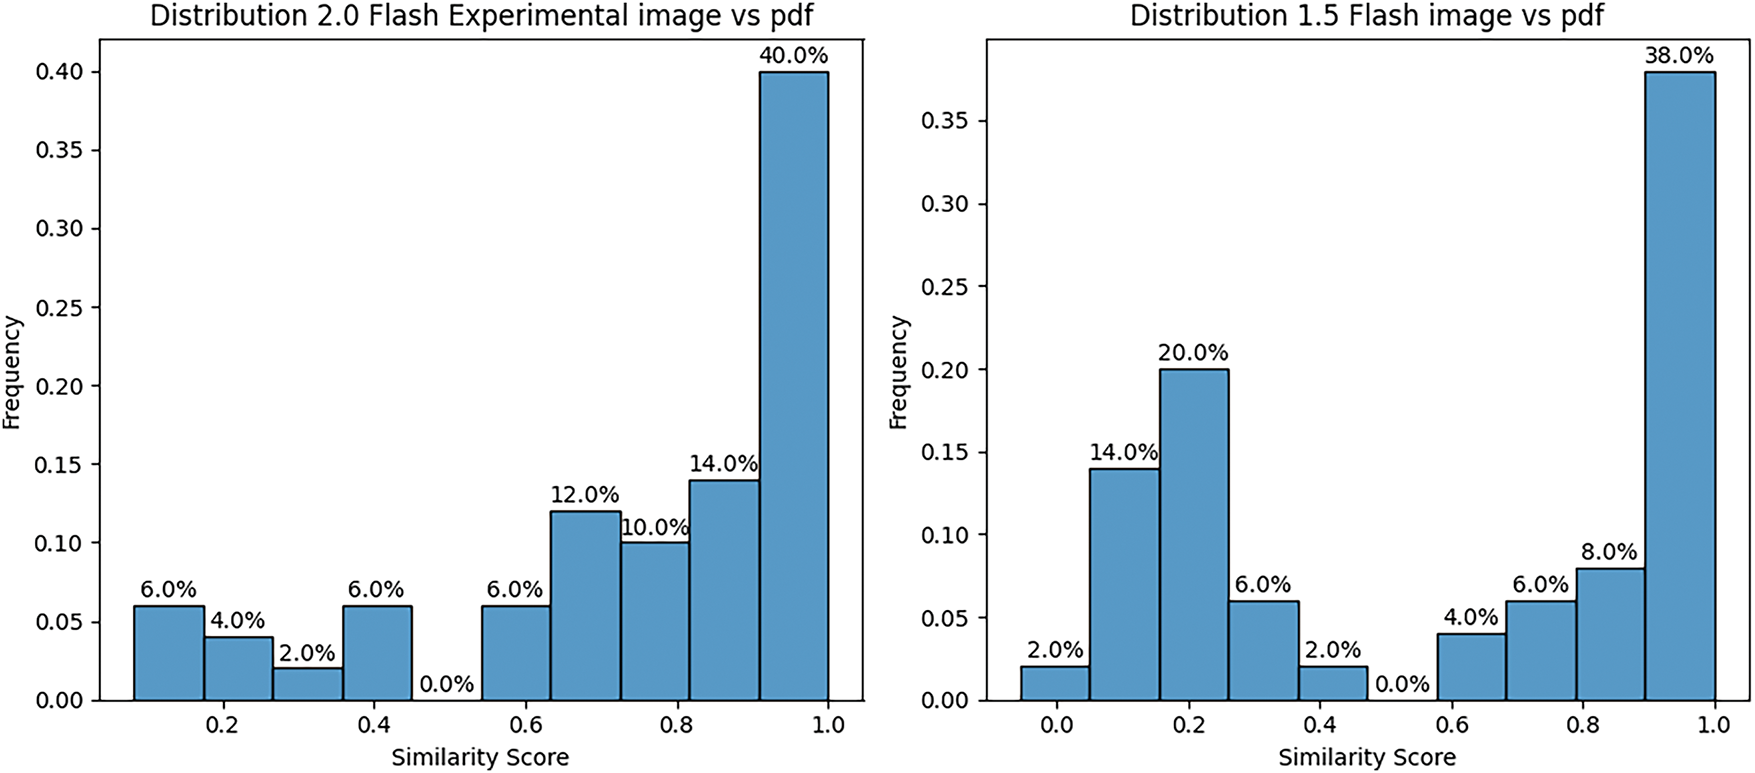
Figure 9: Histogram similarity scores within the WHO model document
The second analysis is performed by comparing the similarity scores of different models that were each given first the image as ground for the questions, then the whole PDF. The purpose is to compare the performance of each model for a specific input type. For Fig. 10, the distribution is also skewed to the right in both cases, suggesting there is a larger number of responses with a higher similar score. This time 65% of the responses have a similarity score higher than 0.6 when using PDF as an input type, compared to 58% when using image, which suggests the models are producing more similar responses when using PDF compared to images, but it may also mean Flash 1.5 is not as good as interpreting images as Flash 2.0.

Figure 10: Histogram similarity scores within the input type WHO document
When calculating the number of questions that could not be answered for each combination of model and input type, it is seen that Flash 2.0 can respond regardless of the input type, while Flash 1.5 has a difference of 10 questions more than were answered when extracting from PDF, suggesting it is less performant on images, but even with PDF, it was not able to match the numbers from Flash 2.0 (as in Table 8).

To calculate the correctness of each of the 4 outputs, a ground truth was created for each question. To evaluate the responses, a prompt was used that would split the outcome into 4 categories [YES/PARTIAL/NO/NONE]:
– “YES”, if the answer explicitly highlights the same outcome as the ground truth and contains no contradictory information.
– “PARTIAL”, if the answer contains the information from the ground truth, but also includes contradictory or additional information (like extra possibilities not supported by the ground truth).
– “NO”, if the answer’s main point is completely different than the ground truth, or completely misses the ground truth.
– “NONE”, if the answer states or implies that the question cannot be answered based on the information it was given.
The outcome is visible in Tables 9 and 10. For both documents, the most correct and complete responses are found in the output of Flash 2.0 using the image ColPali as a knowledge source. These results are followed by the same model but using the whole document as a knowledge source in the case of the WHO document. Overall, for the WHO document, counting both true and partially true responses, Flash 2.0 has 36/50 and 27/50, with only 3, respectively, 1 question not receiving a response at all. Flash 1.5 has the most queries without response, with 21 when using image as input versus 12 when using PDF. These results for both documents show that Flash 1.5 works much better with textual information, while the 2.0 version has much better image recognition and reasoning abilities.


This paper used the “World Health Statistics 2024” report released yearly by WHO to analyze the performance of ColPali, a new model that leverages the latest VLMs by using images of the document’s pages to produce high-quality contextualized embeddings. The chosen document contains a combination of text and complex figures, presenting a good structure for our chosen model. ColPali is indexing the documents only from their visual features, which resulted in fast indexing while maintaining higher performance than other existing document retrieval methods.
Using the chosen document, a dataset of 50 questions was created based on different selected charts. For clearer recognition, the PDF was first split, and each chart was moved to a different page. The purpose was to test if the model could point to the chart page whilst also having textual info regarding the topic of each question. ColPali had a 98% success rate, and the recognition based on the token was visible through the similarity maps, which highlighted that the model has strong capabilities of complex image understanding.
The images that were outputted by ColPali were used as input for Gemini Flash 1.5 and Flash 2.0 Experimental to test the capabilities of each model for QA based on only the image. Tests were also done using the content of the document as a PDF to compare the performance. The similarity of the responses was calculated using the sentence-transformers library for embeddings and sklearn for cosine similarity. Each question had a ground truth, and the correctness was calculated for each model. Overall, Flash 2.0 has shown clearly better results for our tests, being capable of extracting data from complex charts and also understanding the overall visuals, and being able to properly use them to end up with the correct response.
The main insights and conclusions drawn from our research are:
(a) ColPali outperforms traditional OCR-based retrieval. Unlike traditional OCR-based models that struggle with complex document layouts, ColPali effectively retrieves relevant visual elements (charts, figures, tables) without requiring text extraction. By leveraging fine-grained, token-level matching, multi-vector representations, and late interaction retrieval mechanisms, ColPali achieves higher accuracy and better scalability for visually rich documents. The similarity maps generated using ColPali highlight the most relevant sections of a page, demonstrating its effectiveness in retrieving precise information.
(b) Gemini 2.0 Flash Experimental is More Robust Than Gemini 1.5 Flash. Across all performance metrics, Gemini 2.0 Flash Experimental outperforms Gemini 1.5 Flash, demonstrating improved factual grounding, mathematical reasoning, and multimodal understanding. The similarity analysis shows that Gemini 2.0 Flash is more consistent across different input types (PDF and image), while Gemini 1.5 Flash exhibits more variation depending on the input format. 76% of Gemini 2.0 Flash responses had a similarity score above 0.6, compared to 56% for Gemini 1.5 Flash, indicating a more reliable reasoning process.
(c) Gemini 2.0 Flash excels in multimodal reasoning. When using images as input, Gemini 2.0 Flash provides the most accurate responses, followed by its performance when using the full PDF. In contrast, Gemini 1.5 Flash struggles with image-based input, answering 10 fewer questions when using images than when using PDFs. Flash 2.0 was able to answer nearly all questions regardless of input type, demonstrating superior image reasoning and multimodal comprehension compared to Flash 1.5.
(d) Text-based processing still holds advantages in certain cases. The PDF-based approach slightly outperformed the image-based approach when considering the overall similarity scores, suggesting that structured text extraction still provides a reliable way for LLMs to understand documents. Flash 1.5 performs significantly better with textual input than with images, reinforcing the notion that earlier LLMs rely more on text-based processing.
(e) Gemini 2.0 Flash with image input is the best approach for chart understanding. The most correct and complete responses came from Gemini 2.0 Flash using images retrieved by ColPali, proving that multimodal models improve chart comprehension when images are used as input. Out of 50 questions, Flash 2.0 with image input answered 34 correctly, compared to only 21 for Flash 2.0 with PDF input. Gemini 1.5 Flash struggled significantly, with 21 questions left unanswered when using image input.
(f) Implications for VrDU. ColPali’s ability to enhance document retrieval and Gemini 2.0 Flash’s superior reasoning suggest a shift towards multimodal AI for document understanding. Multimodal LLMs surpass traditional OCR-based methods in processing complex document layouts, integrating textual and visual elements, and improving response accuracy. The results emphasize the importance of reasoning capabilities in document analysis, not just text extraction.
Using multimodal AI models like Gemini 2.0 Flash, combined with advanced retrieval methods like ColPali, significantly enhances chart understanding. The integration of visual and textual reasoning leads to better document comprehension, marking a shift away from traditional OCR-based approaches.
In terms of limitations of the proposed approach, we mention unusual content split in documents (e.g., content spreading on multiple pages might pose issues to ColPali, questions which require access to charts and textual information to draw up a pertinent conclusion); further evaluation is needed for highly unusual documents: completely different layouts, handwritten, scanned images turned into PDFs. As for future research, focusing on understanding the behavior with highly variable document layouts and completely different domains is key, followed by using specific and more advanced evaluation metrics.
Acknowledgement: This work was supported by a grant from the Ministry of Research, Innovation, and Digitization, CNCS/CCCDI-UEFISCDI, project number COFUND-CETP-SMART-LEM-1, within PNCDI IV.
Funding Statement: This work was supported by a grant from the Ministry of Research, Innovation and Digitization, CNCS/CCCDI-UEFISCDI, project number COFUND-CETP-SMART-LEM-1, within PNCDI IV.
Author Contributions: Andreea-Maria Tanasă: Methodology, Formal Analysis, Investigation, Resources, Writing—Original Draft, Writing—Review and Editing, Visualization. Simona-Vasilica Oprea: Conceptualization, Validation, Formal Analysis, Investigation, Writing—Original Draft, Writing—Review and Editing, Visualization, Supervision, Project Administration. All authors reviewed the results and approved the final version of the manuscript.
Availability of Data and Materials: The data will be made available upon reasonable request.
Ethics Approval: Not applicable.
Conflicts of Interest: The authors declare no conflicts of interest to report regarding the present study.
1https://www.who.int/publications/i/item/9789240094703 (accessed on 05 June 2025)
2https://www.mckinsey.com/industries/financial-services/our-insights/global-banking-annual-review#/ (accessed on 05 June 2025)
References
1. Lu MY, Chen B, Williamson DFK, Chen RJ, Liang I, Ding T, et al. A visual-language foundation model for computational pathology. Nat Med. 2024;30(3):863–74. doi:10.1038/s41591-024-02856-4. [Google Scholar] [PubMed] [CrossRef]
2. Zhang K, Wang S, Jia N, Zhao L, Han C, Li L. Integrating visual large language model and reasoning chain for driver behavior analysis and risk assessment. Accid Anal Prev. 2024;198(4):107497. doi:10.1016/j.aap.2024.107497. [Google Scholar] [PubMed] [CrossRef]
3. Zhang J, Huang J, Jin S, Lu S. Vision-language models for vision tasks: a survey. IEEE Trans Pattern Anal Mach Intell. 2024;46(8):5625–44. doi:10.1109/TPAMI.2024.3369699. [Google Scholar] [PubMed] [CrossRef]
4. Barboule C, Piwowarski B, Chabot Y. Survey on question answering over visually rich documents: methods, challenges, and trends. arXiv:2501.02235. 2025. [Google Scholar]
5. Subramani N, Matton A, Greaves M, Lam A. A survey of deep learning approaches for OCR and document understanding. arXiv:2011.13534. 2020. [Google Scholar]
6. Wu W, Sun Z, Song Y, Wang J, Ouyang W. Transferring vision-language models for visual recognition: a classifier perspective. Int J Comput Vis. 2024;132(2):392–409. doi:10.1007/s11263-023-01876-w. [Google Scholar] [CrossRef]
7. Devlin J, Chang MW, Lee K, Toutanova K. BERT: pre-training of deep bidirectional transformers for language understanding. arXiv:1810.04805. 2018. [Google Scholar]
8. Sevastjanova R, Cakmak E, Ravfogel S, Cotterell R, El-Assady M. Visual comparison of language model adaptation. IEEE Trans Vis Comput Graph. 2023;29(1):1178–88. doi:10.1109/TVCG.2022.3209458. [Google Scholar] [PubMed] [CrossRef]
9. Salaberria A, Azkune G, Lopez de Lacalle O, Soroa A, Agirre E. Image captioning for effective use of language models in knowledge-based visual question answering. Expert Syst Appl. 2023;212(1):118669. doi:10.1016/j.eswa.2022.118669. [Google Scholar] [CrossRef]
10. Al-Shetairy M, Hindy H, Khattab D, Aref MM. Transformers utilization in chart understanding: a review of recent advances & future trends. arXiv:2410.13883. 2024. [Google Scholar]
11. Sohn C, Choi H, Kim K, Park J, Noh J. Line chart understanding with convolutional neural network. Electronics. 2021;10(6):749. doi:10.3390/electronics10060749. [Google Scholar] [CrossRef]
12. Ahmed S, Yan P, Doermann D, Setlur S, Govindaraju V. SpaDen: sparse and dense keypoint estimation for real-world chart understanding. In: Document analysis and recognition—ICDAR, 2023. Cham, Switzerland: Springer; 2023. p. 77–93. doi:10.1007/978-3-031-41679-8_5. [Google Scholar] [CrossRef]
13. Vaswani A, Shazeer N, Parmar N, Uszkoreit J, Jones L, Gomez AN, et al. Attention is all you need. arXiv:1706.03762. 2017. [Google Scholar]
14. Faysse M, Sibille H, Wu T, Omrani B, Viaud G, Hudelot C, et al. ColPali: efficient document retrieval with vision language models. arXiv:2407.01449. 2024. [Google Scholar]
15. Xu Y, Xu Y, Lv T, Cui L, Wei F, Wang G, et al. LayoutLMv2: multi-modal pre-training for visually-rich document understanding. In: Proceedings of the 59th Annual Meeting of the Association for Computational Linguistics and the 11th International Joint Conference on Natural Language Processing (Volume 1: Long Papers). Stroudsburg, PA, USA: ACL; 2021. p. 2579–91. doi:10.18653/v1/2021.acl-long.201. [Google Scholar] [CrossRef]
16. Wei M, He Y, Zhang Q. Robust layout-aware IE for visually rich documents with pre-trained language models. In: Proceedings of the 43rd International ACM SIGIR Conference on Research and Development in Information Retrieval; 2020; Online. p. 2367–76. doi:10.1145/3397271.3401442. [Google Scholar] [CrossRef]
17. Sassioui A, Benouini R, El Ouargui Y, El Kamili M, Chergui M, Ouzzif M. Visually-rich document understanding: concepts, taxonomy and challenges. In: 2023 10th International Conference on Wireless Networks and Mobile Communications (WINCOM); 2023 Oct 26–28; Istanbul, Turkiye. p. 1–7. doi:10.1109/WINCOM59760.2023.10322990. [Google Scholar] [CrossRef]
18. Ding Y, Lee J, Han SC. Deep learning based visually rich document content understanding: a survey. arXiv:2408.01287. 2024. [Google Scholar]
19. Wang Z, Zhou Y, Wei W, Lee CY, Tata S. VRDU: a benchmark for visually-rich document understanding. In: Proceedings of the 29th ACM SIGKDD Conference on Knowledge Discovery and Data Mining; 2023; Long Beach CA, USA. p. 5184–93. doi:10.1145/3580305.3599929. [Google Scholar] [CrossRef]
20. Farahani AM, Adibi P, Ehsani MS, Hutter HP, Darvishy A. Automatic chart understanding: a review. IEEE Access. 2023;11:76202–21. doi:10.1109/access.2023.3298050. [Google Scholar] [CrossRef]
21. Gbada H, Kalti K, Ali Mahjoub M. Multimodal weighted graph representation for information extraction from visually rich documents. Neurocomputing. 2024;573(5):127223. doi:10.1016/j.neucom.2023.127223. [Google Scholar] [CrossRef]
22. Wu J, Gan W, Chen Z, Wan S, Yu PS. Multimodal large language models: a survey. In: 2023 IEEE International Conference on Big Data (BigData); 2023 Dec 15–18; Sorrento, Italy. p. 2247–56. doi:10.1109/bigdata59044.2023.10386743. [Google Scholar] [CrossRef]
23. Huang J, Chen H, Yu F, Lu W. From detection to application: recent advances in understanding scientific tables and figures. ACM Comput Surv. 2024;56(10):1–39. doi:10.1145/3657285. [Google Scholar] [CrossRef]
24. He J, Wang L, Hu Y, Liu N, Liu H, Xu X, et al. ICL-D3IE: in-context learning with diverse demonstrations updating for document information extraction. In: 2023 IEEE/CVF International Conference on Computer Vision (ICCV); 2023 Oct 1–6; Paris, France. p. 19428–37. doi:10.1109/iccv51070.2023.01785. [Google Scholar] [CrossRef]
25. Liu NF, Lin K, Hewitt J, Paranjape A, Bevilacqua M, Petroni F, et al. Lost in the middle: how language models use long contexts. Trans Assoc Comput Linguist. 2024;12(5):157–73. doi:10.1162/tacl_a_00638. [Google Scholar] [CrossRef]
26. Gemini Team. Gemini 1.5: unlocking multimodal understanding across millions of tokens of context. arXiv:2403.05530. 2024. [Google Scholar]
27. Mallick SB, Korevec K. The next chapter of the Gemini era for developers; 2024 [Internet]. [cited 2025 Jun 5]. Available from: https://developers.googleblog.com/en/the-next-chapter-of-the-gemini-era-for-developers/. [Google Scholar]
Cite This Article
 Copyright © 2025 The Author(s). Published by Tech Science Press.
This work is licensed under a Creative Commons Attribution 4.0 International License , which permits unrestricted use, distribution, and reproduction in any medium, provided the original work is properly cited.
 Downloads
 Citation Tools