
 Submit a Paper
 Propose a Special lssue
 Open Access
ARTICLE

A Hybrid Feature Selection Method for Advanced Persistent Threat Detection
1 Cyber Threat Intelligence Lab, Faculty of Computing, Universiti Teknologi Malaysia, Johor, 81310, Malaysia
2 College of Computing, Birmingham City University, Birmingham, B4 7RQ, UK
3 School of Computing, University of Portsmouth, Buckingham Building, Lion Terrace, Portsmouth, PO1 3HE, UK
* Corresponding Author: Yussuf Ahmed. Email:
(This article belongs to the Special Issue: Advanced Algorithms for Feature Selection in Machine Learning)
Computers, Materials & Continua 2025, 84(3), 5665-5691. https://doi.org/10.32604/cmc.2025.063451
Received 15 January 2025; Accepted 25 June 2025; Issue published 30 July 2025
 View Full Text
 Download PDF
Abstract
Advanced Persistent Threats (APTs) represent one of the most complex and dangerous categories of cyber-attacks characterised by their stealthy behaviour, long-term persistence, and ability to bypass traditional detection systems. The complexity of real-world network data poses significant challenges in detection. Machine learning models have shown promise in detecting APTs; however, their performance often suffers when trained on large datasets with redundant or irrelevant features. This study presents a novel, hybrid feature selection method designed to improve APT detection by reducing dimensionality while preserving the informative characteristics of the data. It combines Mutual Information (MI), Symmetric Uncertainty (SU) and Minimum Redundancy Maximum Relevance (mRMR) to enhance feature selection. MI and SU assess feature relevance, while mRMR maximises relevance and minimises redundancy, ensuring that the most impactful features are prioritised. This method addresses redundancy among selected features, improving the overall efficiency and effectiveness of the detection model. Experiments on a real-world APT datasets were conducted to evaluate the proposed method. Multiple classifiers including, Random Forest, Support Vector Machine (SVM), Gradient Boosting, and Neural Networks were used to assess classification performance. The results demonstrate that the proposed feature selection method significantly enhances detection accuracy compared to baseline models trained on the full feature set. The Random Forest algorithm achieved the highest performance, with near-perfect accuracy, precision, recall, and F1 scores (99.97%). The proposed adaptive thresholding algorithm within the selection method allows each classifier to benefit from a reduced and optimised feature space, resulting in improved training and predictive performance. This research offers a scalable and classifier-agnostic solution for dimensionality reduction in cybersecurity applications.Keywords
With the increase in accessibility and widespread use of the internet, cyberattacks have become a prevalent threat. These cyberattacks pose a significant concern for businesses, governments, and individual users, leading to substantial financial and operational losses. In 2023, global cybercrime costs are projected to exceed eight trillion dollars [1]. Cybercriminals increasingly target critical infrastructure, including healthcare systems, financial institutions, and the energy sector, posing severe risks to national security and economic stability. Cyberattacks can be categorised into two main types: targeted and untargeted attacks. Untargeted attacks are indiscriminate and directed at any available target, often exploiting organisations with inadequate defence mechanisms [2]. In contrast, targeted attacks are specifically directed at particular organisations with the intent of breaching their security [2,3]. Among targeted attacks, the most severe are Advanced Persistent Threats (APTs), which pose significant risks to organisations and national security. The acronym APT stands for the following three components:
• Advanced: This term refers to the sophisticated nature of APT attackers. APT attackers are highly skilled individuals who employ advanced techniques to exploit vulnerabilities. They use custom malware and employ sophisticated attack vectors [4]. These attackers are well-resourced, leveraging cutting-edge technology and the latest methodologies to achieve their objectives.
• Persistent: The term “persistent” refers to the long-term nature of an APT attack. Attackers infiltrate a network and remain within it for extended periods, continuously adapting their tactics to evade detection and maintain access. Their primary goal is often to steal sensitive information or disrupt normal operations [5].
• Threat: The term “threat” refers to the potential damage caused by the attack. APT attacks are highly targeted and specifically designed to steal information, sometimes disrupting normal operations. Due to their stealth and persistence, APTs pose a significant threat, making them a major concern for both organisations and governments.
Cybersecurity defence mechanisms are crucial for detecting and mitigating various cyber threats, including advanced persistent threats (APTs). There are two primary detection techniques used in practice that are widely used; signature-based detection and anomaly-based detection [6]. Each approach has its strengths and weaknesses in identifying and preventing cyber threats. Signature-based detection and anomaly-based detection. Signature-based detection systems identify threats by matching them with a database of known attacks [7,8]. These systems are highly effective at detecting previously known attacks and can provide high accuracy in detecting these attacks [9]. However, they face significant limitations when dealing with advanced unknown threats, such as those posed by APT attackers, who often employ innovative and evolving methods that signature-based systems fail to detect [9].
Anomaly-based detection systems establish a baseline of normal behaviour within a system or network [7]. These systems continuously monitor network activities and detect deviations from this baseline to identify potential threats. Anomaly-based detection is particularly useful for identifying novel threats that do not match known attack signatures. By analysing patterns and behaviours rather than relying on predefined signatures, these systems can detect unusual or suspicious activities that may indicate a security breach. However, one limitation of this approach is the tendency to flag legitimate deviations from normal behaviour as anomalies, which can result in higher false positive rates. Anomaly-based detection systems often employ machine learning models for training and anomaly detection. Developing and training these models typically requires large datasets to detect and differentiate between threats and normal activities effectively. Researchers have suggested that machine learning can be instrumental in detecting APT attacks [10].
The research into APT attack detection requires the use of extensive datasets with detailed network logs. These datasets are often of high dimensionality, which can pose challenges in terms of complexity and storage. Using large datasets for machine learning-based anomaly detection can also lead to issues such as overfitting, which negatively impacts model performance and generalisation. To address these challenges, dimensionality reduction techniques are crucial. Dimensionality reduction can reduce training times and improve model accuracy by eliminating irrelevant or redundant features.
Feature selection methods are essential for identifying relevant features in a dataset. They can be broadly categorised into filter, wrapper, and hybrid approaches, which are explained in detail in the literature review. Filter methods use statistical techniques like correlation, mutual information, and ANOVA to rank features based on their relevance to the target variable. While computationally efficient, they may overlook important feature interactions, potentially affecting predictive accuracy [11–13]. Wrapper methods evaluate feature subsets by training a machine learning model, providing better performance but with higher computational overhead. Techniques such as recursive feature elimination (RFE) and genetic algorithms are commonly used [14,15]. Hybrid methods combine filter and wrapper approaches to balance performance and efficiency. They first use a filter to eliminate redundant features and then apply a wrapper for further refinement, offering improved scalability for large datasets [14,15]. APT attacks continuously evolve, making traditional filter or wrapper-based feature selection is ineffective for accurate detection. Filter methods analyse features independently, failing to capture essential interactions that characterise coordinated APT activities. Wrapper methods, while capable of modelling feature dependencies, suffer from high computational costs and overfitting issues, particularly in high-dimensional datasets. Given the need for adaptability, static selection techniques are insufficient. Integrated approaches such as embedded or hybrid methods offer a more dynamic and scalable solution for selecting features crucial to APT detection. This study introduces an adaptive feature selection framework utilising Mutual Information (MI), Symmetric Uncertainty (SU), and Minimum Redundancy Maximum Relevance (MRMR) for detecting APTs using the DAPT2020 dataset. Developed explicitly for APT research [16], DAPT2020 reflects real-world attack scenarios in network traffic. Our methodology ensures continuous feature evaluation and refinement to address evolving threats.
The proposed dynamic selection method leverages MI to identify both linear and non-linear relationships between features and the target variable. SU further enhances the selection process by normalising MI scores and mitigating potential biases. MRMR refines the final feature subset by maximising relevance while minimising redundancy. This adaptive methodology updates the feature importance over time, optimising APT detection as new data is integrated.
To the best of our knowledge, this is the first study employing MI, SU, and MRMR jointly for APT detection. The main contributions of this study can be summarised as follows:
• A hybrid feature selection framework integrating Mutual Information (MI), Symmetric Uncertainty (SU) and Minimum Redundancy Maximum Relevance (MRMR) was designed and developed to identify the most discriminative features for APT detection effectively.
• A dynamic feature selection methodology combining MI, SU, and MRMR was proposed to improve classification accuracy and overall detection performance across various machine learning models, including Random Forest, SVM, Gradient Boost, and Neural Networks.
• A comprehensive evaluation was conducted, comparing the proposed hybrid method with conventional feature selection techniques (e.g., correlation-based filtering). The results demonstrate its superiority in accuracy, feature relevance, and redundancy reduction for APT detection tasks.
The remainder of the paper is organised as follows. Section 2 reviews related work, Section 3 describes the proposed methodology, Section 4 presents the experimental design and evaluation of results, and Section 5 concludes the paper.
Advanced Persistent Threats (APTs) are complex, covert and relentless attacks that present considerable challenges to cybersecurity researchers. These threats necessitate advanced detection mechanisms to protect sensitive data and critical infrastructure [17]. Effective APT detection requires an accurate and efficient identification of malicious activities within high-dimensional network traffic data. Machine learning models have emerged as a promising approach, but their success is based on careful selection of relevant features. Feature selection is vital to improve the performance and efficiency of these models. This review of the literature offers a detailed analysis of current research on feature selection for APT detection. We critically evaluate various feature engineering techniques and selection algorithms to uncover the most promising strategies to enhance APT detection capabilities. In addition, we explore the unique challenges and limitations associated with feature selection in the context of APT attacks, highlighting critical research gaps and potential future directions.
2.1 Datasets for APT Detection
Machine learning models for APT detection rely heavily on comprehensive datasets that accurately reflects the multifaceted and evolving nature of these attacks. Ideally, such datasets should encompass the entire APT attack lifecycle, from initial compromise (e.g., spear-phishing, exploit kits) to data exfiltration, including command and control communication and lateral movement within the network. However, obtaining such comprehensive datasets is inherently challenging due to: (i) Data Sensitivity: APT attacks often target high-value organisations and involve sensitive data, making sharing real-world attack data difficult due to privacy and security concerns [18,19]. (ii) Attack Complexity: APTs are characterised by their complex and multi-stage nature, making capturing all the subtle indicators and behaviours associated with these attacks in a single datasets are difficult. (iii) Evolving Tactics: APT attackers continuously adapt their techniques and tools to evade detection, requiring datasets to be updated regularly to reflect the latest threats.
Researchers utilise various types of datasets for APT detection, each with its own strengths and limitations. They rely on THREE types of datasets: real, synthetic, and semi-synthetic. Each type has its strengths and limitations in capturing the complexity of APT activities. The datasets and the strengths are listed below:
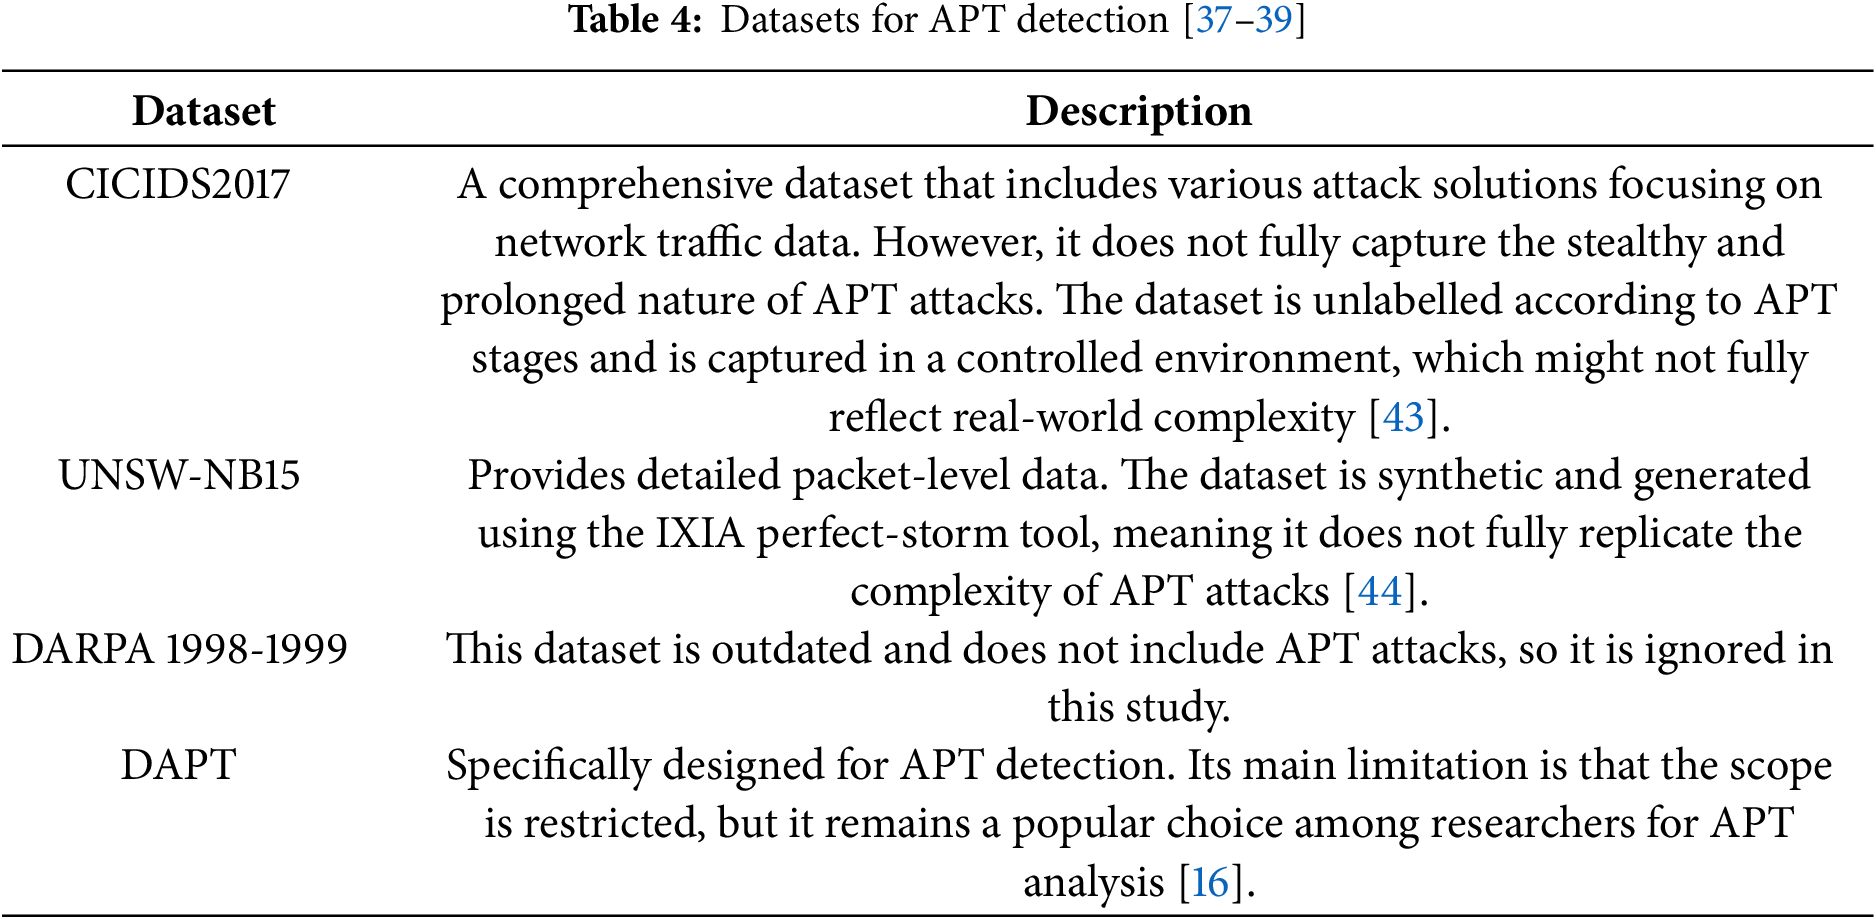
• Real Datasets: Capturing actual network traffic provides valuable insights into real-world APT behaviours. However, they are often limited in scope, may not include all stages of an attack, and are restricted due to privacy and security concerns. Examples include the CTU-13 dataset, containing labelled botnet traffic, and the LANL Cyber Dataset, capturing enterprise network traffic but lacking explicit APT labelling [20,21].
• Synthetic Datasets: Artificially generated using algorithms, these allow researchers to simulate specific attack scenarios in a controlled environment. While offering flexibility and control, they may not fully capture the complexity and variability of real-world network traffic, hindering generalisability. Examples include the DARPA 1999, CICIDS2017 and CICIDS2018 datasets, modified to simulate APT-like behaviours [22,23].
• Semi-synthetic Datasets: Combining real network traffic with simulated attack traces, these balance realism and control. They allow researchers to introduce specific APT behaviours while retaining some real-world complexity. However, achieving the right balance can be challenging. Examples include the UNSW-NB15 dataset and the APT-Sim dataset [24,25].
The limitations of existing datasets highlight the need for continued research to generate more comprehensive and representative datasets for APT detection. These should ideally capture the full spectrum of APT activities, address privacy and security concerns, and be regularly updated to reflect the evolving threat landscape.
2.2 Feature Selection: Enhancing APT Detection Models
Feature selection is crucial for building robust APT detection models as it plays a significant role in various aspects of model development. Dimensionality reduction simplifies model training, improves processing speed, and is essential for real-time analysis by reducing the number of features [6]. Improved accuracy is achieved by eliminating irrelevant or redundant features, enhancing the model’s predictive power while minimising false positives [14]. Additionally, model interpretability is enhanced when fewer features are used, making models easier to understand and interpret, which builds trust and facilitates incident response [26]. Resource optimisation is another key benefit, as feature selection reduces the amount of data that needs to be processed and analysed, improving efficiency [27]. Lastly, generalisation is improved by focusing on the most relevant features, enabling the model to better detect previously unseen APT patterns [12].
Feature selection methods are classified into filter and wrapper. Each of these method has strengths and weaknesses. The strengths and weaknesses of each of these methods are described in the following subsections.
Filter methods rank features based on statistical measures independent of any specific machine learning algorithm. These are computationally efficient and scalable but may overlook complex feature interactions. The main issues with filter-based methods are: (i) they may not capture all complex feature interactions, (ii) these methods cannot effectively identify non-linear relationships, (iii) sensitivity to noise and incomplete data, and (iv) inability to incorporate domain knowledge. A summary of filter-based feature selection methods and their drawbacks is tabulated in Table 1.

Wrapper methods evaluate different feature subsets by training and testing a specific machine learning model. This iterative approach captures feature dependencies but is computationally expensive. Description and main drawbacks of wrapper-based methods in using feature selection for APT detection are tabulated in Table 2.

Hybrid methods combine filter and wrapper approaches to balance computational efficiency and model accuracy. Many researchers have used the hybrid approach for intrusion detection systems, resulting in improved accuracy and enhanced efficiency. In the context of APTs, which are characterised by stealth, complexity, long dwell times, and a low-and-slow attack pattern, the intelligent selection of features is essential for identifying subtle anomalies. For instance, the authors in [31] combined filter methods (Information Gain and Random Forest) with a wrapper method (Recursive Feature Elimination) to enhance multi-class network anomaly detection using an MLP model. Experimental results on the UNSW-NB15 dataset [32] demonstrate that this approach reduced the number of features from 42 to 23 while improving classification accuracy from 82.25% to 84.24%. In another study, the authors in [33] created a dataset that covers the entire lifecycle of an Advanced Persistent Threat (APT) attack, and then combined correlation-based and variance-based feature selection methods to reduce the feature set to 12. By employing eXtreme Gradient Boosting for classification, they achieved an accuracy of 99.89% in APT identification. The synergy between hybrid feature selection and machine learning techniques is especially critical for detecting the nuanced patterns of APTs, which are often missed by traditional signature-based methods. The following section summarizes the challenges and open issues of current feature selection methods proposed for APT detection.
2.3 Feature Selection for APT Detection: Challenges and Gaps
Feature selection for Advanced Persistent Threat (APT) detection presents several challenges that hinder existing methods. One major limitation is the dynamic nature of APT attacks, as static feature selection techniques often fail to adapt to evolving threat behaviours, necessitating more flexible and context-aware approaches. Additionally, high-dimensional datasets pose difficulties in capturing complex, non-linear relationships between features, which are crucial for distinguishing subtle anomalies indicative of APT activity. Another critical issue is the presence of contextual dependencies; current algorithms frequently evaluate features in isolation, leading to suboptimal detection performance when interdependencies between features are ignored. Furthermore, imbalanced data remains a persistent challenge, as biased selection methods may prioritise features associated with benign network traffic while failing to highlight those indicative of attack scenarios. To address these challenges, future research should focus on improving dynamic and context-aware feature selection techniques that can evolve alongside changing attack patterns. Additionally, computational efficiency must be prioritised to ensure real-time applicability in large-scale cybersecurity environments. Methods for effectively handling imbalanced data should be explored, including oversampling, cost-sensitive learning, and anomaly detection strategies. Finally, incorporating domain knowledge into feature selection algorithms can provide security-specific insights, allowing for more accurate identification of APT characteristics and enhancing overall detection efficacy.
2.4 Challenges and Advancements in APT Feature Selection
APT detection relies heavily on effective feature selection methods to enhance model accuracy while reducing computational complexity. However, several challenges hinder the performance of existing approaches, necessitating continuous advancements in feature selection techniques. Detailed discussions of the challenges and recent advancements in APT feature selection methods are presented in the following subsections.
2.4.1 Challenges in Feature Selection for APT Detection
One significant challenge in APT feature selection is the dynamic nature of attacks. APTs evolve over time, utilising sophisticated evasion techniques to bypass traditional security measures. Static feature selection approaches fail to adapt to these evolving threats, requiring more flexible and context-aware methodologies. Another obstacle is high-dimensional data complexity. APT detection involves large volumes of network traffic logs and system events, making it difficult to identify truly informative features.
Many conventional methods struggle to capture non-linear dependencies between features, limiting their effectiveness in detecting subtle attack patterns. Additionally, contextual dependencies among features pose a challenge. Attack indicators do not exist in isolation; their significance often depends on specific environmental or behavioural factors. Traditional feature selection algorithms tend to evaluate features individually, overlooking their interactions, which are crucial for identifying coordinated attack behaviours. Finally, data imbalance is a persistent issue in APT detection. Given that attacks are rare compared to normal network traffic, classifiers may be biased toward frequent patterns, reducing sensitivity to minority-class attack instances. Feature selection methods must address this imbalance to improve detection rates without increasing false positives.
2.4.2 Advancements in Feature Selection Techniques
To address these challenges, recent advancements in feature selection focus on adaptive and hybrid methodologies that combine multiple selection criteria. One promising approach is mutual information-based feature selection, which captures both linear and nonlinear relationships between features and attack patterns. This method enhances the ability to identify relevant features while minimising redundancy. Another advancement is the use of symmetric uncertainty (SU) normalisation, which refines mutual information scores to penalize redundant features. By improving feature independence, SU enhances model robustness against dynamically shifting attack tactics. Additionally, Minimum Redundancy Maximum Relevance (MRMR) has emerged as a powerful refinement step in feature selection for APT detection. MRMR optimises the selection process by ensuring that chosen features maximize relevance while minimising redundancy, leading to more efficient classification. Future research should emphasize context-aware dynamic selection models that adjust feature importance based on evolving attack behaviours. Methods integrating domain knowledge with machine learning-driven selection strategies will be essential to improving feature relevance while maintaining computational efficiency. By adopting adaptive and integrated feature selection approaches, APT detection can be significantly improved, enabling cybersecurity systems to stay ahead of sophisticated threats in real-time environments.
This section explains the methodology for feature selection in detecting Advanced Persistent Threats (APTs). It begins by defining various attack models, particularly the kill chain model, and compares different APT detection models. The section then describes the datasets used for APT detection, evaluates the merits of each dataset, and explains the rationale for selecting the DAPT2020 dataset for detailed analysis.
The methodology includes detailed preprocessing steps such as handling missing values, applying normalisation techniques, and employing data scaling methods. Additionally, it explores the core concepts of Mutual Information and Symmetric Uncertainty, discussing their roles in feature selection and effectiveness in identifying relevant and irrelevant features. The Minimum Redundancy Maximum Relevance (mRMR) algorithm is introduced as an advanced technique to optimise feature selection by balancing relevance and redundancy.
An adaptive feature selection methodology is proposed, incorporating Mutual Information, Symmetric Uncertainty, and mRMR, with dynamic adjustments based on model performance. This adaptive approach is characterised by the following unique features:
i) Dynamic feature selection: In traditional feature selection methods, a fixed set of features is selected; in this approach, feature subsets are dynamically adjusted based on the model’s performance. This means the selected features may change in response to different attack scenarios. For APT detection, dynamically changing the feature subset will adapt to the APT attacks’ dynamic nature.
ii) Feedback loop: This approach incorporates a feedback loop where the evaluation metrics are used to refine the feature selection process. This iterative feedback mechanism allows the model to learn and adapt the specific characteristics of APT attacks.
iii) Tailored subsets: This approach allows the creation of a more tailored feature subset optimised for APT stages. This potentially leads to improved detection accuracy compared to a static feature selection method.
In essence, the novelty lies in the dynamic and feedback-driven nature of the feature selection process, which allows for a more tailored and adaptive approach to APT detection. This can improve detection accuracy and contribute to more effective cybersecurity measures against advanced persistent threats.
Attack modelling is a crucial step in designing defence mechanisms for targeted attacks. Information given in the modelling process offers hints on how to protect the network and can provide defence mechanisms for safeguarding the network [34]. Different attack models are used in cybersecurity. Most researchers use the kill chain model in APT detection or at least provide a reference [35,36]. Table 3 compares different models and explores the models’ strengths and weaknesses.

This study adapts the kill chain model [37]. The kill chain model is a military concept that provides a structured framework for understanding and mitigating cyberattacks, particularly APTs. The kill chain model breaks an APT attack into seven stages. Fig. 1 shows a diagram of the kill chain model.
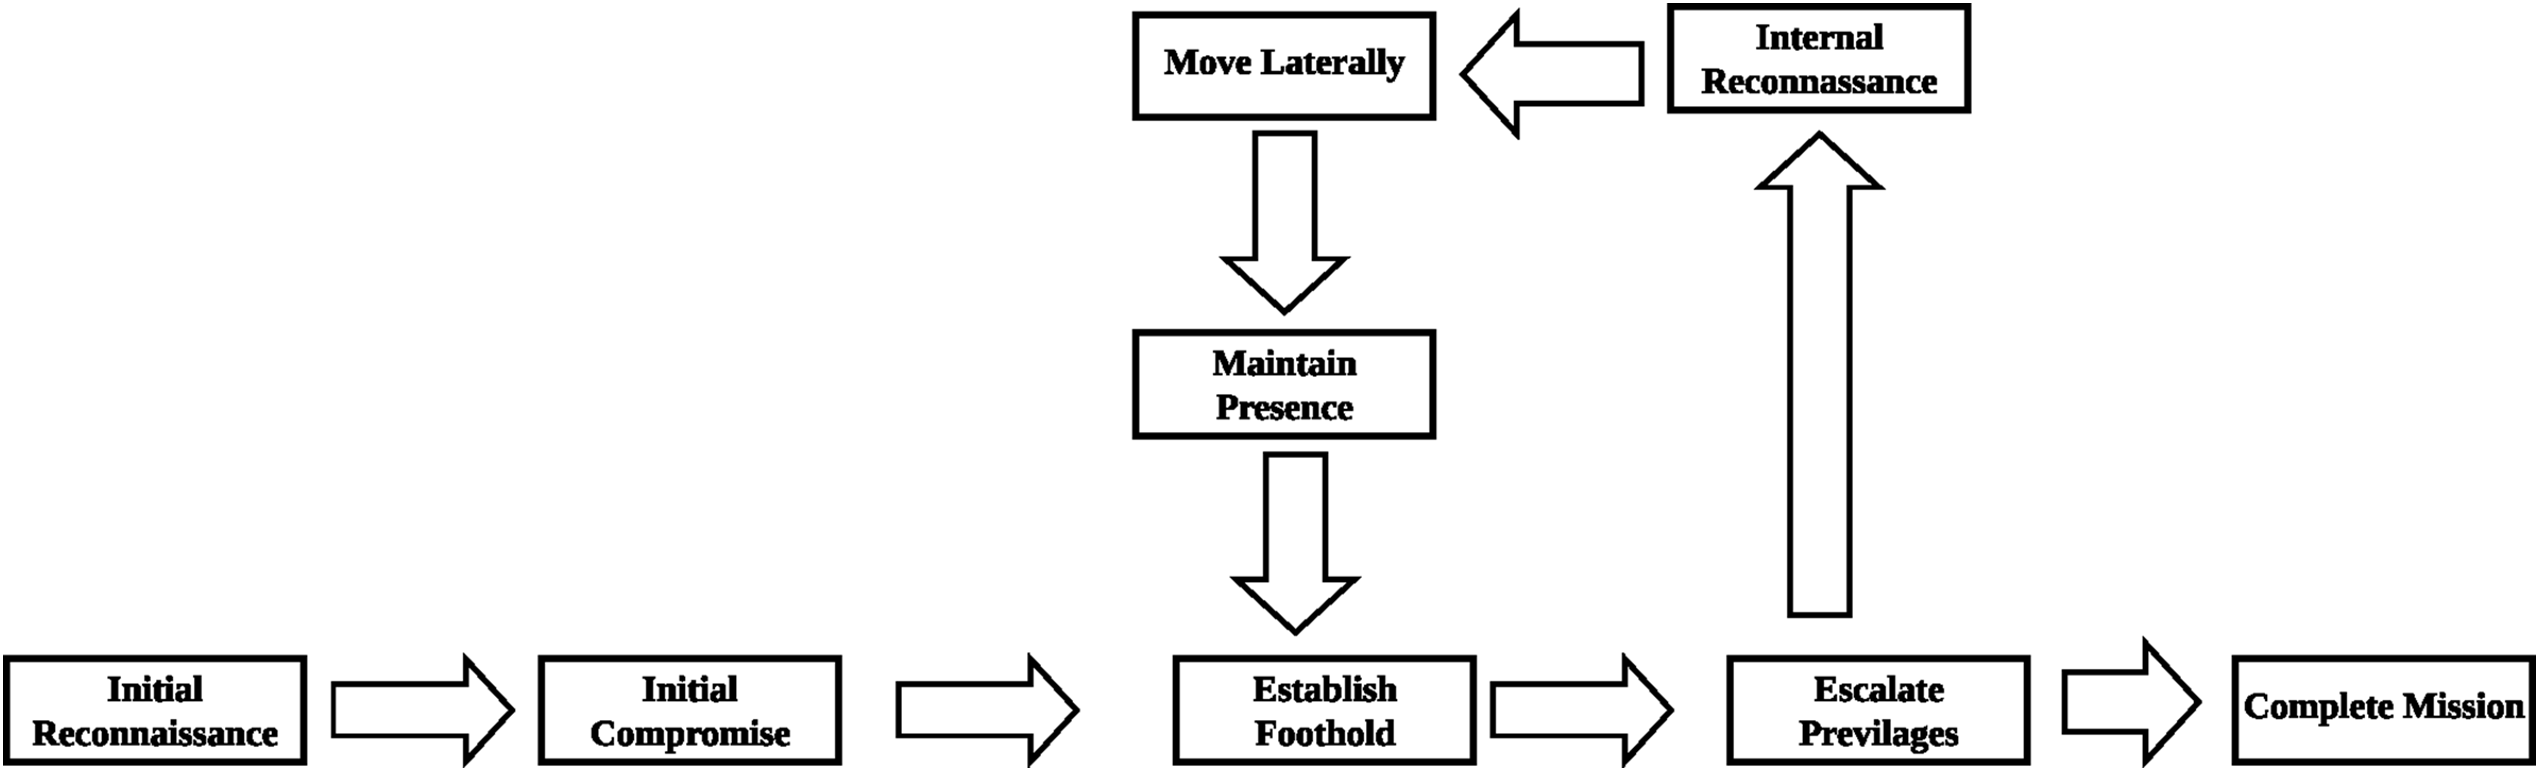
Figure 1: Cyber kill chain model
As shown in Fig. 1, the kill chain model has seven stages. The stages are as follows:
i. Reconnaissance: In this stage, the attacker gathers information about the target. The attacker will discover weak points in the network and possible entry points.
ii. Weaponisation: The attacker creates a deliverable payload, such as malware or an exploit, to use against the target.
iii. Delivery: The attacker sends the payload to the target, typically via email, web links, or infected devices.
iv. Exploitation: The payload is executed, exploiting a vulnerability in the target system.
v. Installation: Malicious software is installed on the target system, allowing the attacker to maintain access.
vi. Command and Control: The attacker establishes a communication channel with the compromised system to control it remotely.
vii. Actions on Objectives: The attacker achieves their goals, including data theft, system disruption or further lateral movement within the network.
The main reasons for using the kill chain for this study are as follows:
• Structured Understanding: The model provides a clear and concise framework for understanding an APT attack [37].
• Proactive Defence: The model breaks the attack into stages. This allows organisations to implement the defence strategy easily [16].
• Prioritisation: The model helps security teams prioritise defensive measures by identifying the most critical points in the attack chain [40].
• Communication and Collaboration: The model provides a common language for security professionals to discuss and collaborate on threat analysis and incident response. Adaptability: While originally designed for APTs, the Kill Chain model can be adapted to analyse various types of cyberattacks and inform defensive strategies.
• Linearity: The model can be too linear and may not fully capture the complexity and adaptability of modern attacks, which may not always follow a strict sequence.
• Human Element: The model may not adequately address the human element and the role of social engineering in many attacks [40].
• Emerging Threats: The model may not fully encompass the unique characteristics of attacks targeting cloud environments, IoT devices, and other emerging technologies [41].
The Kill Chain model is a widely used framework for understanding and mitigating advanced persistent threats (APTs) in cybersecurity. It offers a structured approach that helps organisations analyse attacks effectively, breaking them into distinct stages to enable proactive defense strategies [37]. By identifying critical points in the attack chain, security teams can prioritise defensive measures efficiently [40]. The model also fosters better communication and collaboration among security professionals by providing a common language for threat analysis and incident response [16]. While originally developed for APTs, it remains adaptable, allowing organisations to tailor it to various types of cyberattacks. However, despite these advantages, the model has some limitations. Its linear structure may fail to capture the complexity and adaptability of modern attacks, which do not always follow a strict sequence. Additionally, it may overlook the human element, particularly in cases involving social engineering techniques [40]. Furthermore, emerging threats, including those targeting cloud environments and IoT devices, may not be fully addressed within this framework [42]. Despite these challenges, the Kill Chain model remains a valuable tool for cybersecurity defense. By understanding its strengths and weaknesses and adapting it to the evolving threat landscape, organisations can enhance their security posture and improve their ability to detect and mitigate attacks effectively.
Developing a robust model for APT detection requires a dataset that covers all the stages of an APT attack. Datasets that can be used for APT detection consist of network traffic data, system logs, and other related metadata that can capture all the activities of both benign and malicious actors. The datasets often contain detailed features such as IP addresses, port numbers, protocols, timestamps, payload sizes, flags, and labelled instances identifying different stages or types of attacks. The data sets reviewed along with a description of the datasets are tabulated in Table 4.
Several datasets were reviewed in this study. Most of them are relevant to APT detection; however, many include only a few stages of the APT lifecycle, or none at all. Table 5 summarizes the stages of attack represented in the datasets used.
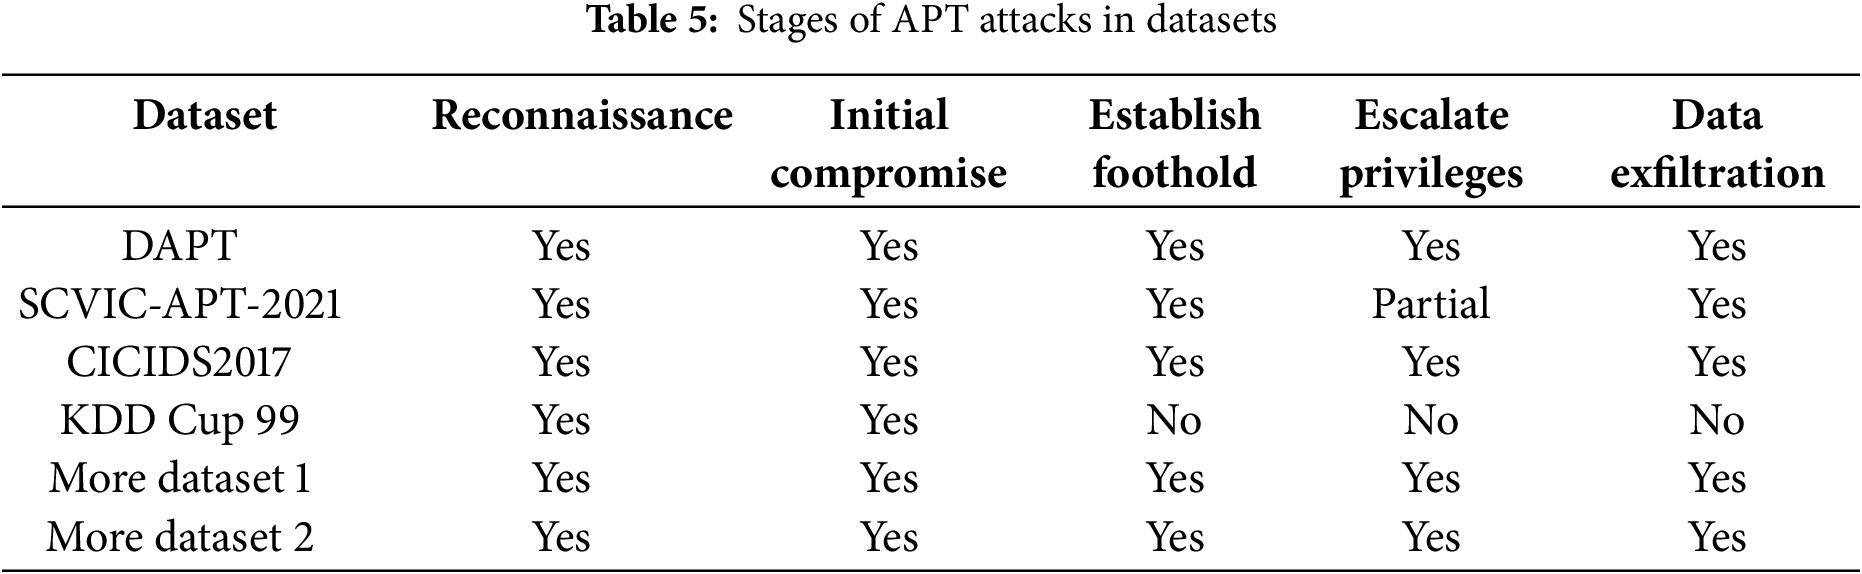
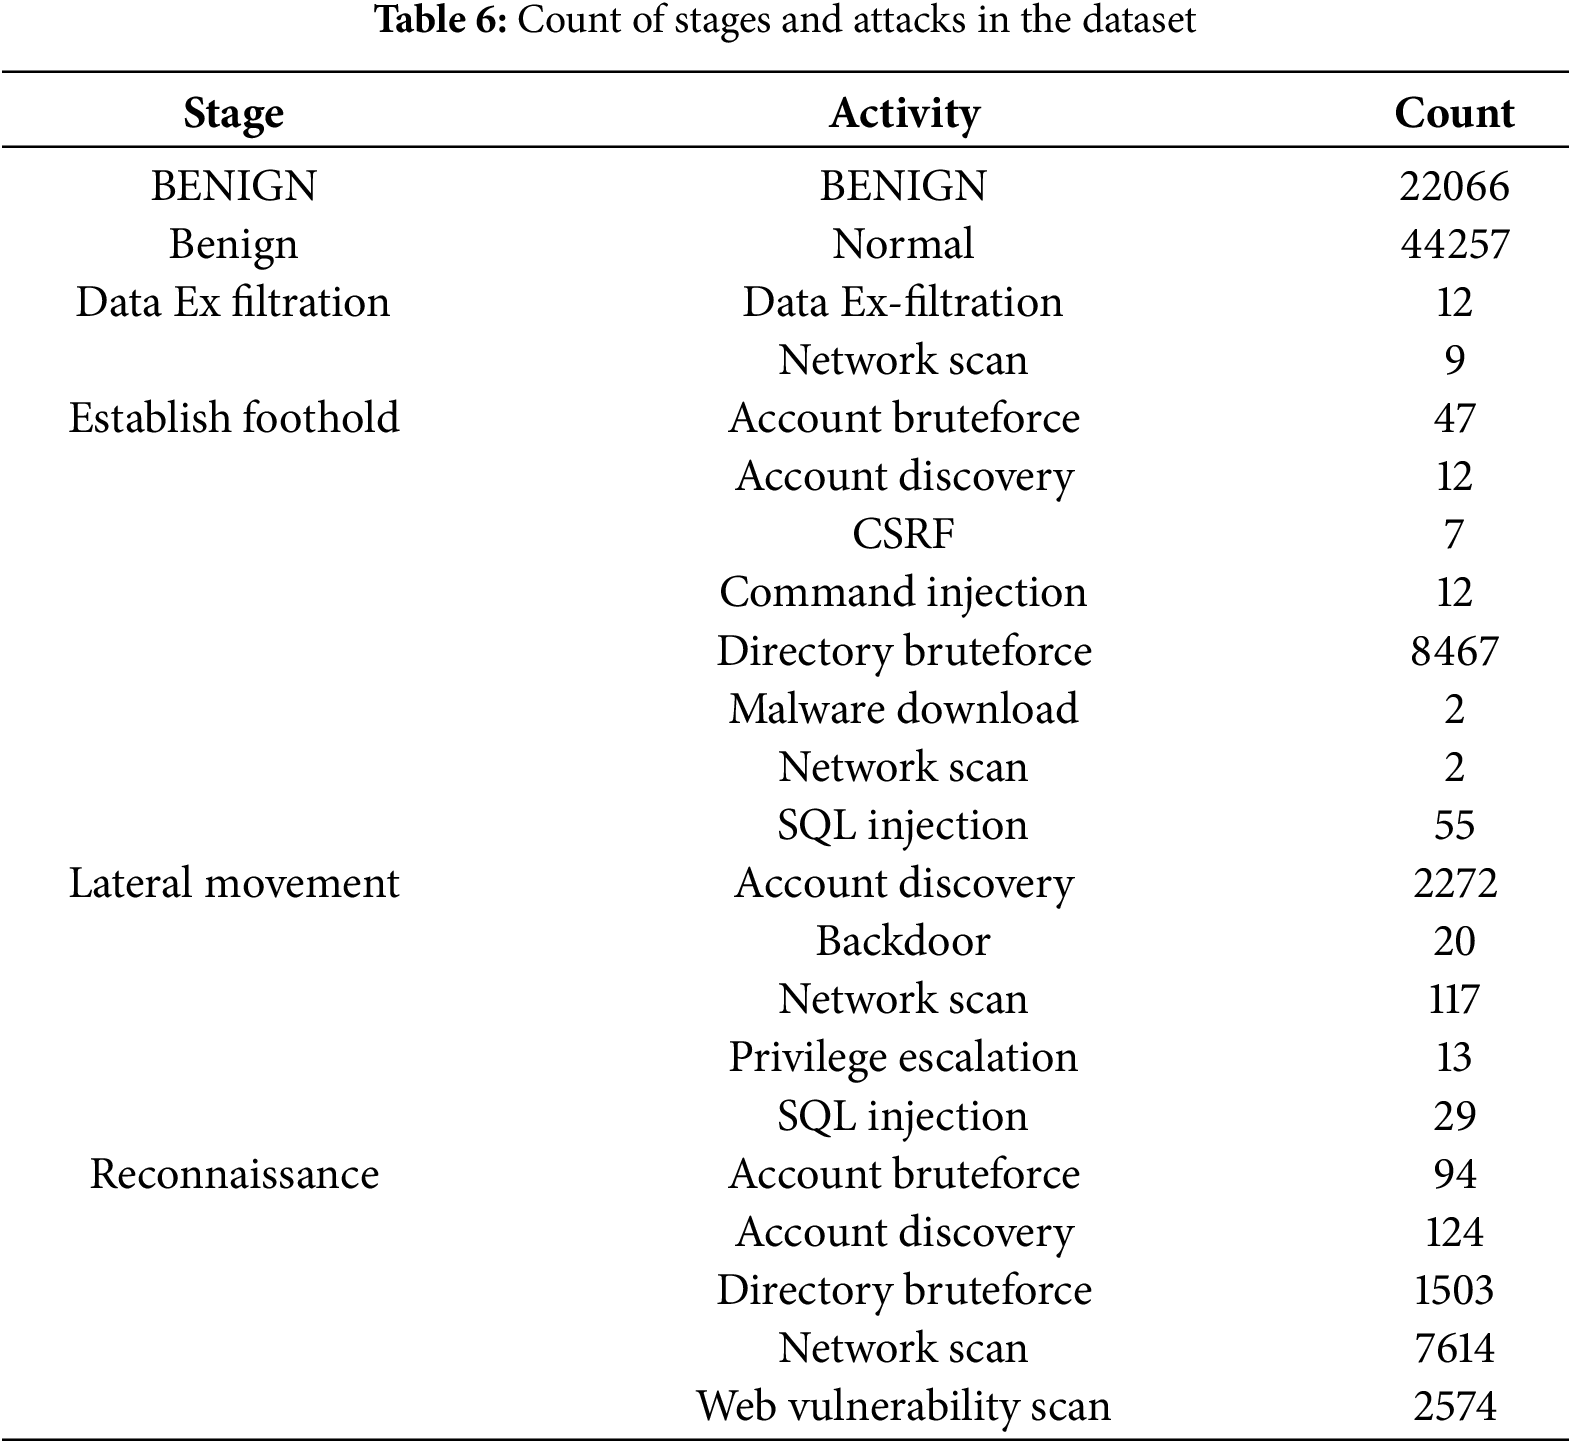
The DAPT2020 dataset is a five-day collection of network logs designed for advanced persistent threat (APT) detection, capturing key attack lifecycle stages such as reconnaissance, foothold establishment, lateral movement, and data exfiltration [16]. Unlike datasets like KDD Cup 99 [32] and UNSW-NB15 [44], which focus on individual attack instances, DAPT2020 provides a realistic, multi-stage representation of APT campaigns [40]. It includes internal and external network traffic [23] and accounts for real-world class imbalance, ensuring robust model training without overfitting [10]. Additionally, the dataset features simulated stealth attack traffic, detailed records of attack techniques like brute-force attempts and malware distribution, and a structured temporal progression for dynamic analysis of evolving threats [45]. These characteristics make DAPT2020 a highly suitable dataset for developing effective APT detection models and addressing the limitations of conventional cybersecurity datasets. This dataset covers all the stages in our APT attack life cycle model: Reconnaissance, Establishing a foothold, Lateral Movement, and Data Exfiltration. A count of the attacks in the dataset and Activities for that Attack Stage are tabulated in Table 6.
The dataset was first examined for missing values using the isnull() function in Python. No missing values were found, so no imputation was necessary. Normalisation was then performed to ensure that all features operate on a comparable scale, which is essential for many machine learning algorithms. Proper normalisation can help the model converge more quickly during training and can improve overall performance. For this study, min-max normalisation was applied. This technique scales all feature values to a fixed range, typically between 0 and 1, using the following Formula (1):
where X is the original value,
Min-max scaling techniques ensure consistent feature ranges and improve the accuracy of mutual information and symmetric uncertainty calculations [46].
Mutual information is a statistical measure that quantifies the amount of information a feature has concerning the target variable. In feature selection, mutual information identifies the most informative features in predicting a target variable. Mutual information identifies features strongly correlated with the target [47,48]. Mutual information is based on entropy. Entropy is a measure of uncertainty or randomness in a dataset. It quantifies the amount of information contained in the other. Mutual Information is calculated as follows:
where
Joint entropy quantifies the total uncertainty in both variables X and
Finally, mutual information measures the reduction in uncertainty about X provided by knowledge of Y, expressed as:
This formulation enables the quantification of the dependency between two variables.
Mutual information calculates the dependency between the feature and the target variable. Mutual information does not account for the redundancy between features themselves [49]. Mutual information also has the problem of bias towards features with high marginal entropies. This means features with high levels of uncertainty, even if they have little relevance to the target variable, can be ranked high based on mutual information. We must address the dependency issue to set accurate features for an attack like APT. Symmetric uncertainty can cater to this dependency. This is done by normalising the values. Symmetric uncertainty is calculated as follows [50].
3.6 Minimum Redundancy Maximum Relevance
Mutual information and Symmetric uncertainty identify features’ relevance with the target variable. These two algorithms do not account for the redundancy among the selected features. To determine optimal features for an attack like APT, accounting for redundancy is crucial [6]. MRMR is an algorithm that ensures the selected features are not only relevant but also minimally redundant with other [51]. This helps in selecting a feature set where each feature contributes unique information, avoiding the pitfalls of choosing multiple features that essentially provide the same information [51]. The Minimum Redundancy Maximum Relevance (mRMR) algorithm aims to select a subset of features that maximises their relevance to the target variable while minimising redundancy among the selected features.
1. Calculate the relevance of each feature to the target variable. This is the mutual information between the feature and the target variable. The relevance of a feature to the target variable is typically measured using Mutual Information (MI). Let S be the set of selected features, and
where
2. The redundancy of a feature
where
3. Apply the MRMR objective function. The goal of MRMR is to maximize relevance while minimising redundancy. This can be expressed as an optimisation problem:
Alternatively, this can be written as:
This formulation selects features highly relevant to the target and has minimal redundancy with the already selected features.
To design the feature selection based on an adaptive methodology, the following are the steps followed:
1. Preprocess the data. In this process, we will clean the dataset, treat missing values, treat all objects, and normalize the dataset.
2. Calculate the mutual information score between the target variable and the feature.
3. Rank features based on mutual information scores.
4. Select the top features.
5. Compute Symmetric Uncertainty between all the pairs of features. SU normalises the MI values and penalizes the redundant features.
6. Remove redundant features. Redundant features can be obtained by finding the SU scores, and if the score exceeds a certain threshold, remove the lower MI score.
7. Further refinement using MRMR. Apply the MRMR method to refine the subset of features further. MRMR selects features that maximize relevance and minimize redundancy.
8. Dynamic adjustment based on performance. Monitor the model’s performance after selection. Calculate the F1 score, recall, and detection rate. Based on this, adjust thresholds for MI SU to refine the feature subset dynamically.
The model is evaluated and tested for accuracy via cross-validation, a robust technique used to assess the performance and generalisability of machine learning models. Cross-validation involves partitioning the machine learning dataset into subsets, training the model on the subsets and the training set, then validating the model using the remaining subset. This process is repeated multiple times, and the results are averaged to give the final results.
In this study, the k-fold cross-validation with k = 10 was used. The 10-fold cross-validation divides the dataset into 10 equally sized folds. The model is trained on nine folds and validated on the remaining fold. The model is trained 10 times with each iteration serving as validation [52]. The following machine learning classifiers were trained for evaluation:
The following classifiers were used in this study:
• Random forest This is an ensemble learning model that constructs multiple decision trees during training and outputs the mode of the classes for classification tasks. It can handle imbalanced datasets by using the class_weight-‘balanced’ parameter [53].
• Support vector machine SVM is a supervised learning algorithm that tries to find a hyperplane that best separates the classes in the feature space. It is effective in high-dimensional spaces and is versatile due to the use of different kernel functions [54].
• Decision trees is a non-parametric learning algorithm used in classification and regression. It splits the data into subsets based on the value of input features [55].
• Neural networks consist of interconnected layers of nodes that process input data to learn complex patterns and representations [56].
Four evaluation metrics were used to evaluate the proposed model. The detailed description of these metrics are as follows.
1. Accuracy is the ratio of correctly predicted instances to the total cases. It is a straightforward metric but can be misleading for imbalanced datasets.
2. Precision is the ratio of correctly predicted positive observations to the total predicted positives. It is crucial when the cost of false positives is high.
3. Recall (or Sensitivity) is the ratio of correctly predicted positive observations to all observations in the actual class. It is essential when the cost of false negatives is high.
4. The F1 Score is the harmonic mean of precision and recall, balancing the two metrics.
Feature selection is a crucial step in machine learning and data analysis, particularly for complex problems such as Advanced Persistent Threat (APT) detection. It reduces dimensionality, enhances model interpretability, and improves classification performance. In this study, we propose an experimental design for feature selection using Mutual Information (MI), Symmetric Uncertainty (SU), and Minimum Redundancy Maximum Relevance (MRMR).
Data preprocessing is crucial for machine learning tasks, as it ensures the dataset is clean and suitable for training. Data preprocessing involves handling missing values, encoding categorical values, scaling features, and addressing class imbalances. By examining the dataset closely, we observed that Flow ID contains the same information as Src IP, dst IP, src port, and dst port. Flow ID is removed from the dataset. For categorical features, the dataset includes Src IP, Dst IP, Activity, and Stage. The Src IP and Dst IP addresses have IPv4 and IPv6 addresses. All the IP addresses are converted to numbers using Python’s ipaddress module. The Activity and Stage columns were encoded using the LabelEncoder method from the scikit-learn library.
4.1.1 Mutual Information Features Scoring
Mutual Information is a concept introduced by Claude E Shanon in 1948 [57]. Mutual information quantifies the amount of information one variable has towards the other variable. In our research, we used mutual information to quantify the amount of information a feature has about the target variable. MI also assesses the dependency between the feature and the target feature. It can capture both linear and non-linear relationships. Mutual information is obtained as follows. Fig. 2 shows the top MI scores.
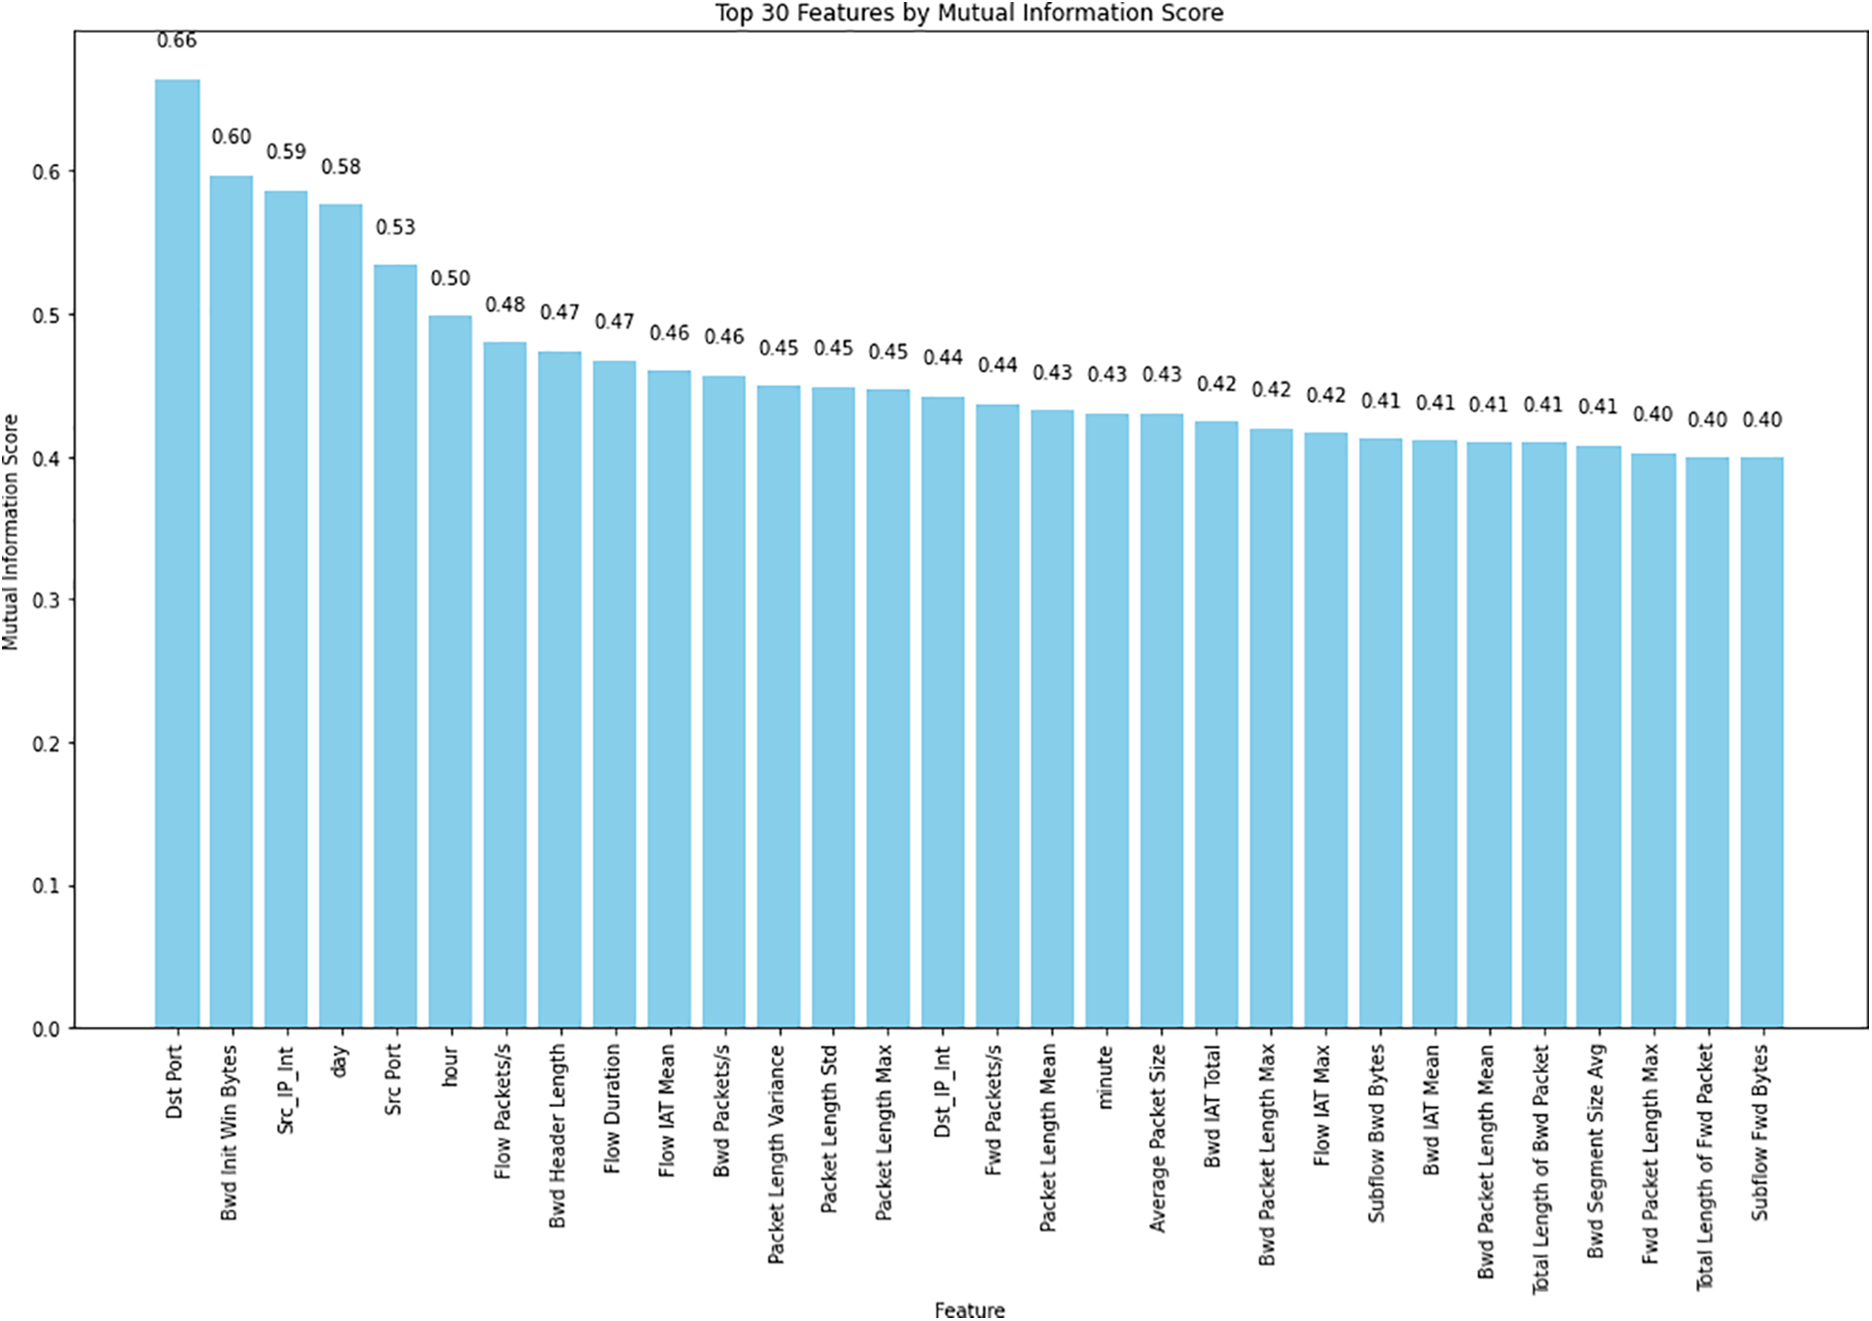
Figure 2: MI scores for the top 30 features
4.1.2 Adaptive Mutual Information Feature Selection
Traditional methods use fixed thresholds for feature selection. Fixed thresholds may not adapt well to varying distributions, such as in APT attacks. An adaptive thresholding technique needs to be used. In adaptive thresholding, the thresholds are adjusted based on statistical properties of the MI scores [58]. Algorithm 1 shows how the thresholds are adapted.

Mutual Information (MI) has several limitations that can impact its effectiveness in feature selection. One major drawback is that MI values are not normalized, meaning the scores can vary significantly depending on the scale of the variables. This variability makes it difficult to compare feature importance or establish a consistent threshold for selection. To address this issue, we incorporate Symmetric Uncertainty (SU), which normalises MI values and provides a more standardized measure of feature relevance. Additionally, MI exhibits a bias towards features with a larger number of unique values, often overestimating their importance. This bias, as illustrated in Fig. 3, can lead to the selection of features that may not genuinely contribute to predictive performance. By applying SU, we mitigate this bias by normalising feature values, ensuring a fairer comparison among features and improving the robustness of the selection process. Fig. 3, which shows the mutual information scores vs. cardinality of the scores, indicates that features with more unique values have high cardinality scores. From the graph, features with more than 10,000 unique values generally show higher MI scores above 0.3, with some reaching as high as 0.6. This indicates that there is bias in MI scores for features with more unique values. For feature selection for APT attacks this bias will lead to inaccuracy and increase false positives. Symmetric uncertainty has also been used in this study to address the bias and redundancy present in mutual information.
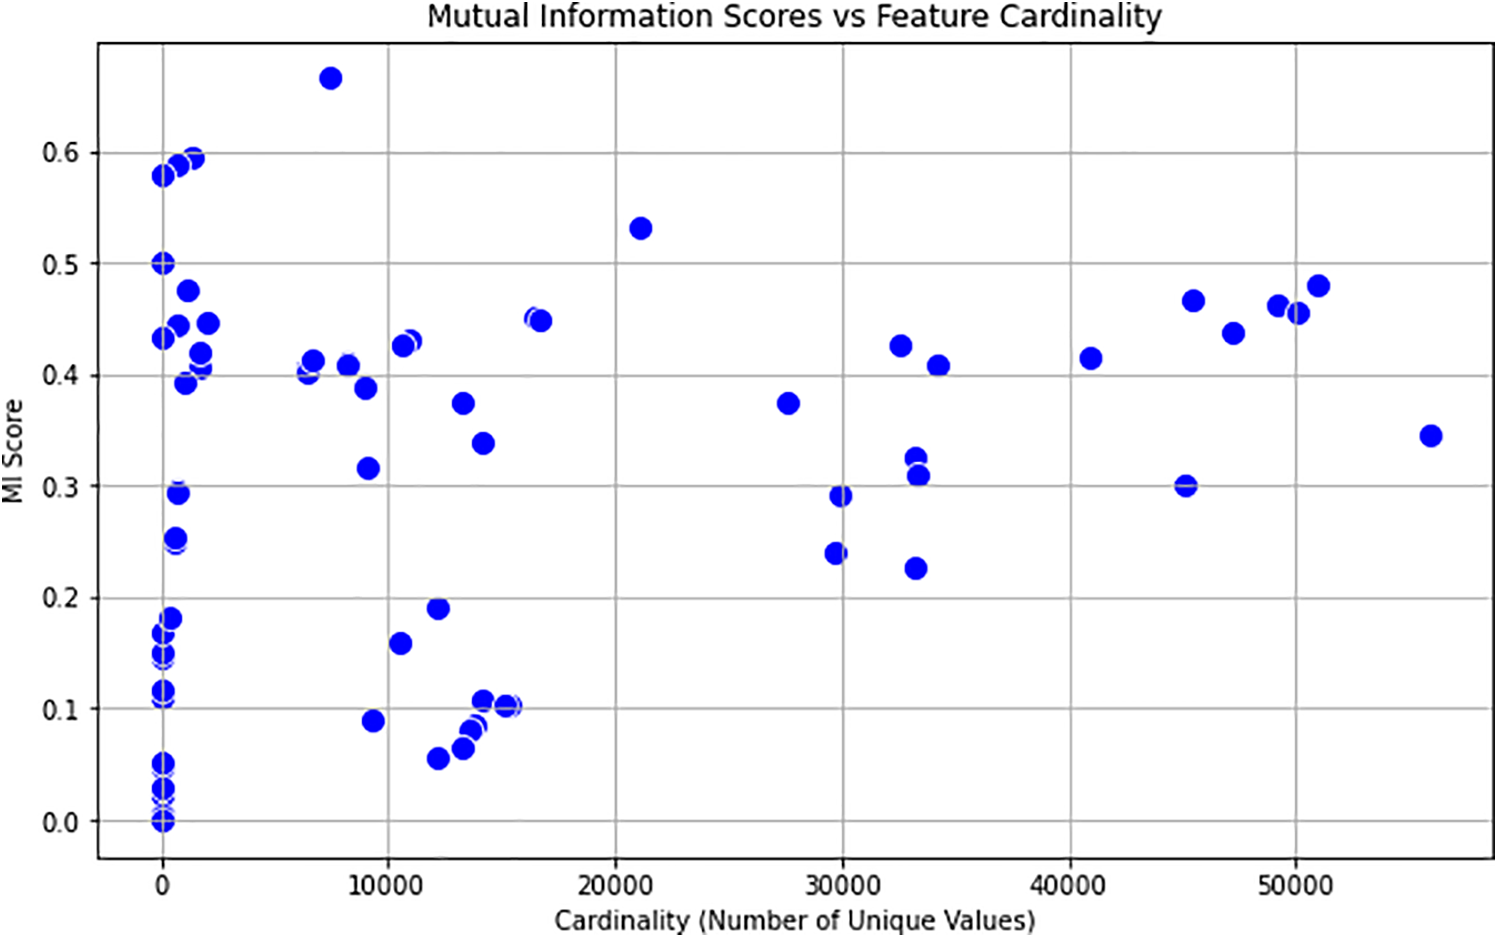
Figure 3: Mutual information correlation Scores
Symmetric uncertainty is a normalized measure that quantifies the dependency between two variables. As we have seen earlier, MI scores are biased towards features with more values, so Symmetric uncertainty can address this problem. This is done by normalising the mutual information scores, which makes them a more balanced metric for feature selection. Normalized SU scores are between 0 and 1. Using SU helps identify the most relevant features for predictive modelling, improving model performance and interpretability. Fig. 4 shows the top 20 features based on the symmetric uncertainty scores for the data. In this study, SU scores are also dynamic.
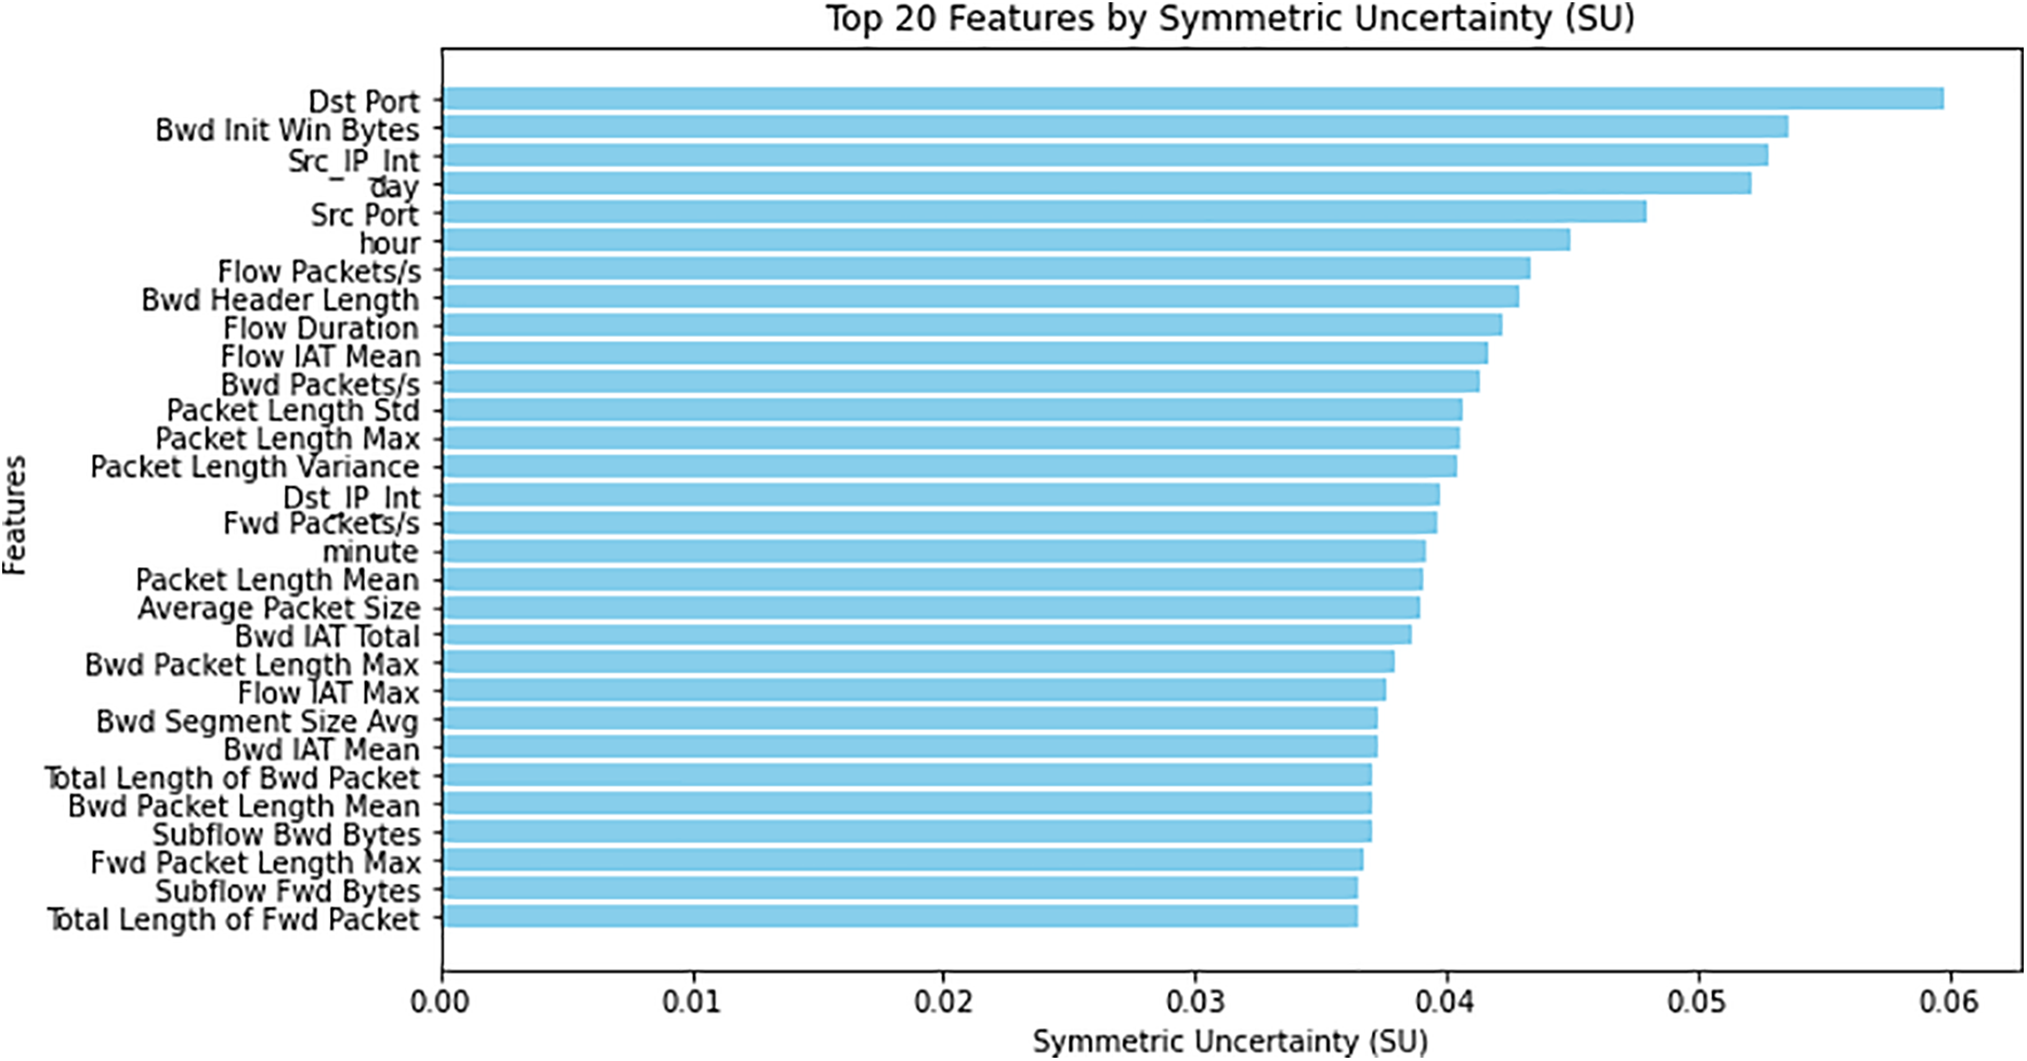
Figure 4: Symetric uncertainty scores
The main purpose of calculating the Symmetric uncertainty is to reduce bias in handling features with more values. Symmetric uncertainty is a method that quantifies the relevance of a feature to the target variable. Symmetric uncertainty is used to cater to the issues in mutual information. Symmetric uncertainty is obtained using Eq. (6). Fig. 5 compares the MI and SU scores for the various features. It shows that MI scores exhibit significant variability across features, with some reaching values close to 1.0 while others remain low. This indicates that MI captures strong associations between specific features and the target, but it also introduces bias, as MI tends to favour features with high direct dependencies. Importantly, MI does not account for feature redundancy, meaning highly correlated features can receive high MI scores, even if they do not contribute unique information.
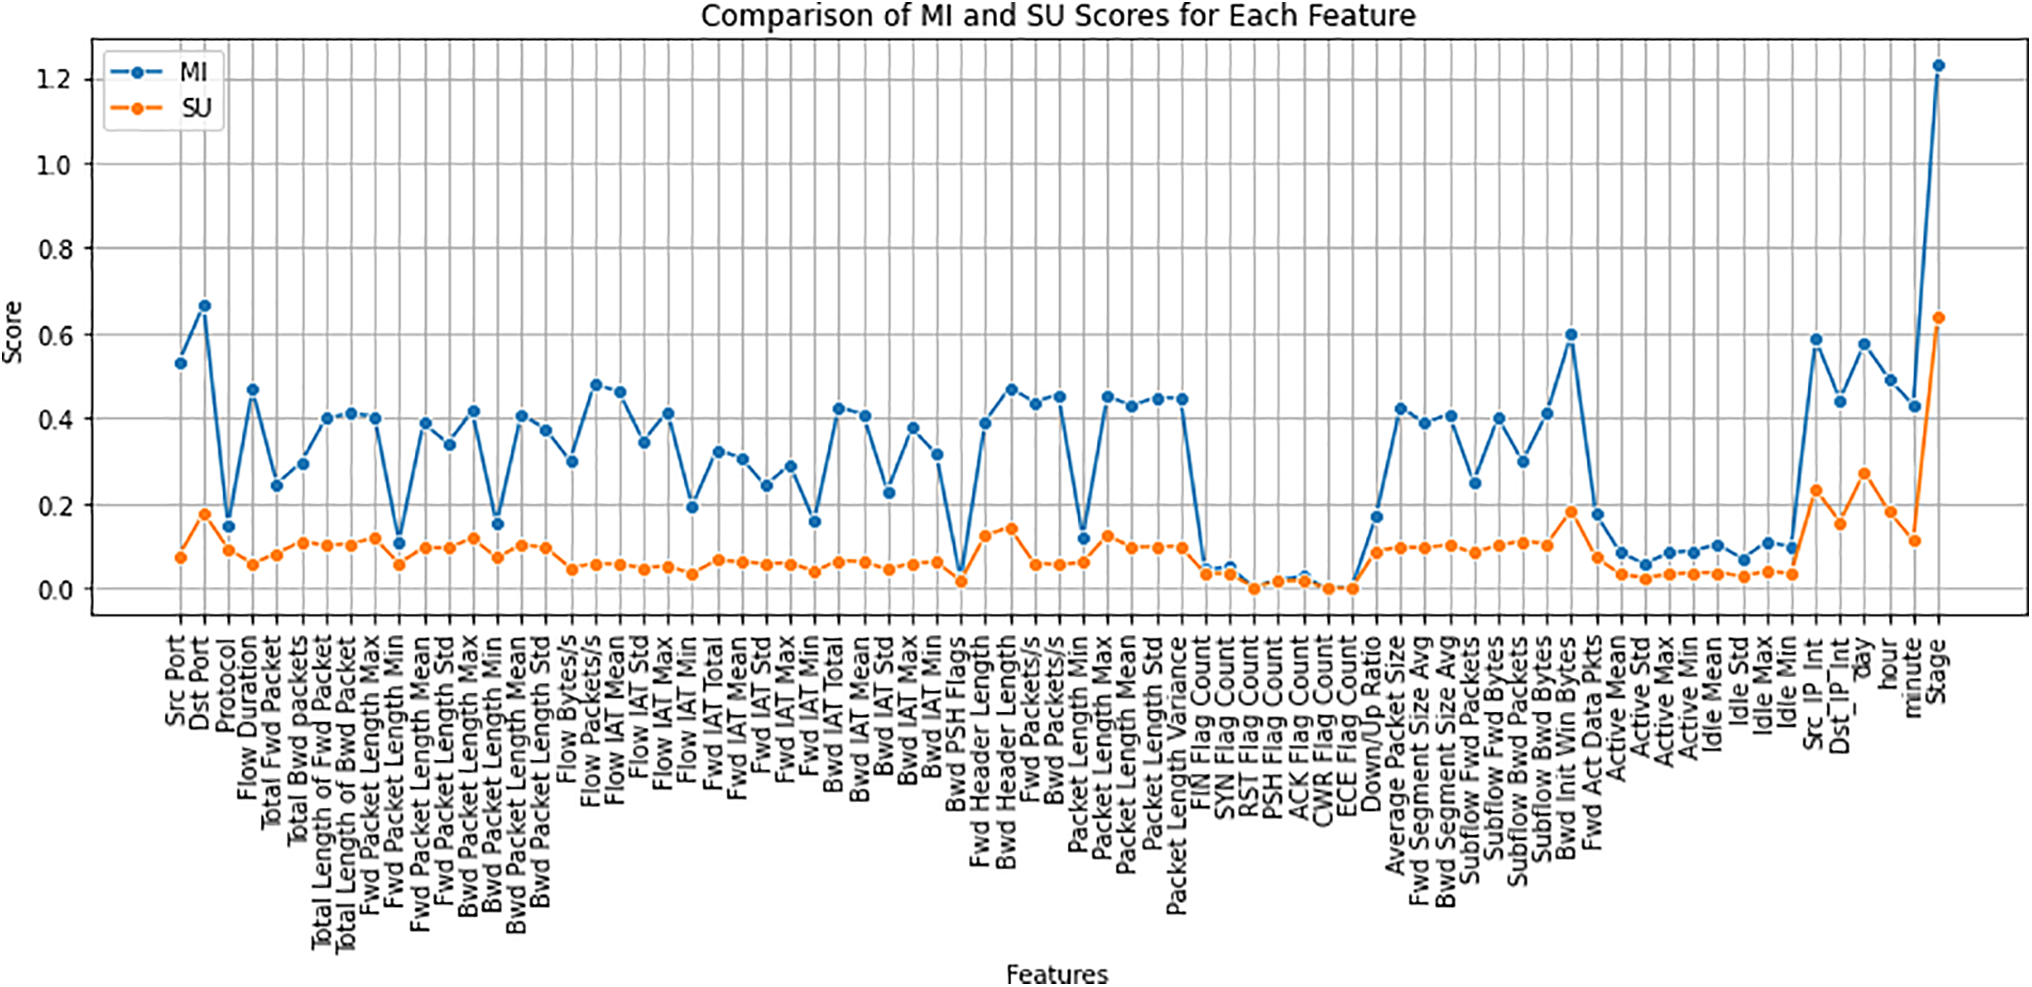
Figure 5: Comparison of MI and Su scores
In contrast, SU scores are more consistent and generally lower, staying within a range of 0.0 to 0.4. This reflects SU’s role in reducing bias by normalising the MI scores, considering both the entropy of the feature and the target. The smoother distribution of SU scores across features suggests that SU effectively addresses redundancy, penalizing highly correlated features. Features with high MI but much lower SU scores highlight instances where redundancy is being corrected, as SU down-weights these features to reduce the influence of redundant information.
4.3 Minimum Redundancy Maximum Relevance
Minimum Redundancy Maximum Relevance (MRMR) is used to balance between relevance and redundancy. This algorithm ensures that the selected features are highly relevant to the target variable and that redundancy is minimized. This algorithm ensures that the selected features are highly relevant to the target variable and minimises redundancy. It does this by balancing the mutual information of a feature with the target, penalizing highly correlated features. Thus, MRMR is used to handle redundancy and bias. Fig. 6 shows a comparison of the unique features selected by the combination of MI and SU before and after applying the MRMR algorithm. It illustrates how MRMR helps refine the initial feature set by eliminating redundancy while maintaining relevance. Fig. 7 shows the top 20 features selected by the algorithm.

Figure 6: Unique value comparison between MI+SU and MRMR
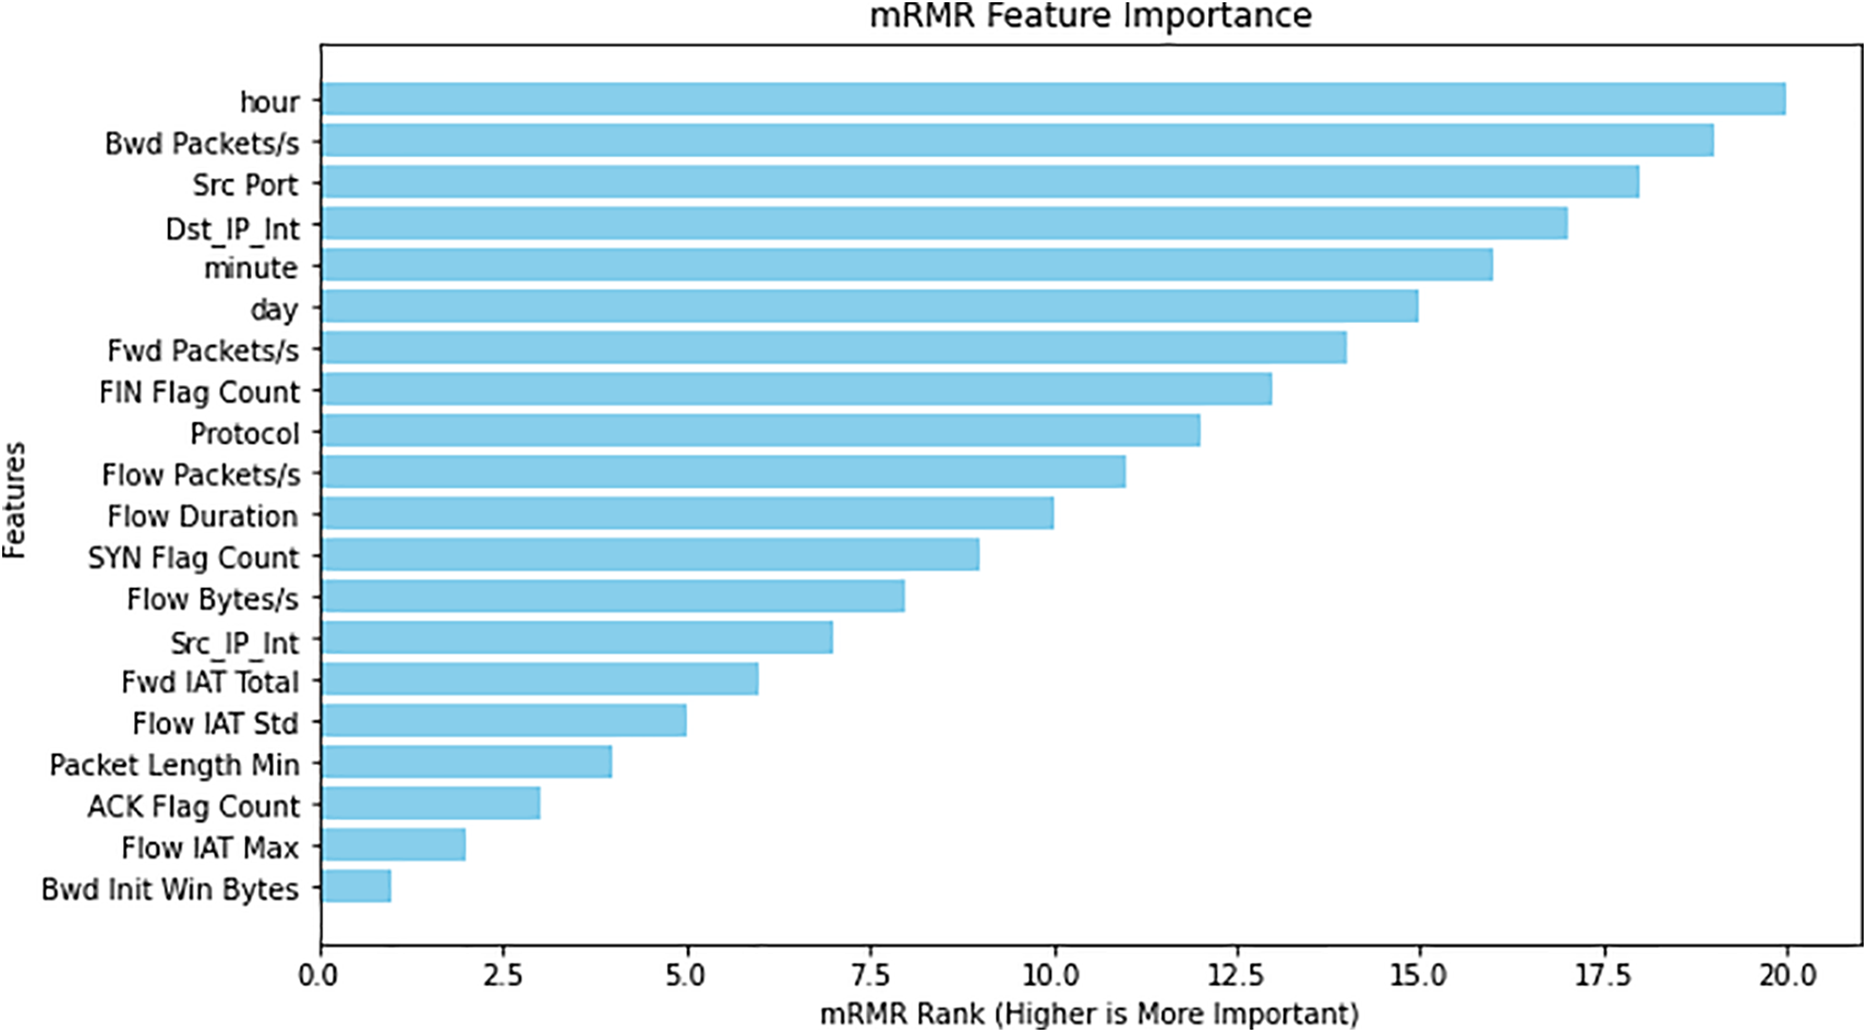
Figure 7: MRMR scores
The heatmap in Fig. 8 shows the features correlation after using the MRMR algorithm. From the Fig. 8, the colour bars on the right show the range of correlation values. Red cells represent high correlations closer to 1, indicating redundancy. Blue cells represent low correlations, indicating less redundancy. The diagonal elements (all 1s) are the self-correlations of each feature, which are expected to be one since each feature is perfectly correlated with itself. The main observations from the graph are as follows:
• Bwd Packets/s and Flow Packets/s have a high correlation (0.95). This suggests that both features provide similar information, which could introduce redundancy.
• FIN Flag Count and Fwd Packets/s have a moderate correlation of 0.52, indicating some overlap in the information they provide but not as much redundancy as the previous pair.
• Other feature pairs, like an hour and Src Port, Dst IP_Int, and Protocol, show shallow correlation values, indicating they provide independent and complementary information to the model.

Figure 8: Correlation matrix
The evaluation of the results was conducted using the key metrics in machine learning. The performance of the classifiers was evaluated using cross-validation to avoid overfitting and ensure the results represent the model’s ability to generalize unseen data. After feature selection, we have evaluated the model, and the results are summarised in Table 7.
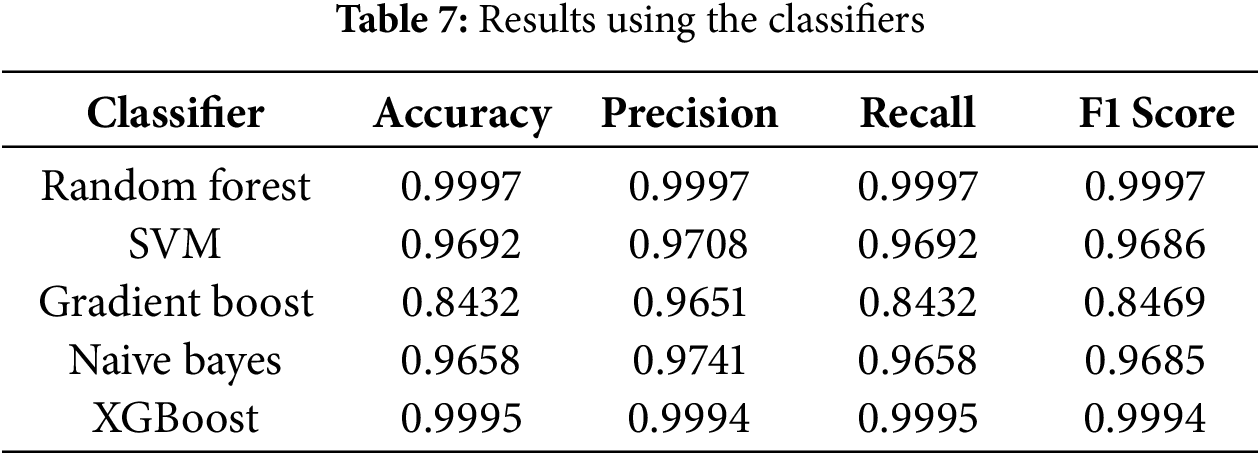
From Table 7, the highest performance is for the Random Forest model, with an accuracy, precision and recall scores of 0.9997. The results show that the Random Forest classifier is highly effective in detecting APT attacks. Its strong performance may be attributed to its ensemble nature, which helps reduce overfitting and enhances generalisation. This is particularly beneficial for APT detection, where patterns can be subtle and dispersed across multiple features, requiring robust generalisation. The SVM model also performed well, with scores indicating its effectiveness in distinguishing between classes. SVMs are particularly suited for high-dimensional spaces and can effectively separate non-linear boundaries using kernel functions—capabilities that are advantageous when classifying nuanced behaviours typical of APTs. The Gradient Boosting algorithm showed lower overall accuracy. While it achieved a high precision score of 0.9651, indicating it is effective at identifying true positives, it struggled with recall (0.8432), leading to an F1 score of 0.8469, which reflects the imbalance between precision and recall. That is it missed a number of APT instances. The F1 score of 0.8469 reflects this balance between precision and recall. This could be due to the model’s sensitivity to noise or overfitting during the boosting process, especially when APT behaviours are rare or imbalanced in the dataset. The resulting F1 score of 0.8469 reflects this imbalance between precision and recall. Naive Bayes achieved a comparable performance, with an F1 score of 0.9685. Despite its simplicity and strong assumptions about feature independence, it performs surprisingly well on some cybersecurity datasets where the probabilistic relationships between features are relatively stable. XGBoost also demonstrated strong performance, outperforming all other classifiers except Random Forest. XGBoost’s ability to handle sparse data, regularization, and efficient handling of imbalanced datasets makes it a strong contender in APT detection scenarios. However, Random Forest ultimately delivered the best overall performance, likely due to its robustness to noise and capability to capture complex interactions between features without overfitting.
In this study, we have developed a novel feature selection method that combines mutual information, symmetric uncertainty and Minimum Redundancy Maximum Relevance. Through a series of experiments and analysis we have demonstrated that each of these methods contribute to the feature selection process. However, when used individually, each method exhibits limitations. To address these limitations, we have integrated mutual information, symmetric uncertainty, and MRMR to form a hybrid approach for feature selection. By normalising the values obtained by mutual information and then using MRMR, we were able to mitigate some of the biases and inefficiencies inherent in the individual methods. To detect APT, we employed an adaptive feature selection process for the sliding window. This adaptive process continuously updates the feature selection process. This adaptive process has demonstrated accuracy and robustness in detecting APT attack features. Results showed that the hybrid approach consistently outperformed the standalone methods in terms of classification accuracy, feature reduction efficiency, and computation time. The Random Forest classifier, coupled with the selected features, achieved high performance, as evidenced by ROC curves and confusion matrices. Additionally, the sliding window strategy proved effective in adapting to short-term fluctuations in data, thereby improving the system’s ability to detect emerging threats. The proposed hybrid feature selection method shows significant promise in enhancing APT detection. By balancing relevance, redundancy, and adaptability, this approach provides a more comprehensive and effective solution for identifying the most relevant features in complex cybersecurity datasets. Future work could focus on further refining the adaptive feature selection mechanism and exploring its applicability to other domains of threat detection.
Acknowledgement: The authors express their sincere gratitude to their respective universities for their invaluable support and resources that contributed significantly to the successful completion of this work. The authors would like to acknowledge the Universiti Teknologi Malaysia for supporting this study under the UTM RA ICONIC Grant (Q.J130000.4351.09G61).
Funding Statement: This research was funded by Universiti Teknologi Malaysia under the UTM RA ICONIC Grant (Q.J130000.4351.09G61).
Author Contributions: The authors confirm their contribution to the paper as follows: Conceptualization, Adam Khalid, Anazida Zainal, Bander Ali Saleh Al-rimy and Fuad A. Ghaleb; methodology, Adam Khalid and Anazida Zainal; software, Bander Ali Saleh Al-rimy, Yussuf Ahmed and Fuad A. Ghaleb; validation, Adam Khalid, Anazida Zainal, Bander Ali Saleh Al-rimy, Fuad A. Ghaleb and Yussuf Ahmed; formal analysis, Adam Khalid, Anazida Zainal, Fuad A. Ghaleb and Yussuf Ahmed; resources, Anazida Zainal and Yussuf Ahmed; data curation, Adam Khalid and Anazida Zainal; writing—original draft preparation, Adam Khalid; writing—review and editing, Anazida Zainal, Fuad A. Ghaleb and Yussuf Ahmed; visualization, Adam Khalid and Yussuf Ahmed; supervision, Anazida Zainal and Fuad A. Ghaleb; project administration, Anazida Zainal and Yussuf Ahmed; funding acquisition, Yussuf Ahmed. All authors reviewed the results and approved the final version of the manuscript.
Availability of Data and Materials: The data that support the findings of this study are openly available in [Kaggle] at [https://www.kaggle.com/datasets/sowmyamyneni/dapt2020] (accessed on 24 June 2025).
Ethics Approval: Not applicable.
Conflicts of Interest: The authors declare no conflicts of interest to report regarding the present study.
References
1. Sharif MHU, Mohammed MA. A literature review of financial losses statistics for cyber security and future trend. World J Adv Res Rev. 2022;15(1):138–56. doi:10.30574/wjarr.2022.15.1.0573. [Google Scholar] [CrossRef]
2. Rathore P, Basak A, Nistala SH, Runkana V. Untargeted, targeted and universal adversarial attacks and defenses on time series. In: 2020 International Joint Conference on Neural Networks (IJCNN); 2020 Jul 19–24; Glasgow, UK . p. 1–8. [Google Scholar]
3. Yu Z, Gao H, Cong X, Wu N, Song HH. A survey on cyber-physical systems security. IEEE Internet Things J. 2023;10(24):21670–86. doi:10.1109/jiot.2023.3289625. [Google Scholar] [CrossRef]
4. Singh S, Sharma PK, Moon SY, Moon D, Park JH. A comprehensive study on APT attacks and countermeasures for future networks and communications: challenges and solutions. J Supercomput. 2016;75(8):4543–74. doi:10.1007/s11227-016-1850-4. [Google Scholar] [CrossRef]
5. Mohamed NA, Jantan A, Abiodun OI. An improved behaviour specification to stop advanced persistent threat on governments and organizations network. In: Proceedings of the International MultiConference of Engineers and Computer Scientists, IMECS 2018; 2018 Mar 14–16; Hong Kong, China. [Google Scholar]
6. Lyu Y, Feng Y, Sakurai K. A survey on feature selection techniques based on filtering methods for cyber attack detection. Information. 2023;14(3):191. doi:10.3390/info14030191. [Google Scholar] [CrossRef]
7. Chandola V, Banerjee A. Anomaly detection: a survey. ACM Comput Surv. 2009;41(3):1–58. doi:10.1145/1541880.1541882. [Google Scholar] [CrossRef]
8. Rajendran RM, Vyas B. Detecting APT using machine learning: comparative performance analysis with proposed model. In: SoutheastCon 2024; 2024 Mar 15–24; Atlanta, GA, USA. p. 1064–9. doi:10.1109/southeastcon52093.2024.10500217. [Google Scholar] [CrossRef]
9. Goswami M. AI-based anomaly detection for real-time cybersecurity. Int J Res Rev Tech. 2024;3(1):45–53. [Google Scholar]
10. Xuan CD. Detecting APT attacks based on network traffic using machine learning. J Web Eng. 2021;20(1):171–90. doi:10.13052/jwe1540-9589.2019. [Google Scholar] [CrossRef]
11. Parlak B, Uysal AK. A novel filter feature selection method for text classification: extensive feature selector. J Inf Sci. 2023;49(1):59–78. doi:10.1177/016555152199103. [Google Scholar] [CrossRef]
12. Do Xuan C, Cuong NH. A novel approach for APT attack detection based on feature intelligent extraction and representation learning. PLoS One. 2024;19(6):e0305618. doi:10.1371/journal.pone.0305618. [Google Scholar] [PubMed] [CrossRef]
13. Zhou H, Wang X, Zhu R. Feature selection based on mutual information with correlation coefficient. Appl Intell. 2022;52(5):5457–74. doi:10.1007/s10489-021-02524-x. [Google Scholar] [CrossRef]
14. Liu Z, Yang J, Wang L, Chang Y. A novel relation aware wrapper method for feature selection. Pattern Recognit. 2023;140(1):109566. doi:10.1016/j.patcog.2023.109566. [Google Scholar] [CrossRef]
15. Chen Z, Liu J, Shen Y, Simsek M, Kantarci B, Mouftah HT, et al. Machine learning-enabled iot security: open issues and challenges under advanced persistent threats. ACM Comput Surv. 2022;55(5):1–37. doi:10.1145/353081. [Google Scholar] [CrossRef]
16. Myneni S, Chowdhary A, Sabur A, Sengupta S, Agrawal G, Huang D, et al. Dapt 2020-constructing a benchmark dataset for advanced persistent threats. In: International Workshop on Deployable Machine Learning for Security Defense; 2020 Aug 24; San Diego, CA, USA. p. 138–63. doi:10.1007/978-3-030-59621-7_8. [Google Scholar] [CrossRef]
17. Ahmed Y, Asyhari AT, Rahman MA. A cyber kill chain approach for detecting advanced persistent threats. Comput Mater Contin. 2021;67(2):2497–513. doi:10.32604/cmc.2021.014223. [Google Scholar] [CrossRef]
18. Talib MA, Nasir Q, Nassif AB, Mokhamed T, Ahmed N, Mahfood B. APT beaconing detection: a systematic review. Comput Secur. 2022;122(4):102875. doi:10.1016/j.cose.2022.102875. [Google Scholar] [CrossRef]
19. Mazaheri ME, Shameli-Sendi A. APTracker: a comprehensive and analytical malware dataset, based on attribution to APT groups. IEEE Access. 2024;12:145148–58. doi:10.1109/ACCESS.2024.3473021. [Google Scholar] [CrossRef]
20. Patil A, Deshpande A. Evaluating ML models on CTU-13 and IOT,-23 Datasets. In: International Conference on Advanced Computing Technologies and Applications (ICACTA); 2023 Oct 6–7; Mumbai, India. p. 1–6. doi:10.1109/ICACTA58201.2023.10393565. [Google Scholar] [CrossRef]
21. Anjum MM, Iqbal S, Hamelin B. Analyzing the usefulness of the DARPA OpTC dataset in cyber threat detection research. In: Proceedings of the 26th ACM Symposium on Access Control Models and Technologies; 2021 Jun 16–18; Online. p. 27–32. doi:10.1145/3450569.346357. [Google Scholar] [CrossRef]
22. Anande TJ, Leeson MS. Synthetic network traffic data generation and classification of advanced persistent threat samples: a case study with GANs and XGBoost. In: Deep Learning Theory and Applications (DeLTA 2023). Cham, Switzerland: Springer; 2023. p. 1–18. doi:10.1007/978-3-031-39059-3_1. [Google Scholar] [CrossRef]
23. Sharafaldin I, Lashkari AH, Ghorbani AA. Toward generating a new intrusion detection dataset and intrusion traffic characterization. In: Proceedings of the 4th International Conference on Information Systems Security and Privacy (ICISSP); 2018 Jan 22–24; Madeira, Portugal. p. 108–16. doi:10.5220/0006639801080116. [Google Scholar] [CrossRef]
24. Stojanović B, Hofer-Schmitz K, Kleb U. APT datasets and attack modeling for automated detection methods: a review. Comput Sec. 2020;92(2):101734. doi:10.1016/j.cose.2020.101734. [Google Scholar] [CrossRef]
25. Techentin R, Foti D, Al-Saffar S, Li P, Daniel E, Gilbert B, et al. Characterization of semi-synthetic dataset for big-data semantic analysis. In: 2014 IEEE High Performance Extreme Computing Conference (HPEC); 2014 Sep 9–11; Waltham, MA, USA. p. 1–6. doi:10.1109/HPEC.2014.7040994. [Google Scholar] [CrossRef]
26. Aljawarneh S, Aldwairi M, Yassein MB. Anomaly-based intrusion detection system through feature selection analysis and building hybrid efficient model. J Comput Sci. 2018;25(3):152–60. doi:10.1016/j.jocs.2017.03.006. [Google Scholar] [CrossRef]
27. Kohavi R, John GH. Wrappers for feature subset selection. Artif Intell. 1997;97(1–2):273–324. doi:10.1016/S0004-3702(97)00043-X. [Google Scholar] [CrossRef]
28. Farsi M. Filter-based feature selection and machine-learning classification of cancer data. Intell Autom Soft Comput. 2021;28(1):83–92. doi:10.32604/iasc.2021.015460. [Google Scholar] [CrossRef]
29. Rajab M, Wang D. Practical challenges and recommendations of filter methods for feature selection. J Inf Knowl Manag. 2020;19(1):2040019. doi:10.1142/S0219649220400195. [Google Scholar] [CrossRef]
30. Alyasiri OM, Cheah YN, Abasi AK, Al-Janabi OM. Wrapper and hybrid feature selection methods using metaheuristic algorithms for English text classification: a systematic review. IEEE Access. 2022;10(1):39833–52. doi:10.1109/ACCESS.2022.3165814. [Google Scholar] [CrossRef]
31. Yin Y, Jang-Jaccard J, Xu W, Singh A, Zhu J, Sabrina F, et al. IGRF-RFE: a hybrid feature selection method for MLP-based network intrusion detection on UNSW-NB15 dataset. J Big Data. 2023;10(1):15. doi:10.1186/s40537-023-00694-8. [Google Scholar] [CrossRef]
32. Tavallaee M, Bagheri E, Lu W, Ghorbani AA. A detailed analysis of the KDD CUP 99 data set. In: 2009 IEEE Symposium on Computational Intelligence for Security and Defense Applications; 2009 Jul 8–10; Ottawa, ON, Canada. p. 1–6. doi:10.1109/CISDA.2009.5356528. [Google Scholar] [CrossRef]
33. Al-Saraireh J, Masarweh A. A novel approach for detecting advanced persistent threats. Egypt Inf J. 2022;23(4):45–55. doi:10.1016/j.eij.2022.06.005. [Google Scholar] [CrossRef]
34. Huang S, Poskitt CM, Shar LK. Security modelling for cyber-physical systems: a systematic literature review. arXiv:240407527. 2024. [Google Scholar]
35. Pols P, van den Berg J, Hague. The unified kill chain. CSA Thesis, Hague. 2017 [Internet]. p. 1–104. [cited 2025 Jun 24]. Available from: https://www.unifiedkillchain.com/assets/The-Unified-Kill-Chain.pdf. [Google Scholar]
36. Naik N, Jenkins P, Grace P, Song J. Comparing attack models for it systems: Lockheed martin’s cyber kill chain, MITRE ATT&CK framework and diamond model. In: 2022 IEEE International Symposium on Systems Engineering (ISSE); 2022 Oct 24–26; Vienna, Austria. p. 1–7. doi:10.1109/ISSE54508.2022.10005490. [Google Scholar] [CrossRef]
37. Hutchins EM, Cloppert MJ, Amin RM. Intelligence-driven computer network defense informed by analysis of adversary campaigns and intrusion kill chains. Vol. 1. Leading issues in information warfare & security research; 2011 [Internet]. [cited 2025 Jun 24]. Available from: https://securityandtechnology.org/wp-content/uploads/2020/07/lm-white-paper-intel-driven-defense.pdf. [Google Scholar]
38. Panahnejad M, Mirabi M. APT-Dt-KC: advanced persistent threat detection based on kill-chain model. J Supercomput. 2022;78(6):8644–77. doi:10.1007/s11227-021-04201-9. [Google Scholar] [CrossRef]
39. Al-Sada B, Sadighian A, Oligeri G. Mitre att&ck: state of the art and way forward. ACM Comput Surv. 2024;57(1):1–37. doi:10.1145/368730. [Google Scholar] [CrossRef]
40. Krishnapriya S, Singh S. A comprehensive survey on advanced persistent threat (APT) detection techniques. Comput Mater Contin. 2024;80(2):2675–719. doi:10.32604/cmc.2024.052447. [Google Scholar] [CrossRef]
41. Chollet Ramampiandra E, Scheidegger A, Wydler J, Schuwirth N. Cyber Kill Chain ontology to support automated cyber threat intelligence. Ecol Model. 2023;481:110353. [Google Scholar]
42. Bahrami PN, Dehghantanha A, Dargahi T, Parizi RM, Choo KKR, Javadi HH. Cyber kill chain-based taxonomy of advanced persistent threat actors: analogy of tactics, techniques, and procedures. J Inf Process Syst. 2019;15(4):865–89. doi:10.3745/JIPS.03.0126. [Google Scholar] [CrossRef]
43. Panwar SS, Raiwani Y, Panwar LS. An intrusion detection model for cicids-2017 dataset using machine learning algorithms. In: International Conference on Advances in Computing, Communication and Materials (ICACCM); 2022 Nov 10–11; Dehradun, India. p. 1–10. doi:10.1109/ICACCM56405.2022.10009400. [Google Scholar] [CrossRef]
44. Moustafa N, Slay J. UNSW-NB15: a comprehensive data set for network intrusion detection systems (UNSW-NB15 network data set). In: 2015 Military Communications and Information Systems Conference (MilCIS). Canberra, ACT, Australia: IEEE; 2015 Nov 10–12. p. 1–6. doi:10.1109/MilCIS.2015.7348942. [Google Scholar] [CrossRef]
45. Salim DT, Singh MM, Keikhosrokiani P. A systematic literature review for APT detection and effective cyber situational awareness (ECSA) conceptual model. Heliyon. 2023;9(7):e17156. doi:10.1016/j.heliyon.2023.e17156. [Google Scholar] [PubMed] [CrossRef]
46. Covert IC, Qiu W, Lu M, Kim NY, White NJ, Lee SI. Learning to maximize mutual information for dynamic feature selection. In: 2023 International Conference on Machine Learning; 2023 Jul 23–29; Honolulu, HI, USA. p. 6424–47. [Google Scholar]
47. Veyrat-Charvillon N, Standaert FX. Mutual information analysis: how, when and why?. In: 2009 International Workshop on Cryptographic Hardware and Embedded Systems; 2009 Sep 6–9; Lausanne, Switzerland. p. 429–43. doi:10.1007/978-3-642-04138-9_30. [Google Scholar] [CrossRef]
48. Tsur D, Goldfeld Z, Greenewald K. Max-sliced mutual information. In: 37th Conference on Neural Information Processing Systems (NeurIPS 2023); 2023 Dec 10–16; New Orleans, LA, USA. p. 1–14. [Google Scholar]
49. Pascoal C, Oliveira MR, Pacheco A, Valadas R. Theoretical evaluation of feature selection methods based on mutual information. Neurocomputing. 2017;226(3):168–81. doi:10.1016/j.neucom.2016.11.047. [Google Scholar] [CrossRef]
50. Agrawal PV, Kshirsagarb DD, Khobragadec AR. Symmetric uncertainty based feature selection method in android malware detection. In: Recent advances in material, manufacturing, and machine learning. Boca Raton, FL, USA: CRC Press; 2023. p. 934–41. [Google Scholar]
51. Peng H, Long F, Ding C. Feature selection based on mutual information criteria of max-dependency, max-relevance, and min-redundancy. IEEE Trans Pattern Anal Mach Intell. 2005;27(8):1226–38. doi:10.1109/TPAMI.2005.159. [Google Scholar] [PubMed] [CrossRef]
52. Zhang X, Liu CA. Model averaging prediction by K-fold cross-validation. J Econo. 2023;235(1):280–301. doi:10.1016/j.jeconom.2022.04.007. [Google Scholar] [CrossRef]
53. Ratnasingam S, Muñoz-Lopez J. Distance correlation-based feature selection in random forest. Entropy. 2023;25(9):1250. doi:10.3390/e25091250. [Google Scholar] [PubMed] [CrossRef]
54. Rani N, Saha B, Shukla SK. A comprehensive survey of automated advanced persistent threat attribution: taxonomy, methods, challenges and open research problems. J Inf Secur Appl. 2025;92(2):104076. doi:10.1016/j.jisa.2025.104076. [Google Scholar] [CrossRef]
55. De Ville B. Decision trees. Wiley Interdiscip Rev Comput Stat. 2013;5(6):448–55. doi:10.1002/wics.1278. [Google Scholar] [CrossRef]
56. Schmidhuber J. Deep learning in neural networks: an overview. Neural Netw. 2015;61(3):85–117. doi:10.1016/j.neunet.2014.09.003. [Google Scholar] [PubMed] [CrossRef]
57. Tisoc M, Beltrán JV. Mutual information: a way to quantify correlations. Revista Brasileira De Ensino De Física. 2022;44:e20220055. doi:10.1590/1806-9126-RBEF-2022-0055. [Google Scholar] [CrossRef]
58. Ali MQ, Al-Shaer E, Khan H, Khayam SA. Automated anomaly detector adaptation using adaptive threshold tuning. ACM Trans Inf Syst Secur. 2013;15(4):17–30. doi:10.1145/2445566.2445569. [Google Scholar] [CrossRef]
Cite This Article
 Copyright © 2025 The Author(s). Published by Tech Science Press.
This work is licensed under a Creative Commons Attribution 4.0 International License , which permits unrestricted use, distribution, and reproduction in any medium, provided the original work is properly cited.
 Downloads
 Citation Tools