
 Submit a Paper
 Propose a Special lssue
 Open Access
ARTICLE

Explainable AI Based Multi-Task Learning Method for Stroke Prognosis
1 Beijing Nick Knight Computer Technology Co., Ltd., Beijing, 100088, China
2 School of Cyberspace Security, Beijing University of Posts and Telecommunications, Beijng, 100876, China
3 Beijing Computing Center Co., Ltd., Beijing Research Institute of Science and Technology, Beijing, 100089, China
* Corresponding Author: Xingyu Zeng. Email:
Computers, Materials & Continua 2025, 84(3), 5299-5315. https://doi.org/10.32604/cmc.2025.064822
Received 25 February 2025; Accepted 17 June 2025; Issue published 30 July 2025
 View Full Text
 Download PDF
Abstract
Predicting the health status of stroke patients at different stages of the disease is a critical clinical task. The onset and development of stroke are affected by an array of factors, encompassing genetic predisposition, environmental exposure, unhealthy lifestyle habits, and existing medical conditions. Although existing machine learning-based methods for predicting stroke patients’ health status have made significant progress, limitations remain in terms of prediction accuracy, model explainability, and system optimization. This paper proposes a multi-task learning approach based on Explainable Artificial Intelligence (XAI) for predicting the health status of stroke patients. First, we design a comprehensive multi-task learning framework that utilizes the task correlation of predicting various health status indicators in patients, enabling the parallel prediction of multiple health indicators. Second, we develop a multi-task Area Under Curve (AUC) optimization algorithm based on adaptive low-rank representation, which removes irrelevant information from the model structure to enhance the performance of multi-task AUC optimization. Additionally, the model’s explainability is analyzed through the stability analysis of SHAP values. Experimental results demonstrate that our approach outperforms comparison algorithms in key prognostic metrics F1 score and Efficiency.Keywords
As a serious cerebrovascular disorder, stroke constitutes a substantial risk to the health of millions globally. The multifactorial pathogenesis of stroke involves dynamic interactions among genetic polymorphisms, environmental triggers, and modifiable risk factors. The complex interactions among these factors make the management of health status in stroke patients particularly challenging. Accurate prediction of the health status of stroke patients is essential, as it facilitates clinical decision-making, contributes to the formulation of personalized treatment strategies, and ultimately enhances patient survival rates alongside quality of life. In the medical field, conventional approaches to predicting health status predominantly depend on clinical experience and basic statistical models like logistic regression and Cox proportional hazard models. While these methods can provide some predictive information, their predictive power and model explainability are limited [1,2].
The rapid advancement in data science and machine learning has led to an increased focus on health status prediction methodologies that leverage big data and sophisticated models [3,4]. Machine learning models, such as Support Vector Machines (SVM), Random Forests (RF), and Deep Neural Networks (DNN), excel at extracting useful features from complex data, significantly improving prediction accuracy and robustness [5,6]. For instance, research by Wang et al. demonstrated that deep neural networks significantly outperform traditional statistical models in stroke prognosis prediction [7]. Multi-task learning is an inductive transfer method that uses the domain information contained in the training signals of related tasks as inductive bias to improve generalization ability [8,9]. Therefore, multi-task learning uses the relationship between tasks to comprehensively capture the multidimensional characteristics of patients, thereby improving prediction accuracy. For example, in the field of medical image processing, multi-task learning has shown excellent performance [10]. However, most existing multi-task learning studies use accuracy as a benchmark evaluation metric, which is only applicable to balanced distributions, and the issue of negative transfer may lead to the model being trained in the wrong direction. On the other hand, a major limitation of these traditional machine learning models is the lack of explainability, which presents a significant barrier in clinical applications. Clinicians need to understand the internal logic of model predictions to ensure their reliability and practical acceptability. Finally, model performance optimization and parameter selection largely rely on extensive experiments and experience, lacking a systematic approach.
To address the aforementioned issues, this paper proposes an Explainable Artificial Intelligence (XAI) based Multi-Task Learning (XAI-MTL) method for predicting the health status of stroke patients. The main contributions are as follows:
1. First, we design a comprehensive multi-task learning framework that simultaneously predicts multiple health status indicators of stroke patients, leveraging task correlations to improve prediction accuracy.
2. Second, we develop a multi-task AUC optimization algorithm based on adaptive low-rank representation, which removes irrelevant information from the model structure through a low-rank model. This significantly enhances the performance of multi-task AUC optimization. This method not only improves the model’s predictive capability but also increases its robustness and stability by reducing irrelevant information between parameters.
3. Finally, we validate the model’s explainability through SHAP value analysis. By calculating the SHAP values of the deep learning model, we provide transparency and explainability to the model’s predictions, enabling clinicians to better understand and trust the model’s output.
AI technology shows great potential in stroke diagnosis, especially in improving diagnostic speed and accuracy [11]. By analysing 3D tomographic images, AI can reliably identify stroke features such as large vessel occlusion (LVO) [12]. For example, Convolutional Neural Networks (CNNs) show high sensitivity (85%) in LVO detection, which is a significant advantage over other methods. AI has also shown its importance in the field of stroke care and rehabilitation [13,14]. For example, a systematic evaluation study reviewing the scientific evidence for AI in stroke care over the past decade highlighted the expanding role of AI in stroke diagnosis, treatment, outcomes, and rehabilitation [15]. Most of these studies demonstrated the accuracy and effectiveness of AI applications in stroke care. To address the class imbalance in medical datasets for stroke prediction, Abousaber [16] propose an innovative meta-learning framework that integrates advanced hybrid resampling techniques, ensemble-based classifiers, and explainable artificial intelligence (XAI). This framework significantly enhances both stroke prediction performance and model explainability.
To address the shortcomings of the single-task model, namely its limited learning capacity and interpretive limitations, multi-task learning has emerged as a promising avenue of research. For example, Harutyunyan et al. [17] proposed a public benchmarking suite comprising four different clinical prediction tasks: in-hospital mortality, physiological collapse, length of hospital stay, and phenotypic classification. Cheng et al. [18] developed a deep neural network architecture for predicting the risk of death in patients with multiple chronic diseases by integrating multi-task learning and cost-sensitive learning. Bertsimas and Ma [19] elucidated the dynamics of task learning interdependencies by balancing self-exploitation and cross-task exploration through a novel attentional mechanism, resulting in an average improvement of 11.6% over a traditional single-task model across 40 disease diagnosis, three hospital operation prediction, and one patient phenotype tasks. However, most of the existing methods using accuracy as the benchmark evaluation criterion are only applicable to the balanced distribution scenario, and negative transfer may affect the model training in the wrong direction.
Despite the superior performance of complex machine learning models in healthcare prediction, the results are often not subjected to explainable analysis. Some scholars focus on the study of interpretability. Ribeiro et al. proposed the LIME (Local Interpretable Model-agnostic Explanations) method in 2016, which generates interpretable surrogate models by perturbing input samples and analyzing prediction variations [20]. This model-agnostic framework enables local explanations for any black-box model, particularly critical in clinical decision support systems [21]. Building on this, Lundberg and Lee introduced SHAP (SHapley Additive exPlanations), unifying game-theoretic Shapley values with local explanation methods to provide globally consistent feature importance quantification [22]. Rebane et al. [23] compared the global and local explanations provided by an attention-based RNN architecture with the explanations provided by a more basic RNN using a post hoc SHAP framework and demonstrated that SHAP can provide more clinically appropriate global explanations.
This section provides a detailed overview of the proposed XAI-MTL for stroke prognosis, including task definitions, algorithm design, and how SHAP values are utilized to validate explainability, as depicted in Fig. 1.
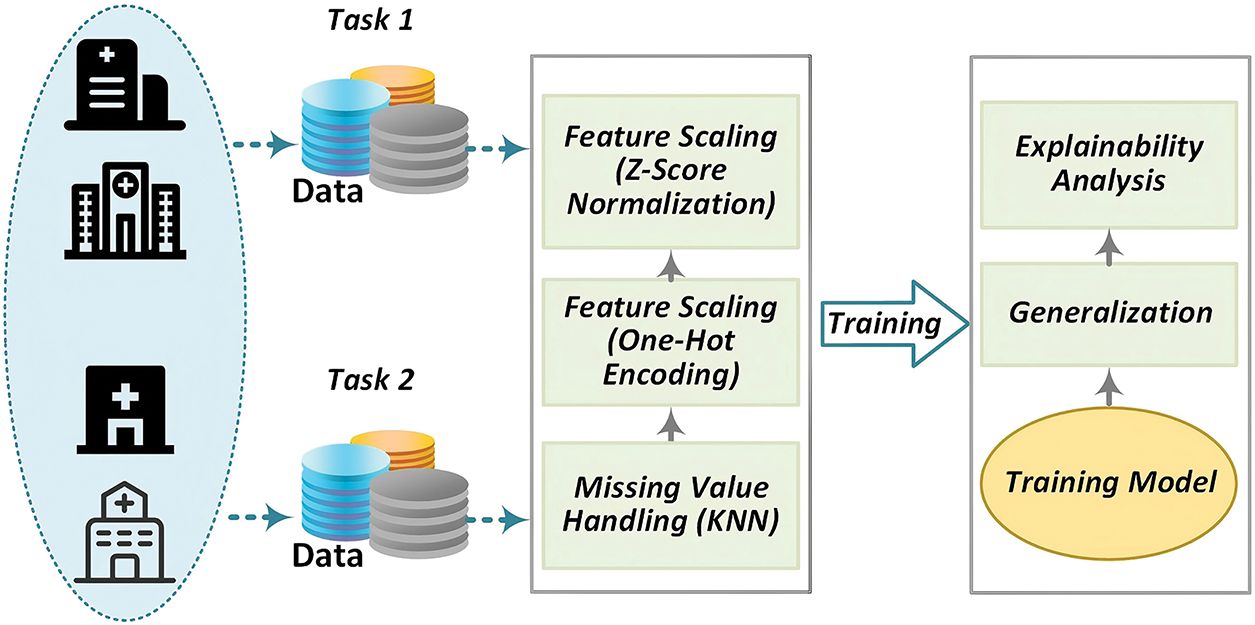
Figure 1: Privacy-preserving real-time encrypted DNS identification framework
The EQ-5D-3L serves as an assessment tool for evaluating health status, comprising two components: the EQ-5D-3L Health Description System and the Visual Analog Scale (EQ-VAS). The Health Description System encompasses five dimensions: mobility, self-care, usual activities, pain/discomfort, and anxiety/depression. The EQ-5D-3L has been widely used in clinical trials, population studies, and real-world research, and over the past 25 years, it has been translated into multiple languages through a rigorous translation process.
The EQ-5D Health Description System covers five dimensions, each with three levels, to describe an individual’s health status at a specific point in time. These five dimensions are Mobility, Self-Care, Usual Activities, Pain/Discomfort, and Anxiety/Depression. Each dimension has three response options: no problems, some problems, and severe problems.
The Third International Stroke Trial (IST-3) dataset originates from a real-world, international, multi-center, randomized open-label treatment trial aimed at evaluating the effect of intravenous thrombolysis in acute ischemic stroke patients within 6 h of onset [24]. This investigation involved 3035 stroke patients from 156 hospitals spanning 12 countries. The patients were limited to those who exhibited clear acute stroke symptoms and signs, had a known stroke onset time, were eligible to begin treatment within 6 h of symptom onset, and had been reliably excluded from intracranial hemorrhage or other stroke-like structural brain lesions (such as brain tumors) through CT or MRI scans. Comprehensive data were collected for each participant over the course of the trial. Upon enrollment (within 6 h of symptom onset), demographic details such as gender and age, along with diagnostic information including the NIHSS score, stroke subtype, comorbid conditions, and blood test results were systematically recorded. Acute treatment information was recorded 24 h post-stroke. By the seventh day, additional data on the patient’s history of previous strokes, medication history, medications administered between the 24th hour and the seventh day, and Glasgow Coma Scale scores were documented. Follow-up data at six months and eighteen months comprised the Oxford Handicap Scale (OHS) and EQ-5D-3L questionnaire results, utilized to assess the capability of the multi-task learning (MTL) model in predicting patients’ responses on the EQ-5D-3L at these intervals.
Multi-task learning was employed to forecast various EQ-5D dimensions for patients at the six-month and eighteen-month follow-up points. Throughout the model training and inference stages, consideration was given exclusively to patients who were alive at the respective time points and had complete responses for all questionnaire items.
This study utilizes a multi-task AUC optimization algorithm grounded in adaptive low-rank representation for model training. This approach improves the effectiveness of multi-task AUC optimization by mitigating parameter redundancy via low-rank structuring of the model. In contrast to existing methodologies, this investigation integrates pointwise AUC optimization with low-rank representation, thereby addressing limitations found in prior research concerning multi-task AUC optimization utilizing low-rank representation.
3.2.1 Multi-Task Learning Paradigm
ForL learning tasks, let
where
3.2.2 Multitask Learning for Low-Rank Representations
(1) Multitask learning for low-rank representations
In multi-task learning (MTL), highly correlated tasks exhibit significant informational overlap. During training, the model parameters of such tasks may converge toward similar values or structural configurations. This latent parameter correlation within a multi-task model typically enhances generalization performance, as it enables the model to better identify and leverage inter-task relationships for effective knowledge sharing. Motivated by this observation, low-rank structured multi-task models have garnered significant research interest. The low-rank constraints mitigate model complexity, enhance the model’s capacity to capture task commonalities, suppress negative transfer, improve individual task performance, and achieve holistic optimization.
Given a parameter matrix W, if its
where
Based on the above low-rank structure, AUC optimisation can be transformed into an AUC optimisation method that optimises the decomposition parameters, thus ensuring that the model is not affected by negative migration. By formalising
where
From the pairwise AUC loss function, it can be known that the complexity of each iteration in the AUC optimisation process is
where
The above problem is characterised by low iterative complexity, and its optimal model
(2) Multi-task AUC optimisation based on decomposing NNFN regularity
Building on the AUC max minimisation approach above, this multi-task AUC empirical risk minimisation problem based on a low-rank representation can be modelled as
where
where
Next, the AUC method for point-by-point optimisation is introduced, under the theorem of reference that the parameters are able to converge to within
Problem (7) can be further optimised using the proximal gradient method by employing the proximal gradient descent-ascent method as an optimiser to update the parameters while using gradient descent to update M and N. The specific algorithm is shown in Table 1.
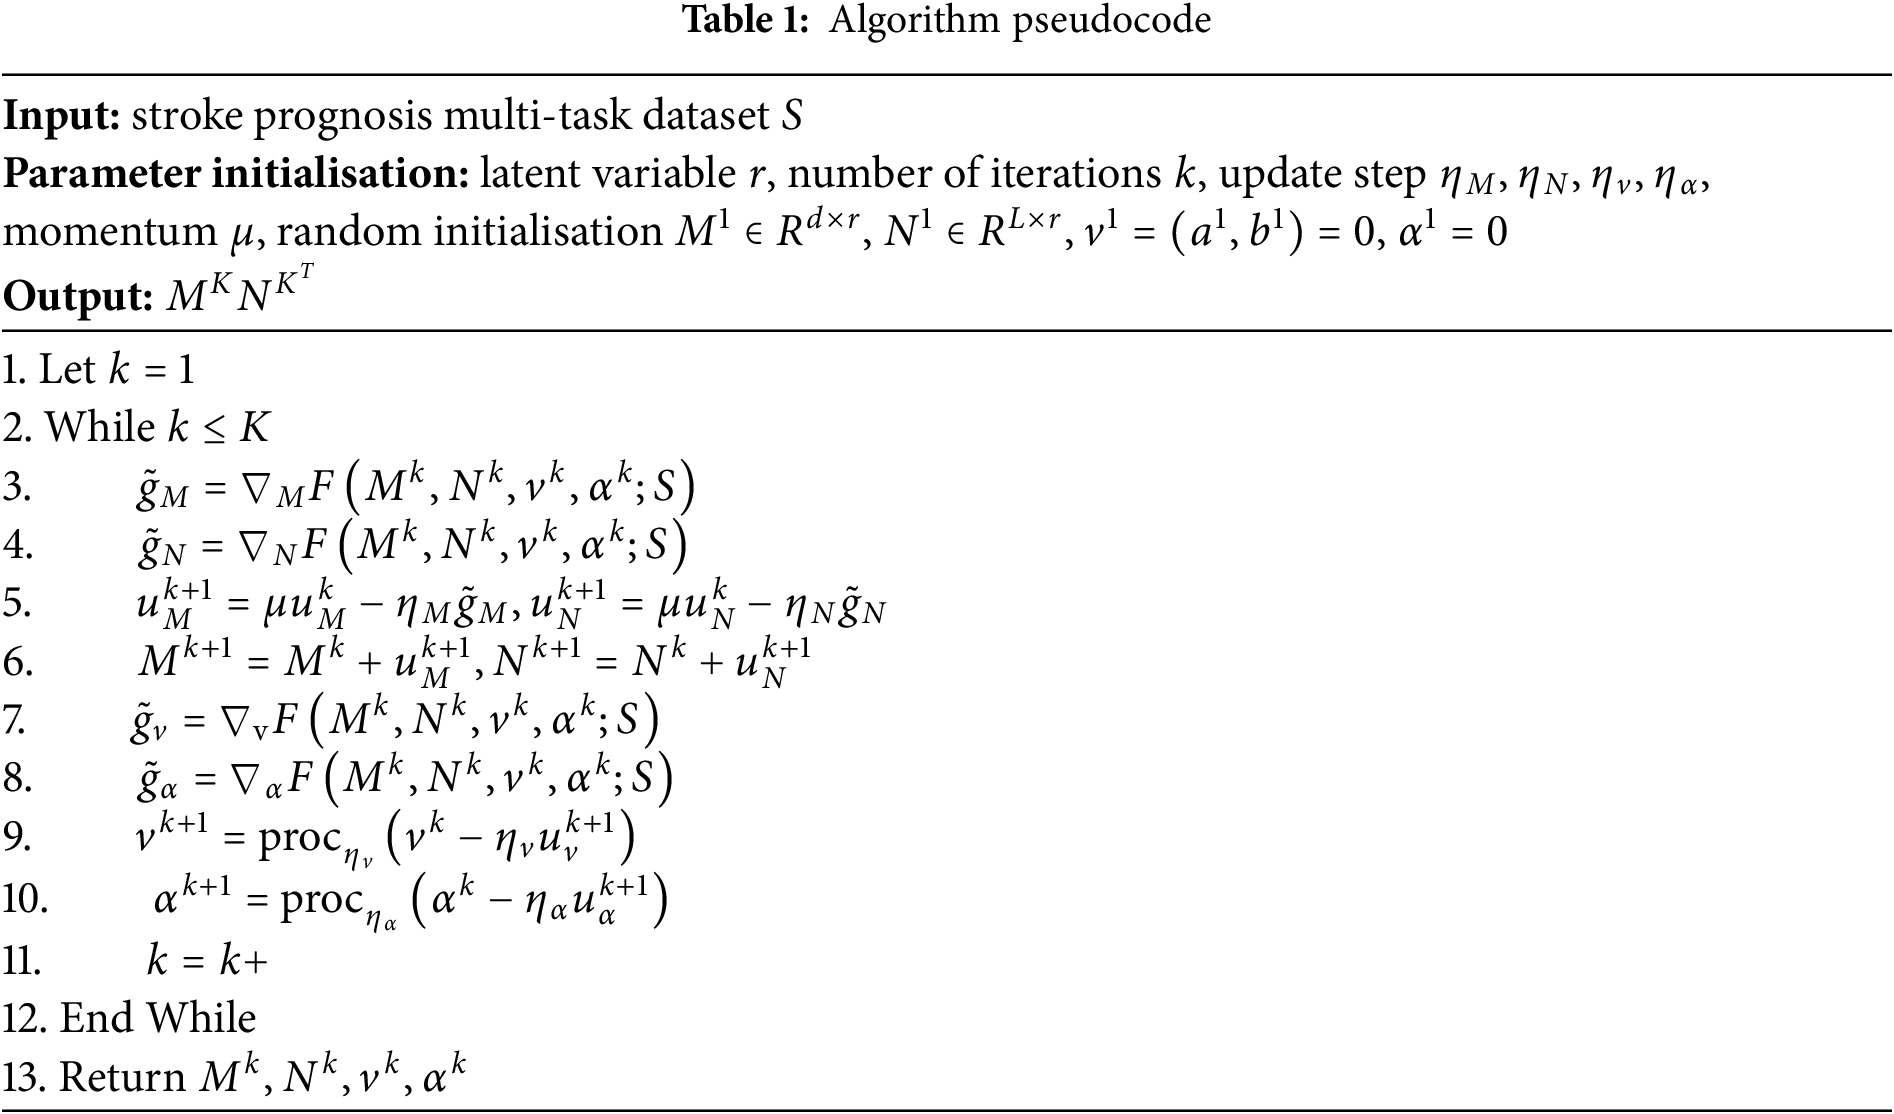
(1) First, the algorithm inputs multi-task training data and randomly initialises the model parameters;
(2) In steps 3 to 6, the algorithm calculates the gradients of M and N to update the parameters;
(3) In steps 7 to 10, the variables
(4) Finally, after K rounds of iterations, the algorithm outputs the optimal parameters
Across numerous applications, particularly in critical decision-making contexts such as medical diagnosis and treatment planning, model explainability remains a fundamental requirement. While deep learning models are widely adopted for their superior performance, their complexity often results in them being perceived as “black boxes”. This necessitates the application of Explainable Artificial Intelligence (XAI) techniques to elucidate the decision-making mechanisms of these models.
SHAP (SHapley Additive exPlanations) is a widely adopted XAI framework grounded in Shapley values from cooperative game theory, which quantifies the contribution of each feature to model predictions. SHAP values provide a quantitative measure of each feature’s contribution to the final prediction, reflecting both the magnitude and direction of its influence. In clinical settings, such as stroke patient prognosis prediction, SHAP scores enable the identification of key factors influencing patient survival and functional recovery. This facilitates clinicians’ understanding of model predictions and supports informed adjustments to treatment strategies when warranted.
The basic idea of SHAP scores is to determine the impact of each feature on the predicted outcome by calculating its marginal contribution to all possible combinations of features. The specific steps and formula settings for calculating SHAP scores are described below.
For each feature
where
Based on the definition of the Shapley value, the SHAP value
where |S| is the size of the subset S and M! is the total number of combinations of all features.
3.3.3 Calculate Explanation Error
To ensure the accuracy of the SHAP values, we also need to calculate the explanation error R.
The explanation error R should be close to zero to verify the validity of the SHAP value.
The experiments were conducted on a server equipped with an NVIDIA Tesla V100 GPU, running Ubuntu 18.04. The primary packages used include Python 3.8, PyTorch 1.8, Scikit-learn 0.24, and SHAP 0.40. Data from the 6-month and 18-month follow-up visits of patients in The Third International Stroke Trial (IST-3) were treated as two separate datasets. Each dataset was divided into training, validation, and test sets with proportions of 70
In this section, a Multi-Layer Perceptron (MLP) is chosen as the base deep neural network model, with the following structure:
• Input layer: This layer accepts the preprocessed feature vector, with the input dimension equal to the total number of features. Notably, compared to the 6-month follow-up data, the input vector dimension for the 18-month follow-up data is larger. For instance, the EQ-5D dimensions from the 6-month follow-up data are included as input features for the 18-month follow-up data. The latitude of the output vector is set to 256.
• Transformer encoder: We configure the encoder with 2 stacked layers, each containing a 4-head self-attention mechanism and a feed-forward network. The feed-forward layer maintains an output dimensionality of 512, with the ReLU activation function applied between its linear transformations.
• Output layer: For survival prediction, the output layer consists of a single neuron with a Sigmoid activation function. For functional recovery prediction, the output layer contains multiple neurons with a Softmax activation function.
The key hyperparameters include a learning rate of 0.001, a batch size of 64, 200 training epochs, and an L2 regularization factor of 0.01. The best hyperparameter combination was selected using grid search and validation set performance monitoring. The hyperparameter search space encompasses learning rates of [0.0001, 0.001, 0.01], batch sizes of [32, 64, 128], Transformer layer counts of [1, 2, 3], attention head configurations of [2, 4, 8], and L2 regularization coefficients of [0.001, 0.01]. A 5-fold cross-validation strategy is implemented to monitor the validation set weighted F1 score, coupled with an early stopping mechanism that terminates training if the validation loss exhibits no improvement over 5 consecutive epochs.
To validate the effectiveness of our method, we compared it with the following baseline methods:
• Single Task Learning (Base): A dedicated model is independently trained for each EQ-5D-3L questionnaire dimension prediction. The input layer and Transformer encoder architecture align with the configurations specified in Section 4.1.1.
• Traditional Multi-Task Learning (MTL): Use a standard multi-task learning framework with a shared feature extraction layer. The shared layer contains three fully connected layers, each containing 256 neurons, with ReLU activation function. Each task has a separate output layer.
• XGBoost: Separate XGBoost models are trained for each task, with the max depth hyperparameter set to 5.
The main evaluation metrics selected for this study include the EQ-5D dimensions (measured using accuracy, recall, and F1-score). For each evaluation metric, we compute the average of the indicators across multiple tasks as the final measure.
4.2.1 Averaged F1-Score Prediction
The F1-score is a metric used to evaluate the performance of classification models, considering both precision and recall. We first examine the overall F1-score under different methods. The overall F1-score is computed by averaging the F1-scores of all indicators. We begin by comparing the overall F1-scores of different methods.
At the 6-month assessment stage (6MaS) stage in Fig. 2, the overall F1-score for the Base method was 0.3804 (standard deviation of 0.01296), for the MTL method was 0.3419 (standard deviation of 0.02536), for the XGBoost method was 0.3797 (standard deviation of 0.01679), and for Our Method was 0.3998 (standard deviation of 0.02012). Observing the results, it is clear that multi-task learning (MTL) methods exhibit a distinct advantage over single-task learning methods (Base and RF) in terms of overall F1-score. We attribute this to the ability of the multi-task learning method to jointly train multiple tasks, thereby learning shared knowledge. Moreover, predicting the EQ-5D dimensions can be viewed as a set of highly correlated tasks, which ensures the prediction performance of each task. Additionally, we observed that the standard deviation of the multi-task learning method is larger than that of the single-task learning method, which can be attributed to the more task-specific nature of the single-task learning model, making its performance more stable for individual tasks. Compared to traditional multi-task learning methods, our proposed method has certain advantages in both overall F1-score and standard deviation of F1-score, with an improvement of 16.93
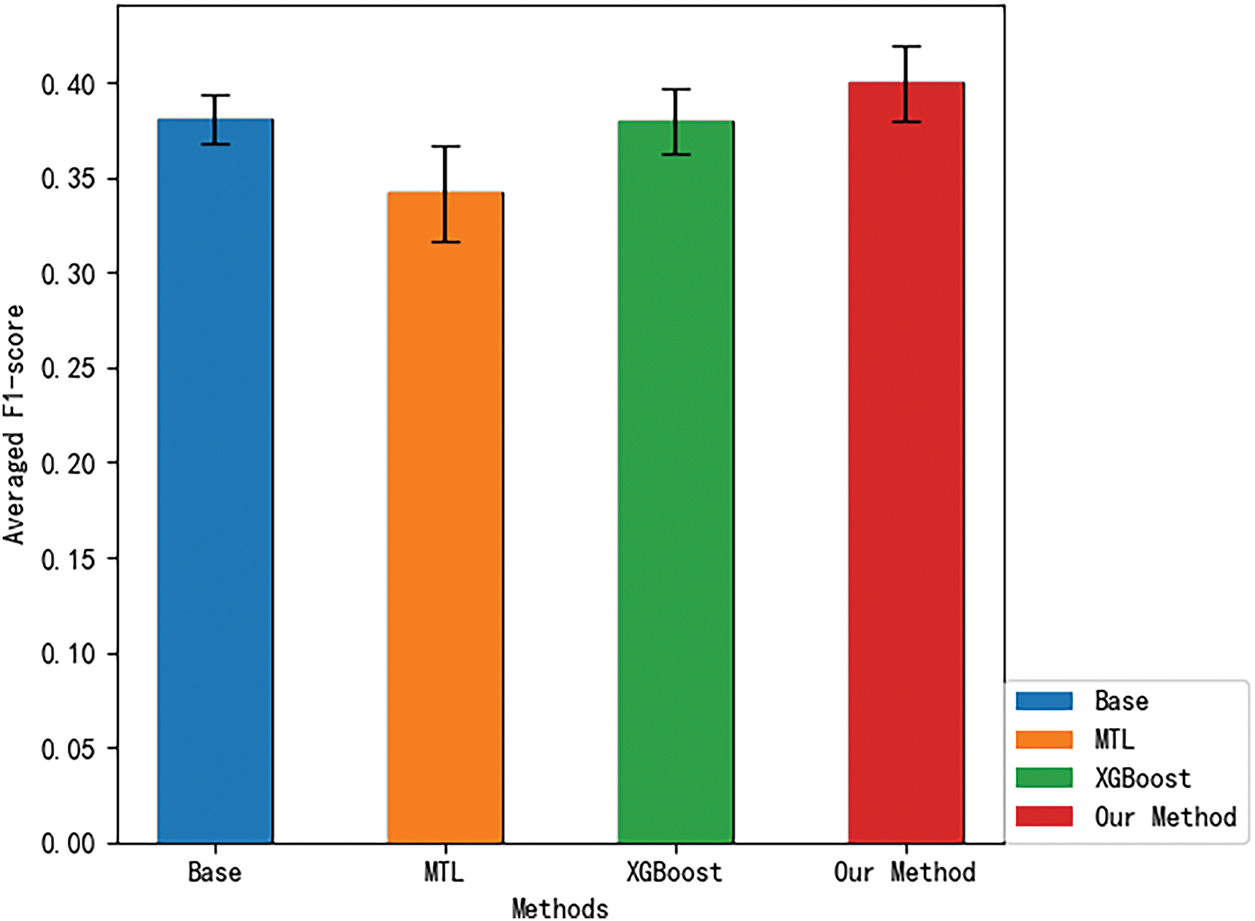
Figure 2: 6MaS averaged F1-score for different methods
Next, we compare the overall F1-scores of different methods at the 18MaS stage, as shown in Fig. 3. At the 18-month assessment stage (18MaS) stage, the overall F1-score for the Base method was 0.4234 (standard deviation of 0.01594), for the MTL method was 0.3989 (standard deviation of 0.04336), for the XGBoost method was 0.4147 (standard deviation of 0.02197), and for Our Method was 0.4529 (standard deviation of 0.03422). Upon observation, it is evident that, compared to 6MaS, there is an improvement in the F1-scores for all methods at 18MaS. This can be attributed to the inclusion of additional input features when predicting the EQ-5D dimensions at 18MaS, which enhances the accuracy of the predictions. The comparison of the methods’ performance at 18MaS is consistent with the results at 6MaS. Compared to traditional multi-task learning methods, our proposed method achieves a 9.21
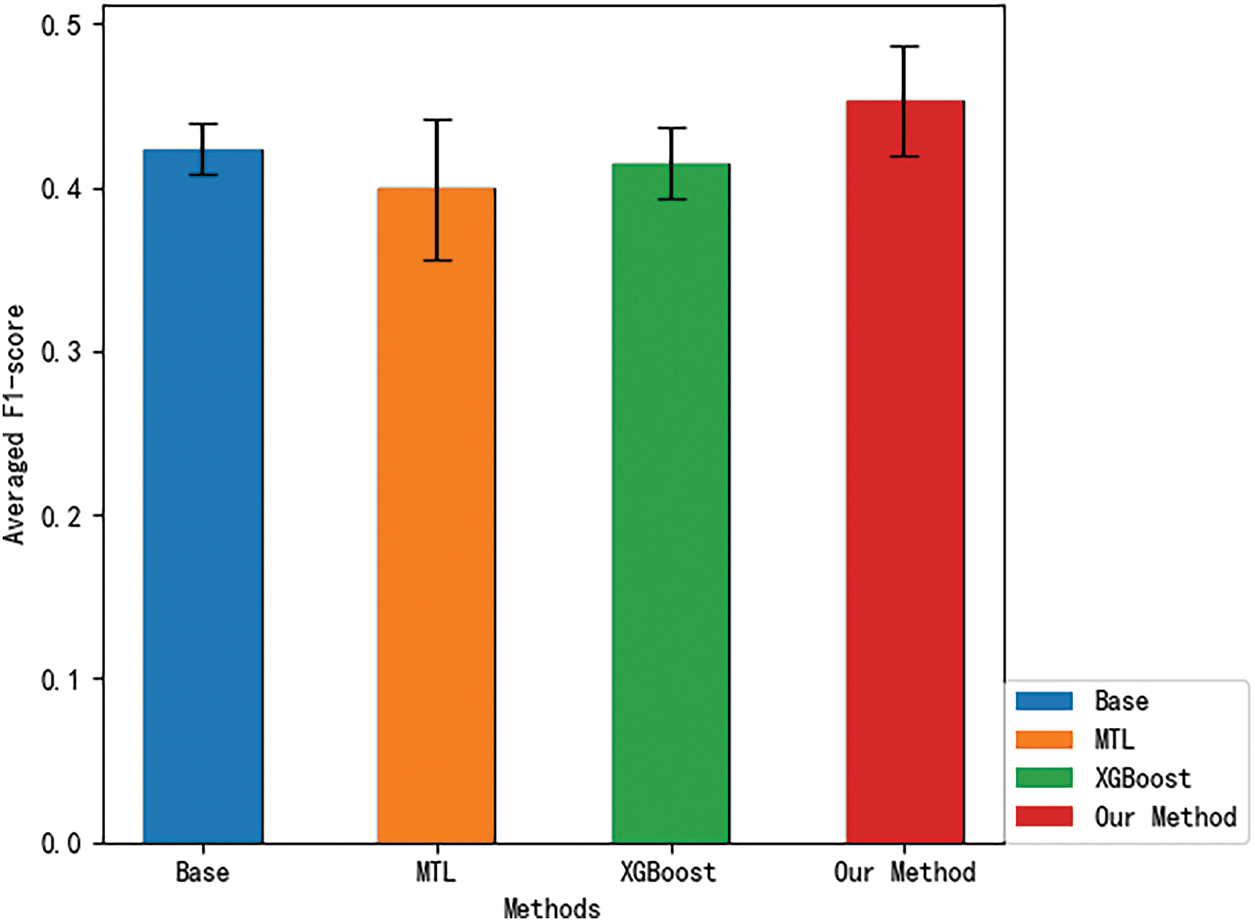
Figure 3: 18MaS averaged F1-score for different methods
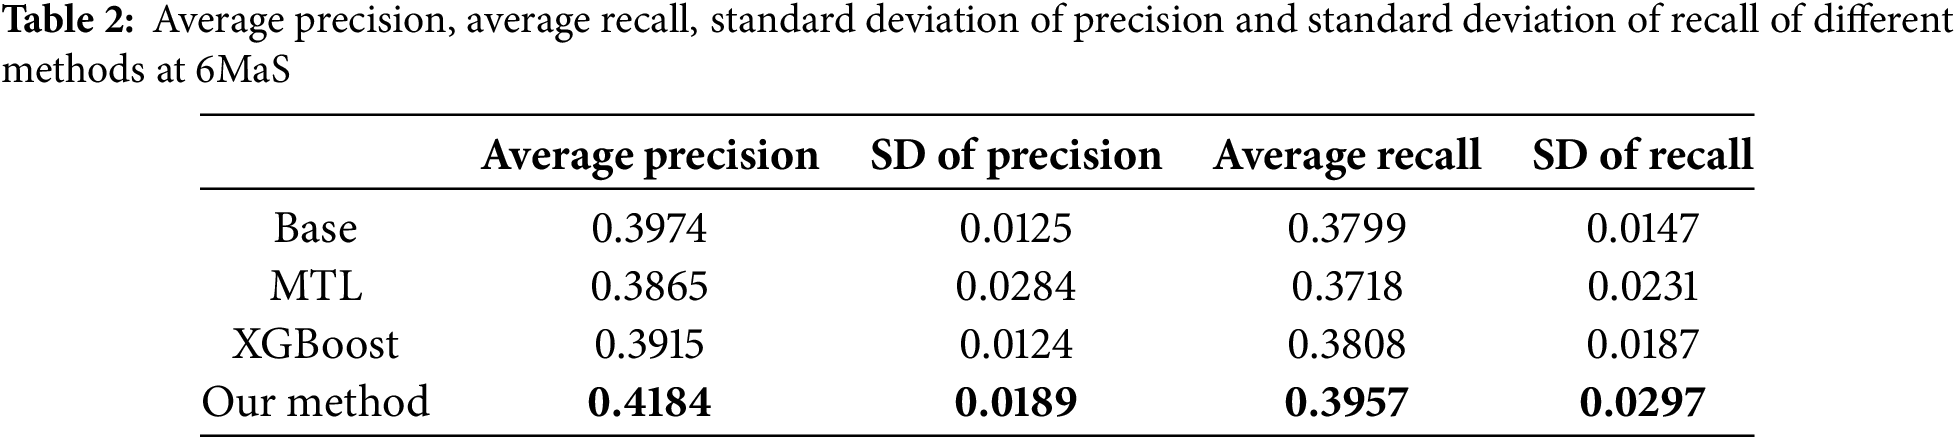
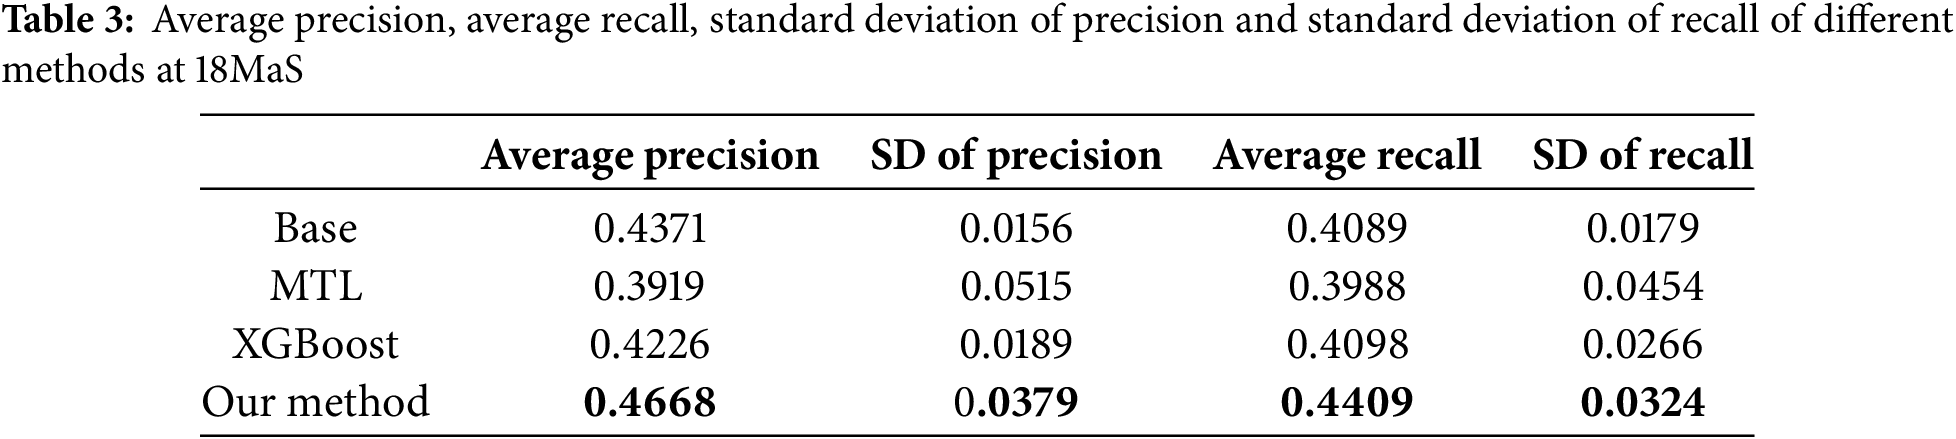
4.2.2 Comparison of Precision and Recall
As shown in Tables 2 and 3, we employ Average Precision (AP) and Average Recall (AR) across all EQ-5D dimensions as evaluation metrics. Empirical observations reveal that at both the 6MaS and 18MaS, our proposed method achieves state-of-the-art performance in both AP and AR metrics. Notably, all methods exhibit significant improvements in AP and AR at 18MaS compared to 6MaS. Specifically, our method attains AP and AR values of 0.4668 and 0.4409 at 18MaS, respectively, demonstrating substantial reference value for clinical decision support by healthcare practitioners.
We assessed the convergence speed of the algorithms by comparing the overall F1-scores of three neural network-based multi-task learning methods, MTL, NC-CMTL [25], and Our Method, at different time points. NC-CMTL serves as a representative of regularization-based MTL approaches, where task relationships are captured through constrained parameter sharing. We extend this paradigm by introducing temporal dynamic regularization that adapts to gradient evolution patterns during training.
During the 6 and 18MaS phases in Figs. 4 and 5, all three methods exhibit nearly identical convergence trends. Due to the incorporation of transformer encoder layers in both NC-CMTL and our proposed method, the models achieve significant performance improvements compared to the baseline MTL framework. Notably, our method demonstrates a faster convergence rate than the NC-CMTL approach. By reformulating the optimization problem as a minimax optimization objective for each sample, our method effectively reduces the iteration time required during training. Experimental results confirm that the proposed methodology substantially enhances the efficiency of multi-task learning.
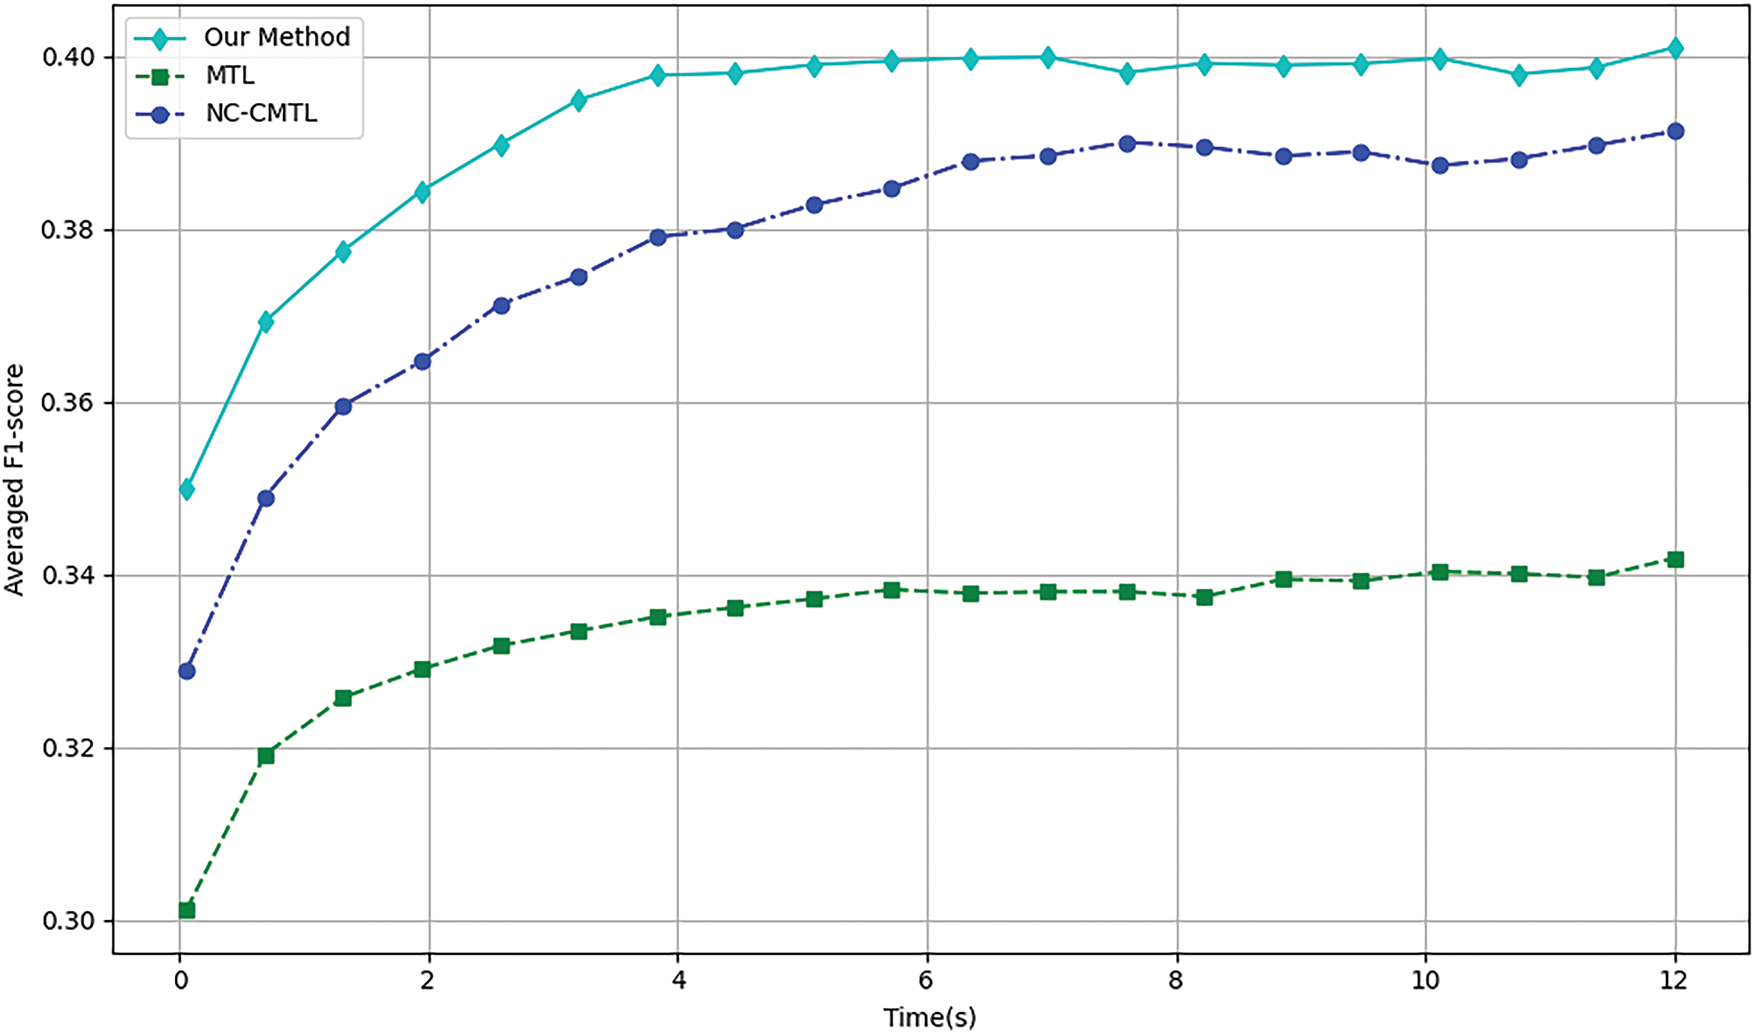
Figure 4: Training efficiency of different methods for 6MaS
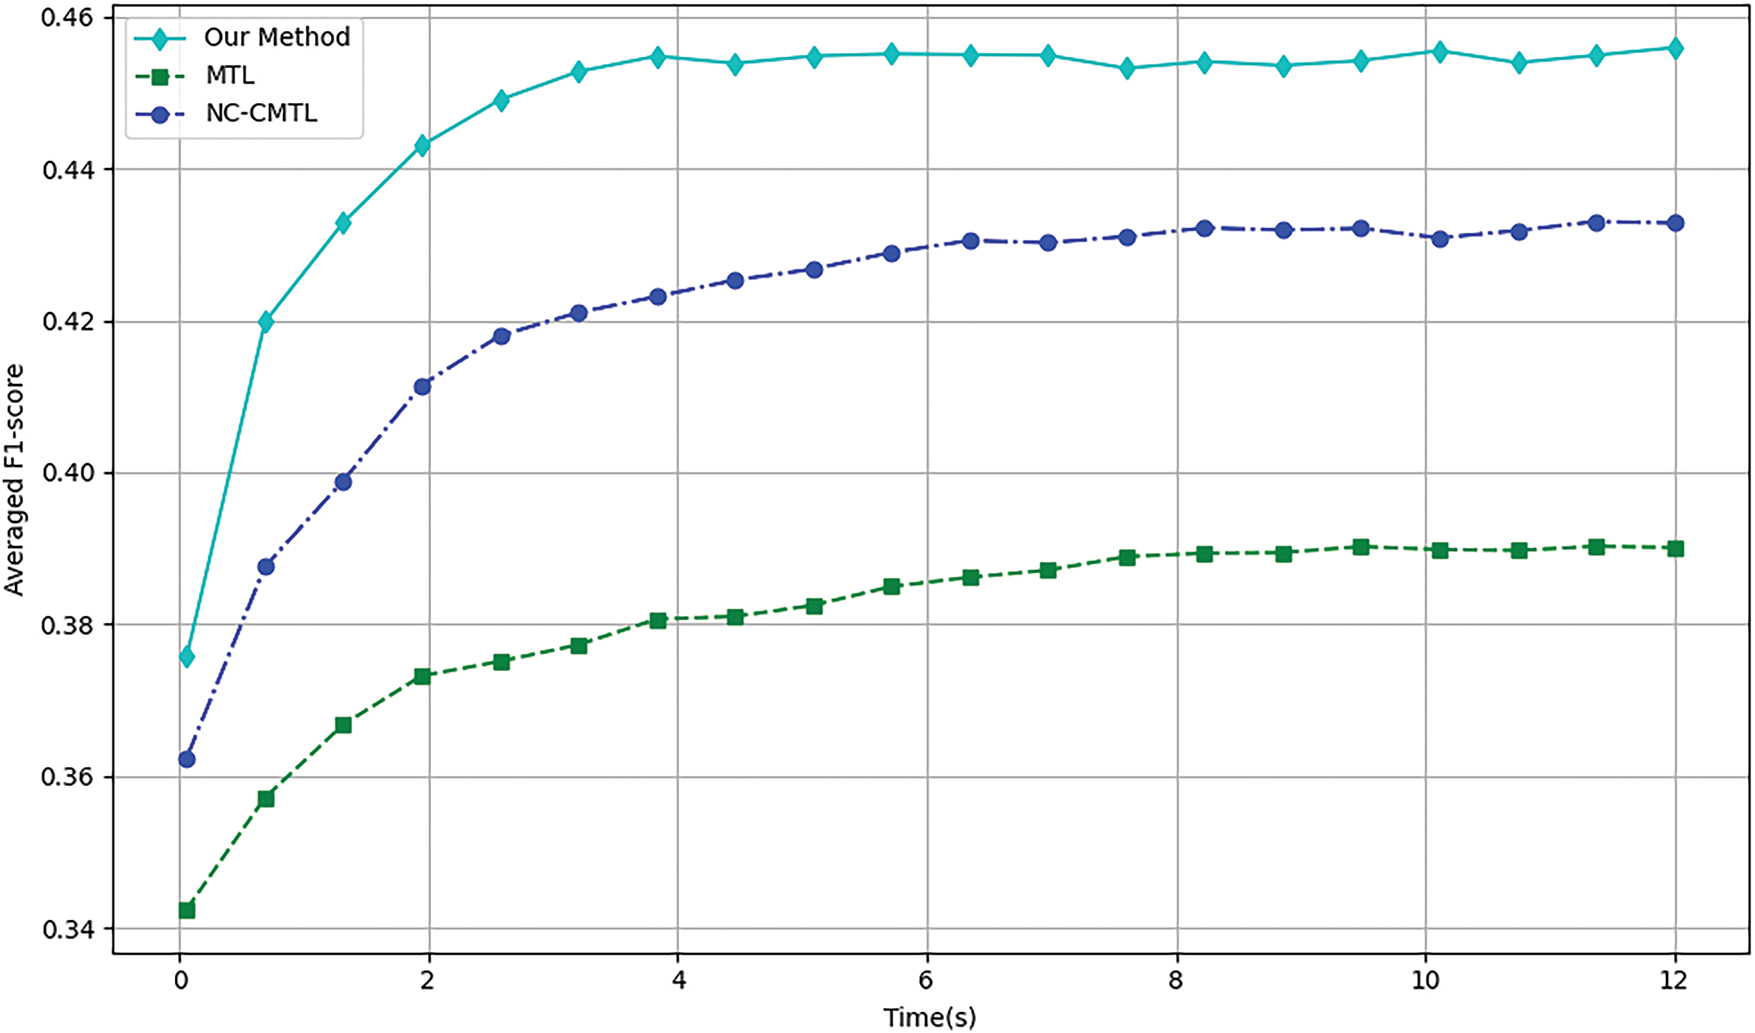
Figure 5: Training efficiency of different methods at 18MaS
We conducted an explainability analysis of the model obtained through multi-task learning in Fig. 6. Since multi-task learning involves multiple tasks, it was necessary to perform explainability analysis for each task individually. At both the 6 and 18MaS time points, predictions were made for six indicators, including mobility, with each indicator having three levels. Considering that predicting mobility is a relatively representative task, we take predicting mobility6 as an example, and we show the characteristics of the top ten SHAP values.
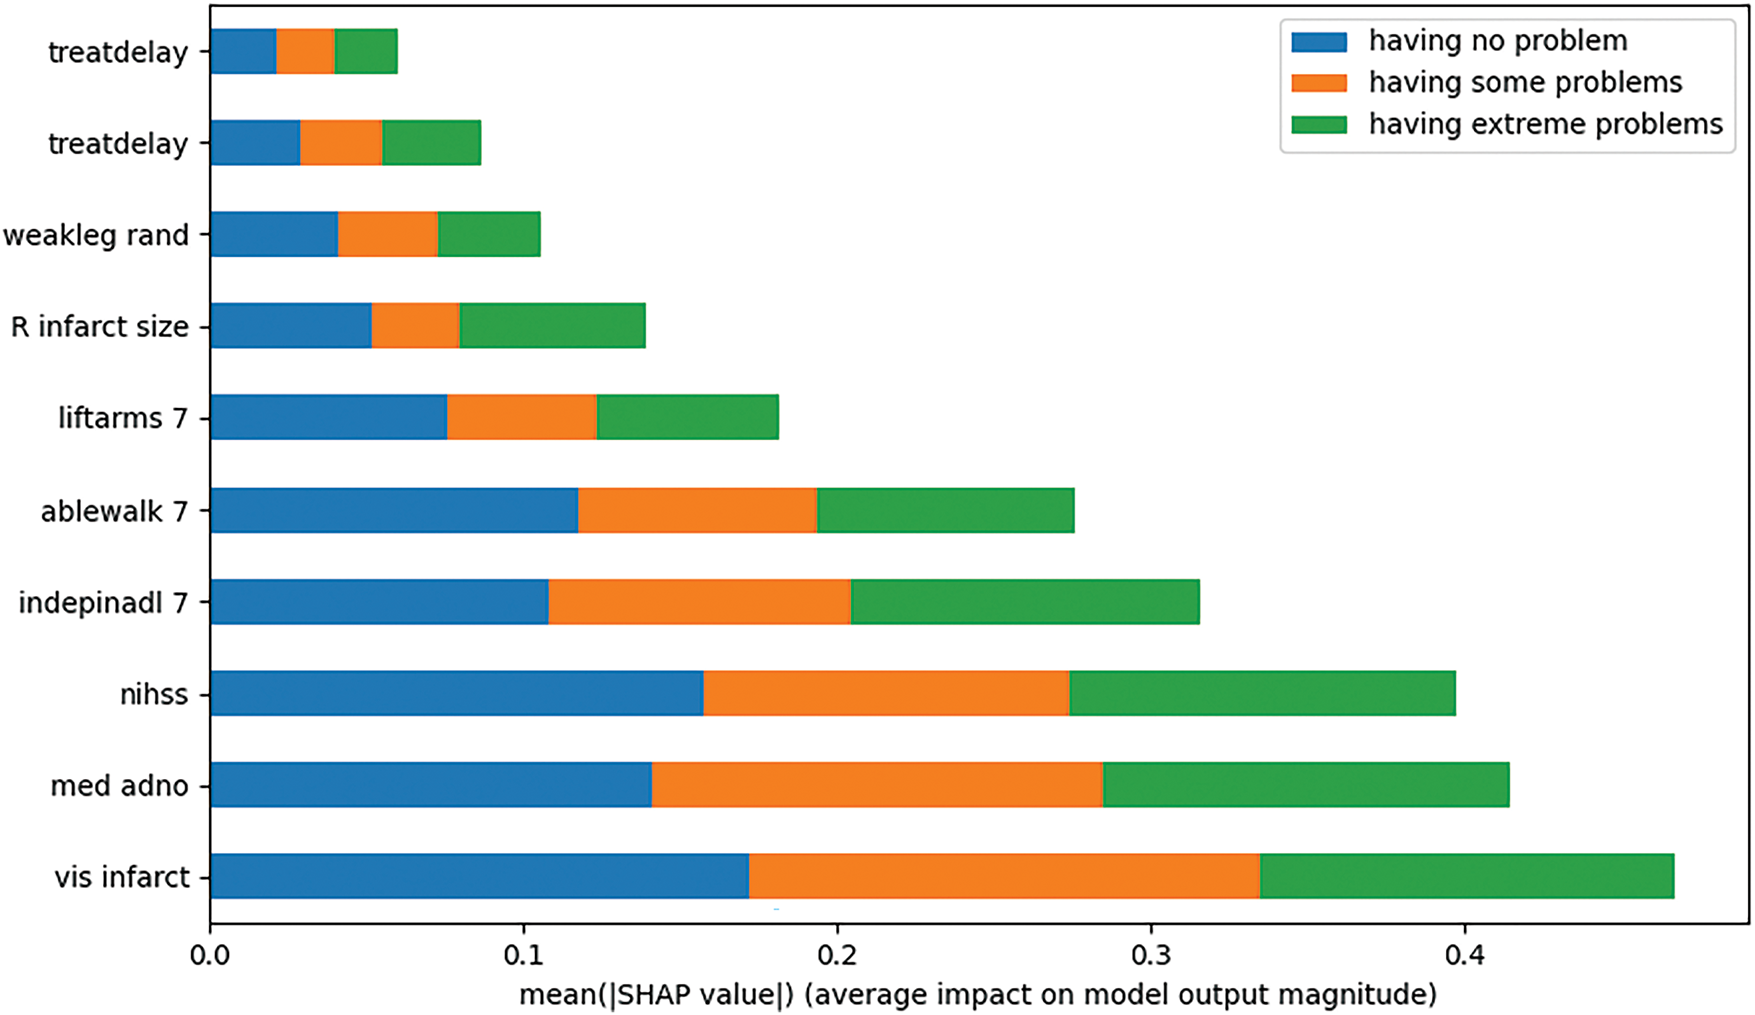
Figure 6: Explainability analysis of mobility prediction at 6MaS
Upon examining the experimental results, we found that, when predicting mobility6, the top ten features with the largest absolute SHAP values were treatdelay, stroketype, weakleg rand, R infarct size, liftarms 7, ablewalk 7, indepinadl 7, nihss, med adno, and vis infarct. The figure illustrates the contribution of each feature to the prediction of mobility6 at specific classifications. The experiments demonstrate that our proposed method effectively provides explainability analysis for the model obtained through multi-task learning.
By observing Fig. 7, we found that high values of vis infarct, med adno, and ablewalk 7 showed significant positive SHAP values and constituted protective predictive factors. In contrast, the “having some problems” category identified nihss, weakleg rand, and treatdelay as core risk markers, with their high feature values strongly associated with negative SHAP values. Notably, in the “having extreme problems” category, high values of R infarct size and low values of ablewalk 7 formed a bidirectional driving pattern, reflecting the synergistic effect of structural damage and functional impairment. This multi-dimensional decision logic, validated by the clustered SHAP distributions across categories, provides an explainable framework for clinical risk stratification in post-stroke mobility assessment.
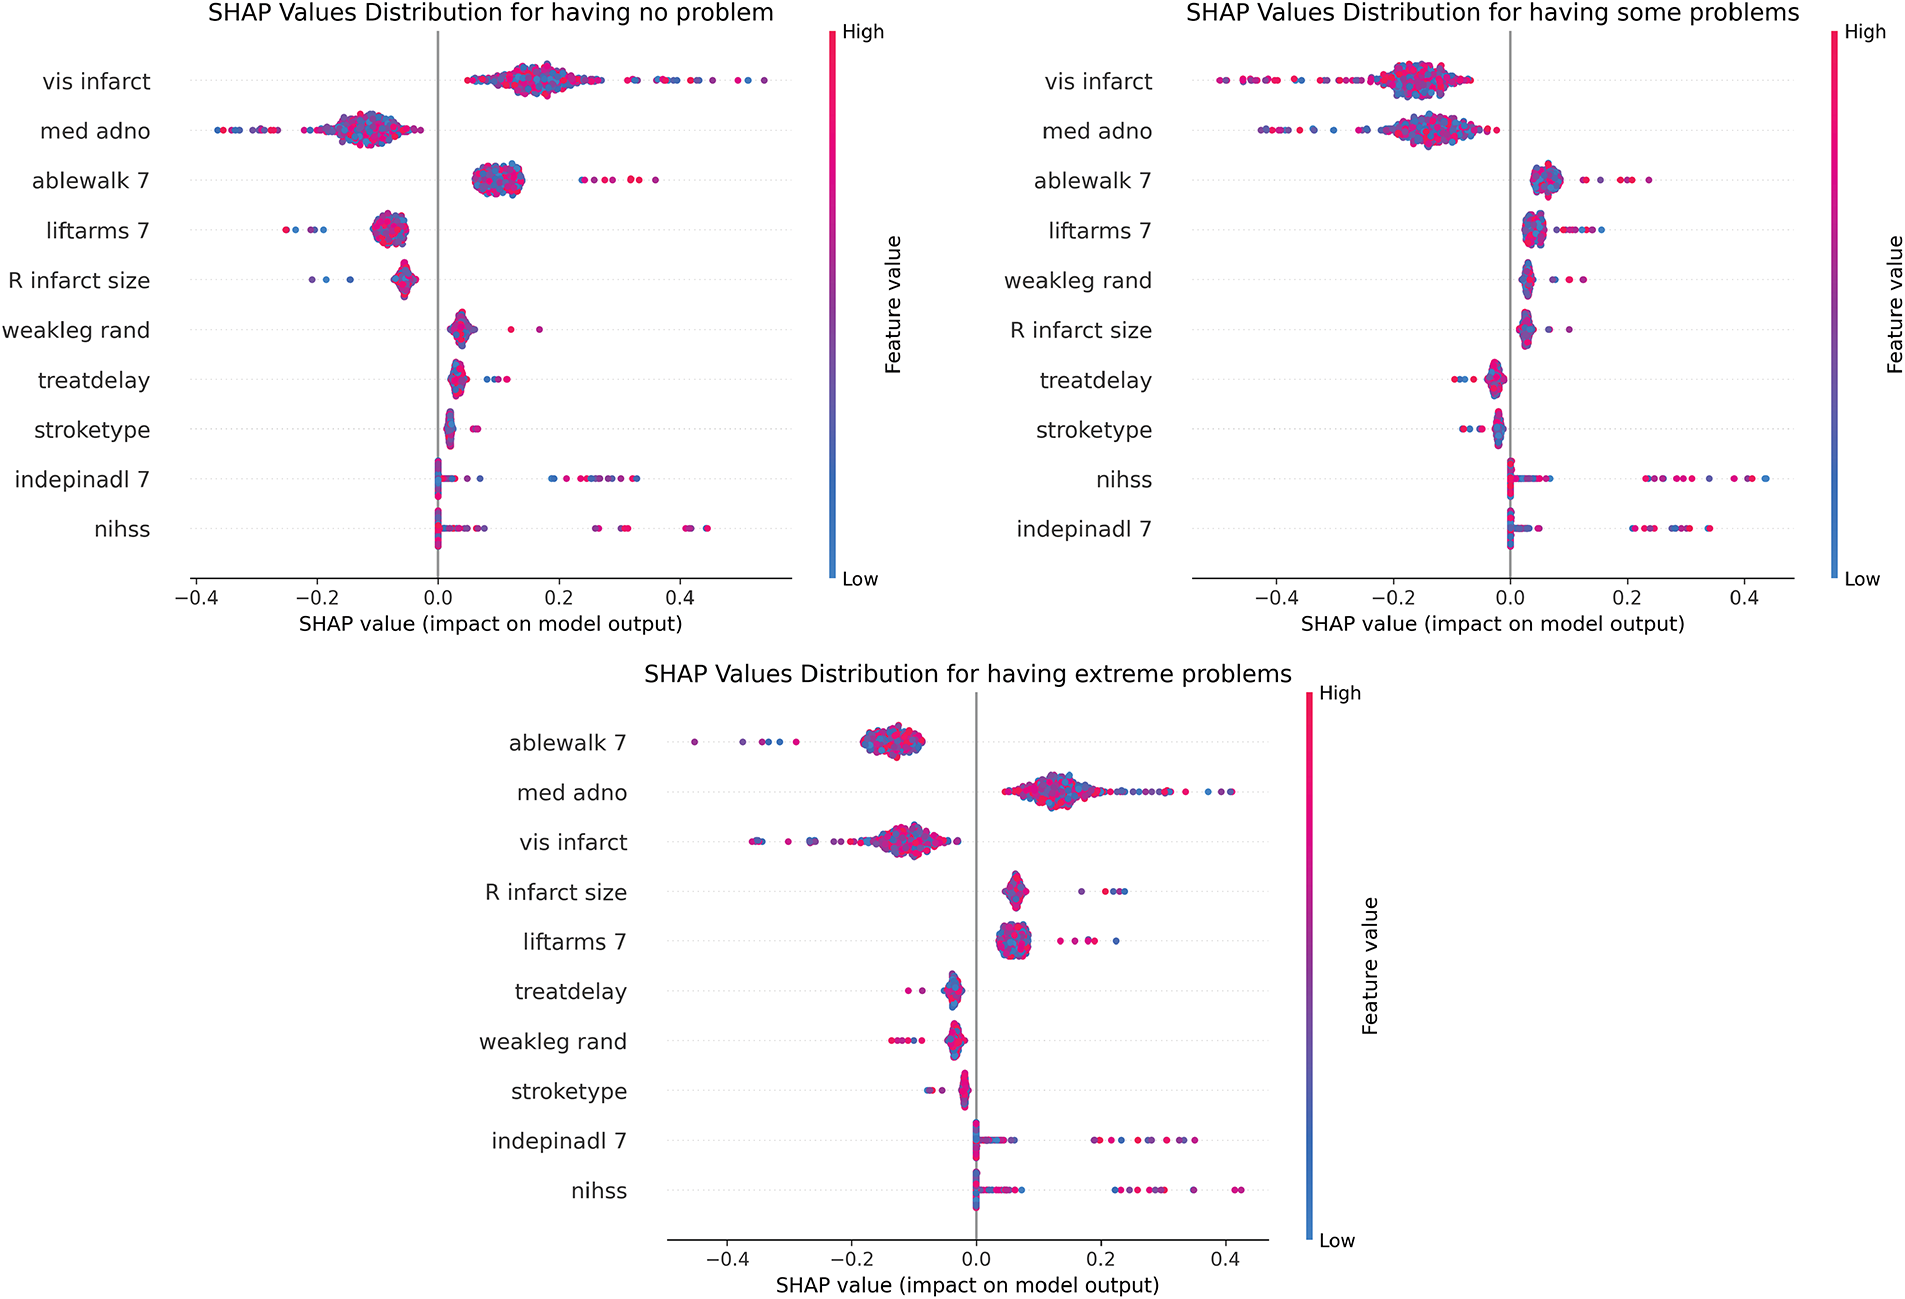
Figure 7: SHAP beeswarm of mobility prediction at 6MaS
Based on the analysis in Fig. 8, in the “having no problem” category, vis infarct, ablewalk 7, and med adno constitute the core of protective prediction through continuous positive contribution; the “having some problems” category shows the synergistic negative drive of treatdelay and nihss, forming a continuous blue gradient band in the sample 200–400 interval, reflecting the cumulative effect of time sensitivity and neurological deficit; while the polarity reversal pattern of R infarct size and ablewalk 7 in the “having extreme problems” category reveals the critical mechanism of structural-functional compensatory imbalance. The global heat map further verifies the robust contribution of vis infarct and indepinadl 7, but med adno shows dose-dependent positive heterogeneity in extreme problems, suggesting that drug intervention has an efficacy threshold effect.
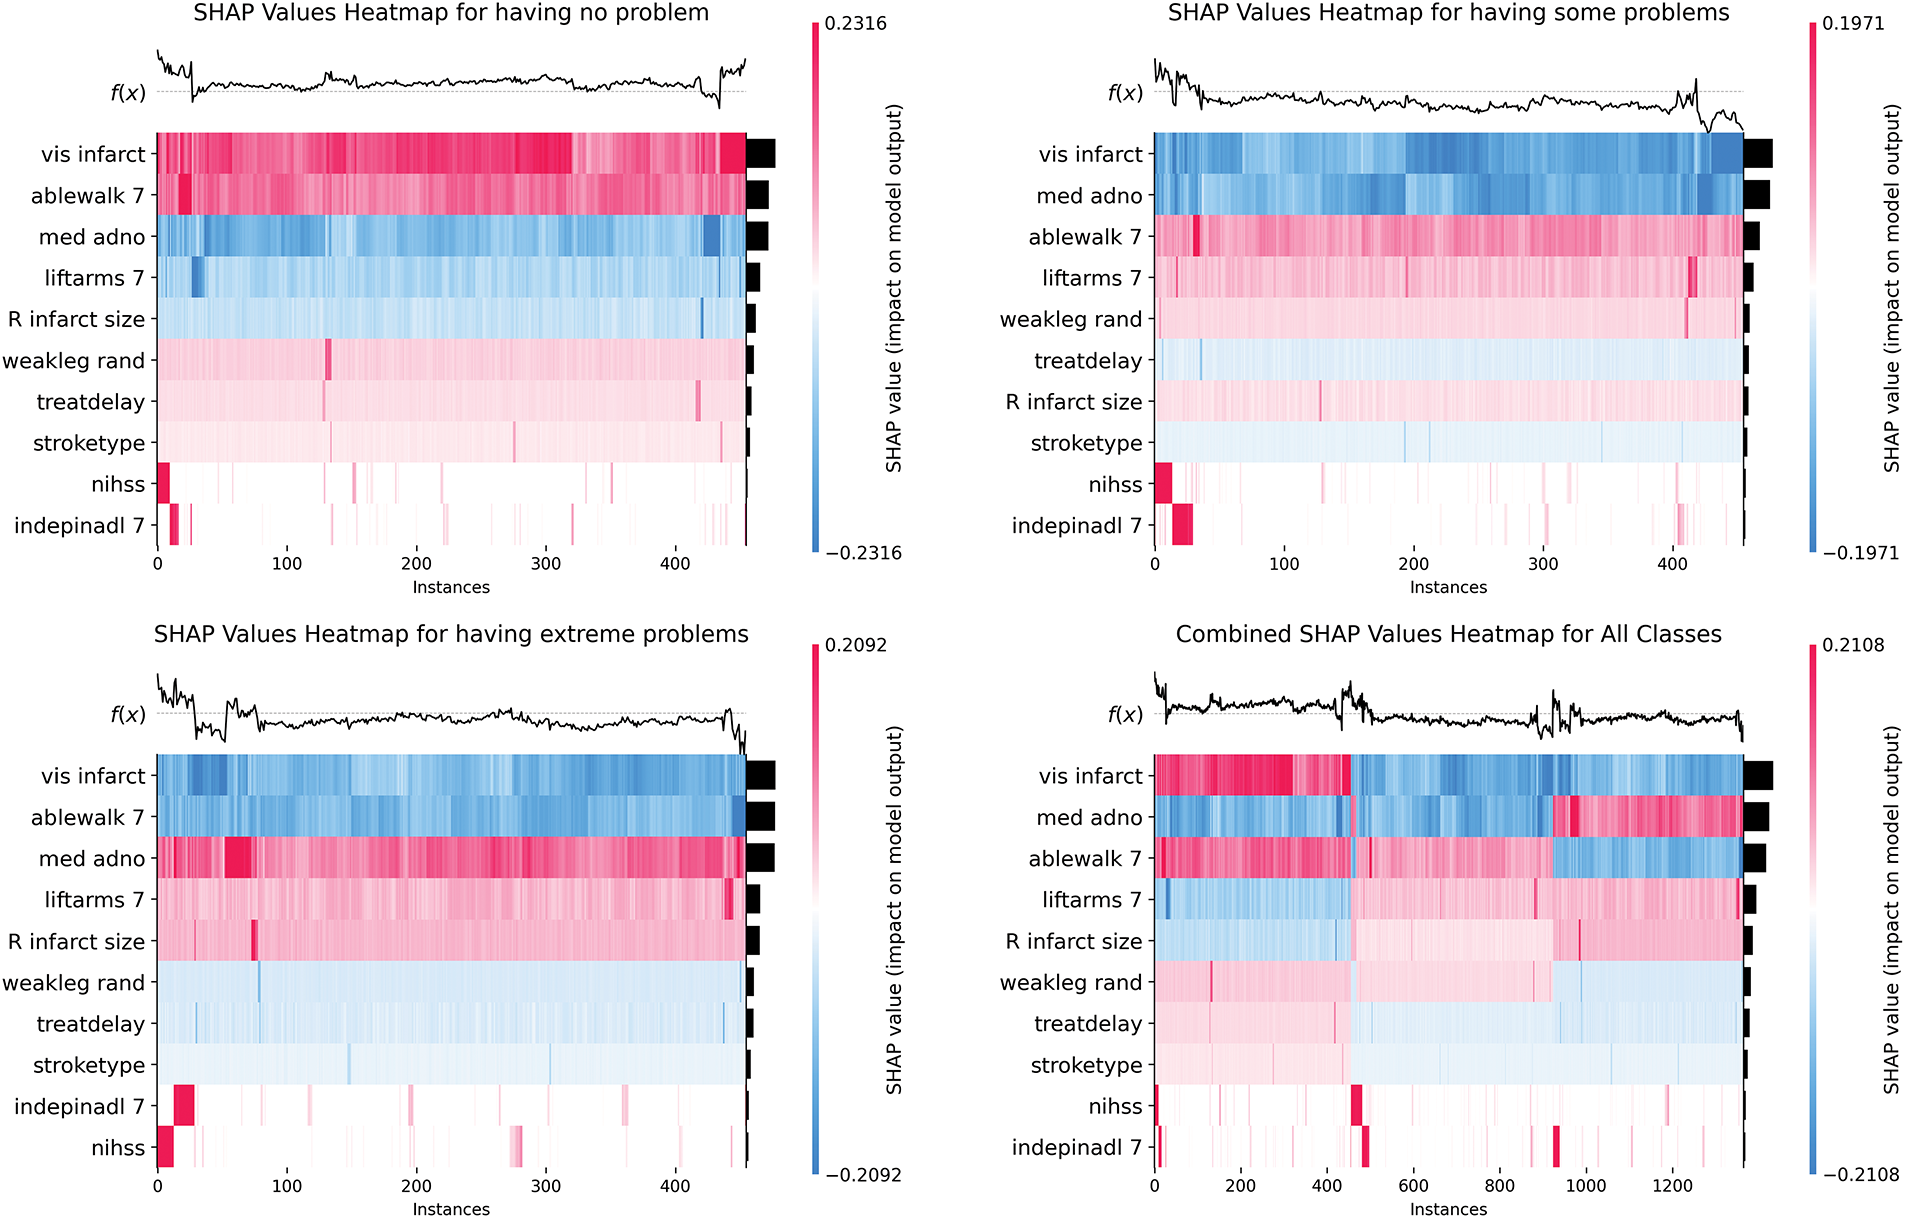
Figure 8: SHAP heatmap plots of mobility prediction at 6MaS
This paper proposes an XAI-MTL method for predicting the health status of stroke patients. First, a comprehensive multi-task learning framework is designed to model multiple health status indicators of stroke patients at a specific time point as a multi-task learning problem. Second, a multi-task AUC optimization algorithm based on adaptive low-rank representation is developed. This algorithm improves the performance of multi-task AUC optimization by removing irrelevant information through a low-rank model structure. The experiments were conducted on the publicly available stroke patient dataset, The Third International Stroke Trial (IST-3), and compared with traditional single-task learning models and existing multi-task learning models. The experimental results demonstrate that our method outperforms the comparison algorithms in key metrics such as F1-score and training efficiency, while SHAP value stability analysis validates the explainability of the model. This study not only improves the accuracy of predicting the health status of stroke patients but also provides interpretable model support for clinical decision-making.
In this study, we propose a multi-task learning (MTL) framework based on explainable artificial intelligence (XAI) for predicting the health status of stroke patients. The methodology primarily focuses on optimizing the training process of the multi-task learning system. Subsequent efforts will target enhancing the explainability analysis of the model to strengthen its clinical relevance, while further improvements in model performance and training efficiency will be pursued to advance the practical utility of the approach.
Acknowledgement: The authors declare that there are no individuals or organizations to acknowledge for their contributions to this research.
Funding Statement: This research was funded by the Excellent Talent Training Funding Project in Dongcheng District, Beijing, with project number 2024-dchrcpyzz-9.
Author Contributions: The authors confirm contribution to the paper as follows: study conception and design: Nan Ding, Jianping Wu; data collection: Xingyu Zeng; analysis and interpretation of results: Nan Ding, Xingyu Zeng, Jianping Wu; draft manuscript preparation: Nan Ding, Liutao Zhao. All authors reviewed the results and approved the final version of the manuscript.
Availability of Data and Materials: The data that support the findings of this study are openly available in the Third International Stroke Trial (IST-3) at https://pubmed.ncbi.nlm.nih.gov/22632908/ (accessed on 16 June 2025).
Ethics Approval: Not applicable.
Conflicts of Interest: The authors declare no conflicts of interest to report regarding the present study.
References
1. Esteva A, Robicquet A, Ramsundar B, Kuleshov V, DePristo M, Chou K, et al. A guide to deep learning in healthcare. Nat Med. 2019;25(1):24–9. doi:10.1038/s41591-018-0316-z. [Google Scholar] [PubMed] [CrossRef]
2. Miotto R, Wang F, Wang S, Jiang X, Dudley JT. Deep learning for healthcare: review, opportunities and challenges. Brief Bioinform. 2018;19(6):1236–46. doi:10.1093/bib/bbx044. [Google Scholar] [PubMed] [CrossRef]
3. Zhang S, Wang J, Pei L, Liu K, Gao Y, Fang H, et al. Interpretability analysis of one-year mortality prediction for stroke patients based on deep neural network. IEEE J Biomed Health Inform. 2022;26(4):1903–10. doi:10.1109/JBHI.2021.3123657. [Google Scholar] [PubMed] [CrossRef]
4. Abououf M, Singh S, Mizouni R, Otrok H. Explainable AI for event and anomaly detection and classification in healthcare monitoring systems. IEEE Internet Things J. 2024;11(2):3446–57. doi:10.1109/JIOT.2023.3296809. [Google Scholar] [CrossRef]
5. Xia T, Dang T, Han J, Qendro L, Mascolo C. Uncertainty-aware health diagnostics via class-balanced evidential deep learning. IEEE J Biomed Health Inform. 2024;28(11):6417–28. doi:10.1109/JBHI.2024.3360002. [Google Scholar] [PubMed] [CrossRef]
6. Hossain S, Chakrabarty A, Gadekallu TR, Alazab M, Piran MJ. Vision transformers, ensemble model, and transfer learning leveraging explainable AI for brain tumor detection and classification. IEEE J Biomed Health Inform. 2024;28(3):1261–72. doi:10.1109/JBHI.2023.3266614. [Google Scholar] [PubMed] [CrossRef]
7. Wang C, Peng Y, Qi S, Chen Y. Machine learning for stroke prognosis prediction: a comprehensive review. Artif Intell Med. 2022;121:102138. [Google Scholar]
8. Caruana R. Multitask learning. Mach Learn. 1997;28(1):41–75. doi:10.1023/A:1007379606734. [Google Scholar] [CrossRef]
9. Zhang Y, Yang Q. A survey on multi-task learning. IEEE Trans Knowl Data Eng. 2022;34(12):5586–609. doi:10.1109/TKDE.2021.3070203. [Google Scholar] [CrossRef]
10. Zhao Y, Wang X, Che T, Bao G, Li S. Multi-task deep learning for medical image computing and analysis: a review. Comput Biol Med. 2023;153(7473):106496. doi:10.1016/j.compbiomed.2022.106496. [Google Scholar] [PubMed] [CrossRef]
11. Huang Q, Shou GL, Shi B, Li ML, Zhang S, Han M, et al. Machine learning is an effective method to predict the 3-month prognosis of patients with acute ischemic stroke. Front Neurol. 2024;15:1407152. doi:10.3389/fneur.2024.1407152. [Google Scholar] [PubMed] [CrossRef]
12. Lee J, Park KM, Park S. Interpretable machine learning for prediction of clinical outcomes in acute ischemic stroke. Front Neurol. 2023;14:1234046. doi:10.3389/fneur.2023.1234046. [Google Scholar] [PubMed] [CrossRef]
13. Bobot M, Hak JF, Casolla B, Dehondt JD, Burtey S, Doche E, et al. Acute and chronic kidney dysfunction and prognosis following thrombectomy for ischemic stroke. Am J Nephrol. 2024;55(3):287–97. doi:10.1159/000536493. [Google Scholar] [PubMed] [CrossRef]
14. Lin CH, Chen YA, Jeng JS, Sun Y, Wei CY, Yeh PY, et al. Predicting ischemic stroke patients’ prognosis changes using machine learning in a nationwide stroke registry. Med Biol Eng Comput. 2024;62(8):2343–54. doi:10.1007/s11517-024-03073-4. [Google Scholar] [PubMed] [CrossRef]
15. Chen J, Chien HNC, Chang YH. Constructing a stroke diagnosis and prognosis system based on the BPN algorithm using Tc-99m-ECD SPECT images. Ann Nucl Med Mol Imaging. 2024;37(1):1–11. [Google Scholar]
16. Abousaber I. A novel explainable attention-based meta-learning framework for imbalanced brain stroke prediction. Sensors. 2025;25(6):1739. doi:10.3390/s25061739. [Google Scholar] [PubMed] [CrossRef]
17. Harutyunyan H, Khachatrian H, Kale DC, Ver Steeg G, Galstyan A. Multitask learning and benchmarking with clinical time series data. Sci Data. 2019;6(1):96. doi:10.1038/s41597-019-0103-9. [Google Scholar] [PubMed] [CrossRef]
18. Cheng A, Zhang Y, Qian Z, Yuan X, Yao S, Ni W, et al. Integrating multi-task and cost-sensitive learning for predicting mortality risk of chronic diseases in the elderly using real-world data. Int J Med Inform. 2024;191(4):105567. doi:10.1016/j.ijmedinf.2024.105567. [Google Scholar] [PubMed] [CrossRef]
19. Bertsimas D, Ma Y. M3H: multimodal multitask machine learning for healthcare. arXiv:2404.18975. 2024. [Google Scholar]
20. Ribeiro MT, Singh S, Guestrin C. “Why should I trust you?”: explaining the predictions of any classifier. In: Proceedings of the 22nd ACM SIGKDD International Conference on Knowledge Discovery and Data Mining; San Francisco, CA, USA: ACM; 2016. p. 1135–44. doi:10.1145/2939672.2939778. [Google Scholar] [CrossRef]
21. Adadi A, Berrada M. Peeking inside the black-box: a survey on explainable artificial intelligence (XAI). IEEE Access. 2018;6:52138–60. doi:10.1109/access.2018.2870052. [Google Scholar] [CrossRef]
22. Lundberg S, Lee SI. A unified approach to interpreting model predictions. arXiv:1705.07874. 2017. [Google Scholar]
23. Rebane J, Samsten I, Pantelidis P, Papapetrou P. Assessing the clinical validity of attention-based and SHAP temporal explanations for adverse drug event predictions. In: 2021 IEEE 34th International Symposium on Computer-Based Medical Systems (CBMS); 2021 Jun 7–9; Aveiro, Portugal: IEEE; 2021. p. 235–40. doi:10.1109/CBMS52027.2021.00025. [Google Scholar] [CrossRef]
24. Sandercock P, Wardlaw JM, Lindley RI, Dennis M, Cohen G, Murray G, et al. The benefits and harms of intravenous thrombolysis with recombinant tissue plasminogen activator within 6 h of acute ischaemic stroke (the third international stroke trial [IST-3]a randomised controlled trial. Lancet. 2012;379(9834):2352–63. doi:10.1016/S0140-6736(12)60768-5. [Google Scholar] [PubMed] [CrossRef]
25. Cobo M, del Barrio AP, Fernández-Miranda PM, Sanz Bellón P, Lloret Iglesias L, Silva W. Multi-task learning approach for intracranial hemorrhage prognosis. arXiv:2408.08784. 2024. [Google Scholar]
Cite This Article
 Copyright © 2025 The Author(s). Published by Tech Science Press.
This work is licensed under a Creative Commons Attribution 4.0 International License , which permits unrestricted use, distribution, and reproduction in any medium, provided the original work is properly cited.
 Downloads
 Citation Tools