
 Submit a Paper
 Propose a Special lssue
 Open Access
ARTICLE

Lightweight and Robust Android Ransomware Detection Using Behavioral Analysis and Feature Reduction
1 School of Electrical Engineering and Computer Science (SEECS), National University of Sciences and Technology (NUST), Islamabad, 44000, Pakistan
2 Department of Software Convergence, Gyeongkuk National University (Andong National University), Gyeongbuk, 36729, Republic of Korea
* Corresponding Authors: Mehdi Hussain. Email: ; Ki-Hyun Jung. Email:
Computers, Materials & Continua 2025, 84(3), 5177-5199. https://doi.org/10.32604/cmc.2025.066198
Received 01 April 2025; Accepted 16 June 2025; Issue published 30 July 2025
 View Full Text
 Download PDF
Abstract
Ransomware is malware that encrypts data without permission, demanding payment for access. Detecting ransomware on Android platforms is challenging due to evolving malicious techniques and diverse application behaviors. Traditional methods, such as static and dynamic analysis, suffer from polymorphism, code obfuscation, and high resource demands. This paper introduces a multi-stage approach to enhance behavioral analysis for Android ransomware detection, focusing on a reduced set of distinguishing features. The approach includes ransomware app collection, behavioral profile generation, dataset creation, feature identification, reduction, and classification. Experiments were conducted on ∼3300 Android-based ransomware samples, despite the challenges posed by their evolving nature and complexity. The feature reduction strategy successfully reduced features by 80%, with only a marginal loss of detection accuracy (0.59%). Different machine learning algorithms are employed for classification and achieve 96.71% detection accuracy. Additionally, 10-fold cross-validation demonstrated robustness, yielding an AUC-ROC of 99.3%. Importantly, latency and memory evaluations revealed that models using the reduced feature set achieved up to a 99% reduction in inference time and significant memory savings across classifiers. The proposed approach outperforms existing techniques by achieving high detection accuracy with a minimal feature set, also suitable for deployment in resource-constrained environments. Future work may extend datasets and include iOS-based ransomware applications.Keywords
Android ransomware is malicious software that hijacks Android devices, preventing access or encrypting files until a ransom is paid. This digital threat has surged, alarming smartphone users globally. It resembles a virtual hostage scenario where cybercriminals seize control, demanding payment for a device or data release. Developments include using complex encryption algorithms, intermittent encryption, and advanced packing to avoid detection by anti-malware tools. Ransomware attacks have transitioned from targeting individuals to high-profile entities such as commercial companies and government agencies, aiming for heightened threats and larger ransom amounts [1]. The introduction of Ransomware-as-a-Service (RaaS) involves non-technical attackers, adding complexity to the attacks. Numerous ransomware incidents have impacted various sectors, resulting in significant financial losses for organizations [2].
The WannaCry attack in 2017 brought ransomware back into focus. It showed how dangerous and profitable ransomware attacks can be [3]. Even though WannaCry only asked for $300, it caused around $4 billion in damages. Since then, many similar attacks have happened, especially during the COVID-19 pandemic. With more people working remotely, they became more vulnerable to cyberattacks like phishing emails. Ransomware has been around since 1989, and over the years, it has become more advanced in how it encrypts data and spreads. It’s now one of the most common types of malware, with experts predicting it will cause over $265 billion in damage by 2031 [4].
The 2024 FBI Internet Crime Report highlights a significant rise in cybercrime. The report recorded losses of $16.6 billion. This is a 33% increase from 2023. Ransomware attacks were seen with a 9% increase compared to 2023 [5]. The Kaspersky report “The Mobile Malware Threat Landscape in 2024” [6] underlines a steep increase in mobile cyber threats. It discloses that attackers have moved to mass-distribution tactics. This trend is observed in both ransomware and banking Trojans. In 2024, attacks recorded globally reached 33.3 million smartphone users. Average monthly malware attacks reached 2.8 million. The Kaspersky Security Bulletin 2024 [7] highlights a 102% global upsurge in mobile threats.
Most studies on Android crypto ransomware detection use high-dimensional feature sets, especially static ones. This makes feature extraction time-consuming and resource-intensive. It also increases computational complexity and memory usage, creating real-time detection challenges. Previous work often struggles to reduce the feature set effectively while maintaining high detection accuracy. Behavioral analysis using dynamic features like network traffic, file changes, and encryption patterns also requires significant resources, which is a challenge in mobile environments with limited power and efficiency. The proposed scheme is multi-stage. It collects data, generates behavioral profiles, and reduces the feature set effectively while keeping detection accuracy high.
The rest of the paper is organized into four sections. Related literature and studies are covered in Section 2. Section 3 explains the proposed methodology. Results and discussions are in Section 4. And Section 5 concludes the study.
Many researchers have worked on static and dynamic analysis to address challenges in the field of malware detection. Khan et al. [8] worked on an approach named DNAact-Ran. The study combined active learning with digital DNA sequencing. Two algorithms, Multi-Objective Grey Wolf Optimizer (MOGWO) and Binary Cuckoo Search (BCS), are used for the selection of features. This scheme, utilizing two algorithms for feature selection, is effective in figuring out important features that can easily discriminate between good and bad Android apps. DNAact-Ran makes digital DNA sequences. Here, it uses k-mer frequency vectors and then encodes the characteristics of ransomware. In this way, active learning enhances accuracy because it queries, iteratively, information instances. This minimizes the cost of annotation and, thus, improves precision. DNAact-Ran shows effectiveness for Naïve Bayes and AdaBoost.
Hossain et al. [9] devise a new method for the selection of features. The study utilizes particle swarm optimization (PSO) for the improvement of detection capabilities. Their method, evaluated using the CICAndMal2017 dataset, demonstrates significant improvements in accuracy, particularly with random forest classifiers for binary detection and decision trees for multiclass classification. This approach not only addresses the challenge of identifying ransomware amidst benign traffic but also contributes to reducing feature overhead by up to 91.95%, illustrating its effectiveness in optimizing detection systems for Android malware.
Aldehim et al. [10] employ Gauss-Mapping Black Widow Optimization using Deep Learning Enabled Android Malware Classification (GBWODL-AMC) in classification. Gauss-Mapping Black Widow Optimization (GBWO) performs the job of selecting features. It reduces the feature set by taking important features. Deep extreme learning machine (DELM) with Ant Lion Optimization (ALO) classifies malware. Results of an experiment performed on the CICAndMal2017 dataset demonstrate 98.95% accuracy. The dataset has 101 samples of ransomware. The study uses benign apps that were collected from 2015 to 2017.
Garg and Baliyan [11] developed a novel framework that maps malicious programs to vulnerabilities because malware exploits vulnerabilities to gain unauthorized access. The authors utilize a two-dimensional matrix approach, leveraging NLP methods like Bag-of-Words (BoW) with n-gram generation of probability and Term Frequency–Inverse Document Frequency (TF-IDF), alongside machine learning including multilayer perceptron (MLP), ripple down rule (RIDOR) learner, SVM and pruning rule-based classification tree (PART). The research, unique in approach, employs extensive datasets comprising 150 malware families and over 48,907 samples, alongside nine major Android vulnerabilities sourced from reputable cybersecurity blogs and databases like Androzoo, AMD, and CICInvesAndMal2019. Data was collected from 2015 to 2019. Only 4% of the samples are ransomware. Results demonstrate MalVulDroid’s robust performance with high accuracy (98.04% in unigrams) and precision, while F1-scores exceed 90%. Another approach by Urooj et al. [12] proposes a model leveraging machine learning algorithms like AdaBoost and SVM, enhanced with ensemble learning techniques. By integrating extensive feature sets extracted through reverse engineering, including permissions, intents, and API calls, the model achieves a good accuracy of 96.24% with a low false positive rate of 0.3%.
Similarly, [13] presents the multi-stage approach for Malware APK Detection Solution (MADS), which integrates lightweight and deep analysis modules to improve detection accuracy while minimizing resource consumption. The lightweight analysis includes specific rule development for identifying phone scams, banking threats, and ransomware, informed by extensive analysis of known malicious behaviors. Two datasets are introduced: the MADS dataset (MD) and the general dataset (GD), tailored for precise threat detection and broader malware identification, respectively. Rigorous dataset curation ensures reliability by filtering out falsely labeled or outdated samples. Performance evaluation reveals MADS achieves high accuracy, with detection rates exceeding 95% for various malware types.
By employing the hybrid analysis method, Ding et al. [14] propose partial optimization in cases where data has multiple features. In static analysis, permissions alongside intent serve as static features, and the selection of features uses three procedures to ascertain a subset. Notably, random forest outperforms other models with a rate of detection of 95.04%, and chi-square proves effective for selecting features. The exploration of critical static features unveils insights into malware characteristics. Dynamic analysis, centered on network traffic sessions across all protocol layers, distinguishes this approach. The Res7LSTM model further classifies samples detected in static analysis. Experimental results showcase high accuracy while using fewer static features and significantly improving classification from 71.48% to 99% by incorporating comprehensive session and protocol layer information in dynamic analysis. The growing diversity of Android malware poses a threat to conventional defense mechanisms, prompting a keen interest in enhancing precision along with detection scalability for smart devices.
Bibi et al. [15] utilize deep learning and Long Short-Term Memory (LSTM) for the detection of malware. One of the critical aspects is the selection of important features. The research employs eight algorithms for this purpose. The study uses CICAndMal2017 as a dataset. Results attain 97.08% accuracy.
A study [16] proposes a lightweight system, RanDetecter, for classification. The system examines operation-related information about malware. It then employs ML for classification. More than 450 samples are evaluated in the study, and the research attains a rate of detection of 97.62%. Results suggest it has the upper hand as compared to conventional detection methods.
In response, Elayan et al. [17] introduce an innovative approach utilizing a Gated Recurrent Unit (GRU). Two crucial static features, Application Programming Interface (API) calls along with Permissions, are mined from apps. The research uses the dataset CICAndMal2017. Results validate the superiority of the deep learning method, attaining 98.2% accuracy and stressing the GRU-based approach for detection, hence, providing a robust defense against contemporary threats in the dynamic Android ecosystem.
Another study [18] introduces a comprehensive framework for Android ransomware detection encompassing three key components. Firstly, novel features specific to ransomware in Android are employed. Secondly, machine learning is utilized for the classification of ransomware and benign applications. Finally, analysis based on comparison is conducted to measure the time taken by models in detection. The proposed approach demonstrates proficiency in detecting lockers as well as crypto-ransomware. Results showcase the framework’s effectiveness, achieving an impressive 99.59% accuracy with Logistic Regression. Notably, the detection time is optimized to 177 ms on the GPU and 235 ms on the CPU, highlighting its potential for swift as well as accurate Android ransomware detection.
The proposed SARVOTAM framework [19] leverages a novel approach for Android malware identification. Utilizing Convolutional Neural Network (CNN), the non-intuitive features are converted into fingerprint images, eliminating the need for manual feature engineering. Experiments with the DREBIN dataset, employing over a dozen combinations of malware image sections, reveal the CNN-SVM model’s superiority, achieving an accuracy of 92.59%. This framework offers a lightweight and precise solution, demonstrating its efficacy in malware identification.
In [20], Wang et al. introduce MalRadar, a meticulously compiled Android malware dataset created from security expert analysis profiles. The dataset, comprising 4534 unique Android malware samples, serves as a representative benchmark. The study delves into malware characteristics and evolution over a decade and evaluates commercial anti-virus engines. MalRadar stands as a valuable resource for mobile security research. Another research explores three System API information usage approaches for ransomware detection [21]. Compared favorably to complex alternatives, these systems demonstrate high accuracy, resilience against obfuscation, and the ability to detect novel samples. The study goes a step further by releasing an on-device detector (R-PackDroid) on the Android platform, employing one of the proposed methodologies.
Introducing a novel framework, the study [22] combines metaheuristics and machine learning. Permissions along with raw sequences of API calls are utilized, and a hybrid of Kernel Extreme Learning Machine (KELM) with Salp Swarm Algorithm (SSA) demonstrates remarkable performance with an accuracy of 98% and a low rate of false positives at 2%. SSA-KELM presents a favorable methodology for detection.
Sharma et al. [23] pioneered the term “RansomAnalysis” to investigate Android ransomware evolution. Analyzing AndroidManifest.xml files for permission extraction, the study compares permissions used by ransomware and benign apps. This analysis provides a valuable understanding of the changing landscape of Android ransomware and, hence, aids in understanding the permissions associated with malicious behavior. Similarly, the study [24] investigates Android ransomware detection approaches, introducing an application programming interface (API)-based ransomware detection system (RDS)—a static analysis paradigm focusing on API packages’ calls. API-RDS outperforms existing solutions with 97% accuracy while reducing the model’s difficulty by 26%. The research contributes to a proactive mechanism based on a unique ransomware dataset and an up-to-date benchmark for Android ransomware research.
Amer and El-Sappagh [25] propose a behavioral Android malware smell predictor model, addressing feature size challenges through feature encapsulation and ensemble classifiers. Leveraging LSTM for sequence analysis, the model demonstrates stable performance with competitive accuracy. The proposed early alarm solution offers a proactive approach to blocking malicious payloads, mitigating the potential cost of future damage.
Bagui and Woods [26] analyze the top ten attributes for various Android ransomware families based on information gain (IG), identifying key network traffic features that differentiate each ransomware type. Attributes like Init_Win_bytes_forward and Init_Win_bytes_backward are consistently significant across multiple families. The study compares three classification algorithms: J48, Naive Bayes, and OneR, using these top attributes. J48 consistently demonstrated superior accuracy, recall, F-measure, and precision, particularly for the Pletor family, while OneR performed the weakest. The research highlights the trade-off between accuracy and execution time as the number of selected attributes is reduced, emphasizing the need to balance performance and computational efficiency in detecting ransomware. The study achieves an accuracy of 94.98% with 52 features using the dataset CICAndMal2017.
Pathak et al. [27] explore a machine-learning method in detection using features that are based on permissions. It highlights the need for better feature selection techniques. The proposed approach uses Gradient Boosting to identify important permissions and reduce the feature set. This reduction improves the time taken in training models. The authors study the comparative performance of classifiers in both full and reduced feature sets. Results show faster execution times with minimal loss in accuracy. This method makes malware detection more efficient while maintaining a strong detection rate of 93.96%.
Rahima et al. [28] focus on the rising threat of Android ransomware, which can block access to data and extort payment from victims. It presents a new feature selection method utilizing Hamming distance in ransomware detection while making use of static analysis. The detection process consists of a few phases: feature extraction, feature selection utilizing binary feature vector creation, and classification. A tool is created using Python to help automate the extraction from apps. The method is evaluated in machine learning and deep learning techniques, achieving an accuracy of 99% in detection using classifiers like Random Forest and Decision Tree. This approach improves ransomware detection and aims to reduce future attacks on Android users.
This [29] study tackles the problem of detecting Android malware by introducing a feature selection framework that targets important permissions. It employs t-tests and logistic regression to find key features and uses multivariate regression for validation. The study creates models utilizing some ensemble methods along with a neural network, analyzing 500,000 Android apps. The results reveal that models using the selected features achieve a 98.8% detection accuracy, which is better than those that consider all extracted features, showing improved malware identification. The proposed model [30] combines deep learning for detection and secure cloud storage using a secret key. Features are extracted from APK files, with optimal features identified through Squirrel search optimization. An adaptive AlexNet classifier detects malware, and non-malicious data is stored securely using a hybrid cryptographic model.
Kirubavathi and Anne [31] address the growing threat of Android ransomware, which encrypts user data and locks access to devices. It reviews current detection methods and concludes that combining static behavior analysis with machine learning improves accuracy. The proposed model uses multiple algorithms tested on the dataset of Kaggle, having 331 Android app permissions and including 199 ransomware samples. It achieves a detection accuracy of 98.05%. The study [32] presents Weapon, a mechanism designed to recognize threats at the pre-operational stage in Android systems. Unlike existing methods that analyze behavior after infection, Weapon extracts key features from behavioral features of APK files, like permissions and API calls, to generate semantic features. It uses the MITRE Adversarial Tactics, Techniques, and Common Knowledge (MITRE ATT&CK) framework to relate these features for early detection. Experimental results show that Weapon successfully identifies 89.82% of ransomware samples before they become operational.
Ngirande et al. [33] address Android ransomware, which encrypts personal data to extort money from victims. The project proposes a hybrid analysis approach using the SVM algorithm for detection, highlighting its limited application in ransomware analysis. This makes use of datasets CICA and Mal 2017 and includes static feature permissions along with API calls, as well as dynamic features such as network activities. Xiong and Zhang [34] address the increasing security threats to Android devices, which are popular targets for malware. Traditional antivirus solutions struggle to detect new or modified attacks. This study proposes a multi-model fusion approach that combines several machine learning models to enhance accuracy in detection. Test results prove the combined method works better than single models. Li et al. [35] proposed a malware detection model using heterogeneous graph embeddings. It captures complex links between software entities. The method handles class imbalance well and achieves high accuracy. This shows the strength of graph-based approaches in malware detection.
Similarly, [36] proposes a hybrid method that uses blockchain, behavioral analysis, and signatures. Methods that combine static and dynamic analysis have not only high computational overhead but also show strong potential for false positives at a very high rate [37]. The study [38] shows that AdaBoost outperforms others in identifying obfuscated malware while incorporating a hybrid approach for the selection of features. Meanwhile, recently, [39] analyzes the attack sequence of Clop ransomware, [40] presents a case study of a real-world ransomware incident in the energy sector, and [41] explores evaluation metrics and testing methodologies for comparing machine learning models.
The literature review reveals that while existing ransomware detection techniques are generally effective, several limitations remain, particularly in the realm of behavior-based analysis using a reduced feature set. A common issue is the evaluation of outdated or imbalanced datasets, often with a limited number of ransomware samples. Furthermore, there is a noticeable gap in optimizing these techniques for reduced computational overhead and resource efficiency. Most current methods employ extensive feature sets for detection, with limited effort directed toward feature reduction strategies that preserve detection accuracy. Therefore, there is a need to propose an effective strategy for ransomware detection while considering the above issues. In the next section, the proposed methodology targets to address these limitations.
The proposed method involves a stepwise process comprising data collection, behavioral profile generation, dataset creation, feature set reduction, and classification of Android applications based on their nature, as shown in Fig. 1.
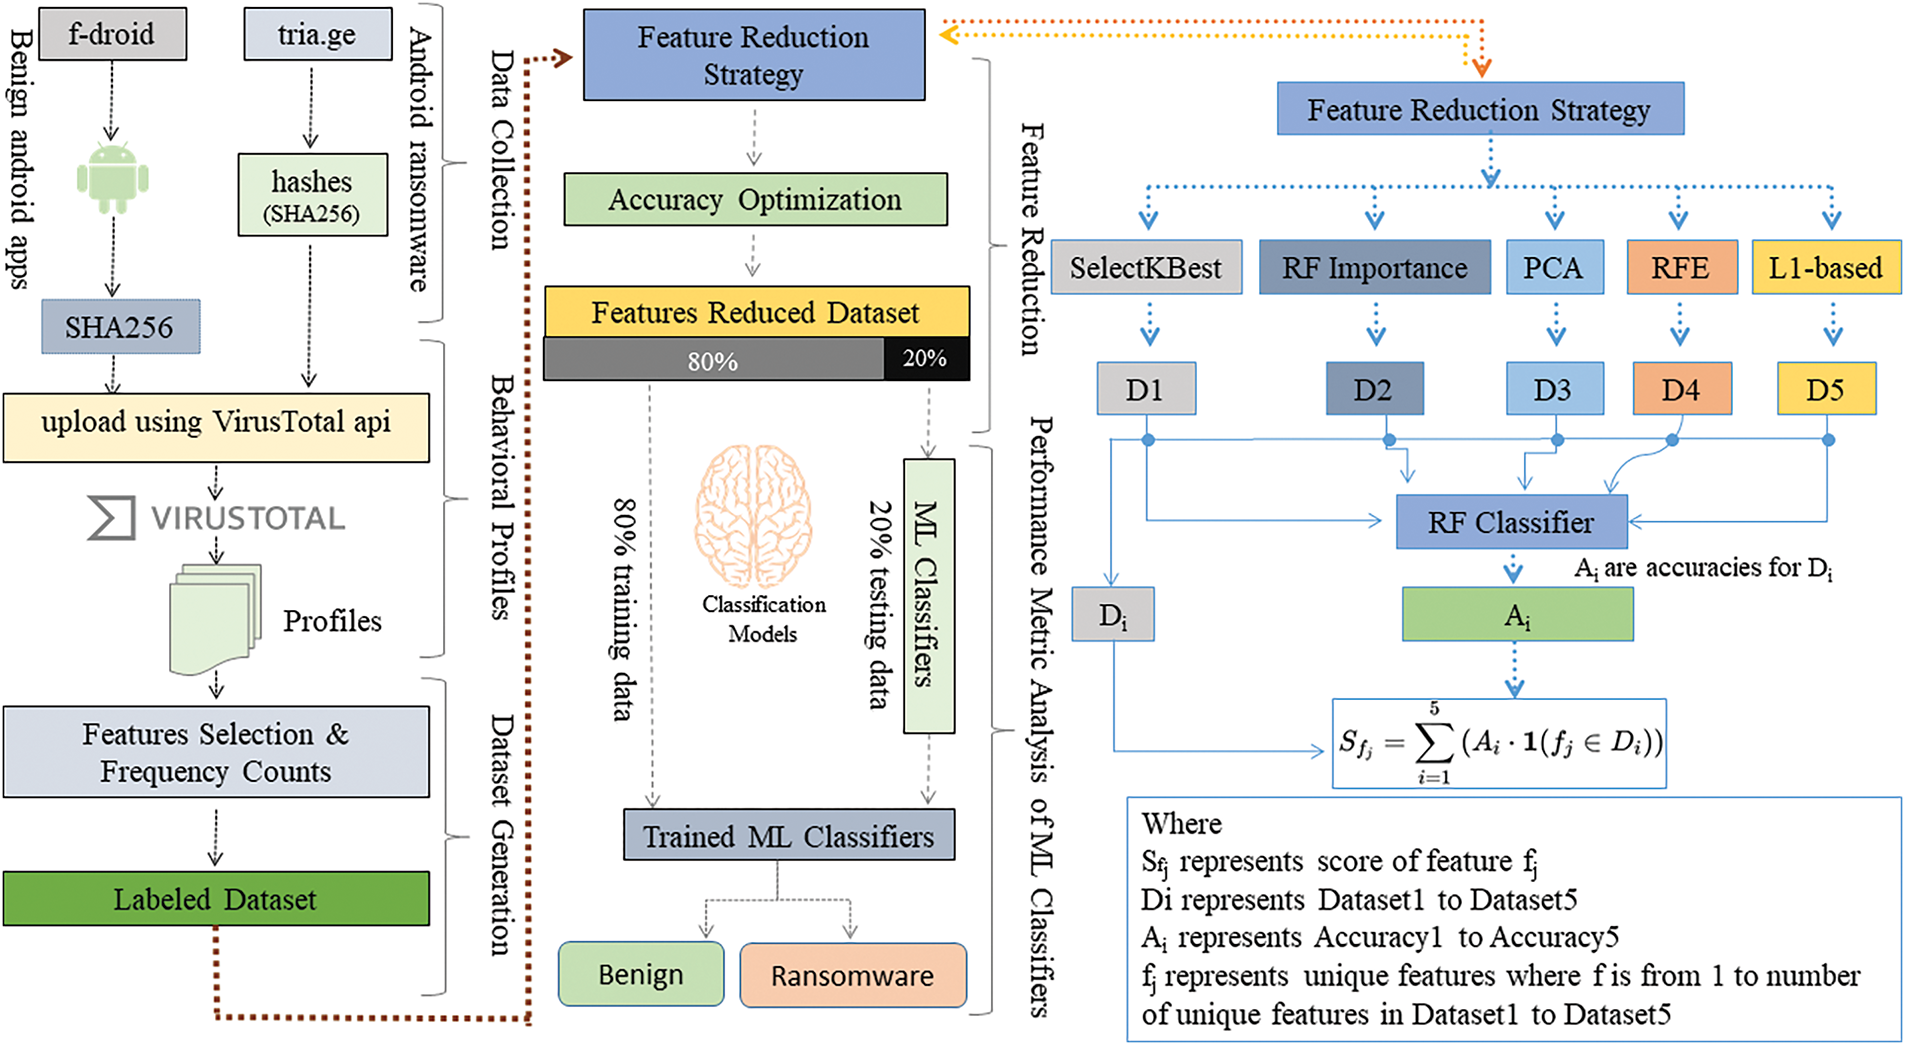
Figure 1: Proposed research flow diagram
Initially, a collection of benign applications is curated from the “F-Droid” repository. Subsequently, SHA256 hashes of these apps are calculated, and the resultant hash values are stored in a CSV file for further analysis. The labeled dataset, encompassing features from both benign and ransomware applications, is fed into machine learning classifiers. The classifiers are trained and tested using an 80:20 split of the dataset. This process aims to equip the classifiers with the ability to discriminate between benign and ransomware applications based on important features.
To assess the efficacy of the proposed method, performance metrics are calculated and plotted. This involves an assessment of the classifiers’ accuracy, precision, recall, and F1 score. The visual representation of these metrics provides insights into the method’s overall performance in accurately classifying Android applications, contributing to the understanding and enhancement of cybersecurity measures. The proposed methodology is shown in Fig. 1.
In this phase, 3346 samples are collected. Fifty percent of the samples are benign Android applications that are collected from the ‘f-droid.org’ repository. Similarly, ransomware applications are not directly available for download. However, their hashes are collected from tria.ge. The hashes of Android ransomware applications are collected using the search keyword ‘tags: ransomware AND tags: android AND score: 10 OR score: 9 OR score: 8 OR score: 7ˆ. The score of these malicious apps is greater than (06) six. The benign applications are from the categories of security, navigation, science & education, money, graphics, connectivity, sports & health, internet, system, reading, theming, time, development, multimedia, games, phone & short message service (SMS), and writing.
3.2 Behavioral Profile Generation
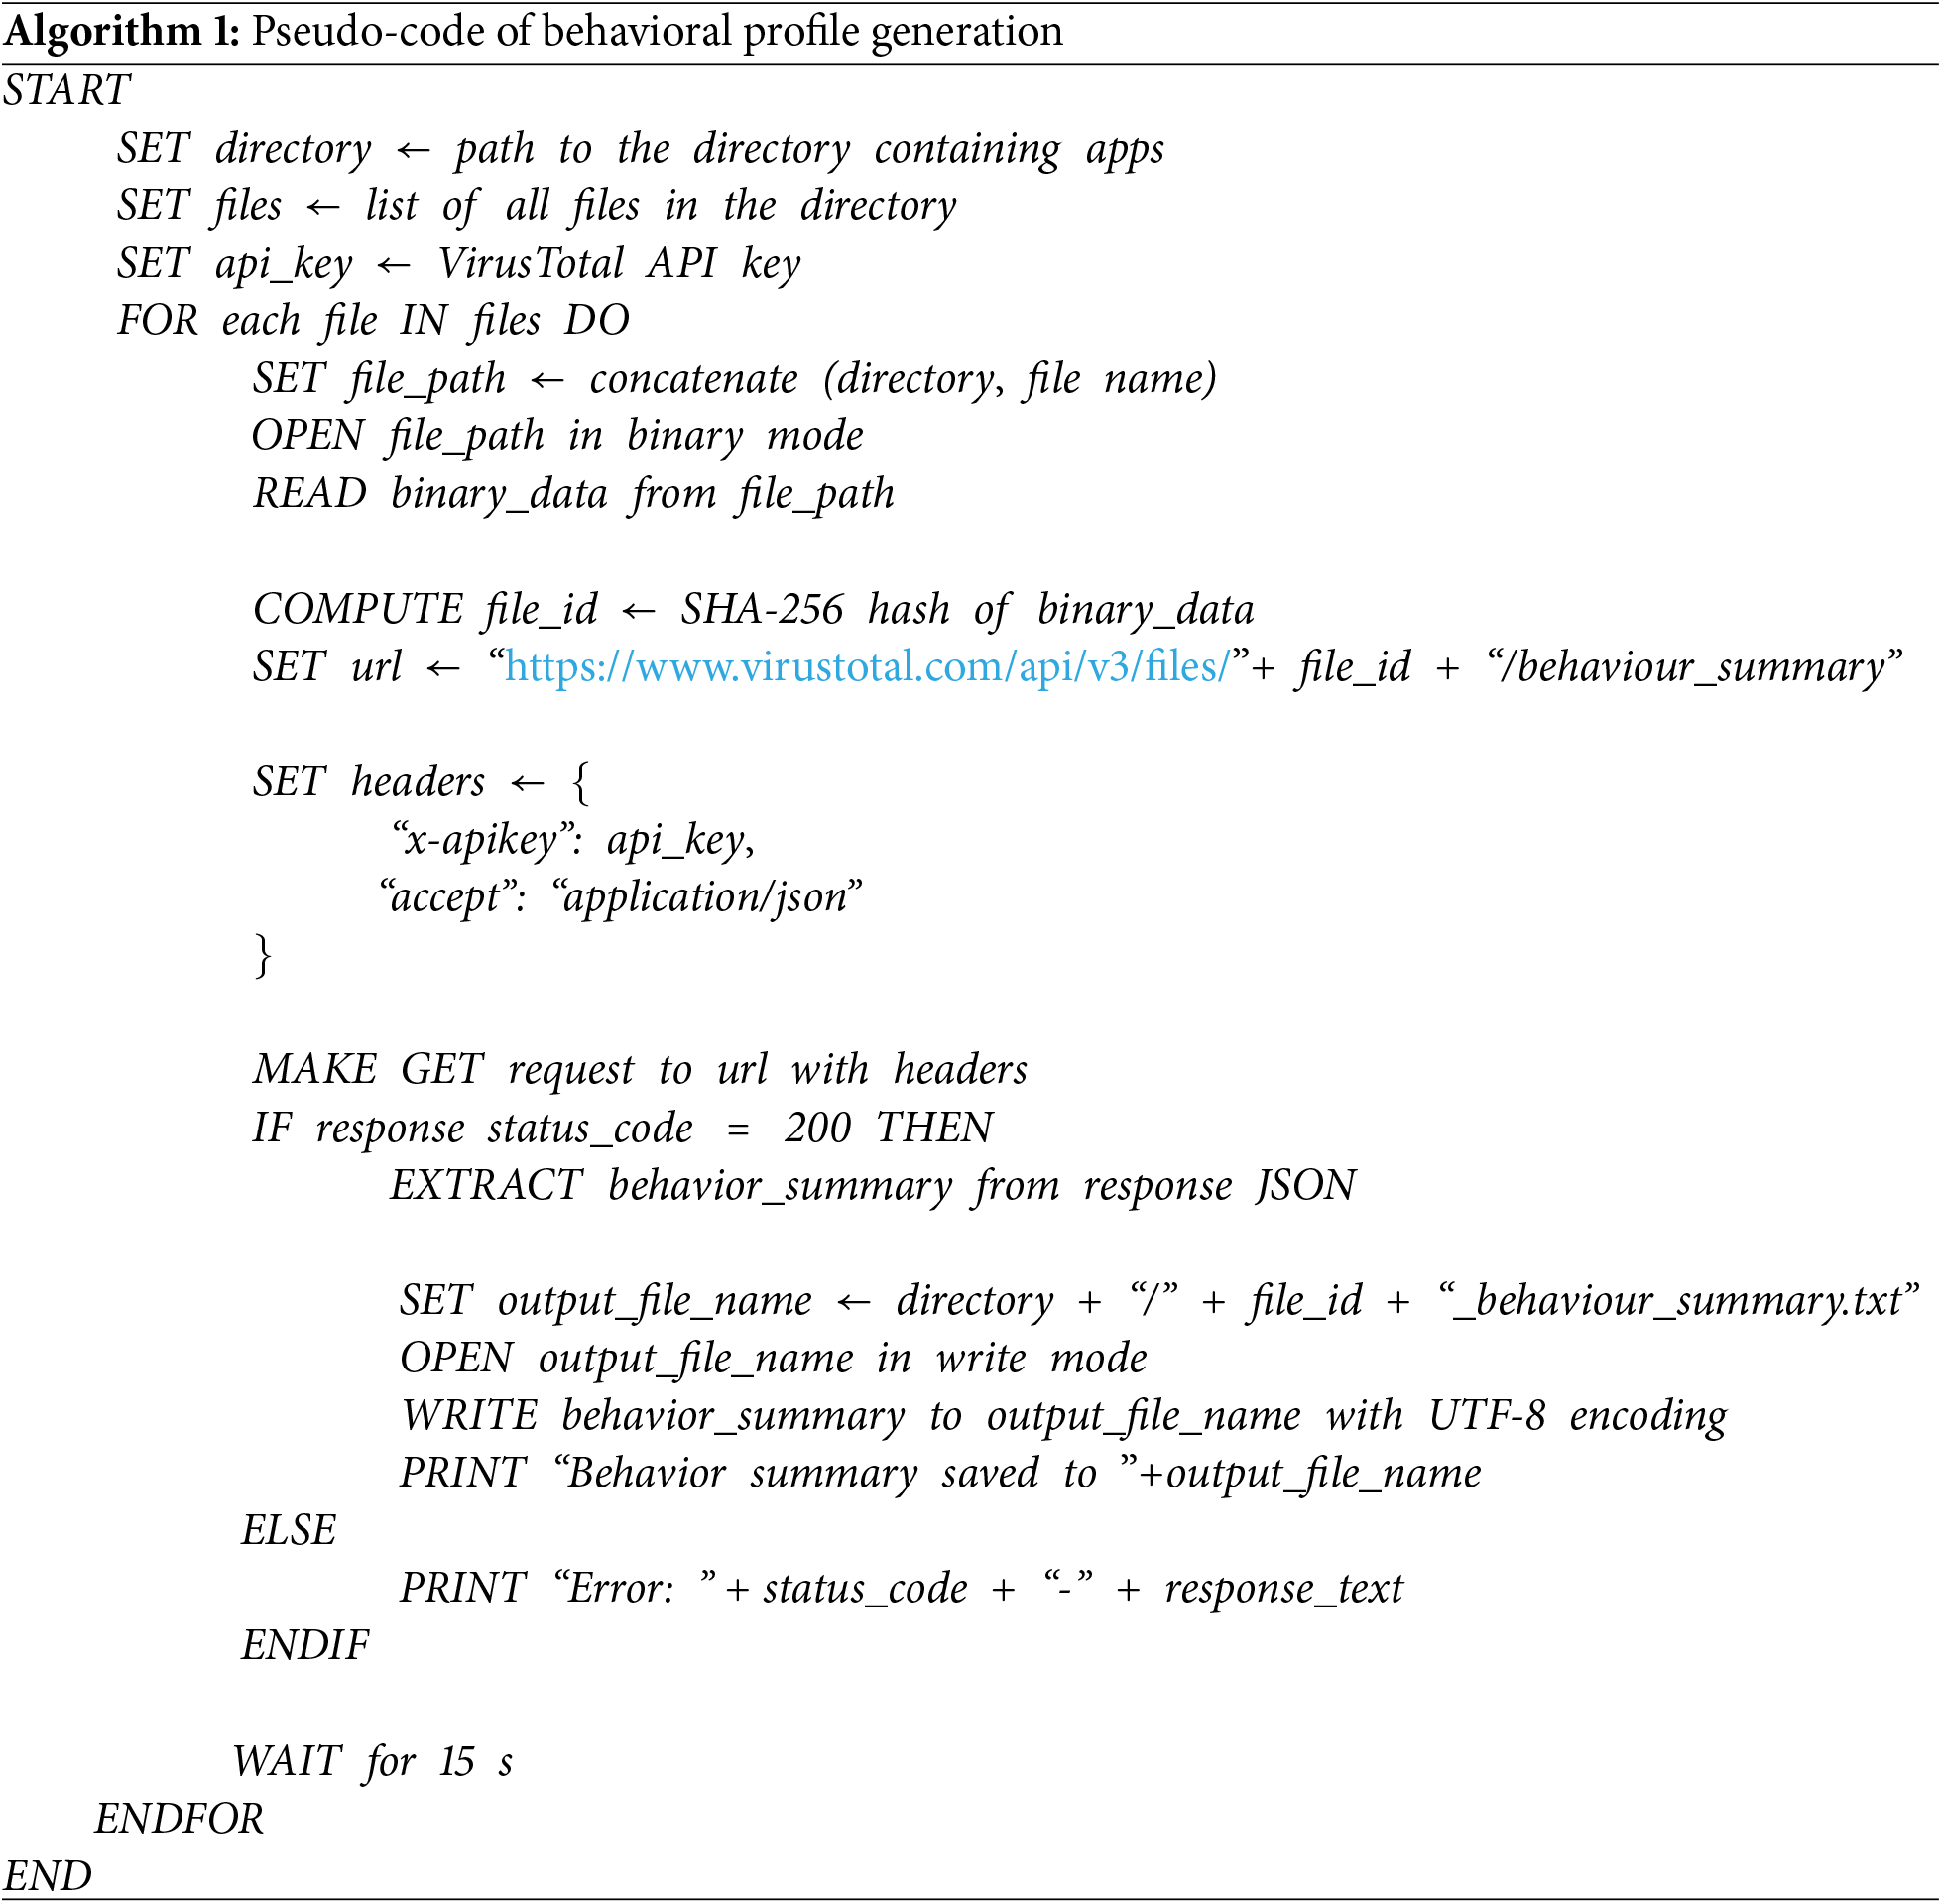
The VirusTotal API is used to retrieve behavior summaries for a list of benign apps located in a specified directory. The same process iterates through each app in the directory, computes its SHA256 hash, and then queries the VirusTotal API for the behavior summary using the file’s hash. The API key for authentication is included in the script. If the API request is successful (status code 200), the behavior summary is saved to a file in the same directory with the format ‘{file_id} behaviour_summary.txt’. In case of an error, the error message with the HTTP status code and response text is printed. Additionally, there’s a delay of 15 s between API requests to comply with rate limits. This provides a systematic way to analyze and store behavior summaries for files using the VirusTotal API.
The study again uses the VirusTotal API to retrieve behavior summaries for a list of Android ransomware hashes stored in a CSV file. The hashes are read from the specified CSV file, construct the corresponding file IDs in hexadecimal format, and send requests to the VirusTotal API. The API key for authentication is used in the process. The pseudo code of the above proposed strategy is shown in Algorithm 1.
The behavioral profiles are read using regular expressions to extract and count occurrences of features. Initially, 174 features are extracted from the behavioral profiles. The process of extracting the features is automated. It iterates through files in a specified directory, applies the function to each file, and appends the feature counts to a CSV file named ‘dataset_ransomware.csv’ in case of behavioral profiles of ransomware. The CSV file is opened in append mode, and the counts for each feature are written as a row in the CSV file. This is designed for analyzing and extracting feature counts from files in a directory, providing a way to create a dataset for further analysis or machine.
3.4 Feature Set Reduction Strategy
For feature reduction, we employed five algorithms: SelectKBest, Recursive Feature Elimination (RFE), L1-based selection, Principal Component Analysis (PCA), and Random Forest (RF) Importance. Each algorithm was selected for its unique way of assessing feature importance. SelectKBest uses statistical relevance. RFE applies recursive model-based selection. L1 regularization promotes sparsity and interpretability. PCA captures variance through orthogonal components. Random Forest ranks features based on their ability to reduce uncertainty. This mix ensures both statistical and model-based views. It improves robustness and reduces method-specific bias. In the first phase, each method identifies the 35 most significant features, resulting in five distinct reduced feature sets. In the second phase, a Random Forest classifier is trained and tested on each of these five reduced feature sets to evaluate the model’s accuracy for each reduced dataset. In the third phase, a final dataset is constructed by combining the five reduced feature sets from the first phase, considering the accuracy scores obtained in the second phase. Our focus was on the frequency of each feature’s occurrence and the accuracy of the models utilizing them. Finally, the features are ranked in ascending order based on their relevance.
The feature reduction methodology in this study uses a structured approach to find important features for improving model performance. We start with five different feature reduction methods: SelectKBest, Recursive Feature Elimination (RFE), Principal Component Analysis (PCA), L1-based regularization, and Random Forest feature importance.
SelectKBest selects features based on statistical tests. RFE removes the least significant features by assessing the performance of models. PCA decreases dimensionality by converting features into orthogonal components that record maximum variance. L1-based regularization, like Lasso, selects features by penalizing those with small weights. Random Forest ranks features by their importance in reducing impurity.
We then use each set of reduced features to train a Random Forest classifier and measure its accuracy. This step validates the importance of the selected features in practice. They combine results from all five methods to get a consensus on feature importance. This consensus, along with accuracy scores, helps to rank the features. Finally, the top 35 features are selected from the actual 174. This method ensures that the selected features are both highly relevant and efficient for the model. Random Forest classifier is trained using feature sets reduced by methods other than its importance ranking. This approach ensures that the features’ effectiveness is tested in a broader context, which reduces the risk of overfitting specific to the Random Forest model used for feature importance.
Using a consensus approach of feature importance across multiple methods dilutes potential biases and the risk of overfitting. Features that consistently rank as important across different techniques are more likely to be genuinely valuable, rather than being artifacts of overfitting. Thus, the methodology is designed to ensure that the selected features are generally useful and not just tailored to a specific model.
From Fig. 2, the feature reduction strategy, the features that showed up the most across methods were given priority. We also favored features that contributed to higher accuracy, especially those selected by RF Importance and RFE, which had the best performance. The final list includes consistently important features, ensuring they are reliable and relevant for the model. In the process, a specific set of features, as shown in Fig. 3, has been carefully chosen to represent the behavior of apps. These selected features cover a collection of activities and interactions, providing a comprehensive view of an application’s actions.
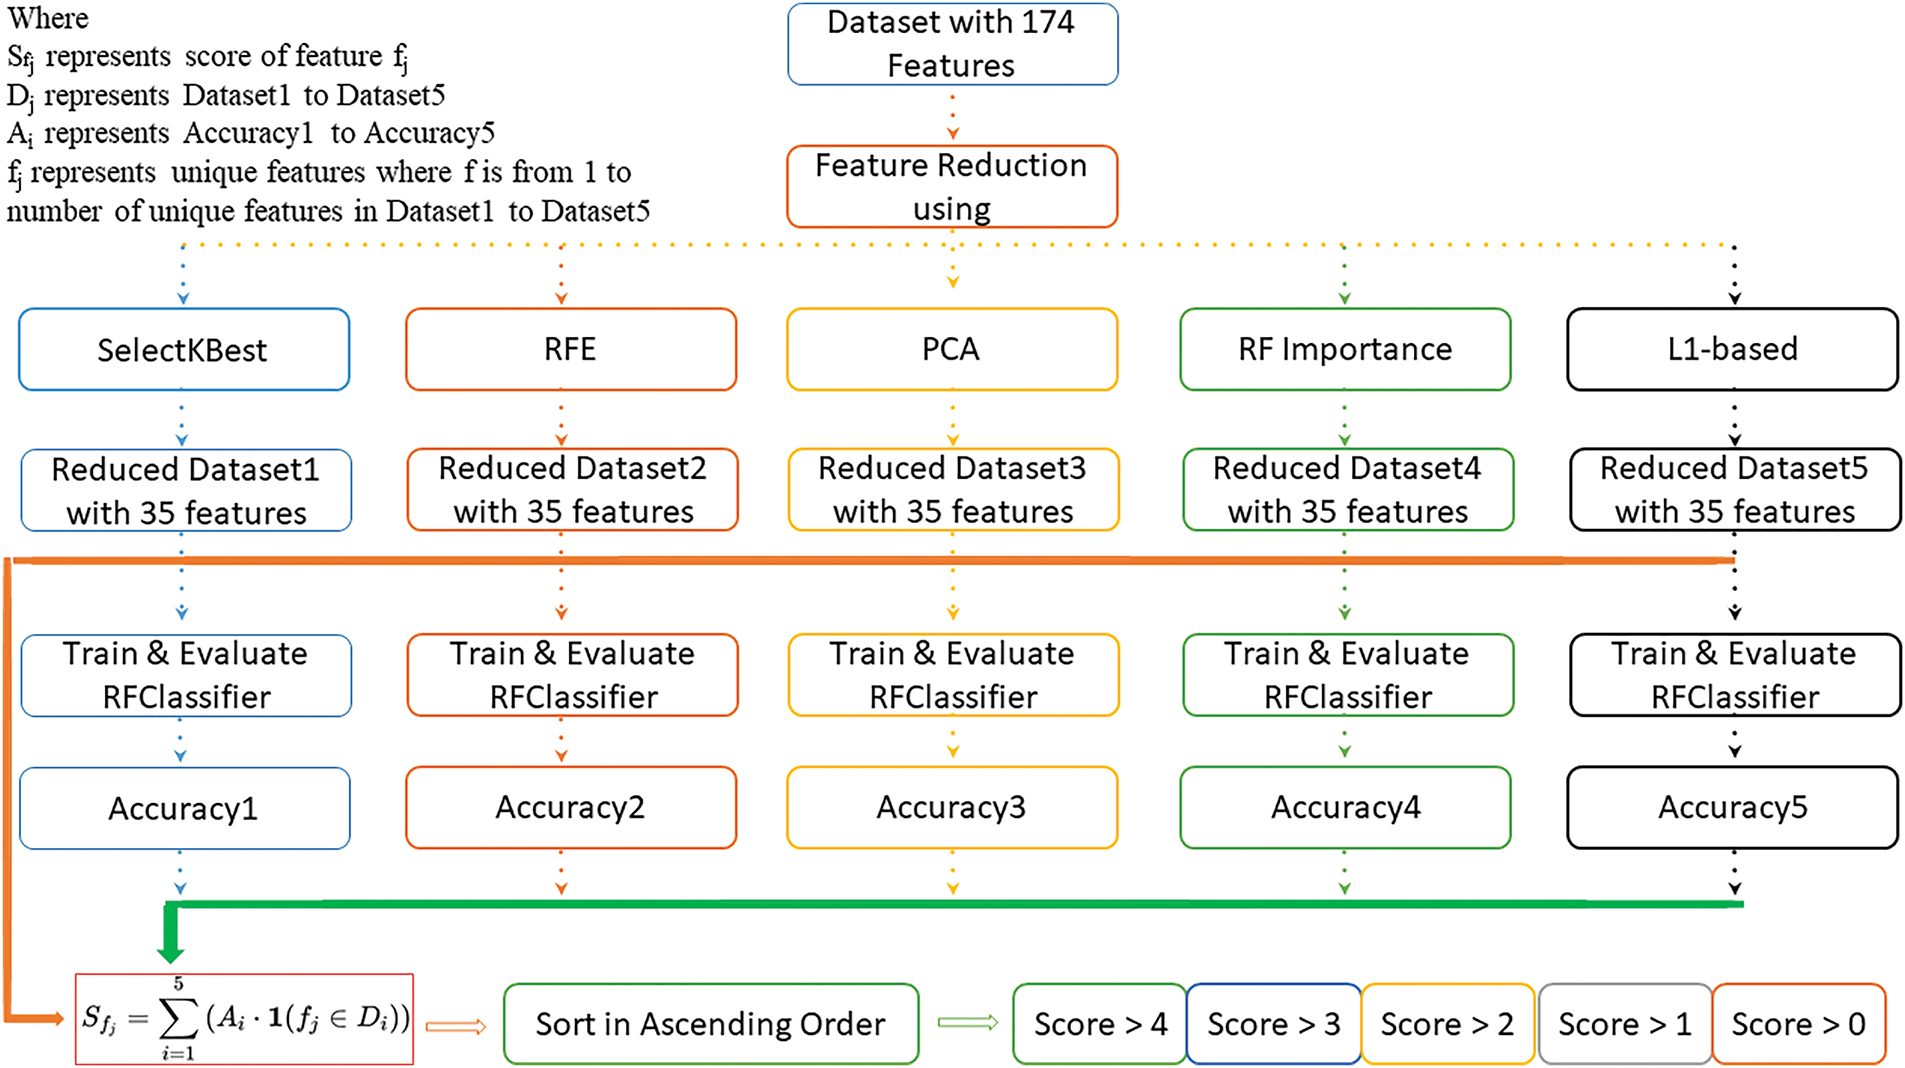
Figure 2: Feature reduction strategy
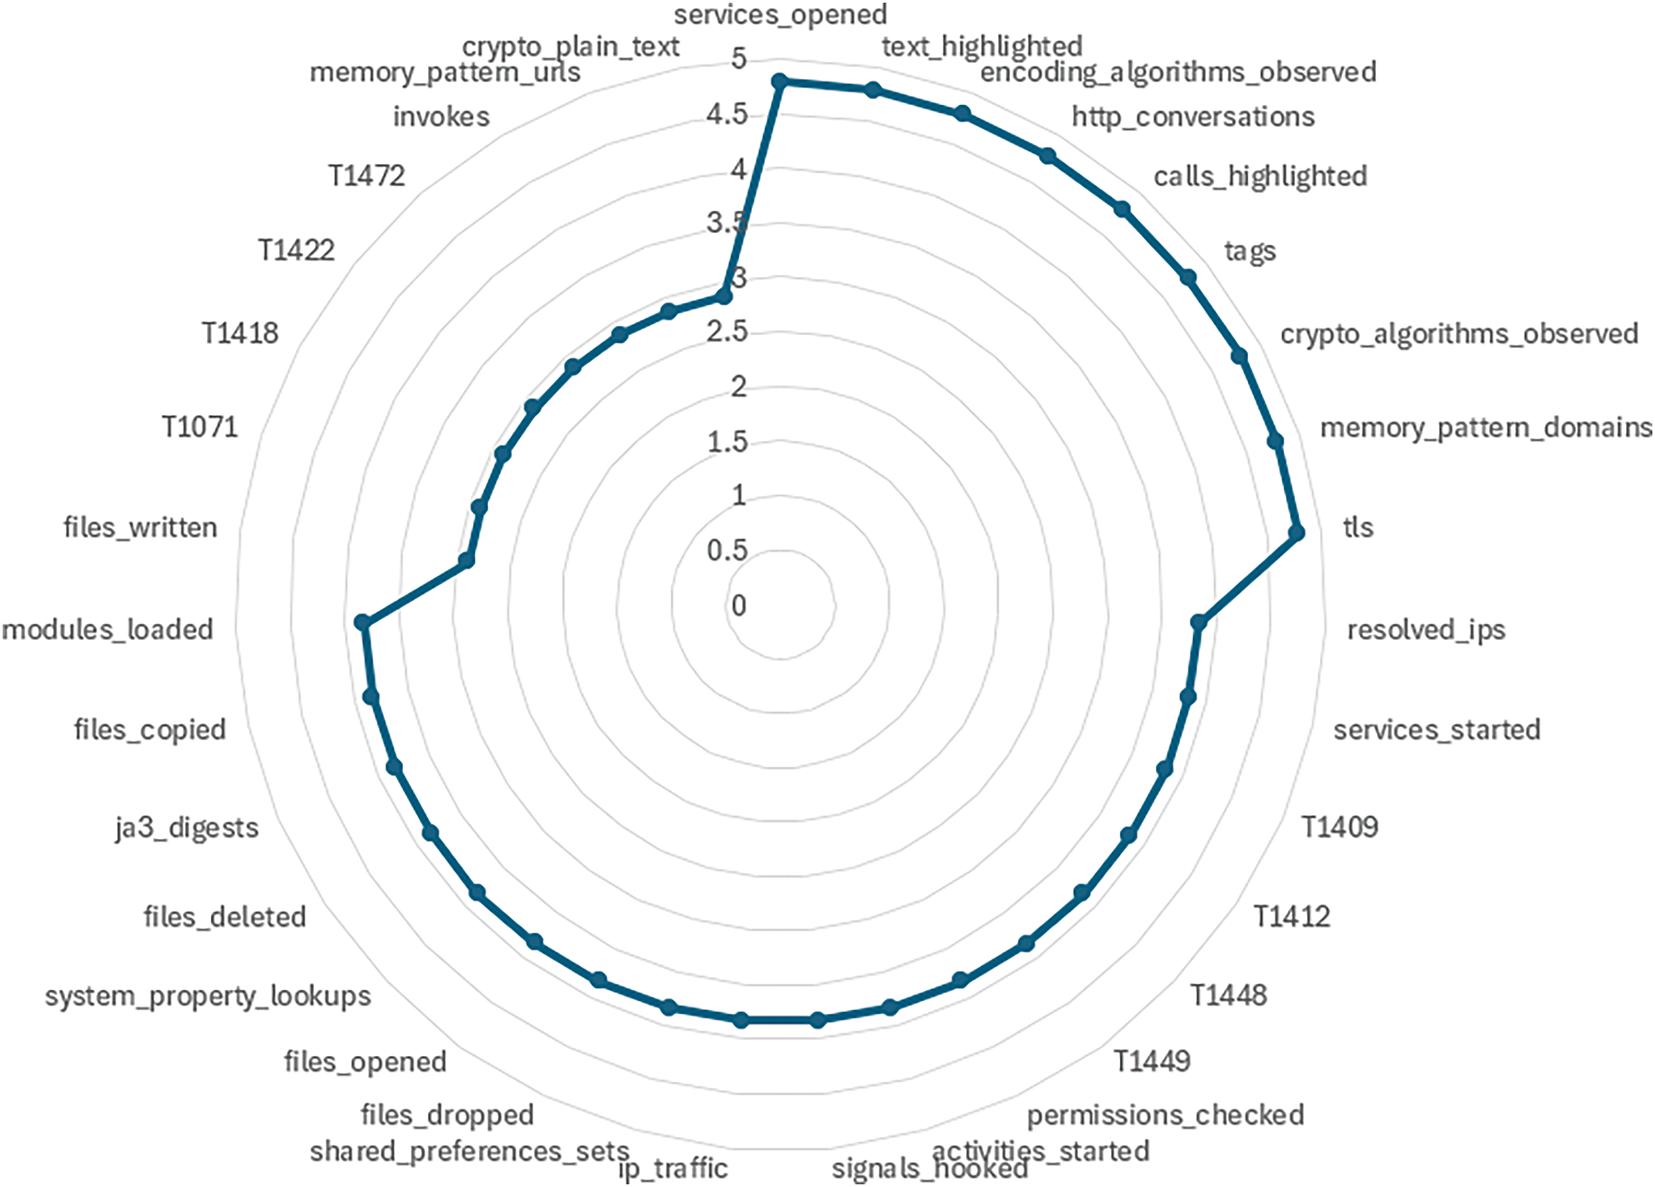
Figure 3: Identified 35 ransomware features
Android ransomware often uses tactics from the MITRE ATT&CK framework. It hides command and control traffic using protocols like HTTP or HTTPS (T1071). It accesses stored app data, such as credentials (T1409). It exploits system flaws to gain higher privileges (T1412). Attackers check installed apps (T1418) and abuse broadcast receivers to trigger actions (T1422). They misuse device admin rights (T1448) and accessibility services (T1449) to keep control. They can also capture user input (T1472) to steal sensitive data.
3.5 Classification through Machine Learning Algorithms
Multiple classifiers are trained and tested on the dataset, and their performance is evaluated using various metrics. The classifiers used in the study include RandomForest, GradientBoosting, ExtraTrees, KNeighbors, DecisionTree, and CatBoost. The dataset, loaded from a comma-separated values (CSV) file, is split into training and testing sets with an 80:20 ratio. The models are then appraised on the test set using metrics like accuracy, recall, precision, AUC-ROC, and F1-score. Finally, performance metrics for classifiers are printed, and bar charts are generated to visualize the metrics. These charts provide a comprehensive overview of their performance.
Performance metrics for the evaluation of ML classifiers consist of accuracy, precision, recall, and F1-score. Accuracy (ACC) is a measure that gives the proportion of correctly classified instances or outcomes out of the total instances. Precision (P) measures the true positive out of all positive predictions of a classifier. Recall (R) gives the measure of true positives out of all actual positives of a classifier. F1-score gives the harmonic mean of precision (P) and recall (R). They are mathematically defined in Eqs. (1)–(4), as follows:
where TP = true positive, TN = true negative, FP = false positive and FN = false negative.
Other elements of the evaluation matrix used in the research, such as cross-validation, dataset sufficiency, and confusion matrix, are discussed in Section 4.
This section consists of the obtained results of the proposed strategy of ransomware detection with a discussion.
The learning curves for models, including Random Forest, Gradient Boosting, Extra Trees, K-Neighbors, Decision Tree, and CatBoost, in Fig. 4a–f, offer insights into their performance across different training sizes. As training set size increases, training accuracy for most models remains consistently high, while validation accuracy gradually improves, reflecting better generalization to unseen data.
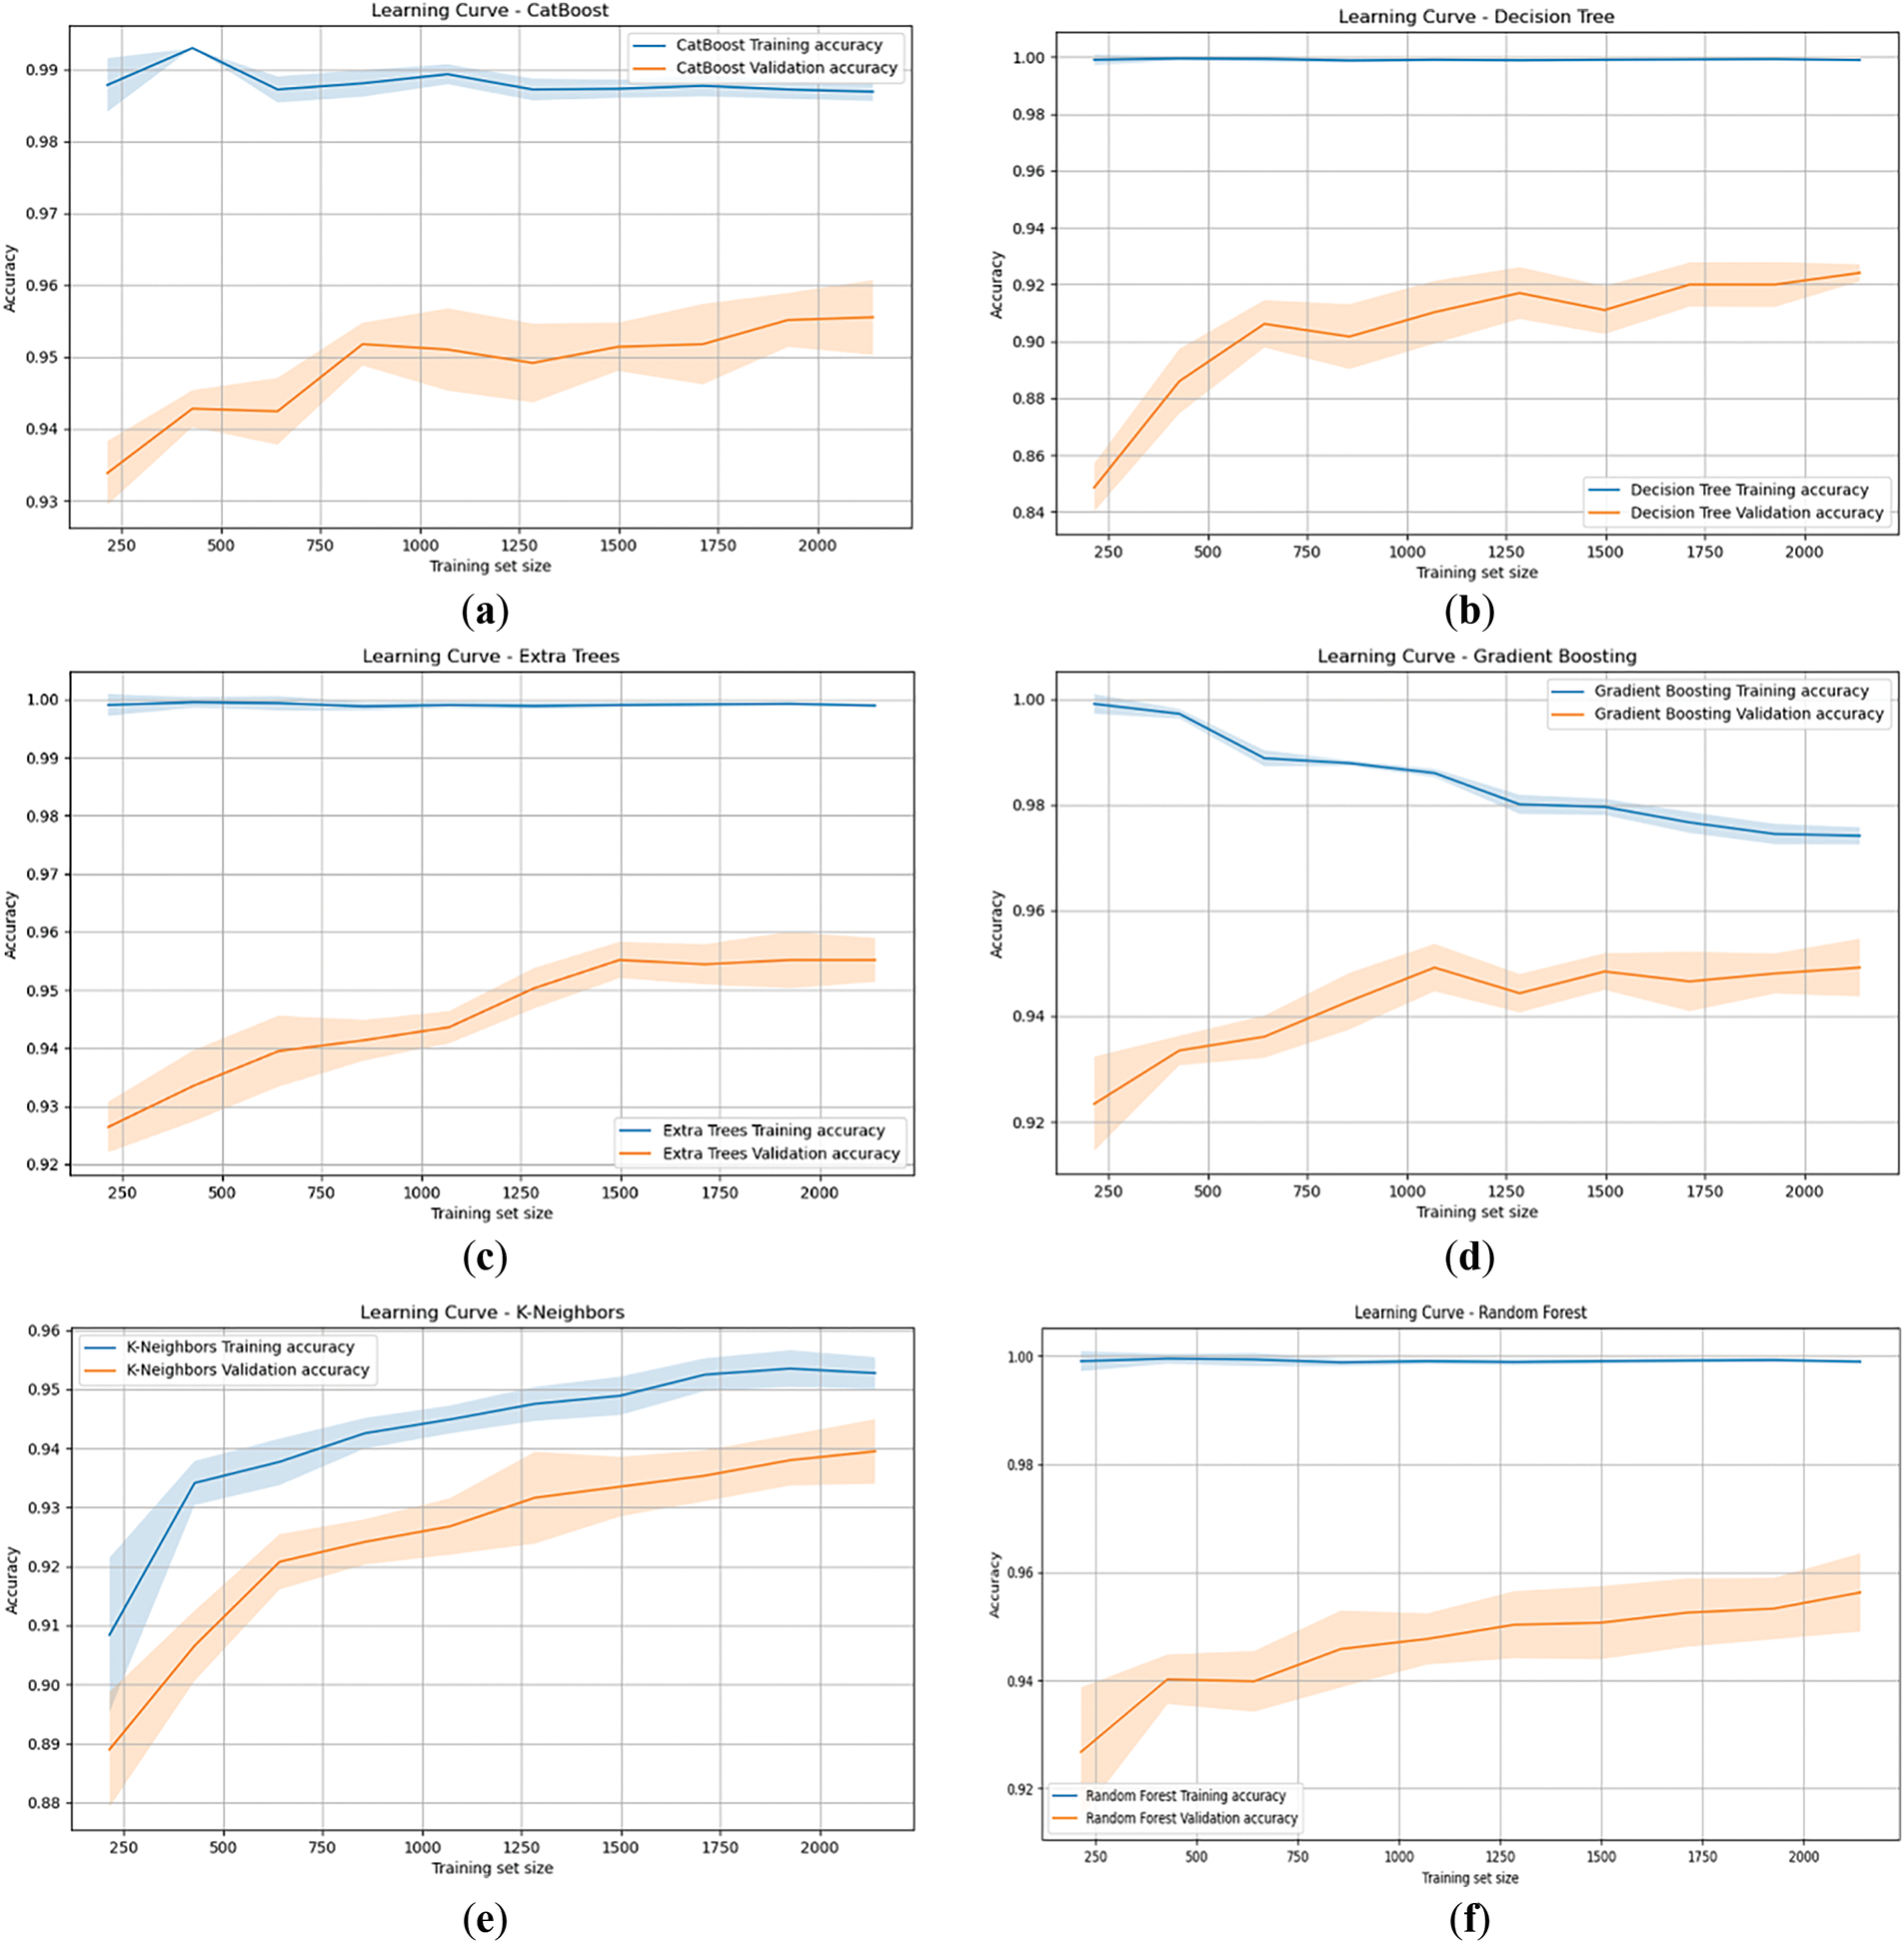
Figure 4: Learning Curves of different ML algorithms (a) CatBoost, (b) Decision Tree, (c) Extra Trees, (d) Gradient Boosting, (e) K-Neighbors, (f) Random Forest
For the Random Forest model as in Fig. 4f, the training accuracy stays high, starting at 99.91% and slightly fluctuating around 99.83% to 99.97% as the dataset increases. The validation accuracy improves steadily, from 92.68% to 95.63%, showing enhanced generalization with more data. The standard deviations for both training and validation accuracies remain small, indicating stable and consistent performance. Gradient Boosting, as shown in Fig. 4d, follows a similar trend, with training accuracy starting at 99.91% and decreasing to 97.41%, a reflection of its tendency to trade off some training accuracy for better generalization. The validation accuracy increases from 92.34% to 94.92%, with moderate standard deviations in smaller datasets, which gradually stabilize as the data grows.
Extra Trees shows, as in Fig. 4c, near-identical behavior to Random Forest Fig. 4f, with training accuracy consistently around 99.83% to 99.91%. Its validation accuracy rises from 92.64% to 95.52%, making it one of the best performers in validation. Low standard deviations indicate minimal variability in its performance. The K-Neighbors model, as in Fig. 4e, exhibits a slightly different pattern, with lower initial training accuracy (90.84%) that increases to 95.27%. Its validation accuracy follows a similar trend, rising from 88.90% to 93.95%, although it struggles with more variability in the early stages, as seen by higher standard deviations in smaller datasets.
The Decision Tree model, as in Fig. 4b, highlights a typical case of overfitting, with training accuracy near-perfect at 99.91%, while validation accuracy starts much lower at 84.87%, improving to 92.41%. This large gap reflects the model’s overfitting tendency, with larger standard deviations in validation performance indicating less stability. CatBoost, as in Fig. 4a, starts with a slightly lower training accuracy compared to the ensemble models, improving from 98.79% to 98.69%. Its validation accuracy follows a steady upward path, from 93.39% to 95.55%, demonstrating strong generalization with relatively low standard deviations across training sizes, making it a reliable model for this dataset.
The ensemble methods like Random Forest, Extra Trees, and Gradient Boosting generally exhibit low variability and high validation accuracy, indicating robust generalization. Models like K-Neighbors and Decision Trees show more issues with either underfitting or overfitting, with varying degrees of improvement as the training size increases. CatBoost stands out as a strong competitor, with accuracy and stability closely matching the top-performing ensemble models.
4.2 Cross-Validation (10-Fold)
Cross-validation metrics for various machine learning models, namely RandomForest, GradientBoosting, ExtraTrees, KNeighbors, DecisionTree, and CatBoost, were examined as shown in Fig. 5a–f with 10-fold cross-validation results. Each model has been evaluated across several performance metrics: Accuracy, Precision, F1 Score, Recall, and ROC AUC. These metrics provide insights into the effectiveness of the models across different aspects of classification performance.
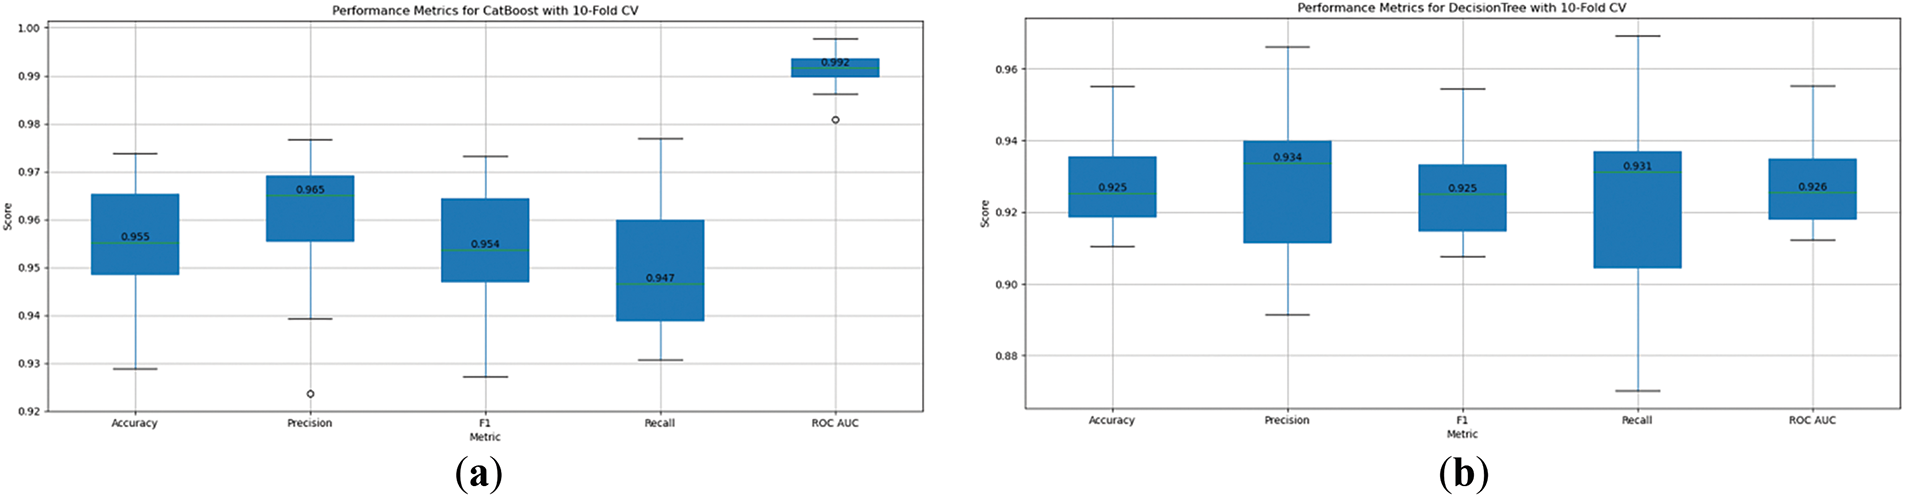
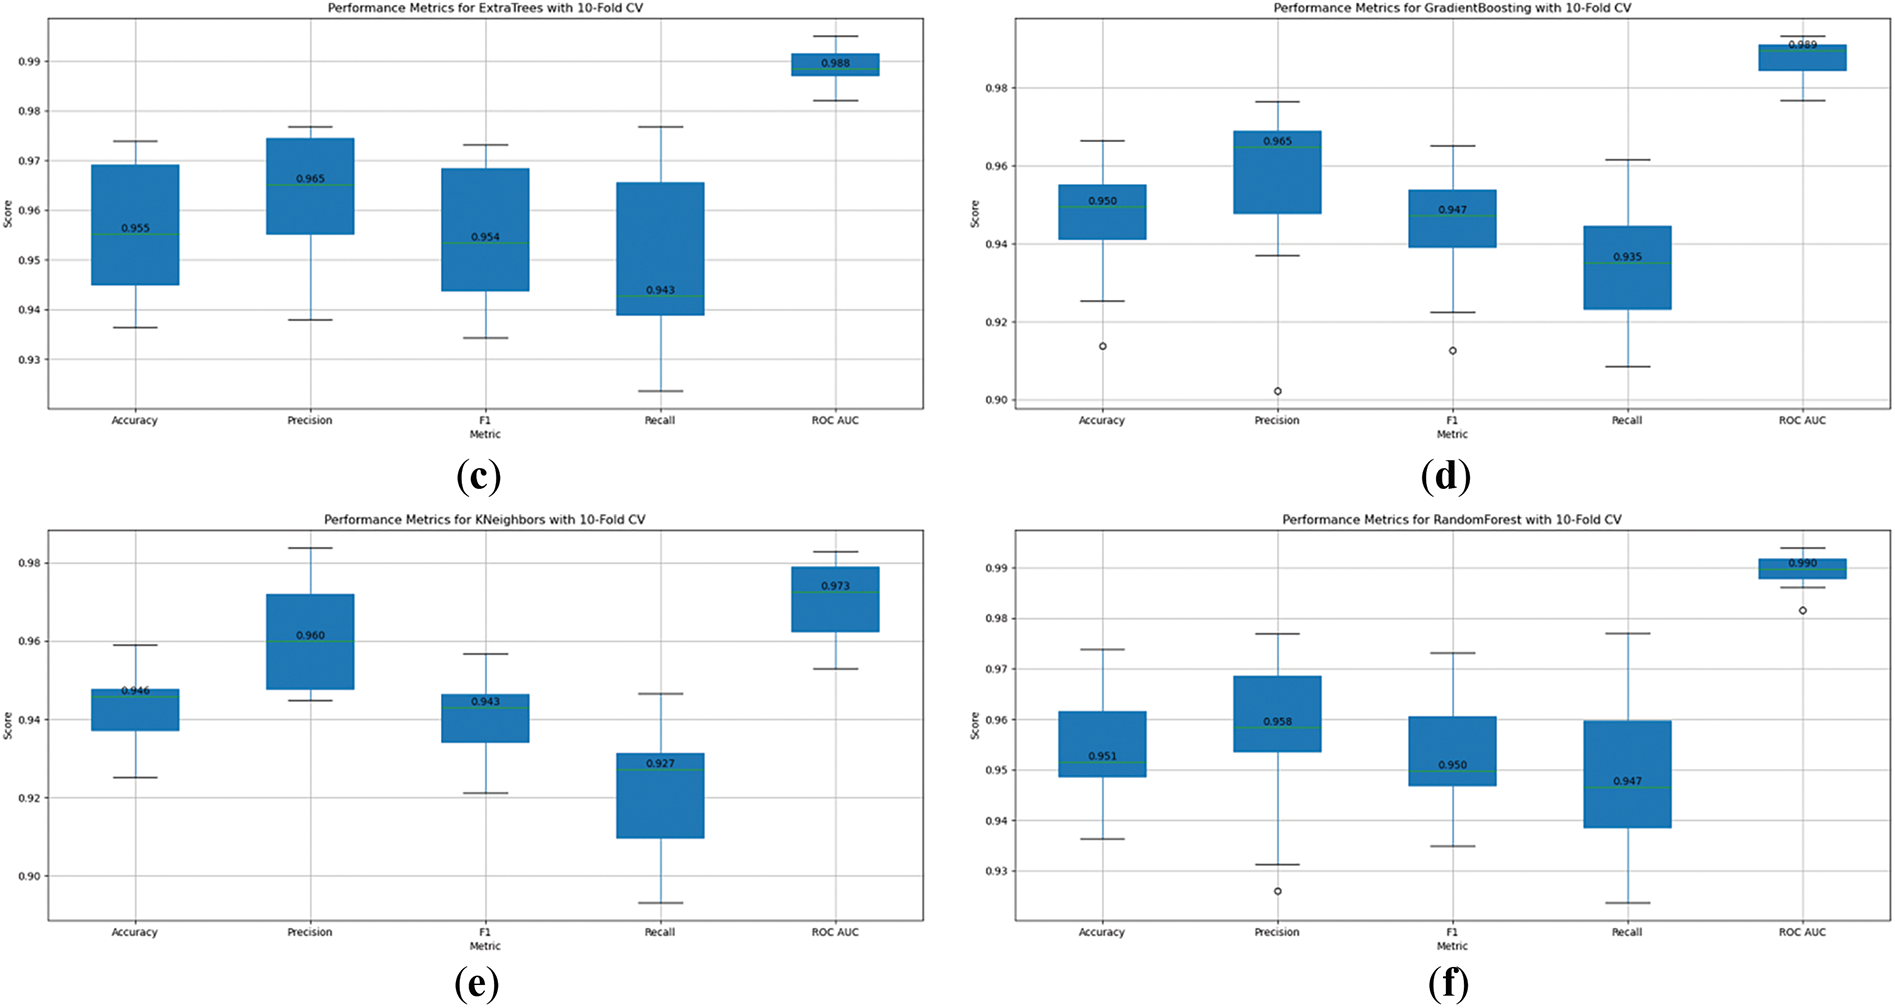
Figure 5: 10-fold cross-validation charts of ML algorithms (a) CatBoost, (b) Decision Tree, (c) ExtraTree, (d) Gradient Boosting, (e) KNeighbors, (f) RandomForest
RandomForest, as in Fig. 5f, shows an accuracy of 0.951, precision of 0.958, and recall of 0.947. This indicates that RandomForest is highly accurate in classifying the data, has precise predictions, and identifies a significant proportion of actual positives. The F1 score, which balances precision and recall, is strong at 0.950, while the ROC AUC score is 0.990, demonstrating excellent capability in distinguishing between classes. GradientBoosting, as shown in Fig. 5d, has a slightly lower accuracy at 0.950, with a high precision of 0.965 but a lower recall of 0.935, indicating that it may miss some true positives. However, the ROC AUC of 0.989 highlights strong classification ability.
ExtraTrees, as in Fig. 5c, performs well with an accuracy of 0.955, precision of 0.965, and recall of 0.943. Its F1 score of 0.954 and ROC AUC of 0.988 underscore its robustness in identifying both true positives and negatives. KNeighbors, as in Fig. 5e, shows slightly lower performance with an accuracy of 0.946 and recall of 0.927, along with precision at 0.960, having a balance between recall and precision, although with a somewhat lower recall rate. The ROC AUC of 0.973 demonstrates decent classification performance.
DecisionTree, as shown in Fig. 5c, displays lower overall metrics, with accuracy at 0.925 and precision of 0.934, while recall remains steady at 0.931. The F1 score is 0.925, and the ROC AUC is 0.926, indicating reasonable classification ability but trailing other models. CatBoost, as shown in Fig. 5a, on the other hand, performs very well with an accuracy of 0.955, precision of 0.965, and recall of 0.947. The F1 score is high at 0.954, and its ROC AUC is 0.992, reflecting superior prediction accuracy.
The different models perform comparably well, though there are some variations in their strengths. RandomForest, GradientBoosting, ExtraTrees, and CatBoost exhibit strong results across all metrics, while KNeighbors and DecisionTree perform slightly lower, particularly in recall. These results help guide the selection of the most appropriate model based on specific performance needs, such as prioritizing higher recall for detecting more positives or higher precision for minimizing false positives.
The confusion matrix results, as displayed in Fig. 6a–f, show the performance of various classifiers on the dataset, comparing their predictions to the actual true labels. Each column corresponds to the actual class labels (True_0 or True_1), and each row corresponds to the predicted class labels by a specific model.
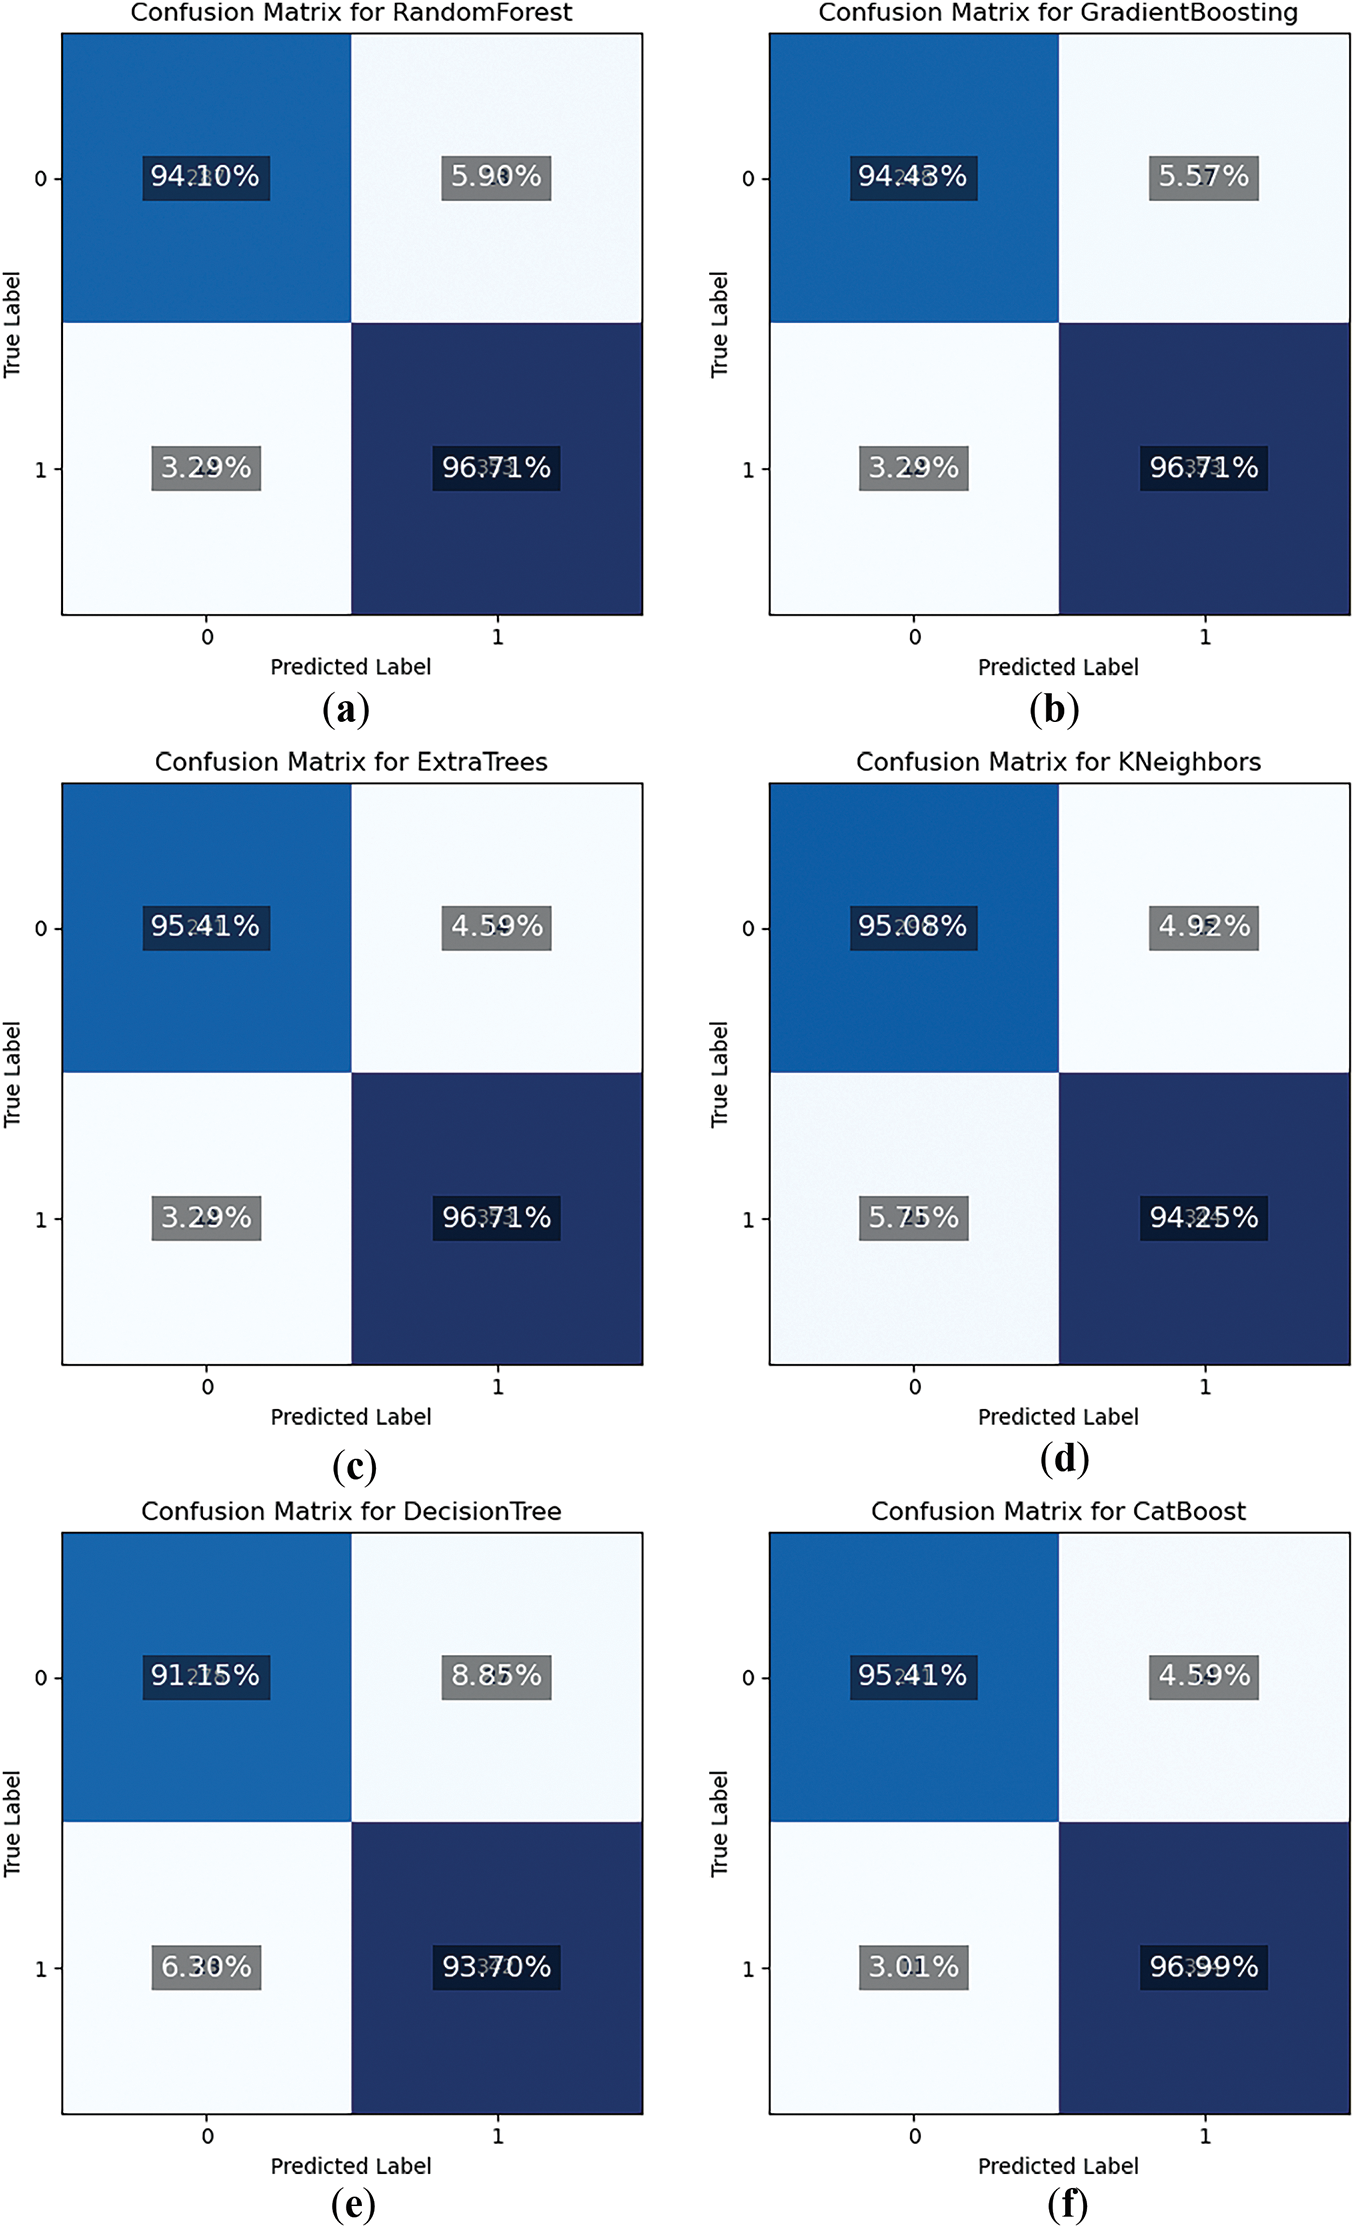
Figure 6: Confusion Matrices of ML algorithms (a) RandomForest, (b) Gradient Boosting, (c) ExtraTree, (d) KNeighbors, (e) Decision Tree, (f) CatBoost
For the Random Forest model, as shown in Fig. 6a, when the actual label is benign, it predicts them benign with 95.41% accuracy and ransomware with 4.59% accuracy. When the actual label is ransomware, it predicts benign 3.29% of the time and ransomware 96.71% of the time. The Gradient Boosting model, as in Fig. 6b, shows similar results, predicting benign with 94.43% accuracy when the actual label is benign and 5.57% for predicting ransomware. For an actual label of ransomware, it predicts benign 3.29% of the time and ransomware 96.71% of the time. The Extra Trees model, as shown in Fig. 6c, predicts benign with 95.41% accuracy and ransomware with 4.59% accuracy when the actual label is benign. When the actual label is ransomware, it predicts benign 3.29% of the time and ransomware 96.71% of the time.
The K-Neighbors model, as in Fig. 6d, predicts benign with 95.08% accuracy and ransomware with 4.92% accuracy when the actual label is benign. For an actual label of ransomware, it predicts benign 5.75% of the time and ransomware 94.25% of the time. The Decision Tree model’s performance, in Fig. 6e, shows 91.15% accuracy for predicting benign when the actual label is benign, and 8.85% for predicting ransomware. When the actual label is ransomware, it predicts a benign 6.30% of the time and ransomware 93.7% of the time. The CatBoost model, as shown in Fig. 6f, predicts benign with 95.41% accuracy when the actual label is benign and 4.59% for predicting ransomware. For an actual label of ransomware, it predicts a benign 3.01% of the time and ransomware 96.99% of the time. Each model has its strengths and weaknesses, but all demonstrate a high degree of accuracy in predicting the correct class labels, with some variations in their prediction errors.
In the comparison of various models, as shown in Fig. 7, Extra Trees exhibits the highest overall performance across most metrics, boasting an accuracy of 0.961, precision of 0.962, and recall of 0.967. F1 score is 0.964, and it achieves an ROC AUC of 0.993, indicating its strong ability to correctly classify both positive and negative cases. This balanced performance shows Extra Trees excels in both minimizing false positives and false negatives, making it the top performer in the comparison.
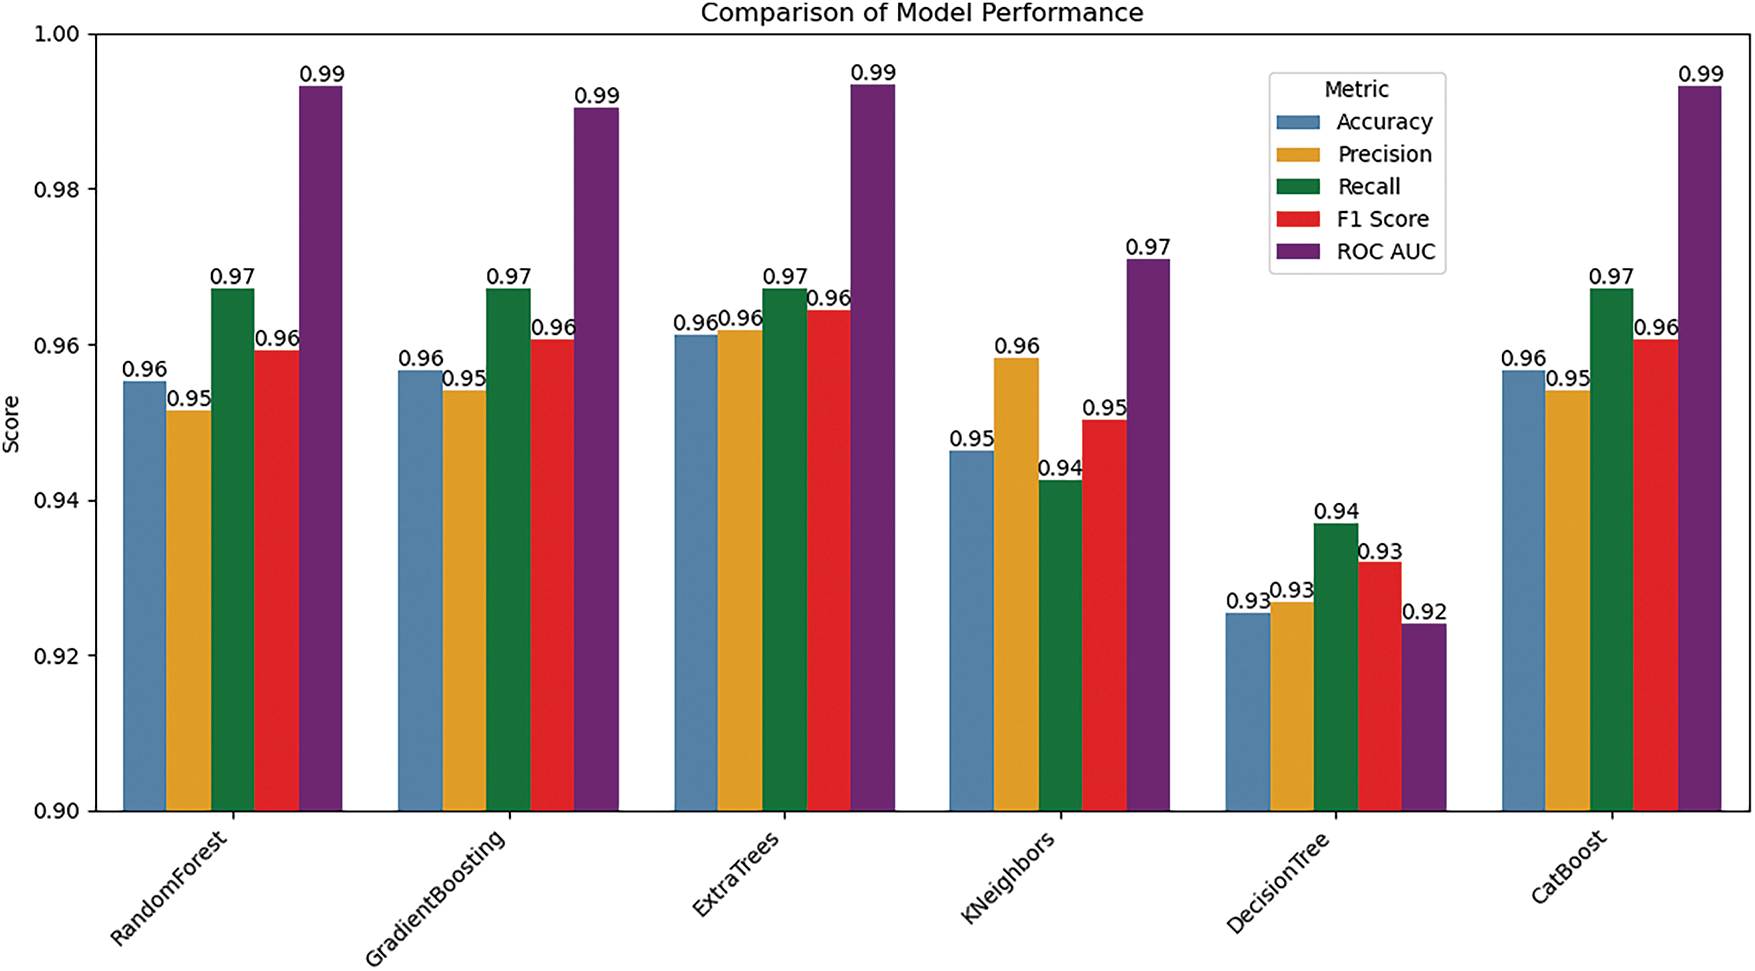
Figure 7: Graphical representation of the performance of the proposed strategy on ML algorithms
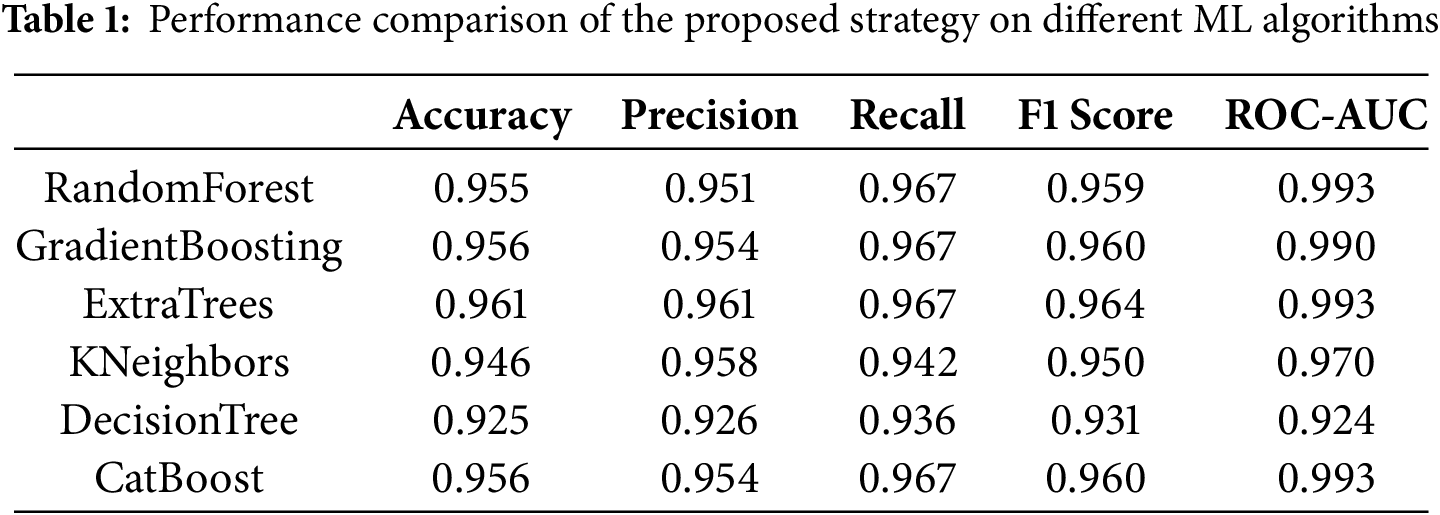
Gradient Boosting shows similarly high accuracy at 0.957, with a precision of 0.954 and a recall of 0.967. It has a 0.961 F1 score. ROC-AUC achieved a score that stands at 0.991. Results validate its effectiveness. It has a slightly lower ability to discriminate when compared to Extra Trees. This is reflected in the ROC-AUC score. Random Forest, however, closely follows. It has a 0.955 score for accuracy. It attains an ROC-AUC score of 0.993. These results suggest its strong classification. The precision score is 0.951 and the recall value is 0.967. The score of F1 reaches 0.959. These results indicate its good performance like Extra Trees, except somewhat lower precision. The performance of CatBoost is on par with the performance of Gradient Boosting. CatBoost shows an accuracy score of 0.957. Precision stands at 0.954. The recall value is recorded as 0.967. The score for F1 is noted at 0.961. Last but not least, its ROC-AUC is logged with a value of 0.993. The last two values, that is, F1 and its ROC-AUC, match with Extra Trees and RandomForest. These results suggest that CatBoost is very effective. On the other hand, the accuracy score of K-Neighbors stands at 0.946. Its ROC-AUC value is scored at 0.971. Its precision is recorded at 0.958, and its recall is logged as 0.942. The value of its F1 score is 0.950. These results indicate that K-Neighbors is reasonably effective. But its performance as compared to Extra Trees remained low. Lastly, the lowest performance is recorded by Decision Tree with an accurate value of 0.925. The lowest ROC-AUC score is also logged by it, which stands at 0.924. Its other performance metrics, like precision, recall, and F1, attain scores at 0.927, 0.937, and 0.932, respectively. While it maintains a balance between precision and recall, its overall performance and discriminative power are significantly lower compared to the other models. Extra Trees and Random Forest stand out for their balanced and strong performance across all metrics, while Gradient Boosting and CatBoost also perform exceptionally well. K-Neighbors and Decision Tree although still effective. However, in terms of overall classification performance and discriminative ability, as summarized in Table 1.
The general performance of the proposed work, compared with existing relevant studies, is presented in Table 2. Given the limited amount of related research on ransomware, we have selected the most significant studies based on ransomware datasets, as shown in Table 2. Khan et al. (2020) utilized a custom dataset with 942 benign and 582 ransomware samples, applying Digital DNA sequencing to achieve an impressive detection rate of 87.9%. This method demonstrated solid performance but was limited by the dataset size and lack of clarity on the exact features used. Hossain et al. (2022) used the CICAndMal2017 dataset, consisting of 1715 benign and 426 ransomware samples. They employed Machine Learning with Metaheuristic Feature Selection, focusing on 20 selected features from an original set of 80. Their model achieved a detection accuracy of 81.58% with a smaller dataset, as discussed in the previous paragraph. Bagui et al. (2021) also used the CICAndMal2017 dataset, but with a larger sample size of 1715 benign and 426 malware). Their method achieved an accuracy of 94.98%, but with an outdated dataset that has a very low number of ransomware samples, 101 only.

When comparing Pathak et al. (2024) and Xiong and Zhang (2024) to the proposed method, the latter shows better results. The proposed method reached 96.1% accuracy on a dataset of 3346 samples, outperforming Pathak et al.’s 93.96% and Xiong and Zhang’s 88%. Pathak et al. used a small dataset of 398 samples, which, while accurate, may not be as reliable for broader use. Their feature selection method might also limit the number of useful features. Xiong and Zhang used a larger dataset with 7845 samples but still achieved only 88% accuracy, suggesting that their multi-model approach may have lacked sufficient feature representation.
4.5 Performance Comparison in Terms of Latency and Memory Usage
In this section, the computational cost is evaluated for both memory and time complexity as compared with the full feature and the proposed reduced feature set.
To evaluate the efficiency of our feature selection strategy, we compared the inference latency (measured in milliseconds per sample) across several machine learning models using both the full feature set and a reduced feature set, as shown in Fig. 8. The results demonstrate that the reduced feature set consistently leads to a substantial decrease in latency across all models. For instance, the Random Forest model showed a latency reduction from 10.23 µs/sample to 8.74 µs/sample (approximately 14.6% improvement), while Gradient Boosting and Extra Trees achieved reductions of about 41.5% and 51.6%, respectively. K-Nearest Neighbors’ latency dropped from 4.47 µs/sample to 2.63 µs/sample (41.1% improvement), and Decision Tree, which was already highly efficient, showed a further 99% reduction. Notably, CatBoost, which had the highest latency in the full-feature configuration (38.29 µs/sample), experienced a significant drop to 6.06 µs/sample—an improvement of roughly 84.2%. These findings highlight that feature reduction not only enhances generalization and prevents overfitting but also substantially improves runtime efficiency, which is especially critical in real-time and resource-constrained environments such as mobile and Internet of Things (IoT) systems. The performance gains were most pronounced in ensemble-based methods, which involve repeated feature evaluations across multiple base learners.
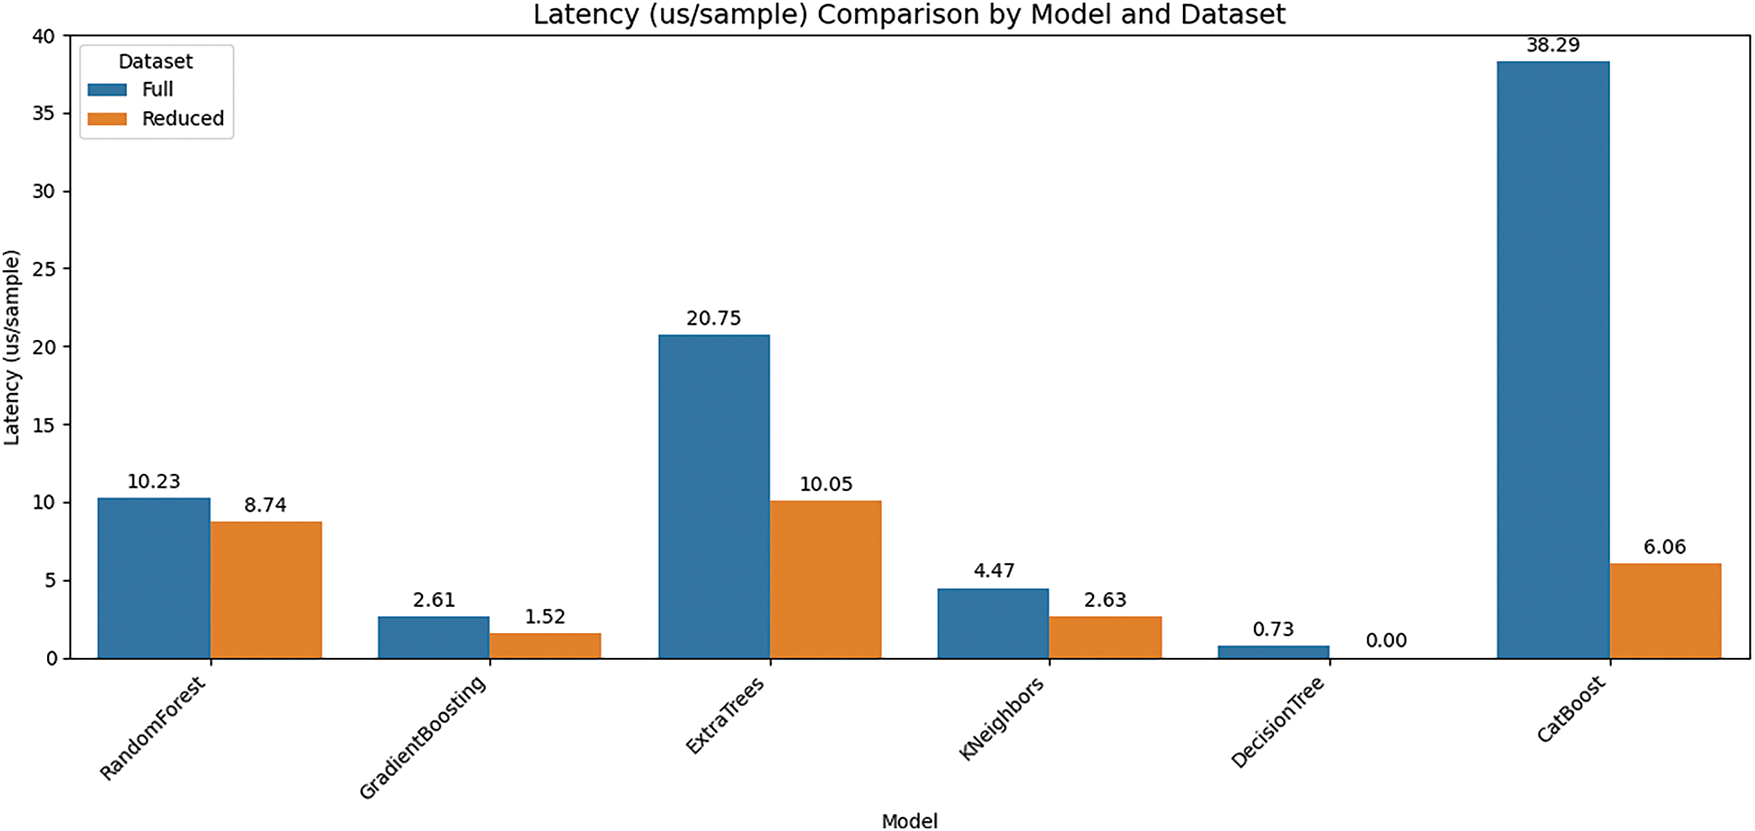
Figure 8: Comparing latency (µs/sample) across different models for both full and proposed reduced feature sets
To further evaluate the efficiency of our feature reduction strategy, we analyzed the peak memory consumption (in megabytes) for various machine learning models under both full and reduced feature configurations, as shown in Fig. 9. As illustrated in the comparison, all models showed a noticeable decrease in memory usage when trained and evaluated with the reduced feature set. Specifically, Random Forest demonstrated a reduction from approximately 237.52 to 208.23 MB, while Gradient Boosting dropped from 237.55 to 209.11 MB. Similarly, Extra Trees and K-Nearest Neighbors saw reductions from 237.89 to 210.98 MB, and from 241.24 to 219.79 MB, respectively. Decision Tree, despite being inherently lightweight, still benefited from a memory drop from 240.43 to 215.56 MB. CatBoost, which is typically more resource-intensive, also experienced a meaningful decline from 239.84 to 224.84 MB. These results affirm that dimensionality reduction not only improves latency but also leads to a measurable decrease in memory footprint across diverse model architectures. Such improvements are particularly valuable for deployment in memory-constrained environments, such as mobile devices or embedded systems, where optimization of resource usage is critical. Collectively, the memory analysis reinforces the effectiveness of the reduced feature set in promoting computational efficiency without compromising performance, as supported by our corresponding accuracy evaluations.
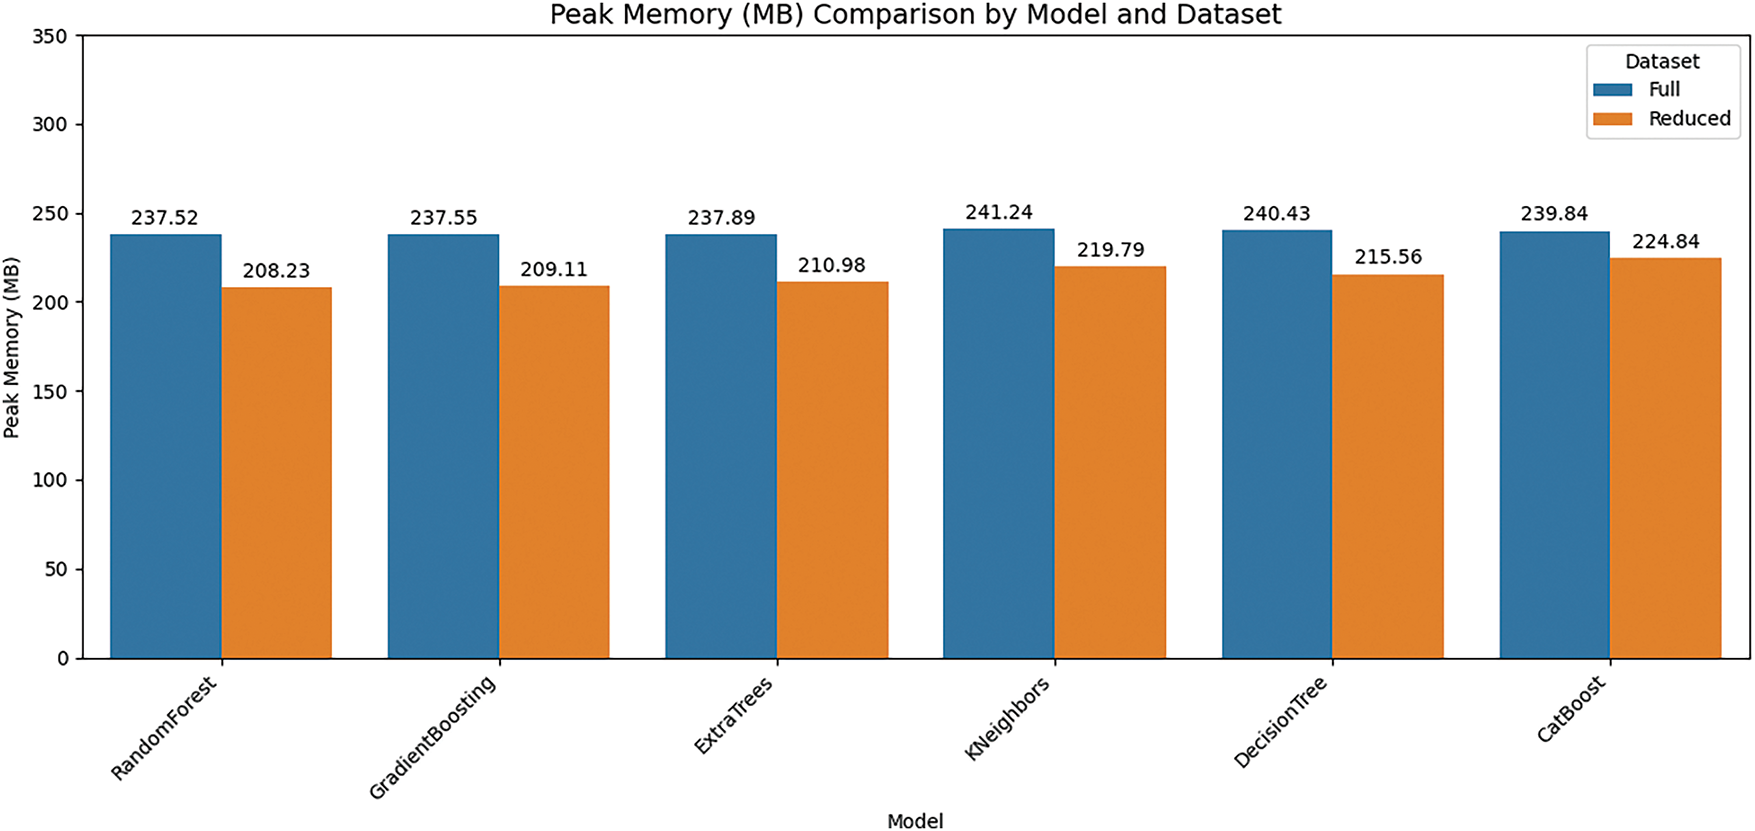
Figure 9: Comparing memory usage across different models for both the full and the proposed reduced feature set
The latency and memory results clearly show that models using the reduced feature set achieve significantly lower inference time and peak memory usage across all classifiers. These improvements, up to 99% reduction in latency and notable memory savings, make the reduced models highly suitable for deployment on resource-constrained devices like mobile and IoT systems. This confirms the effectiveness of our lightweight feature selection approach for real-world, efficient malware detection.
In conclusion, this research presents a multi-stage approach that addresses key limitations of traditional malware detection methods. The first stage focuses on robust behavioral profiling, while the second introduces an effective feature reduction technique that narrows 174 features down to 35 key attributes. This reduction not only maintains high detection performance but also significantly enhances computational efficiency. The proposed method achieves a peak accuracy of 96.71% and an ROC-AUC of 99.3% using the Extra Trees classifier, confirming the model’s reliability and robustness. Furthermore, the reduced feature set led to up to 99% lower inference latency and noticeable memory savings across all tested models, making the solution highly suitable for deployment on resource-constrained devices such as mobile and IoT platforms. Future work will extend the dataset and explore deep learning architectures to further improve the detection of advanced threats.
Acknowledgement: The National University of Science and Technology and the National Centre for Cyber Security (NCCS), Pakistan, supported this exploration.
Funding Statement: The National Centre for Cyber Security, Pakistan funded the study. This research was supported by the Basic Science Research Program through the National Research Foundation of Korea (NRF) funded by the Ministry of Education (2021R1I1A3049788).
Author Contributions: The authors confirm their contributions to the paper as follows: Muhammad Sibtain and Mehdi Hussain were responsible for conceptualization, while Qaiser Riaz and Sana Qadir contributed to the methodology. Software development was carried out by Muhammad Sibtain and Qaiser Riaz. Validation of the findings was performed by Mehdi Hussain, Qaiser Riaz, and Sana Qadir. The formal analysis was conducted by Sana Qadir and Naveed Riaz, with the investigation led by Muhammad Sibtain and Mehdi Hussain. Resources were provided by Naveed Riaz and Ki-Hyun Jung and data curation was managed by Qaiser Riaz and Naveed Riaz. The original draft of the manuscript was prepared by Muhammad Sibtain and Sana Qadir, while Mehdi Hussain and Ki-Hyun Jung contributed to reviewing and editing. Visualization was handled by Qaiser Riaz and Muhammad Sibtain. Supervision was provided by Ki-Hyun Jung and Mehdi Hussain, with project administration managed by Naveed Riaz and Ki-Hyun Jung. Funding acquisition was the responsibility of Mehdi Hussain and Ki-Hyun Jung. All authors reviewed the results and approved the final version of the manuscript.
Availability of Data and Materials: The datasets generated and analyzed during the current study are available from the corresponding author upon reasonable request.
Ethics Approval: Not applicable.
Conflicts of Interest: The authors declare no conflicts of interest to report regarding the present study.
References
1. Cen M, Jiang F, Qin X, Jiang Q, Doss R. Ransomware early detection: a survey. Comput Netw. 2024;239(2):110138. doi:10.1016/j.comnet.2023.110138. [Google Scholar] [CrossRef]
2. Temara S. The ransomware epidemic: recent cybersecurity incidents demystified. Asian J Adv Res Rep. 2024;18(3):1–6. doi:10.9734/ajarr/2024/v18i3610. [Google Scholar] [CrossRef]
3. Chen QR. A bridges, automated behavioral analysis of malware: a case study of WannaCry ransomware. In: Proceedings of the 2017 16th IEEE International Conference on machine learning and applications (ICMLA); 2017 Dec 18–21; Cancun, Mexico. [Google Scholar]
4. Braue D. Global ransomware damage costs predicted to exceed $265 billion by 2031. Cybercrime Mag Melb VIC Aust Tech Rep. 2022. [Google Scholar]
5. Federal Bureau of Investigation (FBI). 2024 Internet Crime Report [Internet]. Washington, DC, USA: Federal Bureau of Investigation; 2024 Mar [cited 2025 May 1]. Available from: https://www.ic3.gov/Media/PDF/AnnualReport/2024_IC3Report.pdf. [Google Scholar]
6. Kaspersky. Banking data theft attacks on smartphones triple in 2024: Kaspersky reports [Internet]. [cited 2025 May 21]. Available from: https://www.kaspersky.com/about/press-releases/banking-data-theft-attacks-on-smartphones-triple-in-2024-kaspersky-reports. [Google Scholar]
7. Kaspersky. Kaspersky predicts quantum-proof ransomware and advancements in mobile financial cyberthreats in 2025 [Internet]. [cited 2025 May 21]. Available from: https://www.kaspersky.com/about/press-releases/kaspersky-predicts-quantum-proof-ransomware-and-advancements-in-mobile-financial-cyberthreats-in-2025. [Google Scholar]
8. Khan F, Ncube C, Ramasamy LK, Kadry S, Nam Y. A digital DNA sequencing engine for ransomware detection using machine learning. IEEE Access. 2020;8:119710–9. doi:10.1109/access.2020.3003785. [Google Scholar] [CrossRef]
9. Hossain MS, Hasan N, Samad MA, Shakhawat HM, Karmoker J, Ahmed F, et al. Android ransomware detection from traffic analysis using metaheuristic feature selection. IEEE Access. 2022;10:128754–63. doi:10.1109/access.2022.3227579. [Google Scholar] [CrossRef]
10. Aldehim G, Arasi MA, Khalid M, Aljameel SS, Marzouk R, Mohsen H, et al. Gauss-mapping black widow optimization with deep extreme learning machine for android malware classification model. IEEE Access. 2023;11(4):87062–70. doi:10.1109/access.2023.3285289. [Google Scholar] [CrossRef]
11. Garg S, Baliyan N. MalVulDroid: tracing vulnerabilities from malware in android using natural language processing. J Web Eng. 2022;21(8):2339–61. doi:10.13052/jwe1540-9589.2185. [Google Scholar] [CrossRef]
12. Urooj B, Shah MA, Maple C, Abbasi MK, Riasat S. Malware detection: a framework for reverse engineered android applications through machine learning algorithms. IEEE Access. 2022;10(10):89031–50. doi:10.36893/jes.2024.v15i10.027. [Google Scholar] [CrossRef]
13. Da Costa L, Moia V. A lightweight and multi-stage approach for Android malware detection using non-invasive machine learning techniques. IEEE Access. 2023;11:73127–44. doi:10.1109/access.2023.3296606. [Google Scholar] [CrossRef]
14. Ding C, Luktarhan N, Lu B, Zhang W. A hybrid analysis-based approach to android malware family classification. Entropy. 2021;23(8):1009. doi:10.3390/e23081009. [Google Scholar] [PubMed] [CrossRef]
15. Bibi I, Akhunzada A, Malik J, Ahmed G, Raza M. An effective Android ransomware detection through multi-factor feature filtration and recurrent neural network. In: Proceedings of the 2019 UK/China Emerging Technologies (UCET); 2019 Aug 21–22; Glasgow, UK. [Google Scholar]
16. Alzahrani A, Alshahrani H, Alshehri A, Fu H. An intelligent behavior-based ransomware detection system for android platform. In: Proceedings of the 2019 First IEEE International Conference on Trust, Privacy and Security in Intelligent Systems and Applications (TPS-ISA); 2019 Dec 12–14; Los Angeles, CA, USA. [Google Scholar]
17. Elayan ON, Mustafa AM. Android malware detection using deep learning. Procedia Comput Sci. 2021;184(2):847–52. doi:10.1016/j.procs.2021.03.106. [Google Scholar] [CrossRef]
18. Sharma S, Krishna CR, Kumar R. Android ransomware detection using machine learning techniques: a comparative analysis on GPU and CPU. In: Proceedings of the 2020 21st International Arab Conference on Information Technology (ACIT); 2020 Nov 28–30; Giza, Egypt. [Google Scholar]
19. Singh J, Thakur D, Ali F, Gera T, Kwak KS. Deep feature extraction and classification of android malware images. Sensors. 2020;20(24):7013. doi:10.3390/s20247013. [Google Scholar] [PubMed] [CrossRef]
20. Wang L, Wang H, He R, Tao R, Meng G, Luo. MalRadar: demystifying android malware in the new era. Proc ACM Meas Anal Comput Syst. 2022;6(2):1–27. [Google Scholar]
21. Scalas M, Maiorca D, Mercaldo F, Visaggio CA, Martinelli F, Giacinto G. On the effectiveness of system API-related information for Android ransomware detection. Comput Secur. 2019;86(7):168–82. doi:10.1016/j.cose.2019.06.004. [Google Scholar] [CrossRef]
22. Faris H, Habib M, Almomani I, Eshtay M, Aljarah I. Optimizing extreme learning machines using chains of salps for efficient Android ransomware detection. Appl Sci. 2020;10(11):3706. doi:10.3390/app10113706. [Google Scholar] [CrossRef]
23. Sharma S, Kumar R, Krishna CR. RansomAnalysis: the evolution and investigation of Android ransomware. In: Dutta M, Krishna C, Kumar R, Kalra M, editors. Proceedings of International Conference on IoT inclusive life (ICIIL 2019). Singapore: Springer; 2020. doi:10.1007/978-981-15-3020-3_4. [Google Scholar] [CrossRef]
24. Alsoghyer S, Almomani I. Ransomware detection system for Android applications. Electronics. 2019;8(8):868. doi:10.3390/electronics8080868. [Google Scholar] [CrossRef]
25. Amer E, El-Sappagh S. Robust deep learning early alarm prediction model based on the behavioural smell for android malware. Comput Secur. 2022;116(1):102670. doi:10.1016/j.cose.2022.102670. [Google Scholar] [CrossRef]
26. Bagui S, Woods T. Machine learning for android ransomware detection. Int J Comput Sci Inf Secur. 2021;19:29–38. doi:10.5281/zenodo.4533395. [Google Scholar] [CrossRef]
27. Pathak A, Barman U, Kumar TS. Machine learning approach to detect Android malware using feature-selection based on feature importance score. J Eng Res. 2024;8(2):124579. doi:10.1016/j.jer.2024.04.008. [Google Scholar] [CrossRef]
28. Rahima Manzil HH, Naik SM. Android ransomware detection using a novel hamming distance based feature selection. J Comput Virol Hacking Tech. 2024;20(1):71–93. doi:10.1007/s11416-023-00495-w. [Google Scholar] [CrossRef]
29. Mahindru A, Arora H, Kumar A, Gupta SK, Mahajan S, Kadry S, et al. PermDroid a framework developed using proposed feature selection approach and machine learning techniques for Android malware detection. Sci Rep. 2024;14(1):10724. doi:10.1038/s41598-024-60982-y. [Google Scholar] [PubMed] [CrossRef]
30. Kalphana KR, Aanjankumar S, Surya M, Ramadevi MS, Ramela KR, Anitha T, et al. Prediction of android ransomware with deep learning model using hybrid cryptography. Sci Rep. 2024;14(1):22351. doi:10.1038/s41598-024-70544-x. [Google Scholar] [PubMed] [CrossRef]
31. Kirubavathi G, Anne WR. Behavioral based detection of android ransomware using machine learning techniques. Int J Syst Assur Eng Manag. 2024;15(9):4404–25. doi:10.1007/s13198-024-02439-z. [Google Scholar] [CrossRef]
32. Singh N, Tripathy S. It’s too late if exfiltrate: early stage Android ransomware detection. Comput Secur. 2024;141(8):103819. doi:10.1016/j.cose.2024.103819. [Google Scholar] [CrossRef]
33. Ngirande H, Muduva M, Chiwariro R, Makate A. Detection and analysis of android ransomware using the support vector machines. Int J Res Appl Sci Eng Technol. 2024;12:241–52. [Google Scholar]
34. Xiong S, Zhang H. A multi-model fusion strategy for android malware detection based on machine learning algorithms. J Comput Sci Res. 2024;6(2):1. doi:10.30564/jcsr.v6i2.6632. [Google Scholar] [CrossRef]
35. Li T, Luo Y, Wan X, Li Q, Liu Q, Wang R, et al. A malware detection model based on imbalanced heterogeneous graph embeddings. Expert Syst Appl. 2024;246(27):123109. doi:10.1016/j.eswa.2023.123109. [Google Scholar] [CrossRef]
36. Dahiya A, Singh S, Shrivastava G. Malware detection insights, mechanisms and future perspectives for android applications. In: Proceedings of the International Conference on Innovative Computing and Communication 2024; 2024 Feb 16–17; New Delhi, India. [Google Scholar]
37. Kaya Y, Chen Y, Saha S, Pierazzi F, Cavallaro L, Wagner D, et al. Demystifying behavior-based malware detection at endpoints. arXiv:2405.06124. 2024. [Google Scholar]
38. Hossain MA, Haque MA, Ahmad S, Abdeljaber HA, Eljialy AE, Alanazi A, et al. AI-enabled approach for enhancing obfuscated malware detection: a hybrid ensemble learning with combined feature selection techniques. Int J Syst Assur Eng Manag. 2024;23(18):1–9. doi:10.1007/s13198-024-02294-y. [Google Scholar] [CrossRef]
39. Lee Y, Lee J, Ryu D, Park H, Shin D. Clop ransomware in action: a comprehensive analysis of its multi-stage tactics. Electronics. 2024;13(18):3689. doi:10.3390/electronics13183689. [Google Scholar] [CrossRef]
40. Chimmanee K, Jantavongso S. Digital forensic of Maze ransomware: a case of electricity distributor enterprise in ASEAN. Expert Syst Appl. 2024;249(4):123652. doi:10.1016/j.eswa.2024.123652. [Google Scholar] [CrossRef]
41. Rainio O, Teuho J, Klén R. Evaluation metrics and statistical tests for machine learning. Sci Rep. 2024;14(1):6086. doi:10.1038/s41598-024-66611-y. [Google Scholar] [PubMed] [CrossRef]
Cite This Article
 Copyright © 2025 The Author(s). Published by Tech Science Press.
This work is licensed under a Creative Commons Attribution 4.0 International License , which permits unrestricted use, distribution, and reproduction in any medium, provided the original work is properly cited.
 Downloads
 Citation Tools