
 Submit a Paper
 Propose a Special lssue
 Open Access
ARTICLE

Multi-Modal Attention Networks for Driving Style-Aware Trajectory Prediction in Autonomous Driving
The Electrical Engineering College, Guizhou University, Guiyang, 550025, China
* Corresponding Author: Qinmu Wu. Email:
Computers, Materials & Continua 2025, 85(1), 1999-2020. https://doi.org/10.32604/cmc.2025.066423
Received 08 April 2025; Accepted 09 June 2025; Issue published 29 August 2025
 View Full Text
 Download PDF
Abstract
Trajectory prediction is a critical task in autonomous driving systems. It enables vehicles to anticipate the future movements of surrounding traffic participants, which facilitates safe and human-like decision-making in the planning and control layers. However, most existing approaches rely on end-to-end deep learning architectures that overlook the influence of driving style on trajectory prediction. These methods often lack explicit modeling of semantic driving behavior and effective interaction mechanisms, leading to potentially unrealistic predictions. To address these limitations, we propose the Driving Style Guided Trajectory Prediction framework (DSG-TP), which incorporates a probabilistic representation of driving style into trajectory prediction. Our approach enhances the model’s ability to interact with vehicle behavior characteristics in complex traffic scenarios, significantly improving prediction reliability in critical decision-making situations by incorporating the driving style recognition module. Experimental evaluations on the Argoverse 1 dataset demonstrate that our method outperforms existing approaches in both prediction accuracy and computational efficiency. Through extensive ablation studies, we further validate the contribution of each module to overall performance. Notably, in decision-sensitive scenarios, DSG-TP more accurately captures vehicle behavior patterns and generates trajectory predictions that align with different driving styles, providing crucial support for safe decision-making in autonomous driving systems.Keywords
In autonomous driving systems, accurate trajectory prediction is one of the core tasks [1], enabling vehicles to predict the future trajectories of surrounding traffic participants. This allows the planning and decision-making layers to make safe decisions that align with human driving habits. In complex dynamic urban traffic environments, trajectory prediction requires accurate and efficient modeling of complex spatiotemporal interactions between traffic participants, road topology, semantic information, and various driving behaviors [2].
Endsley’s Situation Awareness Theory [3] conceptualizes the driving process into three hierarchical levels: perception, comprehension, and projection. Achieving accurate trajectory prediction requires a comprehensive understanding of the driving environment, including the intentions of surrounding vehicles and constraints imposed by road structures. As shown in Fig. 1, when a vehicle ahead is moving slowly, aggressive drivers will choose to change lanes, while cautious drivers tend to slow down and wait for vehicles behind to pass before changing lanes. This demonstrates that differences in personal habits and driving styles are crucial for precise trajectory prediction.
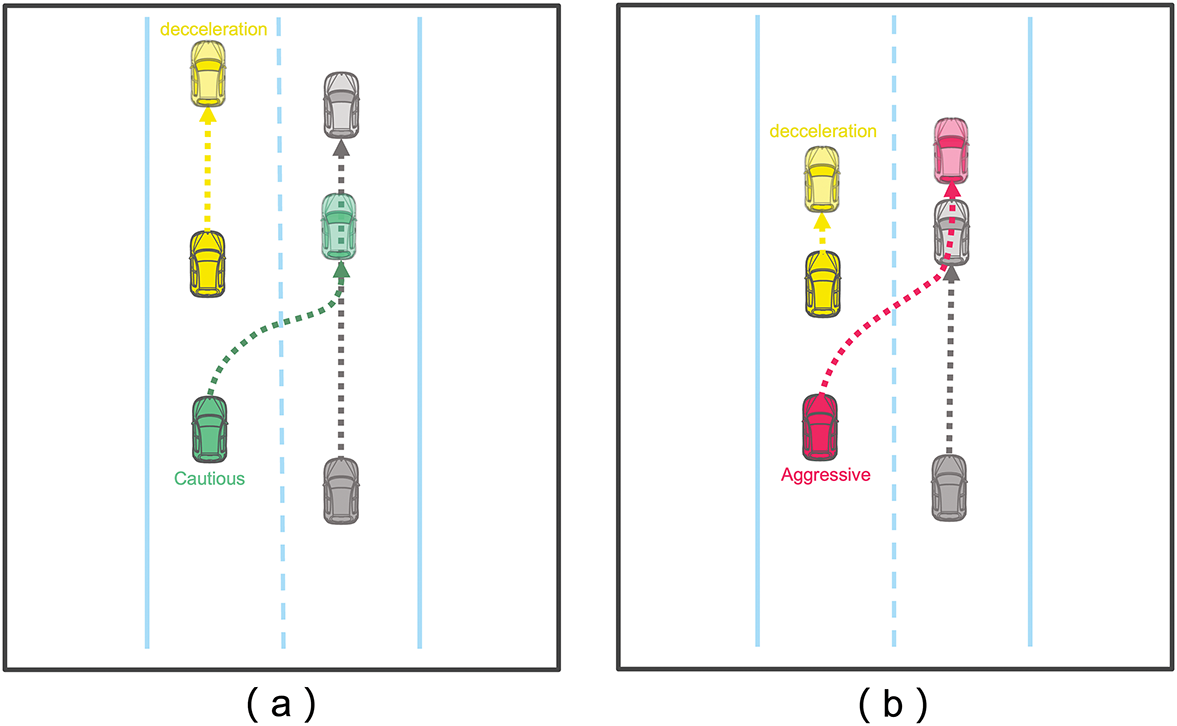
Figure 1: Vehicles with different driving styles may adopt distinct strategies in the same scenario. When the leading vehicle slows down, as shown in (a), cautious drivers typically decelerate and maintain a safe distance rather than overtaking immediately. In contrast, an aggressive driver, as shown in (b), is more likely to execute a sudden lane change to overtake quickly
Additionally, in engineering applications, trajectory prediction needs to be deployed in onboard processors to process large amounts of data from numerous traffic participants in real-time. Therefore, algorithmic efficiency is particularly important.
In recent years, deep learning methods have rapidly advanced trajectory prediction by encoding agent interactions and map semantic information [2]. However, while most approaches effectively capture high-level semantics and driving intentions by encoding vehicle trajectories and environmental interactions [4–6], end-to-end networks directly transform historical trajectories into future predictions, their opaque nature makes internal processes uninterpretable, obscuring the behavioral logic behind predictions. In critical scenarios like intersections and overtaking, providing causal connections and semantic information is crucial for safe autonomous driving decisions [7–9]. Analysis of the most challenging 20% of prediction scenarios in our baseline reveals that vehicles in similar situations often exhibit different driving styles. Our experimental analysis of these vehicles’ historical trajectories confirms significant distinctions in driving behavior characteristics, highlighting the importance of style-aware prediction.
On the other hand, the Transformer architecture, owing to its powerful attention mechanism [10], has been widely adopted across various domains, including natural language processing [11,12]. However, when modeling large-scale spatiotemporal interactions between nodes in trajectory prediction tasks, the computational demands increase rapidly. For N nodes, the complexity reaches
To address these challenges, we introduce the Driving Style-Guided Trajectory Prediction framework (DSG-TP): a novel trajectory prediction approach that integrates driving style recognition with factorized attention mechanisms. DSG-TP adopts a deep learning architecture with an efficient and lightweight design, aiming to balance model capacity and computational overhead. It provides accurate and diverse trajectory predictions for SAE L1–L5 levels of autonomous driving [13]. Its high-efficiency nature makes it especially suitable for deployment on in-vehicle computing platforms, meeting the real-time requirements of L3 and higher autonomy levels. Our model identifies driving behavior characteristics from different vehicles’ trajectories and incorporates them into vehicle-environment interactions, ultimately combining the driving style information to predict future trajectories. Furthermore, a vehicle’s driving style essentially represents probabilistic differences in its motion states. By explicitly recognizing driving styles within the network as decisive factors for trajectory prediction, the model can identify heterogeneous driving behaviors in similar scenarios, improve trajectory prediction accuracy in complex scenarios, and ensure consistency between observed behavioral patterns and predicted vehicle paths. Simultaneously, our model’s multi-modal trajectory predictions coupled with driving style information provide semantic insights about vehicles’ driving habits and decision patterns for the decision-making layer.
In terms of model design, we use factorized attention [14,15] to design a lightweight architecture that decomposes the original global spatiotemporal interaction into spatial, temporal, and environmental interaction modules. A local neighborhood partitioning method similar to [16] was adopted. This reduces computational complexity from
Our approach combines behavioral semantics with efficient interaction modeling, trained and evaluated on the Argoverse [17] dataset, achieving efficient real-time inference in dense traffic scenarios. The lightweight model is suitable for autonomous driving systems with high real-time requirements. Additionally, the model predicts trajectories and outputs driving style information. This is crucial for safe decision-making by autonomous vehicles in complex situations, helping to better address potential risks from different driving behaviors. The main contributions of this paper are:
• We propose a trajectory prediction model guided by vehicle driving styles, using probabilistically represented driving style labels as a key factor, mimicking human drivers’ decision-making processes. Experiments demonstrate that this method significantly improves prediction accuracy in complex traffic scenarios. Moreover, the predicted trajectories are physically consistent with driver behavior.
• The factorized attention mechanism optimizes data interaction efficiency in large-scale spatiotemporal scenes. Compared to naive attention designs, the model’s efficiency and inference speed are notably improved, ensuring real-time performance and efficiency on vehicle-mounted terminals.
2.1 Efficient Interaction Modeling for Trajectory Prediction
In the field of autonomous driving, deep learning methods have gradually become the mainstream approach for trajectory prediction. Compared to traditional rule-based and machine learning methods, deep learning performs better when facing complex dynamic traffic environments [18,19]. Long Short-Term Memory (LSTM) networks [20], due to their ability to capture long-term dependencies, are suitable for the sequential modeling of vehicle trajectories. Furthermore, a social pooling module was introduced into the LSTM architecture, enabling the model to consider interaction information from surrounding vehicles [21]. Graph Neural Networks (GNNs), Generative Adversarial Networks (GANs), and hybrid CNN-LSTM models have also been applied in the trajectory prediction field [22–24]. At the same time, attention mechanisms [10], known for their ability to capture global dependencies in parallel, have expanded from speech recognition and natural language processing to the trajectory prediction domain.
In multi-vehicle interaction scenarios, attention mechanisms can understand complex spatiotemporal relationships in scene contexts, significantly improving prediction performance, such as Transformer-based architectures [25] and [26]. These methods adopt multi-head attention mechanisms, allowing models to more precisely model spatiotemporal interaction relationships. However, in complex urban traffic scenarios with numerous traffic participants, flattening high-dimensional data leads to excessively long sequences, causing the computational cost of attention mechanisms to surge. An approach was proposed to limit each attention operation to a single axis to reduce computational costs and apply this technique to autoregressive generative modeling of images [14]. A similar approach was used when building attention-based classifiers by factorizing the spatial and temporal dimensions of video inputs [15].
Our method adopts a similar factorized attention mechanism. By decomposing spatiotemporal attention calculations, we process spatial, temporal, and road information interactions in this way. Additionally, we handle vehicle-road information interactions within local neighborhoods, reducing global interaction complexity from higher-order relationships to linear relationships.
Driving style reflects drivers’ personalized behavioral preferences in the same scenario (such as aggressive overtaking or conservative following), which is one of the important reference factors for human drivers to predict the behavior of other vehicles [27,28]. Early research classified styles through rule-based systems [29–31], but these methods relied on manually designed features and had limited generalization ability. Machine learning-based methods can be divided into unsupervised clustering [32,33] and supervised classification [34,35], with the former lacking interpretability and the latter limited by annotation costs. Recent research has attempted to combine these methods, for example, by improving recognition performance by combining K-means clustering with support vector machines [36], but these methods do not consider the uncertainty and time-varying nature of driving styles in complex environments.
Zhang et al. [37] extracted vehicle Driving Operation Panorama (DOP) and implicitly modeled driving styles using Convolutional Neural Networks (CNNs) to assist with vehicle lane-changing decisions. However, implicit style modeling makes internal model information difficult to observe and evaluate. Wang et al. [38] used transformers to model vehicle behavior, with the decoder generating three-dimensional one-hot driving style labels (aggressive, smooth, conservative) trained based on K-means clustering results. However, one-hot labels cannot refine the multi-modal features and temporality of driving styles in complex scenarios, and K-means clustering assigns data points to fixed clusters, which is not suitable for the inherent fuzziness and uncertainty of driving styles.
In our work, we first use a Gaussian Mixture Model (GMM) to cluster the kinematic features of historical trajectories in the dataset. Unlike k-means, the GMM provides a probabilistic representation, assigning each data point a likelihood of belonging to different clusters. This allows us to generate a probabilistic representation of driving style labels, which are then used as supervised signals in the model output to guide training. Our model employs a two-stage approach to driving style prediction. The first stage uses Attention-LSTM to recognize the vehicle’s initial behavioral tendencies, which helps direct the learning of subsequent features. Subsequently, we combine this with environmental interactions to output multimodal driving style information. This approach enables a more accurate identification of the driver’s behavioral characteristics. The probabilistic representation captures the overlapping nature of real driving styles, while the multimodal results reflect the inherent uncertainty in actual driving behavior.
2.3 Multimodal Trajectory Prediction
Human behavior is inherently multimodal and uncertain: given historical trajectories and surrounding environmental information, an agent may have multiple reasonable future trajectories. Multimodal trajectory prediction generates multiple plausible future paths that account for vehicles’ uncertain intentions and environmental changes. By providing a set of potential trajectories rather than a single prediction, this approach enables autonomous driving systems to make more informed and robust decisions [39].
Generative Adversarial Networks encourage the model to produce diverse trajectories through an adversarial loss function. However, they are sensitive to map resolution and incur significant computational costs [22,40]. Conditional Variational Autoencoders (CVAE) generate diverse predictions by maximizing the evidence lower bound of the feature distribution, allowing better control over the latent distribution. However, sampling in the latent space can result in predictions that lack temporal correlation and struggle to capture dynamic changes in complex scenarios [41,42].
In our approach, similar to [43], we parameterize multimodal future trajectories as a Laplace mixture distribution. Unlike Gaussian mixture density networks, the Laplace distribution has heavier tails, enabling it to handle extreme events and outliers (sudden lane changes, hard braking) that occur in dynamic traffic scenarios.
Our model is trained and tested using the Argoverse 1 dataset, which includes 324,557 traffic scenarios, each containing 5-second vehicle trajectories and map information sampled at 10 Hz. The prediction framework utilizes 2-second historical observations to predict 3-second future trajectories. The model architecture follows an Encoder-Decoder structure, generating multimodal predicted trajectories for all vehicles in each scene in parallel.
As illustrated in Fig. 2, the model consists of several components: driving behavior recognition, spatio-temporal interaction, multimodal fusion, global interaction, driving style decoder, and trajectory decoder. First, we extract kinematic features related to driving styles from vehicle trajectory data and utilize Attention-LSTM to capture driving behavior features. These are then integrated with the agent’s features, enabling the model to more accurately capture dynamic driving behavior. Next, the model interacts with neighboring vehicles’ motion state, lane topology, and semantic features, allowing it to learn the spatial, temporal, and semantic information of the surrounding environment. Global information is incorporated after local interactions with all vehicles, capturing long-range relationships from a broader perspective. The Feature-wise Linear Modulation (FiLM) [44] was introduced to modulate local features with driving behavior features, and then integrates global features, which are used to predict multimodal driving styles through an MLP. Finally, the fused multimodal driving style predictions, along with local and global interaction features, are combined for multimodal trajectory prediction using the Final Decoder.
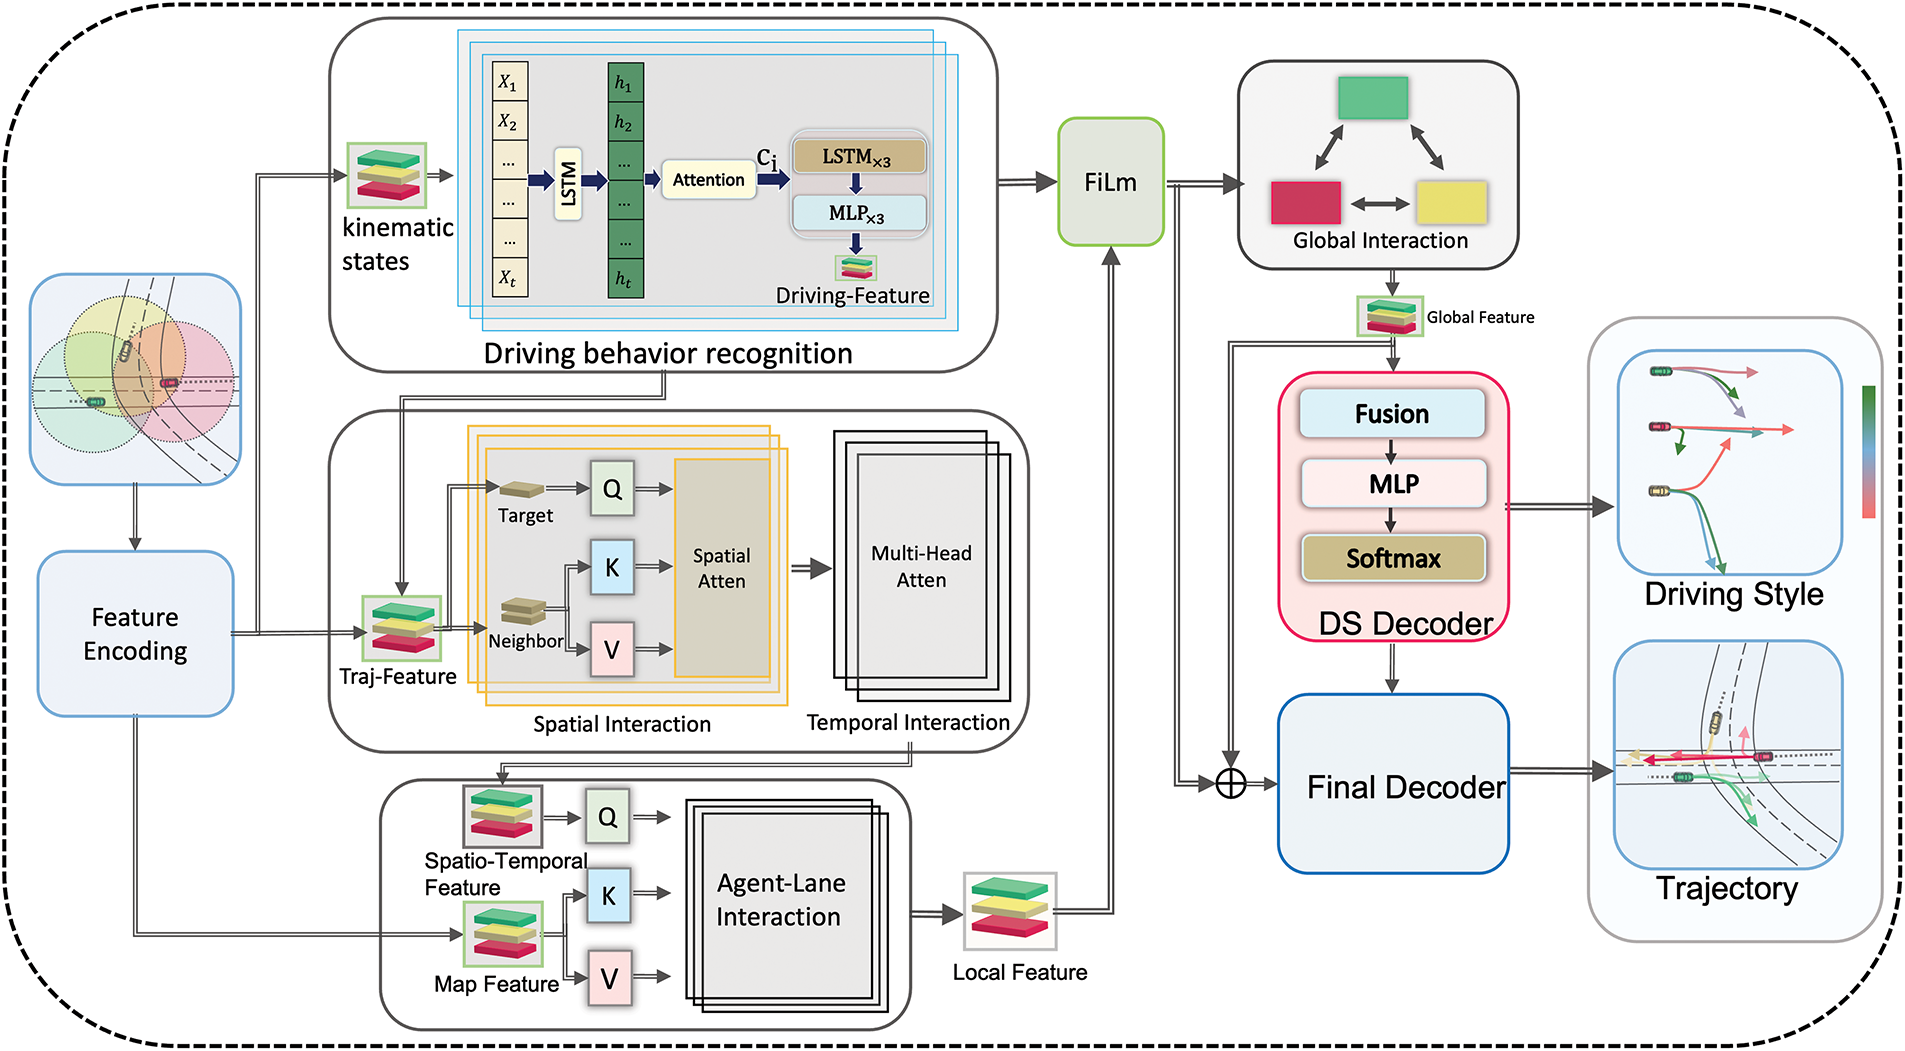
Figure 2: Architecture of DSG-TP. The model takes vehicle historical trajectories and map information as input, and outputs multi-modal future trajectories with corresponding driving styles. Film denotes Feature-wise Linear Modulation, which is used to fuse the driving features and local features. The DS decoder and Final decoder are responsible for generating the multi-modal driving styles and future trajectories, respectively, with different colors used to distinguish each mode
The Argoverse dataset provides trajectory data for multiple vehicles in each scenario, along with scene map data in vector form as input to the model. Scene-centered representation helps the model learn information about the relative poses between vehicles, while an ego-vehicle perspective helps preserve local motion characteristics. We convert the original global coordinates to perspectives centered on each vehicle, simultaneously leveraging the advantages of both ego-vehicle and global perspectives in our model to combine their strengths.
Within the same scene,
Here,
3.3 Driving Style Pre-Clustering
To initialize driving style labels for model supervision, we extract kinematic features from filtered trajectories and apply a Gaussian Mixture Model (GMM). Following the study on kinematic feature-based driving style clustering by [45], we select four key features that effectively distinguish different driving styles. For each agent
where B represents the number of clusters, and
3.4 Driving Behavior Recognition
The goal of the Driving Behavior Recognition module is to process the relevant kinematic features from the vehicle trajectory to extract the semantic information related to the vehicle’s driving behavior. For agent
The advantage of the attention mechanism lies in its ability to dynamically select important features, allowing the model to focus on the most critical parts of the sequence. While LSTM excels at capturing temporal dependencies, the attention mechanism further enhances this capability by allowing the model to effectively concentrate on the crucial time steps in the sequence.
Therefore, we first use the LSTM to map these input features to the hidden state space, generating the hidden state sequence
The resulting context vector
3.5 Vehicle-Environment Interaction
To improve computational efficiency in multi-agent trajectory prediction, we adopt a factorized attention architecture that decomposes interactions into spatial, temporal, and agent-lane dimensions. Let N, T, and L denote the number of agents, historical time steps, and lane segments, respectively.
For temporal modeling, each agent attends to its own T-step history, leading to a complexity of
This is significantly more efficient than the original dense attention of
For agent
where
Environmental context is incorporated using gated attention weights, which are multiplied with attention scores to amplify the weights of key interactions. The final local spatial features for agent
where
The spatial features of agent
Here, the query
A multilayer perceptron (MLP) maps the MHA output to the local spatiotemporal features of agent
Residual connections and layer normalization are added during training to enhance stability and improve the model’s generalization ability.
The map encoding features include lane topology and semantic information critical to vehicle behavior. Therefore, it is necessary to perform cross-modal interaction between the agent’s spatiotemporal features
To capture global dependencies across local regions, a global interaction module is designed. For agents
Using
Long-range information is captured through the aforementioned spatial attention computation to interact with each agent from a global perspective, obtaining the global interaction features for agent
Since local features vary across different driving behaviors, Feature-wise Linear Modulation (FiLM) [44] is introduced to dynamically adjust their representation. FiLM is a conditioning mechanism that modulates neural network activations through affine transformations, allowing local features to adaptively respond to driving behaviors:
where
Local features are then fused with global features to integrate fine-grained local interactions with scene-level global context:
A multilayer perceptron decodes
In the final stage, the
Given that predicted vehicle trajectories often exhibit sharp peaks and heavy tails, a Laplacian distribution is employed to model each mode. The multi-modal prediction output is thus represented as a mixture of
To fuse style and contextual features, the vectors
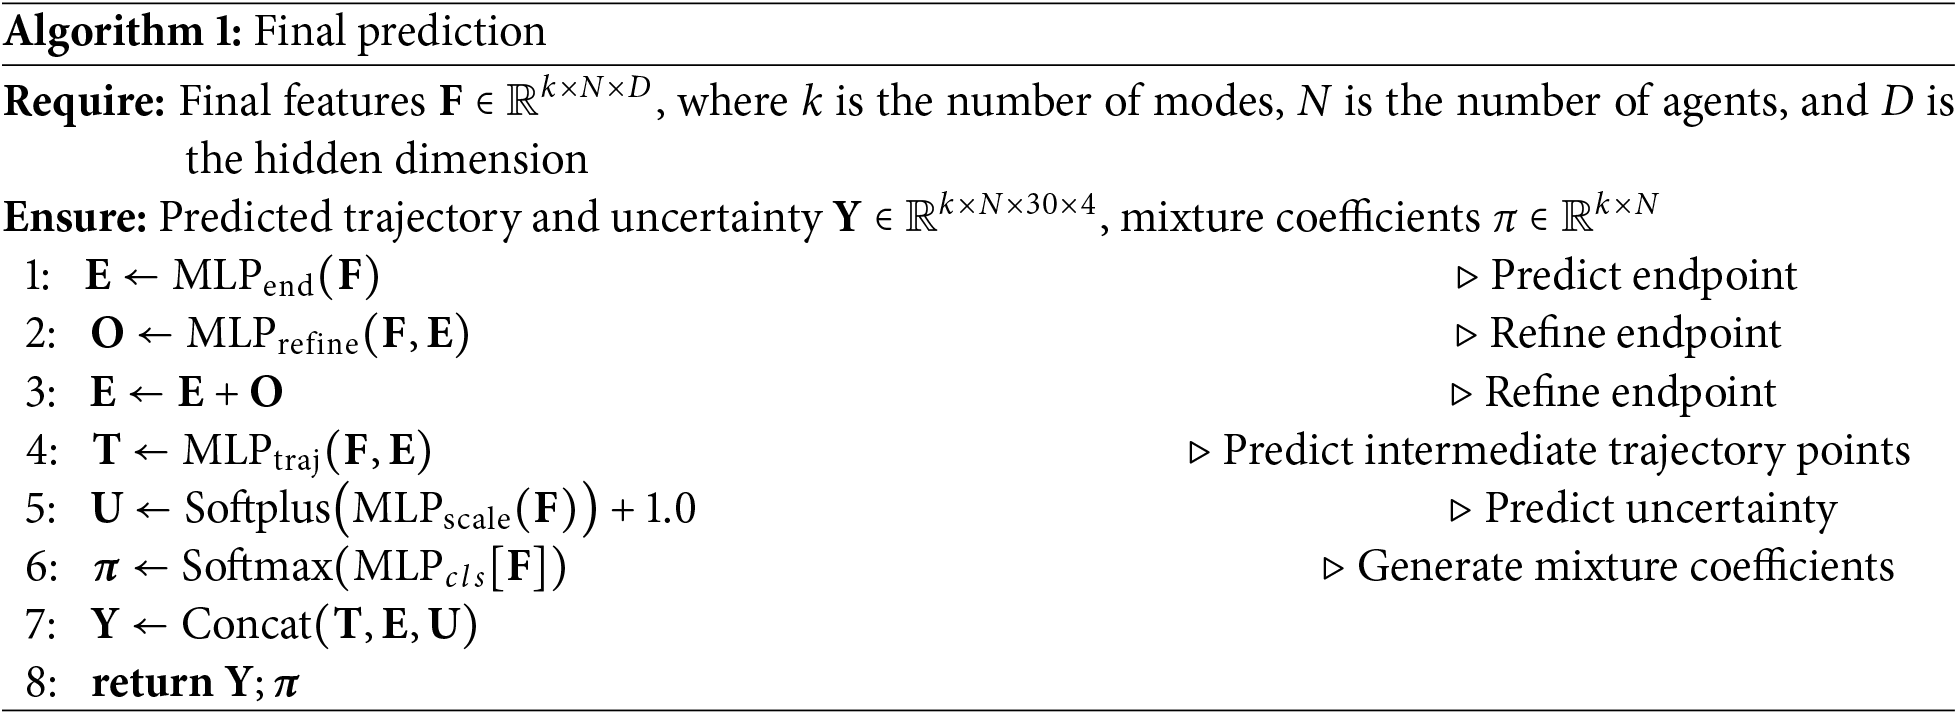
The decoder architecture follows the ADAPT [48], which enhances prediction quality by refining endpoint estimates. In the initial stage, rough endpoints are predicted using an MLP. These are then refined through an additional MLP-based process, improving spatial accuracy. Intermediate trajectory points are generated separately, also via an MLP network. Prediction uncertainty is estimated through a Softplus activation layer, while mode probabilities (mixture coefficients) are produced by another MLP and normalized using a Softmax function.
The final output trajectory integrates the predicted points, refined endpoints, and their corresponding uncertainties. This output is represented as
The time complexity of Algorithm 1 is
During the training phase, to constrain the consistency between generated trajectories and their corresponding driving styles, we first determine an optimal modality. For agent
The term
The hyperparameter
For the selected mode
where
The driving style loss aims to minimize the KL divergence between the predicted style distribution and its corresponding GMM pseudo-label. These pseudo-labels serve as behavioral anchors for the driving style decoder, constraining the predicted styles to remain consistent with the physical characteristics of observed trajectories. Similarly, we apply class-based weighting to this loss term:
The optimal mode is selected by jointly minimizing trajectory errors and style discrepancies, formulated as a weighted cross-entropy loss with soft assignments
The sample weight
where N is the total number of samples, B is the number of driving style classes, and
As mentioned in [22], variety loss can alleviate the problem of modal collapse. Finally, our training objective includes three parts of the loss functions:
This study employs the Argoverse 1 benchmark dataset, widely recognized in the autonomous driving field, for model training and evaluation. The dataset contains 324,557 scenarios, each recording 5-second vehicle trajectories and high-precision map information at a 10 Hz sampling rate. The prediction task requires models to forecast 3-second motion trajectories based on 2 s of historical observation data. The data distribution encompasses diverse driving scenarios, ensuring the model’s generalization capability. Our experimental training, validation, and test sets contain 205,942, 39,472, and 78,143 scenarios, respectively.
This study uses widely accepted evaluation metrics for performance testing, including minimum Final Displacement Error (minFDE), minimum Average Displacement Error (minADE), and Miss Rate (MR). The minFDE and minADE quantify geometric deviations between predicted and actual trajectories, while MR reflects the model’s accuracy in capturing target endpoint positions.
The model employs advanced spatial-temporal interaction modeling methods. For the spatial dimension, the ego vehicle interacts with lanes and vehicles within a 50-meter radius. The driving behavior feature dimension is set to 64. The number of attention heads in all modules is set to 8. The training framework was deployed on an NVIDIA RTX 4090 Ti GPU platform with a batch size of 64 for 50 epochs. The optimization strategy uses AdamW with initial learning rate, weight decay, and dropout rate set to
Due to the lack of driving style annotations in large-scale traffic datasets, this study employs Gaussian Mixture Models (GMM) for unsupervised clustering of vehicle trajectory data to automatically extract driving style features and generate labels for training. We extracted average velocity, average acceleration, average deceleration, and lateral jerk variance as kinematic features for clustering, constructing a multi-dimensional feature space. By optimizing GMM parameters through the Expectation-Maximization (EM) algorithm, driving behaviors were categorized into three representative style clusters: conservative, aggressive, and moderate. The radar chart in Fig. 3 visually compares the normalized features across different driving styles.
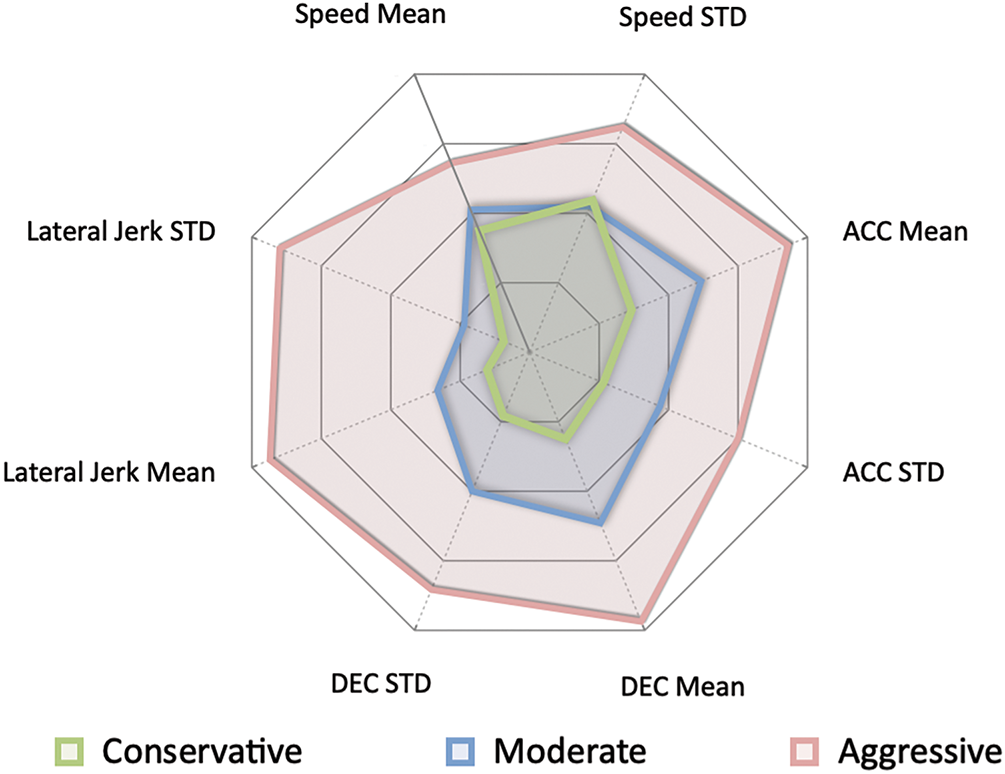
Figure 3: Radar chart visualizing normalized kinematic features across three driving styles: conservative (green), moderate (blue), and aggressive (red)
To evaluate the quality and reliability of clustering results, we applied t-SNE [49] to downscale high-dimensional features to 3D space for visualization. The t-SNE technique captures and maintains the relative distance relationships among data points, exposing the underlying clustering structures within high-dimensional feature spaces. As illustrated in Fig. 4, the feature distributions of distinct driving styles exhibit clear separation. The visualization highlights the emergence of three well-defined clusters, each corresponding to a specific driving style. This distinct partitioning within the reduced feature space reinforces the efficacy of the GMM clustering approach in differentiating driving behaviors with precision.
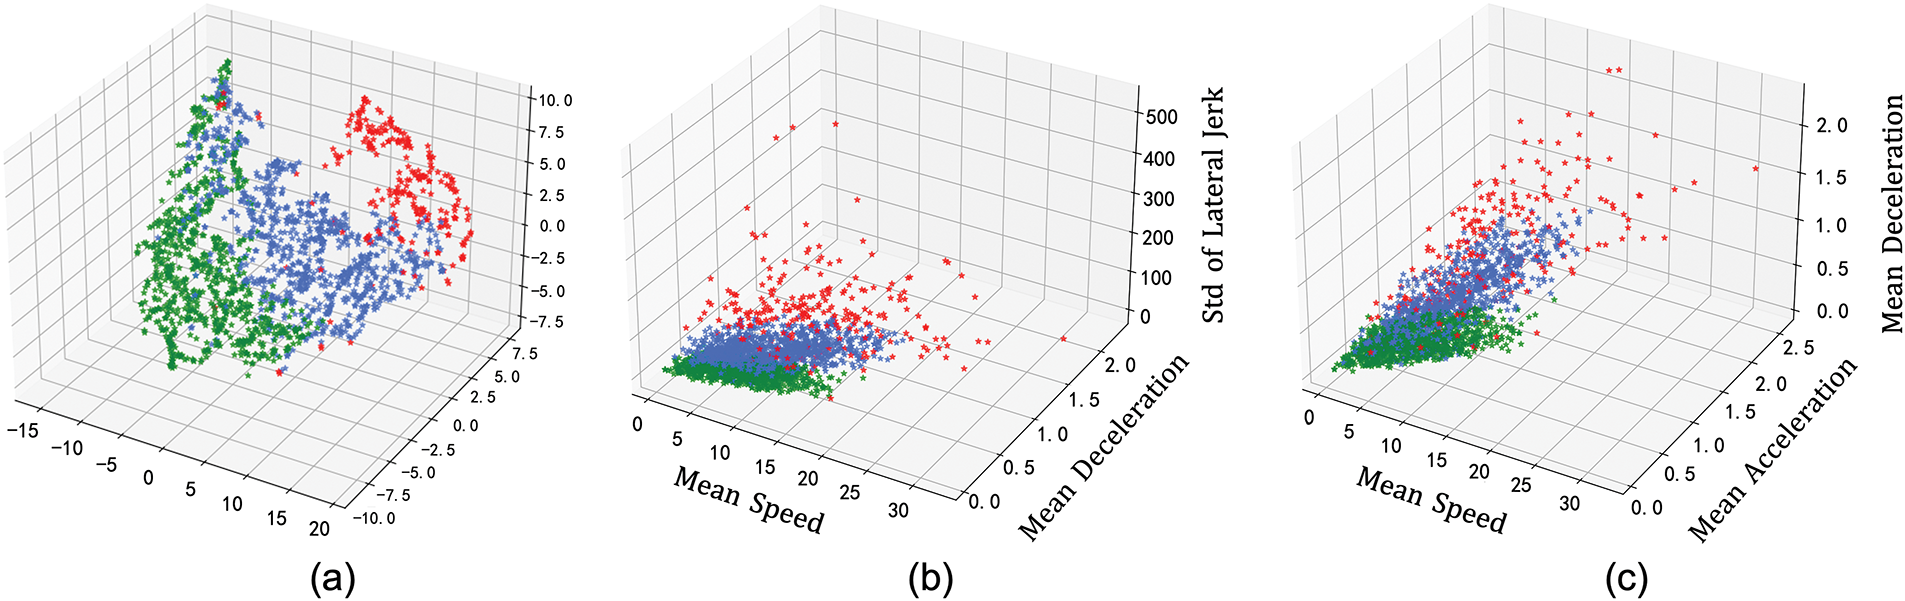
Figure 4: The figure illustrates the GMM pre-clustering distribution of driving styles in the Argoverse dataset. The t-SNE dimensionality reduction visualization is presented in (a). Panels (b) and (c) provide visualizations of different sample feature distributions. The green, blue, and red sample points represent distinct driving styles: conservative, moderate, and aggressive, respectively
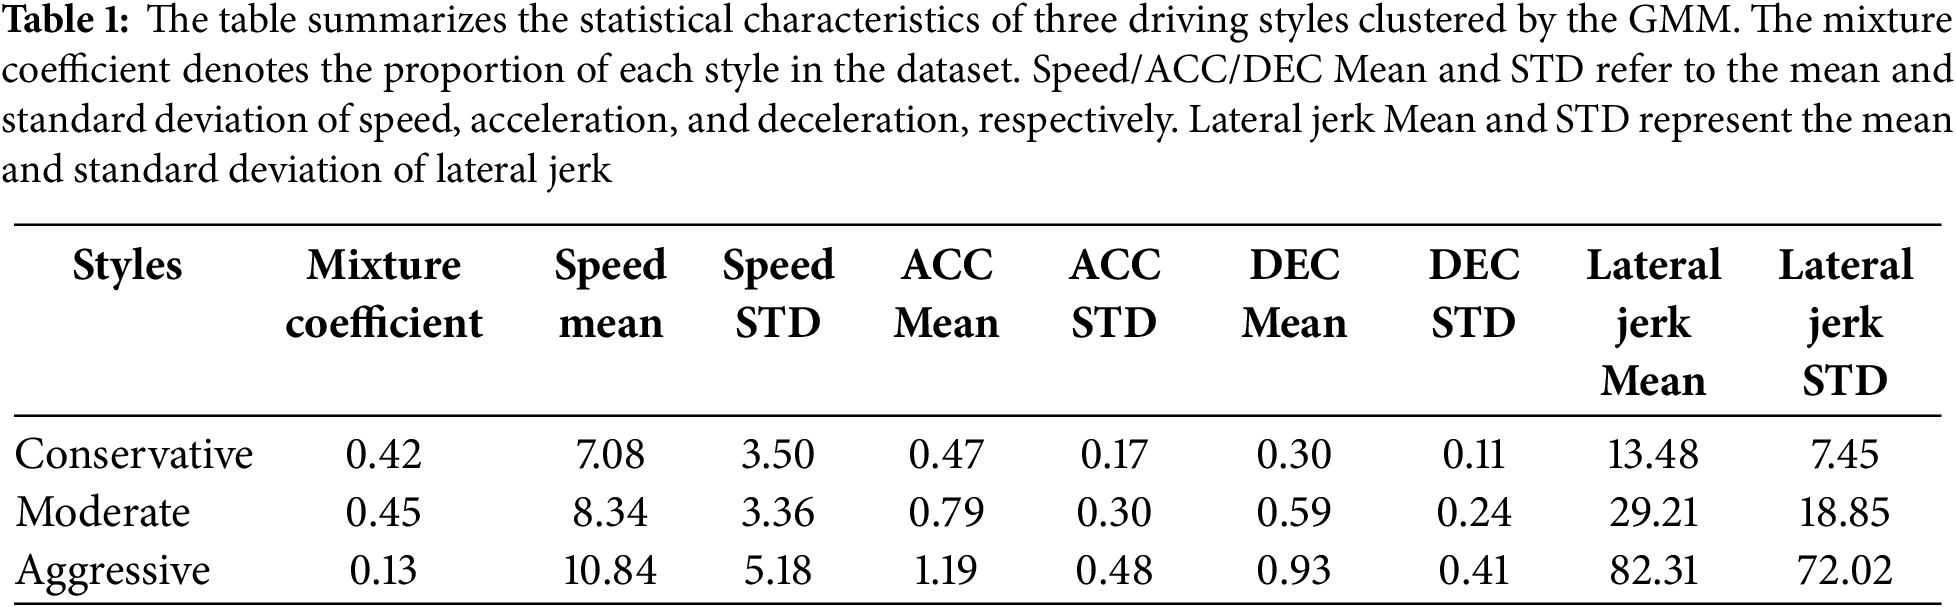
Table 1 details the statistical parameters of the three driving styles. Notably, lateral jerk variance is the most significant feature dimension for distinguishing driving styles, showing order-of-magnitude differences across the three behavior types. This parameter quantifies the smoothness of lane changes and lateral control characteristics. Additionally, average acceleration and deceleration serve as important distinguishing indicators, reflecting drivers’ power output preferences and braking behavior patterns. Average velocity reflects overall behavioral preferences. The statistical clustering results clearly differentiate systematic variations across driving styles in dimensions of speed control strategies, power response characteristics, braking habits, and lane-changing behaviors.
4.5 Analysis of Driving Style Influence in Different Traffic Scenarios
Based on the inference results of the baseline model, we selected several common traffic scenarios from the top 20% most challenging scenes in the Argoverse validation set: straight lanes, intersection-through, left turns, right turns, and lane changes. We then analyzed the driving styles of agents under these scenarios. As shown in Table 2 and Fig. 5, in complex scenarios such as intersections and turning, drivers with different habits exhibit more varied behaviors. In contrast, vehicle behavior on straight roads is more uniform, with the smallest standard deviation in driving style. In lane change scenarios, vehicles often accelerate and decelerate frequently, resulting in the highest average driving style value.
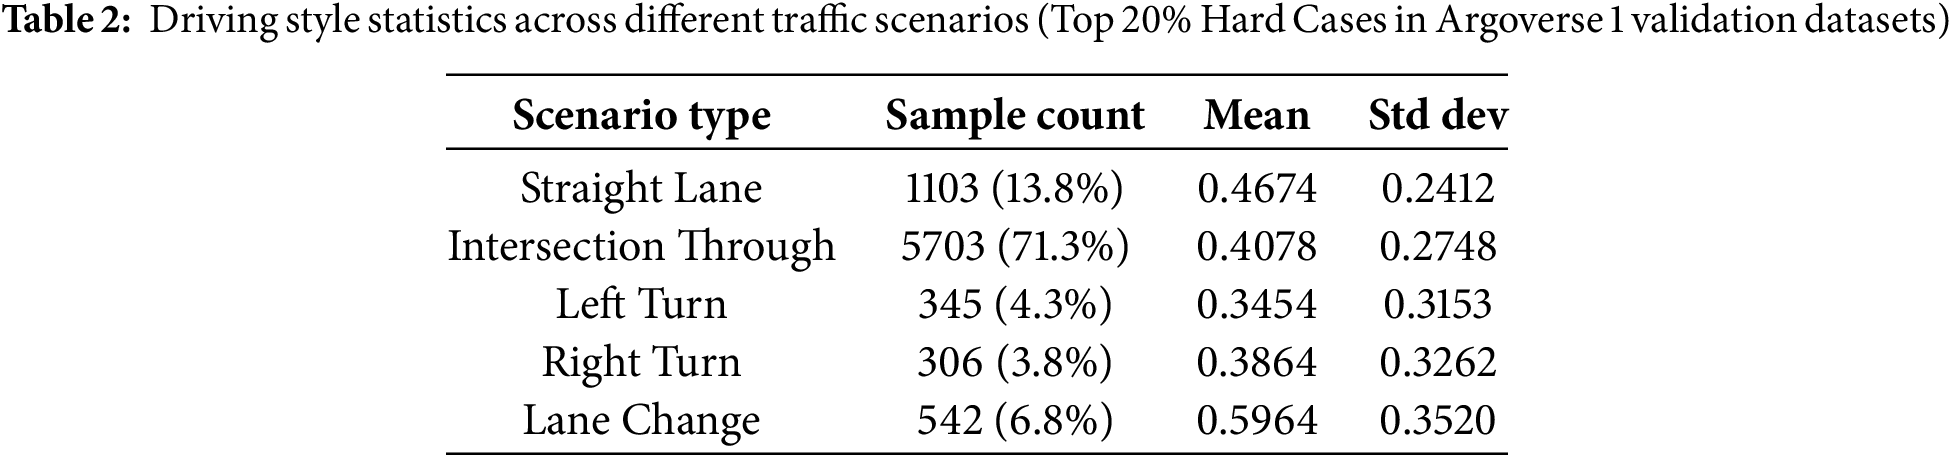
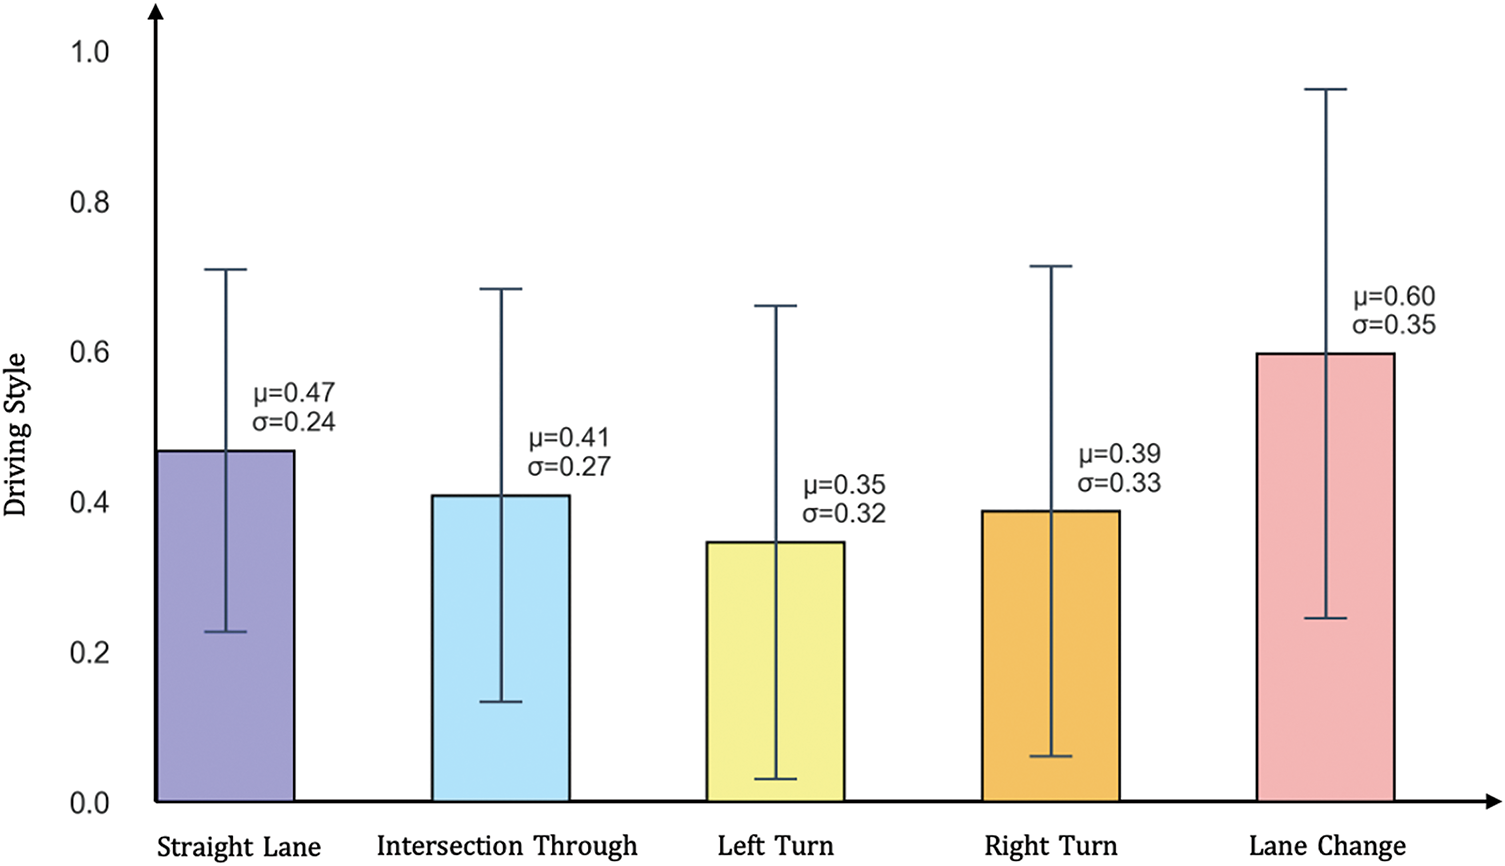
Figure 5: This figure shows the statistical distribution of driving styles across different traffic scenarios.
Next, we conducted two sets of comparative experiments in these five scenarios. The first group used the baseline model, while the second group employed DSG-TP for inference. As shown in Fig. 6, the prediction performance of DSG-TP improved across all scenarios. In scenarios with significant variations in driving style, DSG-TP achieved notable accuracy gains by effectively capturing style-related features. In lane-change scenarios, ADE decreased by 20.1% and FDE decreased by 36.0%.
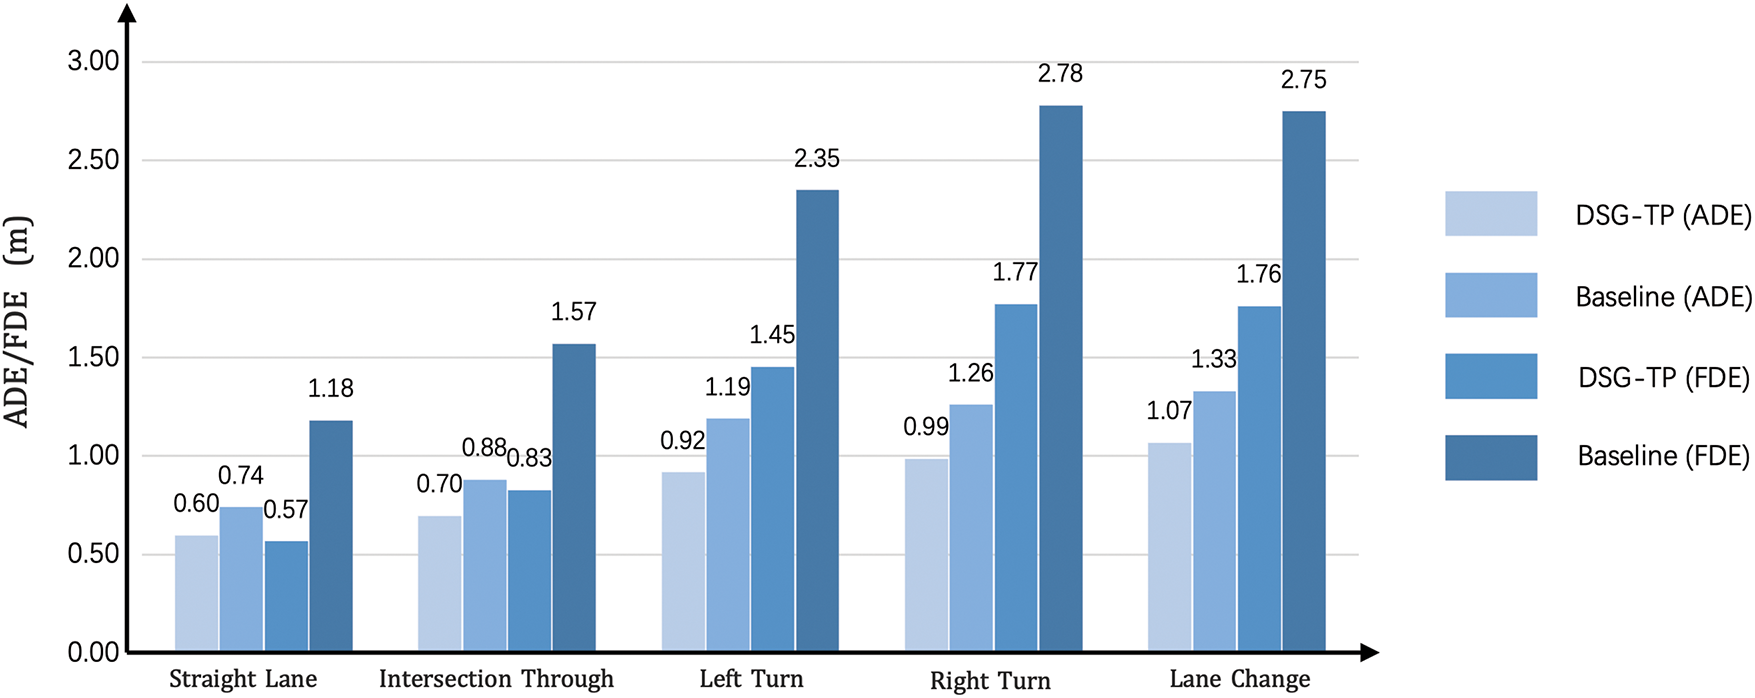
Figure 6: Performance comparison: ADE&FDE across scenarios
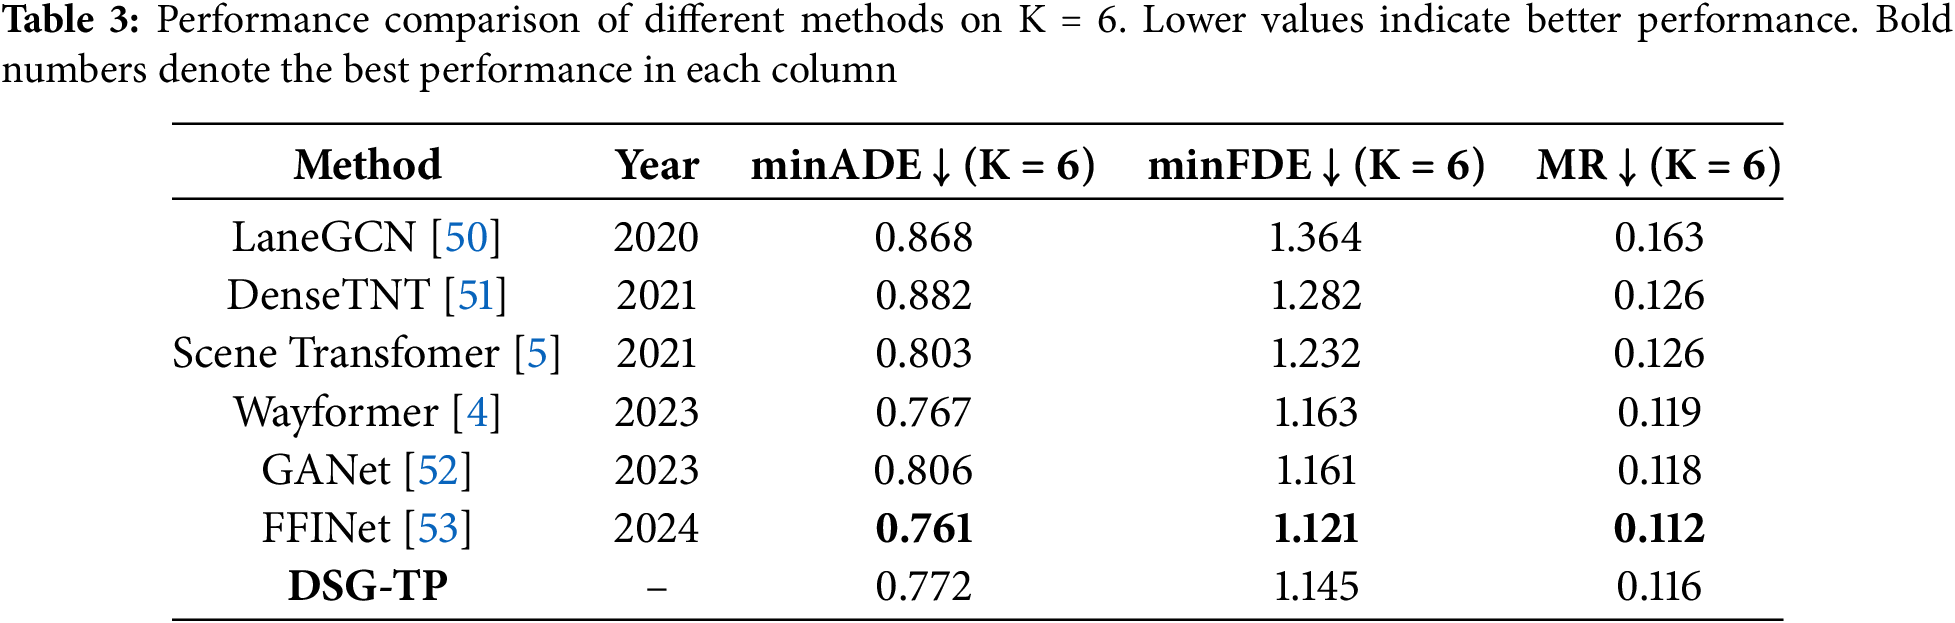
We compared our method with mainstream trajectory prediction algorithms on the Argoverse test set, using evaluation metrics including minimum Final Displacement Error (minFDE), minimum Average Displacement Error (minADE), and Miss Rate (MR). As shown in Table 3, our method ranks second in all quantitative metrics, demonstrating stronger trajectory prediction capabilities compared to most existing models. Our approach incorporates multimodal driving style information, allowing the generated trajectories to better match various driving behaviors and reduce mode collapse in complex traffic situations.
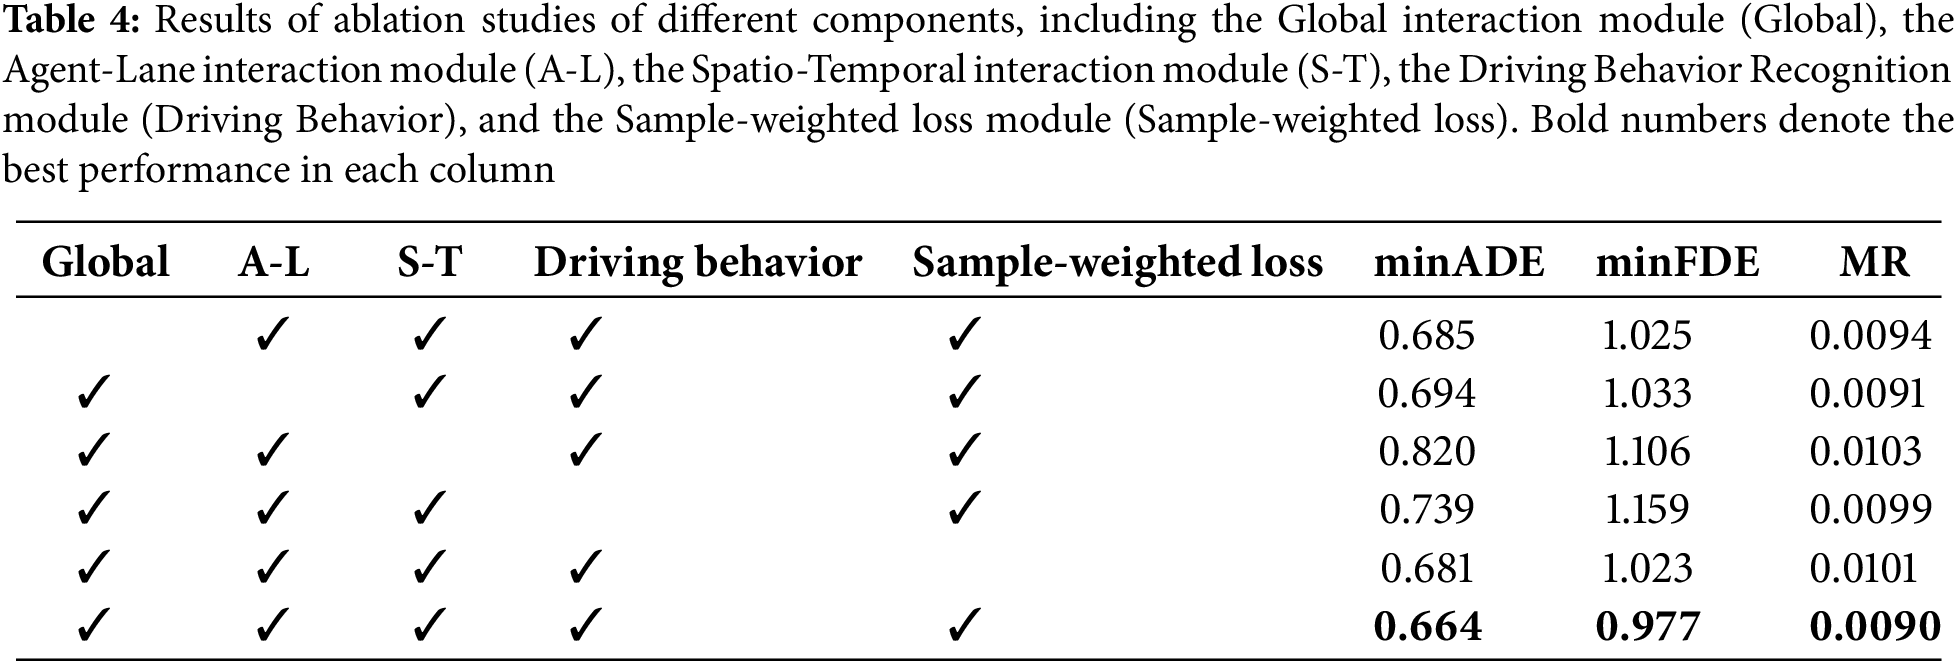
We conducted ablation experiments on the Argoverse 1 validation set to evaluate the impact of each module on model performance. First, we removed the global interaction module, which made it difficult for the model to capture cooperative relationships between vehicles due to the lack of global information constraints, resulting in an overall decrease in trajectory prediction accuracy. Second, the multi-modal fusion module allows vehicles to interact with lanes, traffic environment, and other information, enabling a more comprehensive understanding of the driving scene. Experimental results show that this module played a key role in improving prediction accuracy. The spatio-temporal interaction module is the most critical component in almost all trajectory prediction models, as it captures dynamic features in both time and space dimensions, ensuring that the model can generate reasonable trajectory distributions. After removing this module, the model’s prediction capability significantly declined.
The improvement in overall performance of the Driving Behavior Recognition module was particularly significant. Experimental data showed that the introduction of the module reduced MR by 9.7% and minADE by 11.2%. minFDE was optimized to the greatest extent possible, with a reduction of 18.7%, as the module was able to better understand the vehicle’s driving behavior and thus generate a reasonable trajectory. Moreover, we evaluated the impact of removing the sample-weighted loss, which had been introduced to balance the underrepresented driving style. Without this weighting, performance degraded by 2.6% in minADE, 4.7% in minFDE, and 12.3% in MR, confirming that the weighted loss effectively mitigates class imbalance. A summary of these ablation experiments is presented in Table 4.
As Fig. 7 demonstrates, we selected multiple highly dynamic and interactive scenes from the most challenging 20% of the Argoverse 1 validation datasets to compare our method with models that do not consider driving styles. The visualization results illustrate that our approach achieves superior predictive performance, generating more realistic and feasible trajectories in complex environments.
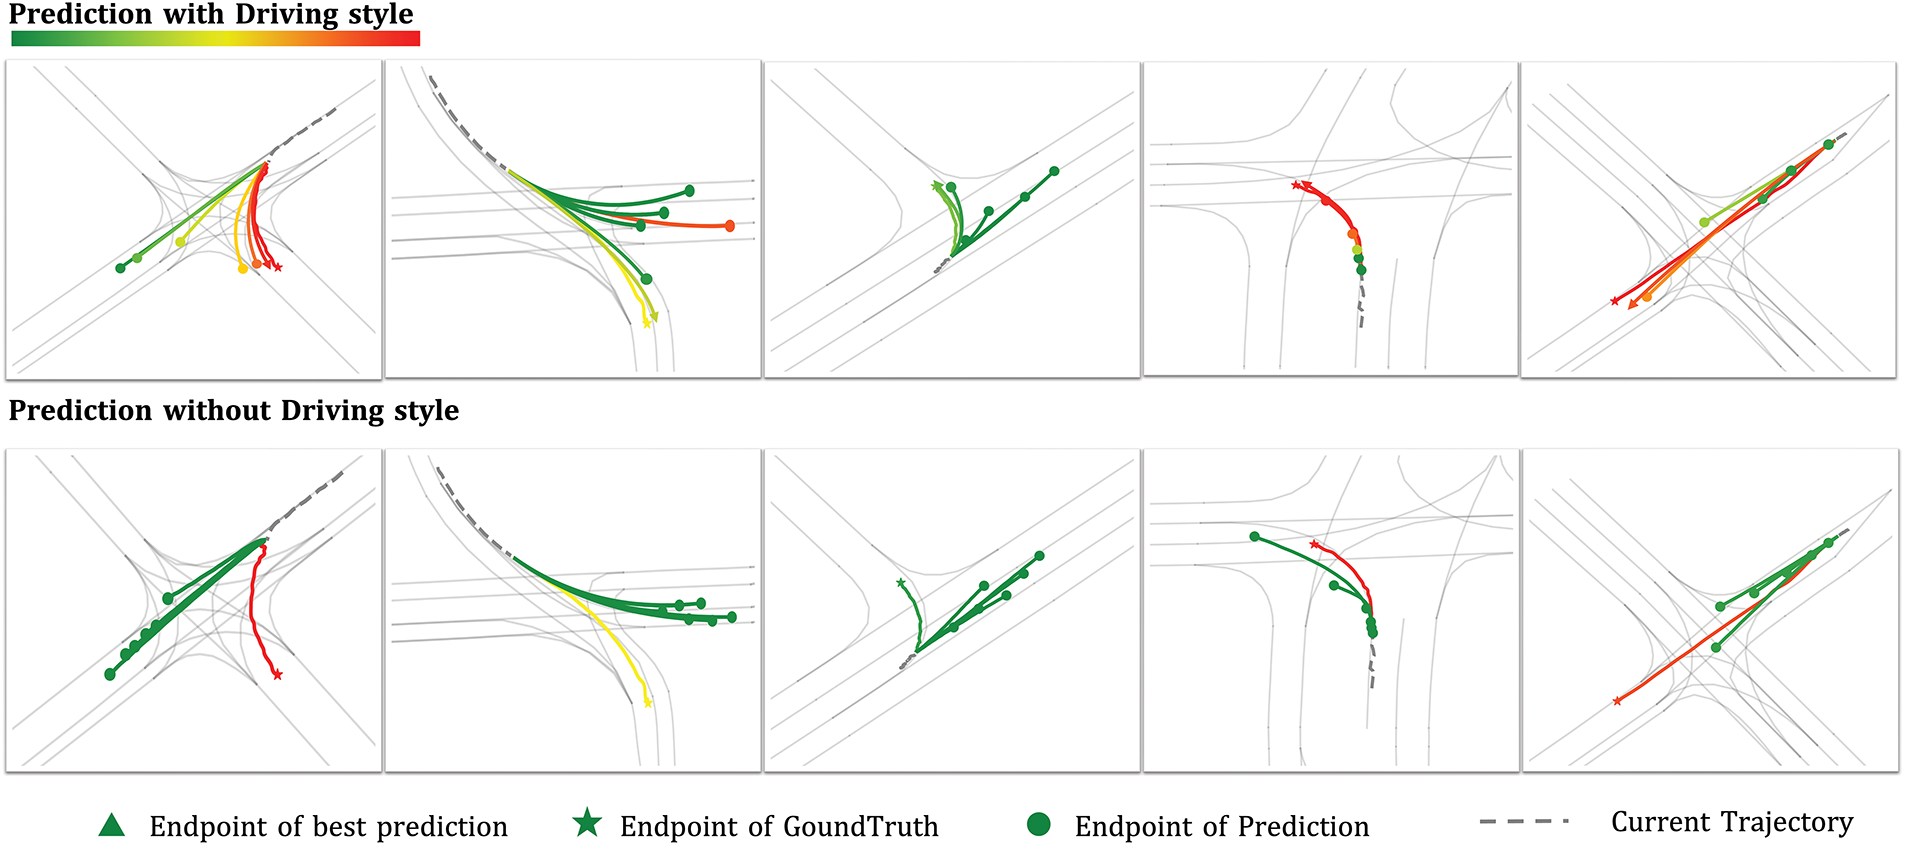
Figure 7: Visualization of trajectory prediction results across various complex scenarios. The upper portion of the figure displays predictions from our DSG-TP, where different driving styles in the multimodal future trajectories are distinguished by colors (green, yellow, and red represent conservative, moderate, and aggressive styles, respectively). The optimal modal trajectory endpoint is marked with a triangle. The lower portion of the figure shows prediction results without the driving style recognition module
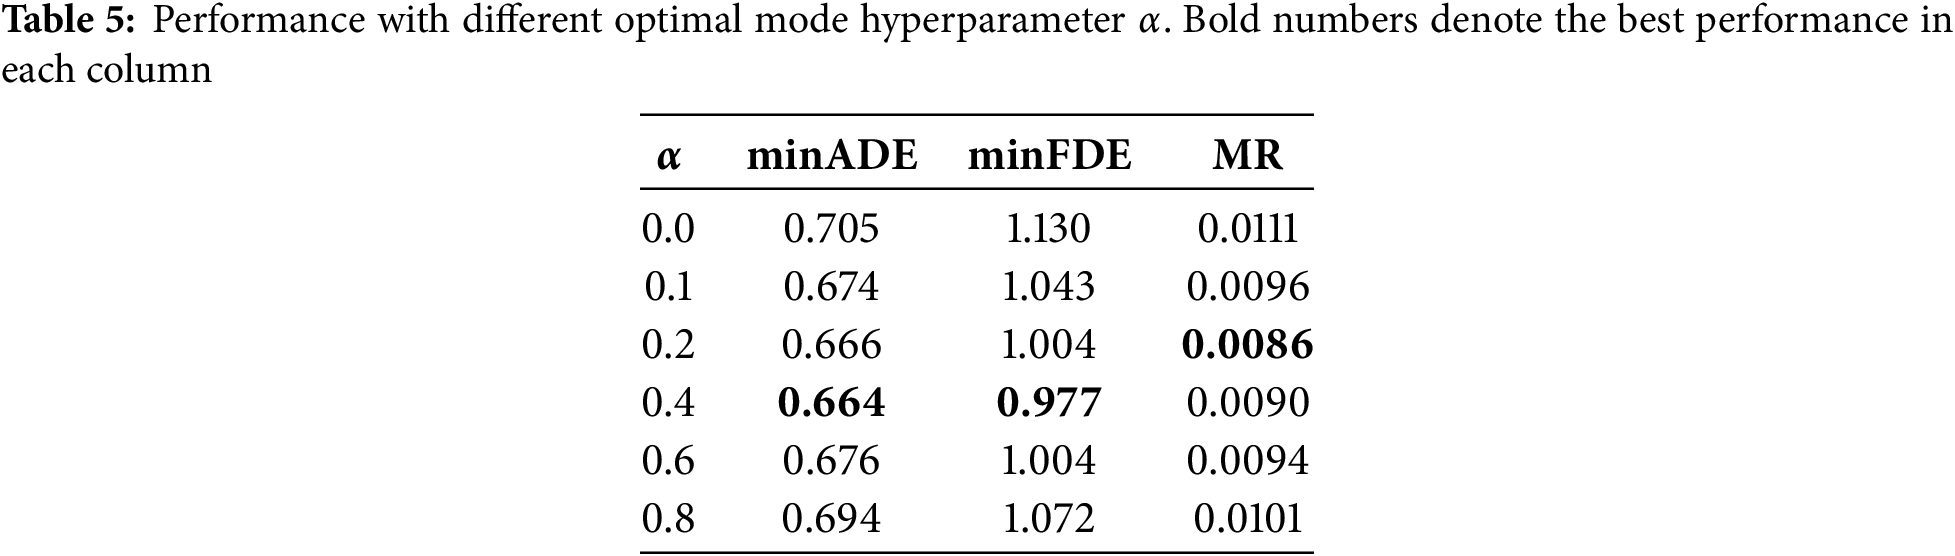
The optimal weight coefficient for the modal selection in Eq. (16) was determined through experiments: when
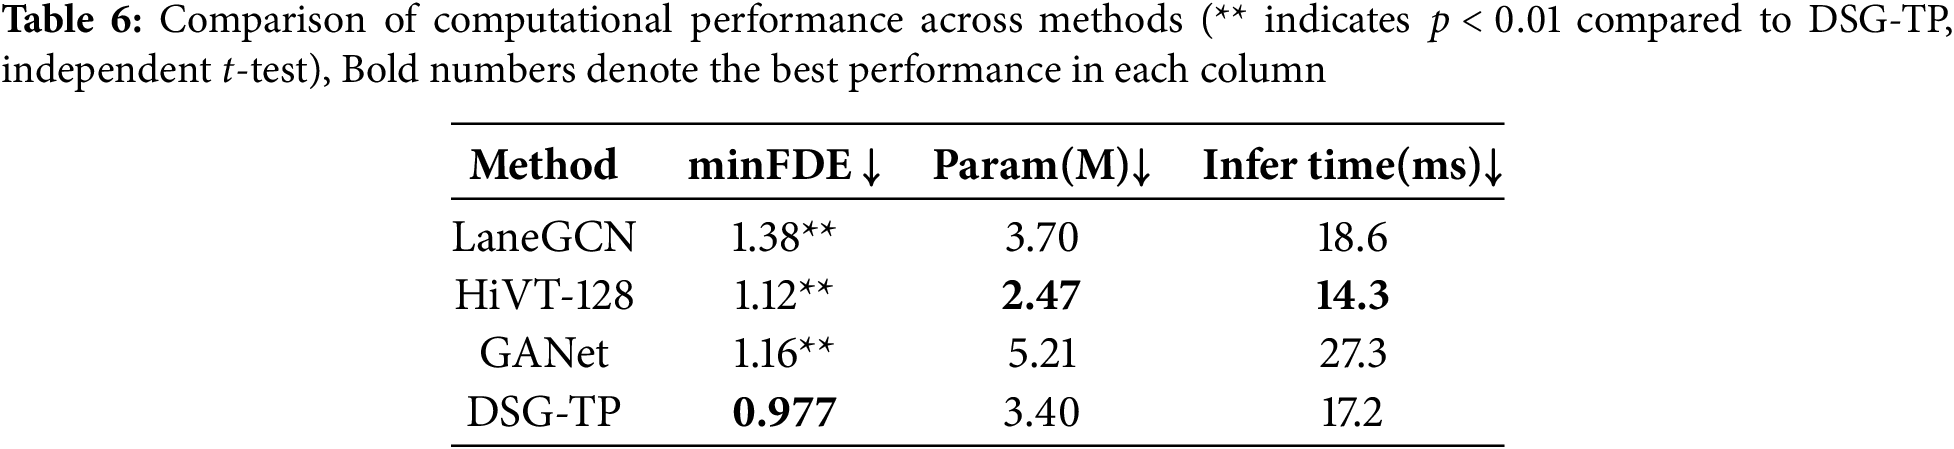
Computational Performance: We reproduced the Lane-GCN [50], HiVT-128 [43], and GANet [52] models under identical hardware conditions and evaluated trajectory prediction performance on the Argoverse 1 validation dataset. To ensure rigorous comparison, we conducted independent t-tests to assess the statistical significance of performance differences between models. As shown in Table 6, DSG-TP achieves competitive prediction accuracy while maintaining a more lightweight parameter footprint compared to these models. The improvement in minFDE for DSG-TP over the HiVT-128 is statistically significant (p < 0.01). Furthermore, our implementation of factorized attention significantly reduces computational demands, resulting in DSG-TP’s average inference time across all scenarios being second only to HiVT-128.
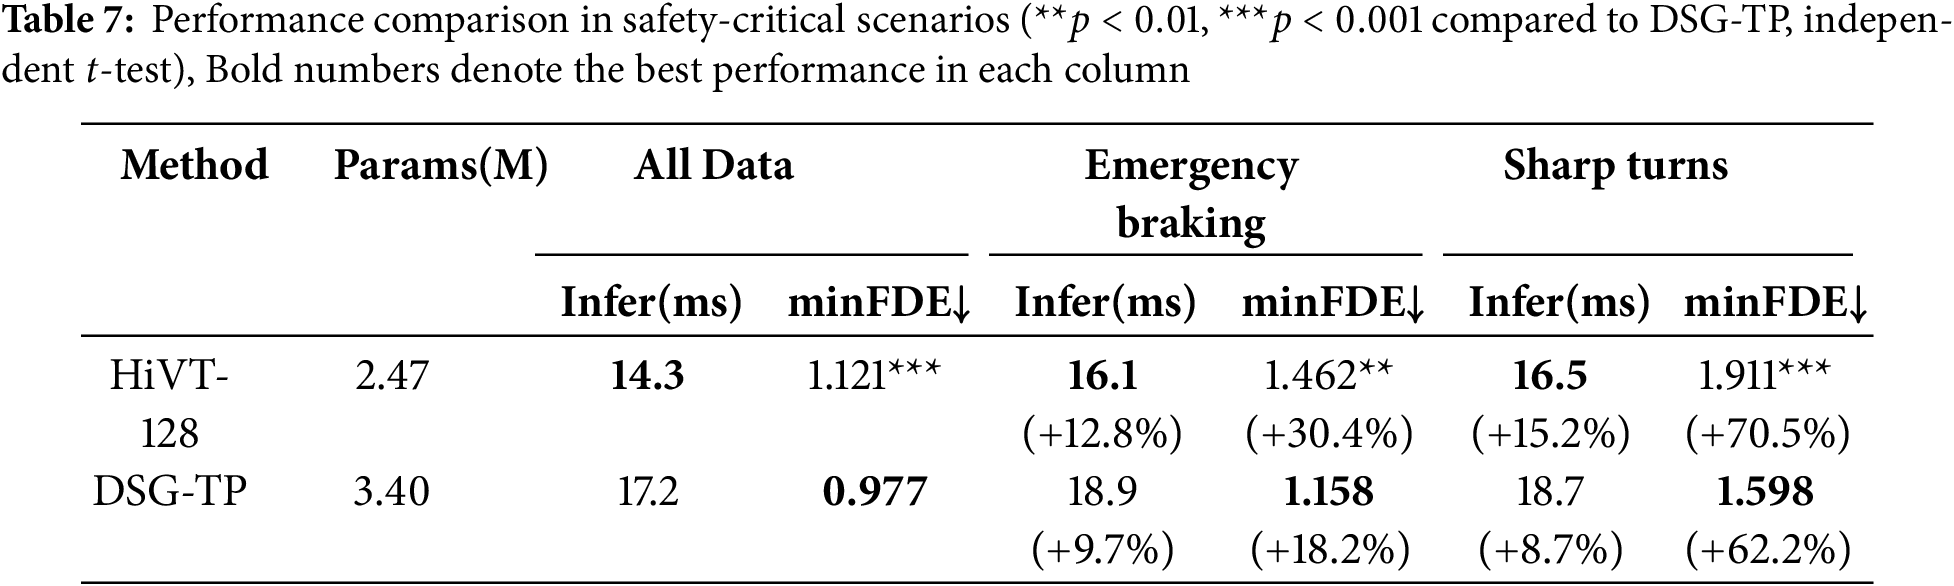
To rigorously assess model robustness in critical situations, we further curated a subset of safety-decision-related cases, comprising 1830 emergency braking and 2093 sharp turning instances, from the dataset and conducted dedicated real-time performance and accuracy tests in these scenarios. As illustrated in Table 7, DSG-TP demonstrates superior prediction accuracy across all scenarios while maintaining acceptable inference times for safety-critical applications. Statistical significance testing reveals that DSG-TP’s performance improvements over HiVT-128 are highly significant in all scenario categories (p < 0.001 for general scenarios, p < 0.01 for emergency braking, and p < 0.001 for sharp turning scenarios). This performance advantage is particularly pronounced in emergency braking and sharp turning scenarios, where accurate trajectory prediction is essential for timely safety interventions.
Our analysis of vehicle motion characteristics in the Argoverse 1 dataset reveals significant differences in driving styles among vehicles in similar scenarios. By integrating driving behavior recognition modules with prediction networks, DSG-TP demonstrates significant improvements over baseline methods.
We further investigate typical failure cases to better understand model limitations. As shown in Fig. 8, our analysis reveals that the model occasionally struggles with challenges related to:
• Multi-agent interactions within complex road topologies where intentions are ambiguous or contradictory.
• Challenges posed by sensor noise and resulting input data distortion.
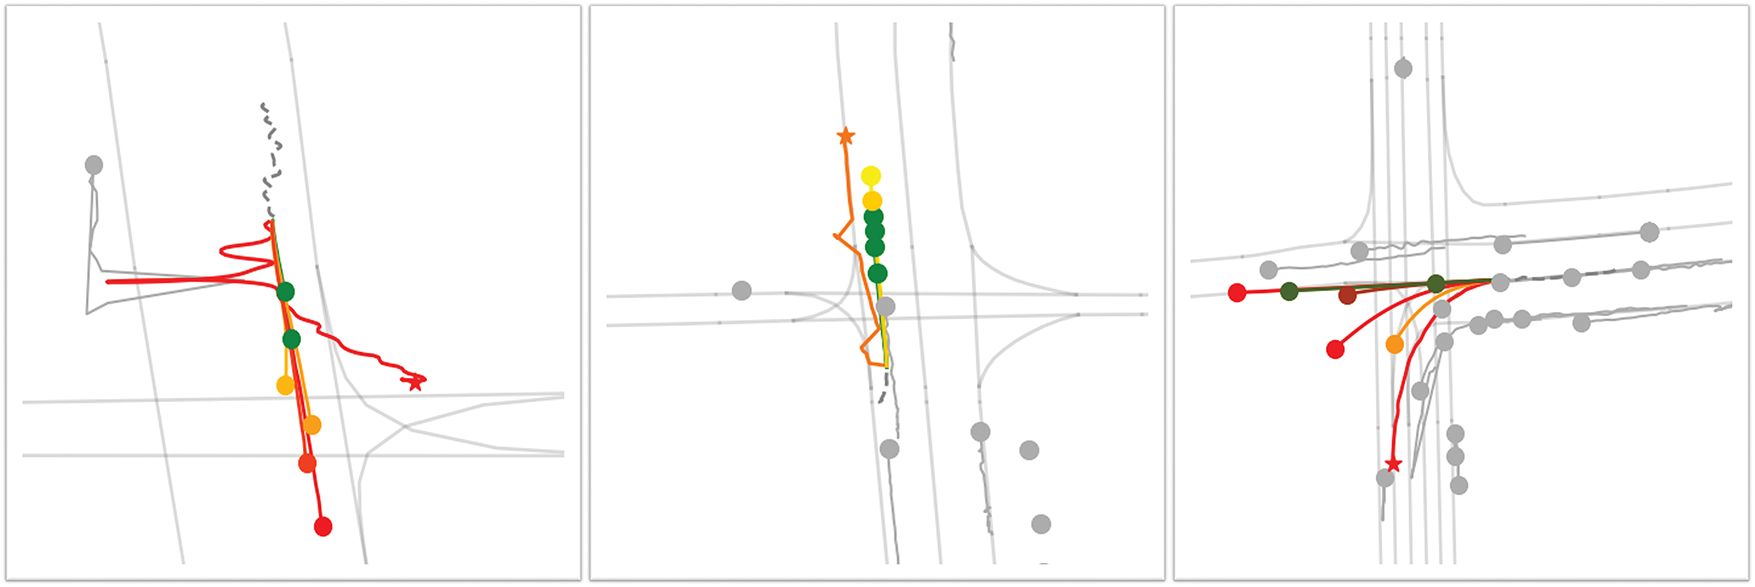
Figure 8: Visualization of several representative failure cases in trajectory prediction. Gray dots indicate surrounding interactive vehicles near the target agent
These visualization analyses suggest potential improvement directions. To address the challenges in these areas, future work will focus on:
• Enhancing spatio-temporal interaction modeling to explicitly consider future states and potential future interactions among multiple agents.
• Enhancing model robustness against input noise and distortion, potentially through refining data preprocessing pipelines, employing noise-aware training techniques.
Furthermore, addressing the generalization capability across different datasets remains an important challenge. Developing universal prediction capabilities that generalize across diverse driving cultures, road designs, and traffic regulations represents a critical direction for future research.
We propose DSG-TP, a novel trajectory prediction architecture that integrates driving style recognition with prediction networks. The results demonstrate that driving style recognition is crucial for accurately capturing vehicle intentions. Compared to our base model, DSG-TP shows significant improvements in trajectory prediction performance in complex, challenging scenarios. The factorized attention mechanism enables our model to maintain these performance advantages while remaining computationally efficient. This research advances trajectory prediction methods by explicitly modeling driving style characteristics, with important implications for autonomous driving safety.
Acknowledgement: The authors would like to acknowledge mentors. This work used the Argoverse dataset [17].
Funding Statement: This work was supported in part by the National Natural Science Foundation of China (NSFC) under Grant No. 52267003.
Author Contributions: The authors confirm contributions to this paper as follows: Lang Ding and Qinmu Wu are responsible for the conception and design of the study; The manuscript was written by Lang Ding; Jiaheng Li conducted experimental data processing and analysis; Tao Hong and Linqing Bian were responsible for manuscript formatting and proofreading. All authors reviewed the results and approved the final version of the manuscript.
Availability of Data and Materials: Data available on request from the authors. The Argoverse dataset used in this study is publicly available at https://www.argoverse.org (accessed on 08 June 2025), which is licensed under the Creative Commons Attribution-NonCommercial-ShareAlike 4.0 International Public License (CC BY-NC-SA 4.0). The Argoverse dataset is provided by © 2018-2019 Argo AI, LLC. We used the Argoverse dataset for research purposes by the terms of use.
Ethics Approval: Not applicable.
Conflicts of Interest: The authors declare no conflicts of interest to report regarding the present study.
References
1. Yurtsever E, Lambert J, Carballo A, Takeda K. A survey of autonomous driving: common practices and emerging technologies. IEEE Access. 2020;8:58443–69. doi:10.1109/ACCESS.2020.2983149. [Google Scholar] [CrossRef]
2. Bharilya V, Kumar N. Machine learning for autonomous vehicle’s trajectory prediction: a comprehensive survey, challenges, and future research directions. Veh Commun. 2024;46(3):100733. doi:10.1016/j.vehcom.2024.100733. [Google Scholar] [CrossRef]
3. Endsley MR. Situation awareness in driving. In: Handbook of human factors for automated, connected and intelligent vehicles. 1st ed. Boca Raton, FL, USA: CRC Press; 2020. [Google Scholar]
4. Nayakanti N, Al-Rfou R, Zhou A, Goel K, Refaat KS, Sapp B. Wayformer: motion forecasting via simple & efficient attention networks. In: 2023 IEEE International Conference on Robotics and Automation (ICRA); 2023 May 29–Jun 2; London, UK. Piscataway, NJ, USA: IEEE. p. 2980–7. doi:10.1109/ICRA48891.2023.10160609. [Google Scholar] [CrossRef]
5. Ngiam J, Caine B, Vasudevan V, Zhang Z, Chiang HTL, Ling J, et al. Scene transformer: a unified architecture for predicting multiple agent trajectories. arXiv:2106.08417. 2021. doi:10.48550/arxiv.2106.08417. [Google Scholar] [CrossRef]
6. Varadarajan B, Hefny A, Srivastava A, Refaat KS, Nayakanti N, Cornman A, et al. Multipath++: efficient information fusion and trajectory aggregation for behavior prediction. In: 2022 International Conference on Robotics and Automation (ICRA); 2022 May 23–27; Philadelphia, PA, USA. Piscataway, NJ, USA: IEEE. p. 7814–21. doi:10.1109/ICRA46639.2022.9812107. [Google Scholar] [CrossRef]
7. Leon F, Gavrilescu M. A review of tracking, prediction and decision making methods for autonomous driving. arXiv:1909.07707. 2019. doi:10.48550/arxiv.1909.07707. [Google Scholar] [CrossRef]
8. Atakishiyev S, Salameh M, Yao H, Goebel R. Explainable artificial intelligence for autonomous driving: a comprehensive overview and field guide for future research directions. IEEE Access. 2024;12(3):101603–25. doi:10.1109/ACCESS.2024.3431437. [Google Scholar] [CrossRef]
9. Wang Y, Jiang J, Li S, Li R, Xu S, Wang J, et al. Decision-making driven by driver intelligence and environment reasoning for high-level autonomous vehicles: a survey. IEEE Trans Intell Transp Syst. 2023;24(10):10362–81. doi:10.1109/TITS.2023.3275792. [Google Scholar] [CrossRef]
10. Vaswani A, Shazeer N, Parmar N, Uszkoreit J, Jones L, Gomez AN, et al. Attention is all you need. Adv Neural Inf Process Syst. 2017;30. [Google Scholar]
11. Kalyan KS, Rajasekharan A, Sangeetha S. AMMUS: a survey of transformer-based pretrained models in natural language processing. arXiv:2108.05542. 2021. doi:10.1016/j.jbi.2021.103982. [Google Scholar] [PubMed] [CrossRef]
12. Brown T, Mann B, Ryder N, Subbiah M, Kaplan JD, Dhariwal P, et al. Language models are few-shot learners. Adv Neural Inf Process Syst. 2020;33:1877–901. [Google Scholar]
13. Wiseman Y. Autonomous vehicles. In: Encyclopedia of information science and technology. 5th ed. Hershey, PA, USA: IGI Global; 2020 [Internet]. [cited 2025 Jun 8]. Available from: https://u.cs.biu.ac.il/∼wisemay/Autonomous-Vehicles-Encyclopedia.pdf. [Google Scholar]
14. Ho J, Kalchbrenner N, Weissenborn D, Salimans T. Axial attention in multidimensional transformers. arXiv:1912.12180. 2019. doi:10.48550/arXiv.1912.12180. [Google Scholar] [CrossRef]
15. Arnab A, Dehghani M, Heigold G, Sun C, Lučić M, Schmid C. ViViT: a video vision transformer. In: Proceedings of the IEEE/CVF International Conference on Computer Vision; 2021 Oct 11–17. Montreal, QC, Canada. Piscataway, NJ, USA: IEEE. p. 6836–46. doi:10.48550/arXiv.2103.15691. [Google Scholar] [CrossRef]
16. Liao H, Li Z, Shen H, Zeng W, Liao D, Li G, et al. Bat: behavior-aware human-like trajectory prediction for autonomous driving. In: Proceedings of the AAAI Conference on Artificial Intelligence; 2024 Feb 20–27; Vancouver, BC, Canada. Palo Alto, CA, USA: AAAI Press. p. 10332–40. doi:10.1609/aaai.v38i9.28900. [Google Scholar] [CrossRef]
17. Chang MF, Lambert J, Sangkloy P, Singh J, Bak S, Hartnett A, et al. Argoverse: 3D tracking and forecasting with rich maps. In: Proceedings of the IEEE/CVF Conference on Computer Vision and Pattern Recognition; 2019 Jun 15–20; Long Beach, CA, USA. Piscataway, NJ, USA: IEEE. p. 8748–57. [Google Scholar]
18. Huang Y, Du J, Yang Z, Zhou Z, Zhang L, Chen H. A survey on trajectory-prediction methods for autonomous driving. IEEE Trans Intell Veh. 2022;7(3):652–74. doi:10.1109/TIV.2022.3167103. [Google Scholar] [CrossRef]
19. Liu J, Mao X, Fang Y, Zhu D, Meng MQH. A survey on deep-learning approaches for vehicle trajectory prediction in autonomous driving. In: 2021 IEEE International Conference on Robotics and Biomimetics (ROBIO); 2021 Dec 27–31; Sanya, China. Piscataway, NJ, USA: IEEE. p. 978–85. doi:10.1109/ROBIO54168.2021.9739407. [Google Scholar] [CrossRef]
20. Yu Y, Si X, Hu C, Zhang J. A review of recurrent neural networks: LSTM cells and network architectures. Neural Comput. 2019;31(7):1235–70. doi:10.1162/neco_a_01199. [Google Scholar] [PubMed] [CrossRef]
21. Alahi A, Goel K, Ramanathan V, Robicquet A, Li F, Savarese S. Social LSTM: human trajectory prediction in crowded spaces. In: Proceedings of the IEEE Conference on Computer Vision and Pattern Recognition; 2016 Jun 27–30; Las Vegas, NV, USA. Piscataway, NJ, USA: IEEE. p. 961–71. [Google Scholar]
22. Gupta A, Johnson J, Li F, Savarese S, Alahi A. Social GAN: socially acceptable trajectories with generative adversarial networks. In: Proceedings of the IEEE Conference on Computer Vision and Pattern Recognition; 2018 Jun 18–23; Salt Lake City, UT, USA. Piscataway, NJ, USA: IEEE. p. 2255–64. [Google Scholar]
23. Zhao Z, Fang H, Jin Z, Qiu Q. GISNET: graph-based information sharing network for vehicle trajectory prediction. In: 2020 International Joint Conference on Neural Networks (IJCNN); 2020 Jul 19–24; Glasgow, UK. Piscataway, NJ, USA: IEEE. p. 1–7. [Google Scholar]
24. Xie G, Shangguan A, Fei R, Ji W, Ma W, Hei X. Motion trajectory prediction based on a CNN-LSTM sequential model. Sci China Inf Sci. 2020;63(11):1–21. doi:10.1007/s11432-019-2761-y. [Google Scholar] [CrossRef]
25. Quintanar A, Fernández-Llorca D, Parra I, Izquierdo R, Sotelo MA. Predicting vehicles trajectories in urban scenarios with transformer networks and augmented information. In: 2021 IEEE Intelligent Vehicles Symposium (IV); 2021 Jul 11–17; Nagoya, Japan. Piscataway, NJ, USA: IEEE. p. 1051–6. doi:10.1109/IV48863.2021.9575242. [Google Scholar] [CrossRef]
26. Liu Y, Zhang J, Fang L, Jiang Q, Zhou B. Multimodal motion prediction with stacked transformers. In: Proceedings of the IEEE/CVF Conference on Computer Vision and Pattern Recognition; 2021 Jun 19–25; Nashville, TN, USA. Piscataway, NJ, USA: IEEE. p. 7577–86. doi:10.48550/arXiv.2103.11624. [Google Scholar] [CrossRef]
27. Chu H, Zhuang H, Wang W, Na X, Guo L, Zhang J, et al. A review of driving style recognition methods from short-term and long-term perspectives. IEEE Trans Intell Veh. 2023;8(11):4599–612. doi:10.1109/TIV.2023.3279425. [Google Scholar] [CrossRef]
28. Martinez CM, Heucke M, Wang FY, Gao B, Cao D. Driving style recognition for intelligent vehicle control and advanced driver assistance: a survey. IEEE Trans Intell Transp Syst. 2017;19(3):666–76. doi:10.1109/TITS.2017.2706978. [Google Scholar] [CrossRef]
29. Murphey YL, Milton R, Kiliaris L. Driver’s style classification using jerk analysis. In: 2009 IEEE Workshop on Computational Intelligence in Vehicles and Vehicular Systems; 2009 Mar 30–Apr 2; Nashville, TN, USA. Piscataway, NJ, USA: IEEE. p. 23–8. doi:10.1109/civvs.2009.4938719. [Google Scholar] [CrossRef]
30. Lee T, Son J. Relationships between driving style and fuel consumption in highway driving.Technical Paper. Warrendale, PA, USA: SAE International; 2011. doi:10.4271/2011-28-0051. [Google Scholar] [CrossRef]
31. Corti A, Ongini C, Tanelli M, Savaresi SM. Quantitative driving style estimation for energy-oriented applications in road vehicles. In: IEEE International Conference on Systems, Man, and Cybernetics; 2013 Oct 13–16; Manchester, UK. Piscataway, NJ, USA: IEEE; 2013. p. 3710–5. doi:10.1109/SMC.2013.632. [Google Scholar] [CrossRef]
32. Miyajima C, Nishiwaki Y, Ozawa K, Wakita T, Itou K, Takeda K, et al. Driver modeling based on driving behavior and its evaluation in driver identification. Proc IEEE. 2007;95(2):427–37. doi:10.1109/JPROC.2006.888405. [Google Scholar] [CrossRef]
33. Constantinescu Z, Marinoiu C, Vladoiu M. Driving style analysis using data mining techniques. Int J Comput Commun Control. 2010;5(5):654–63. doi:10.15837/ijccc.2010.5.2231. [Google Scholar] [CrossRef]
34. Augustynowicz A. Preliminary classification of driving style with objective rank method. Int J Automot Technol. 2009;10(5):607–10. doi:10.1007/s12239-009-0071-8. [Google Scholar] [CrossRef]
35. Guardiola C, Pla B, Blanco-Rodríguez D, Reig A. Modelling driving behaviour and its impact on the energy management problem in hybrid electric vehicles. Int J Comput Math. 2014;91(1):147–56. doi:10.1080/00207160.2013.829567. [Google Scholar] [CrossRef]
36. Bolovinou A, Amditis A, Bellotti F, Tarkiainen M. Driving style recognition for co-operative driving: A survey. In: The Sixth International Conference on Adaptive and Self-Adaptive Systems and Applications; 2014 May 25–29; Venice, Italy. Wilmington, DE, USA: IARIA. p. 73–8. [Google Scholar]
37. Zhang Y, Xu Q, Wang J, Wu K, Zheng Z, Lu K. A learning-based discretionary lane-change decision-making model with driving style awareness. IEEE Trans Intell Transp Syst. 2022;24(1):68–78. doi:10.1109/TITS.2022.3217673. [Google Scholar] [CrossRef]
38. Wang X, Tang K, Dai X, Xu J, Xi J, Ai R, et al. Safety-balanced driving-style aware trajectory planning in intersection scenarios with uncertain environment. IEEE Trans Intell Vehicles. 2023;8(4):2888–98. doi:10.1109/TIV.2023.3239903. [Google Scholar] [CrossRef]
39. Huang R, Xue H, Pagnucco M, Salim F, Song Y. Multimodal trajectory prediction: a survey. arXiv:2302.10463. 2023. doi:10.1109/TNNLS.2025.3550350. [Google Scholar] [CrossRef]
40. Kosaraju V, Sadeghian A, Martín-Martín R, Reid I, Rezatofighi H, Savarese S. Social-BiGAT: multimodal trajectory forecasting using bicycle-GAN and graph attention networks. Adv Neural Inf Process Syst. 2019;32. [Google Scholar]
41. Chen G, Li J, Zhou N, Ren L, Lu J. Personalized trajectory prediction via distribution discrimination. arXiv:2107.14204. 2022. doi:10.48550/arXiv.2107.14204. [Google Scholar] [CrossRef]
42. Halawa M, Hellwich O, Bideau P. Action-based contrastive learning for trajectory prediction. arXiv:2207.08664. 2022. doi:10.1007/978-3-031-19842-7_9. [Google Scholar] [CrossRef]
43. Zhou Z, Ye L, Wang J, Wu K, Lu K. HiVT: hierarchical vector transformer for multi-agent motion prediction. In: Proceedings of the IEEE/CVF Conference on Computer Vision and Pattern Recognition; 2022 Jun 19–24; New Orleans, LA, USA. Piscataway, NJ, USA: IEEE. p. 8823–33. [Google Scholar]
44. Perez E, Strub F, de Vries H, Dumoulin V, Courville A. FiLM: visual reasoning with a general conditioning layer. In: Proceedings of the 32nd AAAI Conference on Artificial Intelligence; 2018 Feb 2–7; New Orleans, LA, USA. Palo Alto, CA, USA: AAAI Press. doi:10.1609/aaai.v32i1.11671. [Google Scholar] [CrossRef]
45. Pachêco Gomes I, Wolf DF. Driving style recognition using interval type-2 fuzzy inference system and multiple experts decision-making. Int J Fuzzy Syst. 2024;26(2):553–71. doi:10.1007/s40815-023-01616-9. [Google Scholar] [CrossRef]
46. Chen G, Gao Z, Hua M, Shuai B, Gao Z. Lane change trajectory prediction considering driving style uncertainty for autonomous vehicles. Mech Syst Signal Process. 2024;206(1):110854. doi:10.1016/j.ymssp.2023.110854. [Google Scholar] [CrossRef]
47. Xing Y, Lv C, Cao D. Personalized vehicle trajectory prediction based on joint time-series modeling for connected vehicles. IEEE Trans Vehicular Technol. 2019;69(2):1341–52. doi:10.1109/TVT.2019.2960110. [Google Scholar] [CrossRef]
48. Aydemir G, Akan AK, Güney F. Adapt: efficient multi-agent trajectory prediction with adaptation. In: Proceedings of the IEEE/CVF International Conference on Computer Vision; 2023 Oct 2–6; Paris, France. Piscataway, NJ, USA: IEEE. p. 8295–305. [Google Scholar]
49. Van der Maaten L, Hinton G. Visualizing data using t-SNE. J Mach Learn Res. 2008;9(11):2579–605. [Google Scholar]
50. Liang M, Yang B, Hu R, Chen Y, Liao R, Feng S, et al. Learning lane graph representations for motion forecasting. In: Computer Vision-ECCV 2020: 16th European Conference; 2020 Aug 23–28; Glasgow, UK. Cham, Switzerland: Springer. p. 541–56. doi:10.1007/978-3-030-58536-5_32. [Google Scholar] [CrossRef]
51. Gu J, Sun C, Zhao H. Densetnt: end-to-end trajectory prediction from dense goal sets. In: Proceedings of the IEEE/CVF International Conference on Computer Vision; 2021 Oct 11–17; Montreal, QC, Canada. Piscataway, NJ, USA: IEEE. p. 15303–12. [Google Scholar]
52. Wang M, Zhu X, Yu C, Li W, Ma Y, Jin R, et al. GANet: goal area network for motion forecasting. In: 2023 IEEE International Conference on Robotics and Automation (ICRA); 2023 May 29–Jun 2; London, UK. Piscataway, NJ, USA: IEEE. p. 1609–15. doi:10.1109/ICRA48891.2023.10160468. [Google Scholar] [CrossRef]
53. Kang M, Wang S, Zhou S, Ye K, Jiang J, Zheng N. FFINet: future feedback interaction network for motion forecasting. IEEE Trans Intell Transp Syst. 2024;25(9):12285–96. doi:10.1109/TITS.2024.3381631. [Google Scholar] [CrossRef]
Cite This Article
 Copyright © 2025 The Author(s). Published by Tech Science Press.
This work is licensed under a Creative Commons Attribution 4.0 International License , which permits unrestricted use, distribution, and reproduction in any medium, provided the original work is properly cited.
 Downloads
 Citation Tools