
 Submit a Paper
 Propose a Special lssue
 Open Access
ARTICLE
Robust False Data Injection Identification Framework for Power Systems Using Explainable Deep Learning
Department of Information Systems, College of Computer and Information Sciences, Princess Nourah bint Abdulrahman University, Riyadh, 11671, Saudi Arabia
* Corresponding Author: Sapiah Sakri. Email:
Computers, Materials & Continua 2025, 85(2), 3599-3619. https://doi.org/10.32604/cmc.2025.065643
Received 18 March 2025; Accepted 01 August 2025; Issue published 23 September 2025
 View Full Text
 Download PDF
Abstract
Although digital changes in power systems have added more ways to monitor and control them, these changes have also led to new cyber-attack risks, mainly from False Data Injection (FDI) attacks. If this happens, the sensors and operations are compromised, which can lead to big problems, disruptions, failures and blackouts. In response to this challenge, this paper presents a reliable and innovative detection framework that leverages Bidirectional Long Short-Term Memory (Bi-LSTM) networks and employs explanatory methods from Artificial Intelligence (AI). Not only does the suggested architecture detect potential fraud with high accuracy, but it also makes its decisions transparent, enabling operators to take appropriate action. The method developed here utilizes model-free, interpretable tools to identify essential input elements, thereby making predictions more understandable and usable. Enhancing detection performance is made possible by correcting class imbalance using Synthetic Minority Over-sampling Technique (SMOTE)-based data balancing. Benchmark power system data confirms that the model functions correctly through detailed experiments. Experimental results showed that Bi-LSTM + Explainable AI (XAI) achieved an average accuracy of 94%, surpassing XGBoost (89%) and Bagging (84%), while ensuring explainability and a high level of robustness across various operating scenarios. By conducting an ablation study, we find that bidirectional recursive modeling and ReLU activation help improve generalization and model predictability. Additionally, examining model decisions through LIME enables us to identify which features are crucial for making smart grid operational decisions in real time. The research offers a practical and flexible approach for detecting FDI attacks, improving the security of cyber-physical systems, and facilitating the deployment of AI in energy infrastructure.Keywords
Digital technologies have slowly integrated into contemporary power systems to enhance the energy sector and improve grid operations and resource utilization [1,2]. Nonetheless, it has also created substantial risks, especially for FDI attacks. These attacks deceive control processes using system metrics and data to elicit operational disruptions, losses, and even blackouts [3]. Although the complexity of power systems increases as power demand rises, the detection mechanisms must also become more advanced, accurate, and resilient to these complex threats [4]. Organizations can use machine learning to identify FDI attacks and take appropriate measures by monitoring system data for unusual behavior [5]. However, implementing robust detection methods is challenging because the attacks are adaptive and less detectable [6]. To address the above issues, new machine learning algorithms are being deployed to solve the issues and enhance the performance of detector systems [7]. These approaches emphasize the dynamics and parameters of FDI attacks to enhance the availability, reliability, and security of power systems as globally interconnected vulnerabilities persistently continue to rise [8]. Fig. 1 shows how smart power systems experience misleading data injection.
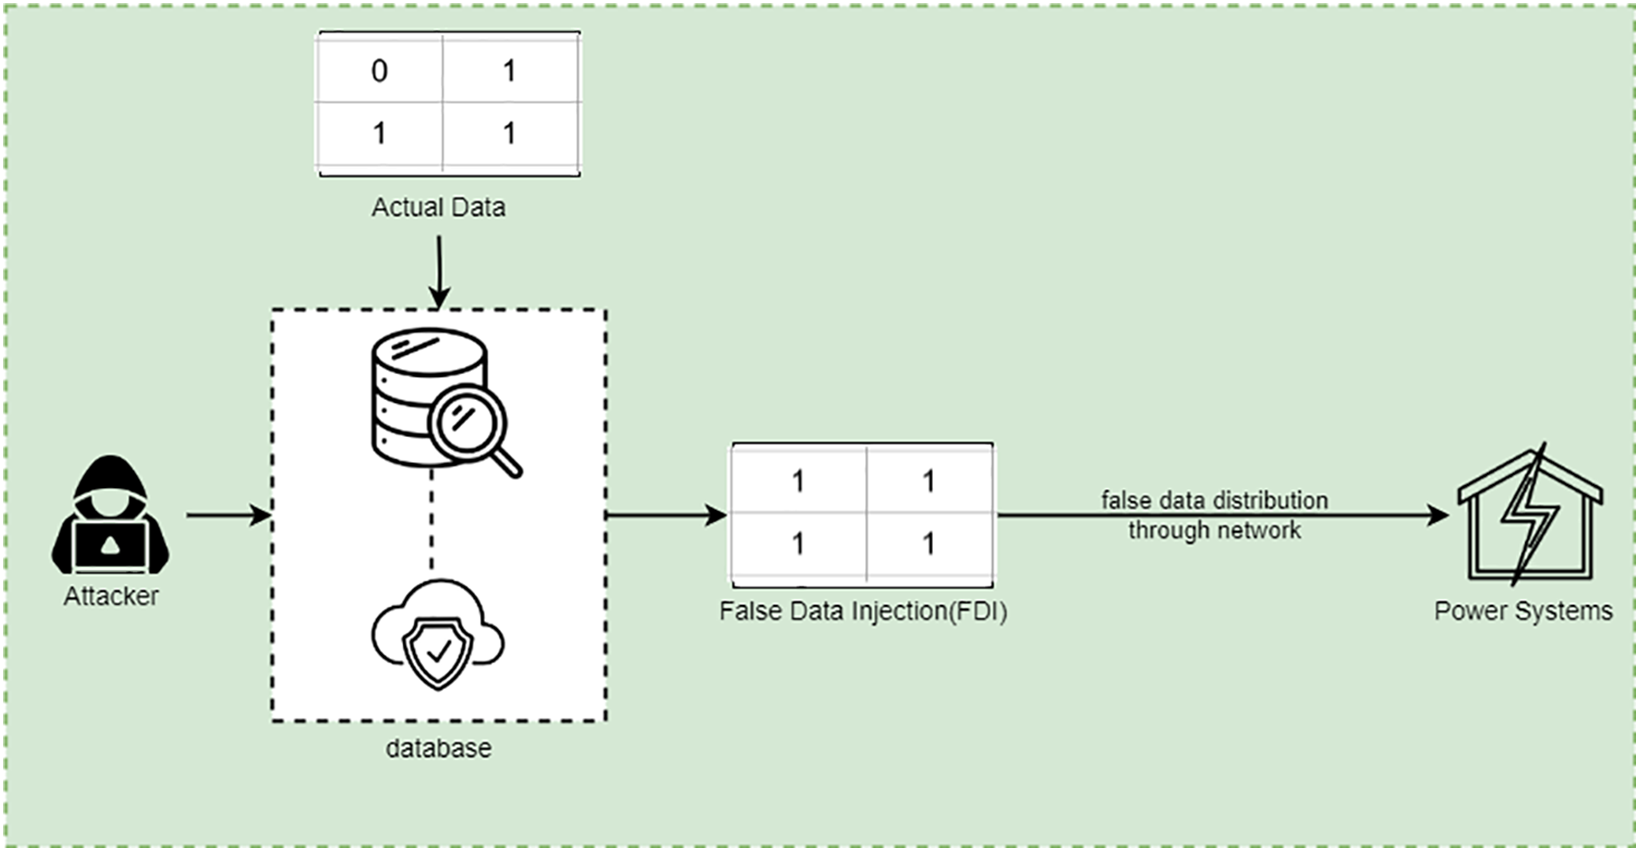
Figure 1: False data injection attacks in power systems
Despite the potential for machine learning in identifying these types of attacks, many models are ‘black boxes,’ high-performance though non-interpretable [9]. Unfortunately, this lack of explainability somewhat undermines confidence in using CAVs and other automated decision-making systems, limiting their practical usage in essential fields such as power systems. Explainable Artificial Intelligence (XAI) fulfills this gap by not only improving the FDI attack detection accuracy but also coming up with precise explanations of its reasoning [10]. This transparency enables the grid operator to understand, trust, and act upon the outputs of the detection systems [11]. The expanding connectivity and complexity of smart grids have made the algorithm more reliable for validation and have strengthened numerous explainable machine learning-based methods. These methods commonly lack explainability in crucial domains requiring trust and interpretability. This research addresses the gap through its proposed explainable deep learning structure, which integrates temporal sequence modeling with interpretability elements to create trustworthy automation for critical infrastructure security [12]. Research in the field reveals weak connections between accurate temporal modeling and transparent interpretive decision systems, which often lead to operational difficulties. A hybrid Bi-LSTM+XAI framework is the primary contribution of this paper, delivering optimized FDI attack detection models that yield strong predictive results while maintaining high explainability. The solution combines detection reliability with model-interpretable features, meeting the operational requirements of grid operators and system engineering teams.
• The research establishes a modern and effective deep learning method that combines Bi-LSTM networks with XAI techniques to enhance the detection of false data while ensuring operational trust in power systems and real-time resilience.
• The proposed method addresses two key challenges by integrating SMOTE-based resampling with XAI methodologies, which enhance minority class representation and facilitate the clear and transparent detection of subtle FDI attacks.
• Model generalization and robustness were ensured by running 5-fold cross-validation, which proved the stable performance of the Bi-LSTM across different data partitions. This addressed previous validation issues that only applied to single-shot tests.
• A systematic assessment of individual model structures occurred through an ablation study. The detection performance improved significantly through the combination of bidirectional processing and ReLU activation. However, batch normalization showed only a minimal effect on the results, as it validated the chosen framework design.
• The Bi-LSTM model delivered 93% average accuracy in FDI attack detection outcomes above XGBoost and Bagging standards, which showed its excellence in detecting temporal patterns in power system data.
The rest of this paper is organised as follows: Section 2 discusses related work on FDI attack detection. Section 3 describes the proposed methodology, including data preprocessing, model architecture, and XAI integration. Section 4 presents experimental results and comparative analysis. Section 5 concludes the paper and outlines future work directions.
Authors in [13] proposed a secure federated deep learning technique to detect FDI attacks. By training local models using data from various substations, the suggested method leverages the advantages of federated learning. No sensitive information is shared, though, and the data remains decentralized. This approach is more secure than traditional training approaches that rely on everyone accessing personal information. The findings demonstrated the high accuracy of detecting various FDI attacks with the suggested method, which protects data privacy and uses adversarial learning. Authors in [14] introduced a method to identify FDI attacks in smart grids by teaming Transformer models, federated learning and the Paillier cryptosystem. The Transformer is used at edge nodes to study how different electrical signals are connected using self-attention. Nodes can train a model using federated learning, keeping their raw information private. The Paillier cryptosystem helps prevent unauthorized data access by securing updates to the model during training. This framework enhances detection, maintains data privacy, and ensures secure communication. Comprehensive testing on the IEEE 14-bus and 118-bus test cases shows that the proposed strategy is both effective and better than other approaches.
Authors in [15] presented an IDS system that merges CNN with LSTM networks to create a hybrid framework that enhances IoT security protections from complex cyber threats. Network traffic data analysis benefits from a proposed approach that combines spatial feature extraction using CNN with temporal dependency detection from LSTM networks to classify IoT traffic into benign and malicious categories effectively. This model received training from the CICIoT2023 dataset while undergoing evaluation and achieved its performance peak for binary IoT traffic classification on both the CICIoT2023 and CICIDS2017 datasets. The analysis reveals that the model achieves 98.42% accuracy, with 0.0275 loss value, 98.57% F1-score and 9.17% false positive rate, demonstrating its outstanding capability to detect security threats. The research demonstrates that the CNN-LSTM architecture successfully addresses the security problems of IoT networks by offering promising prospects for developing intelligent IDS solutions. Authors in [16] presented a technique for state prediction and FDI attack detection in smart grids based on analyzing the big data generated in smart grids. This paper, therefore, introduces a WLS state estimator and an AIEKF to estimate and improve the accuracy of the proposed model. The progressive WLS estimator enables real-time state estimation, while the AIEKF provides future state estimations. These positive results corroborate that this approach is suitable for detecting multiple FDI attacks with high accuracy and a low false-positive ratio.
This research [17] suggested using ensemble-based machine learning to detect hidden FDI attacks in smart grids based on data analysis. A key point is combining both supervised and unsupervised ensemble models to blend the results from different classifiers, thereby improving detection accuracy. In addition to ordinary classifier outputs, this method categorizes them further to improve their reliability. The results are obtained by simulating the method on the IEEE 14-bus system. Findings demonstrate that supervised ensembles work as well as individual models, but unsupervised ensembles do significantly better. This means that the method is good at finding hidden and quiet attackers. A unique semi-supervised deep learning approach is proposed in [18] to identify fake data injection attacks on smart grids. The conceptualized idea is to use autoencoders to reduce dimensionality and extract measurement features effectively. Them. A secure and resilient-enhanced system (SeCDM) is the name given to the suggested methodology. SeCDM enables the secure computation of state estimate residuals using a hierarchical knowledge-sharing algorithm with a decentralized homomorphic computing paradigm.
Authors in [19] proposed an adaptive and machine learning-based security framework for smart grid data transmissions. Unlike traditional static models, the proposed method dynamically monitors network flow, adjusts data, controls transmission, and optimizes throughput to address real-time threats. It utilizes graph neural networks and adaptive optimization techniques to identify anomalies and mitigate vulnerabilities. Simulation studies on four scenarios—network flow, data expansion, attack periods, and throughput—demonstrate improved efficiency, early convergence, and reduced time complexity. Overall, the framework enhances smart grid reliability, adaptivity, and data integrity in the face of evolving cyber threats. This paper [20] proposes a novel framework combining synthetic biometric data generation with explainable artificial intelligence (XAI) to enhance data security and transparency in biometric systems. It introduces interpretable models for processing biometric images (e.g., fingerprints, facial features) and uses synthetic data to reduce privacy risks. Unlike conceptual-only XAI treatments, this work features robust explainability tools, including visualizations, interpretability metrics, and decision modeling.
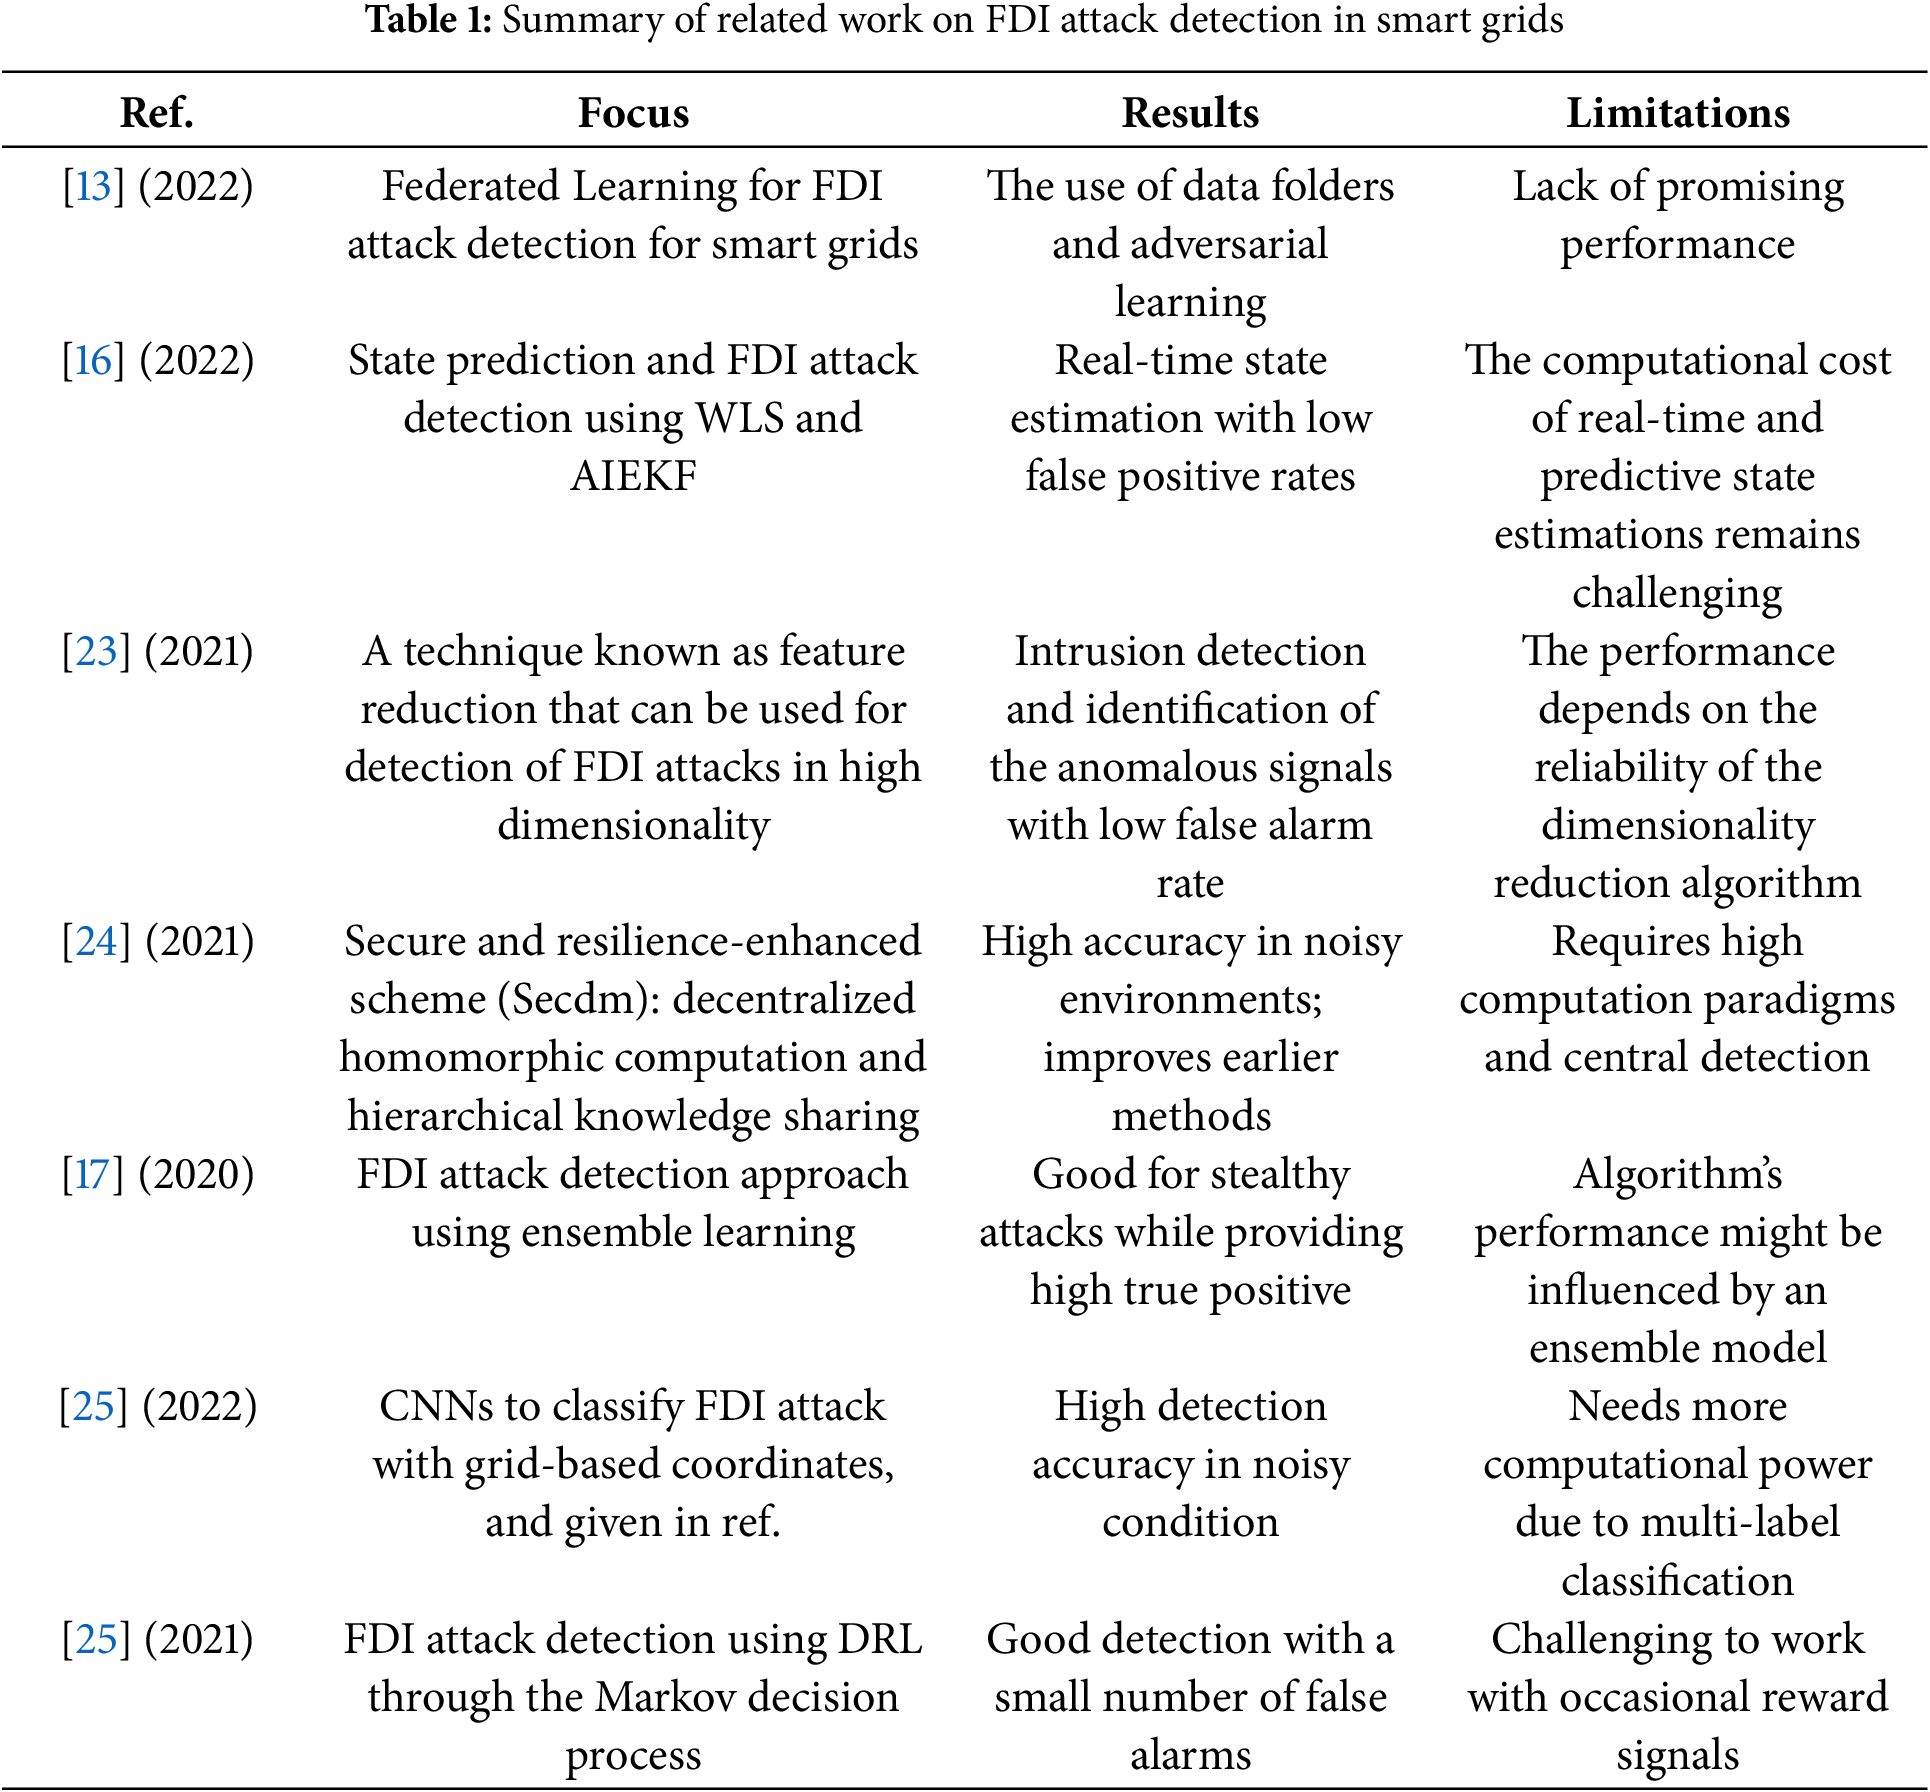
In [21], an in-depth exploration of the security environment of cyber-physical systems (CPSs) is presented through the study of threats and defenses in three main aspects, namely the physical, cyber, and cyber-physical domains. They identify and discuss the diverse forms of attacks, ranging from simple sensor tampering to smart, coordinated threats and the types of detection and mitigation methods applied in any given field. The paper has identified the existing gaps, summarized the state-of-the-art countermeasures, and outlined future research directions, providing valuable guidance on the direction to take in research on CPS security. In [22], the authors provided an in-depth look at the problem of cybersecurity issues and countermeasures in the context of unmanned aerial vehicles (UAVs), covering an important and urgent research topic. The authors categorize UAV security risks into three fields: physical, cyber, and cyber-physical, and discuss various forms of attacks, including jamming, GPS spoofing, and false message injection, along with their respective detection and defense strategies. An overview of earlier research on FDI in power systems is displayed in Table 1.
While recent literature has demonstrated the effectiveness of Transformer-based models in sequence modeling tasks, their application often requires large-scale datasets and high computational resources, which are not always practical for deployment in resource-constrained or real-time environments such as power grid systems. In contrast, Bidirectional LSTM (Bi-LSTM) networks offer a more computationally efficient yet powerful mechanism for learning temporal dependencies by processing input sequences in both forward and backward directions. This dual-context awareness enables Bi-LSTM to effectively capture patterns in sequential power system data, where the direction of time plays a crucial role in understanding operational anomalies. Furthermore, prior studies have shown that Bi-LSTM models outperform traditional RNNs and unidirectional LSTMs in various anomaly detection tasks while being more feasible than Transformer architectures for mid-scale datasets, such as the one used in this study. Given the balance between performance, interpretability, and deployment feasibility, Bi-LSTM was selected as the core architecture for this work.
A new and efficient method for identifying FDI mode in power systems, utilizing XAI methods to enhance the algorithm’s reliability, has been developed. This method incorporates deep learning models, integrated with interpretability, to detect and explain complex patterns in power system data, thereby providing a clear view of how decisions are made. Incorporating the XAI element into the approach ensures that operators and stakeholders can validate the detection outcome and, consequently, develop immunity against anomalous FDI attacks, thereby enhancing the security of the power grid. Fig. 2 illustrates the suggested method for reliable identification of erroneous data injection in power systems, and Algorithm 1 used in the applied classifier is described below.
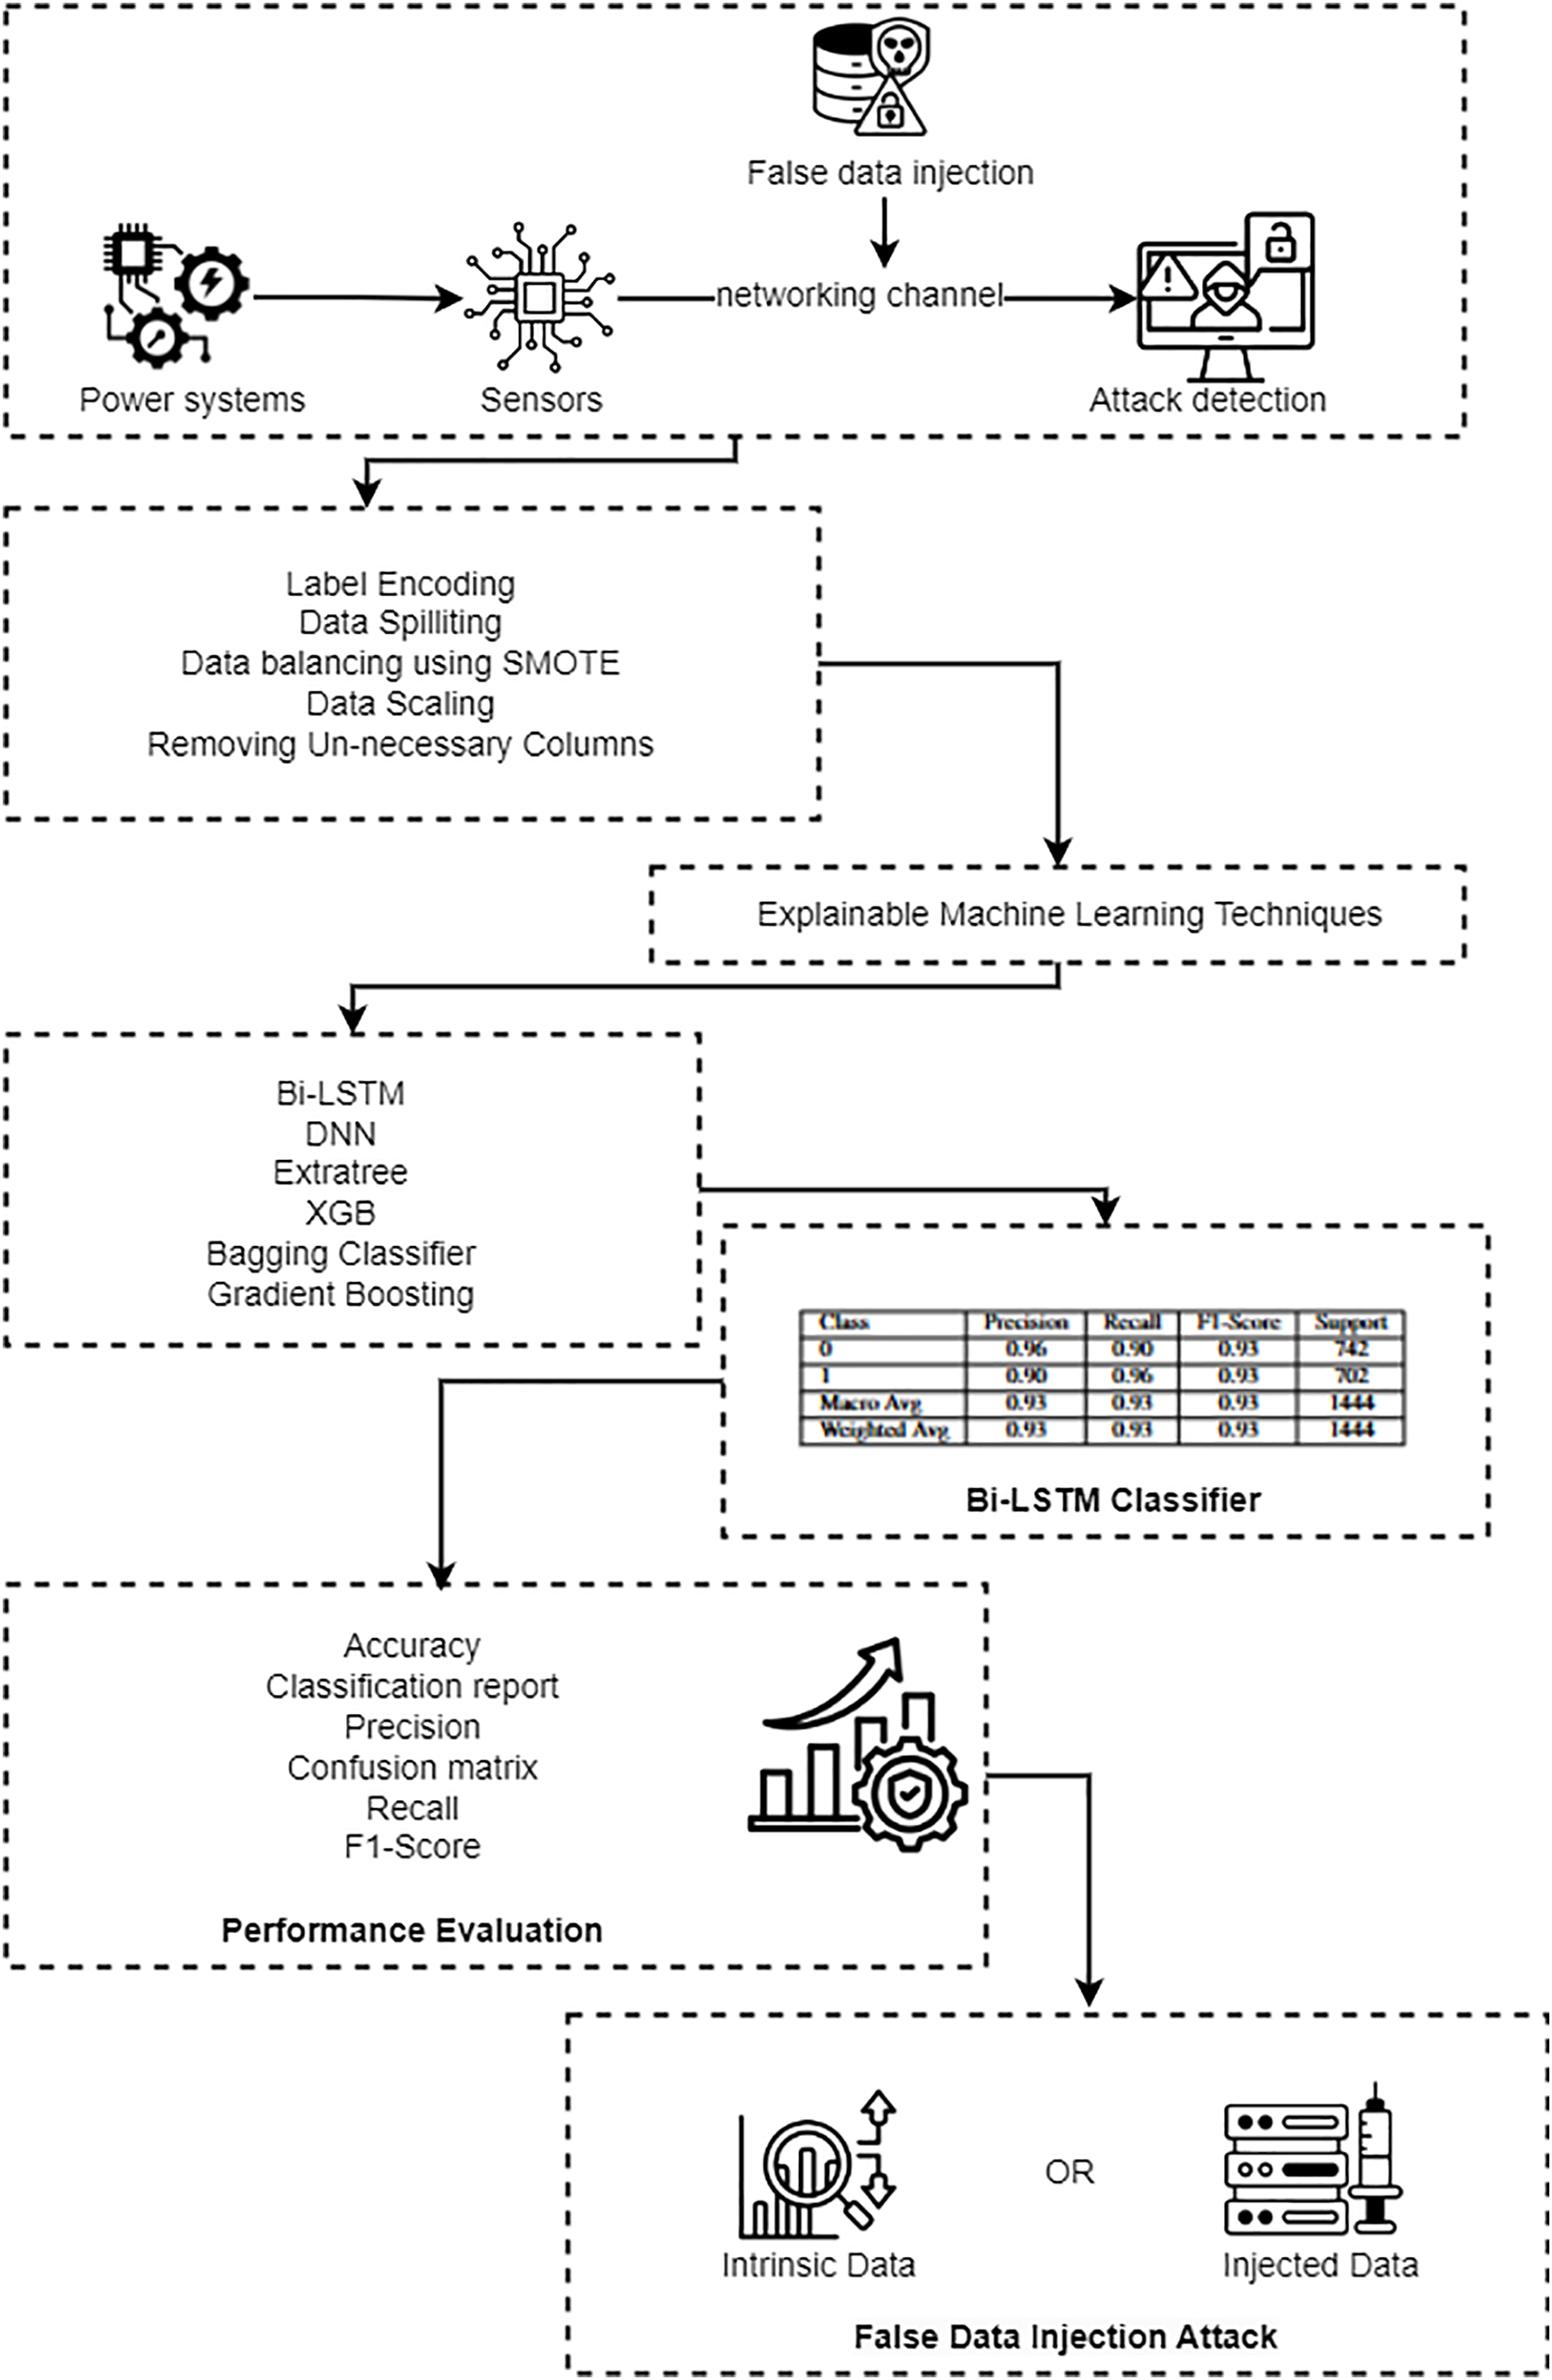
Figure 2: Robust detection of FDI attacks in power systems
3.1 Dataset Selection and Preprocessing
The initial dataset included 15 sets, totaling 37 classified global power system event scenarios. The dataset used in this study was obtained from Mississippi State University and consisted of nine scenarios for each set (https://www.kaggle.com/datasets/bachirbarika/power-system (accessed on 31 July 2025)). The information is supplied in ARFF, a file type used by the Weka application, which is then converted to CSV. A power system framework with elements such as generators G1 and G2, Intelligent Electronic Devices (IEDs) R1 through R4, breakers BR1 through BR4, and two transmission lines has been used to create these scenarios. Operators at the control desk can also turn off the breakers for operational maintenance. The dataset was first divided into two binary classification groups using a 1% random sample technique for testing purposes. The dataset was preprocessed to enhance performance and reduce bias. Previous categorical variables were encoded numerically to create compatibility with machine learning algorithms. Feature scaling was performed to normalize all feature values to a standard scale, facilitating the model’s training and enhancing its convergence rate. All the acquired data were separated into training and testing sets to evaluate the developed model. The SMOTE method was utilized to mitigate class imbalance in training sets and generate synthetic samples for minority classes, thereby addressing the issue of class imbalance. Feature values were normalized through data scaling to improve model training and convergence. To evaluate the model’s performance, the dataset was divided into subsets for testing and training purposes.
3.2 Data Balancing Using SMOTE
The Synthetic Minority Oversampling Technique is a process adopted to balance datasets; this technique is crucial because a class imbalance in datasets affects the performance of machine learning models. SMOTE does not merely create copies of samples for the minority class; it creates synthetic samples for the given set. It does this by mapping the existing minority class pattern relative to existing sample points and generating new and plausible points. This approach helps avoid overfitting when data is duplicated due to shuffling while maintaining a reasonable probability of sampling all classes in the training dataset.
3.3 Machine Learning Classifiers
Machine learning classifiers are learning approaches that use characteristics added as input data to classify the dataset into predefined classes or labels. These models work by identifying trends and correlations between variables in training data and forecasting new, previously unseen data. Neural networks, support vector machines, and decision trees are popular examples of machine learning algorithms. Due to their ability to make predictions quickly and accurately, these classifiers have found common uses in various fields, including image categorization, spam message detection, and disease diagnosis.
Extremely Randomized Trees, also known as the Extra Tree Classifier, is a machine-learning method that selects features and split points at random. By preventing over-learning and enhancing diversity, this unpredictability makes the classifier reasonably dependable while learning from form data. It performs well on massive datasets and high-dimensional datasets. The decision trees used differ from the typical ones that divide the data according to a particular feature derived from it; randomness in splitting is used to prevent overfitting.
3.3.2 Extreme Gradient Boosting Classifier
An advanced implementation of gradient-boosted decision trees, the XGBoost Classifier combines weak learners iteratively, minimizing errors at each stage to improve overall model accuracy. XGBoost is renowned for its speed and efficiency, utilizing regularization and parallel processing techniques to avoid overfitting. Its high performance and ability to handle missing data make it a popular choice for competitive machine-learning challenges and structured datasets. The equation for XGB is given by Eq. (1) where T is the number of trees.
T: Total number of decision trees used in the ensemble. Tree(x): Output of the t-th decision tree for input x.
The Bootstrap Aggregating Classifier, also known as the Bagging Classifier, is an ensemble method designed to increase stability and reduce model variation. Sampling with replacement generates several subsets of the training data, which are then used to train distinct base models. A more robust model is produced by combining the forecasts by majority vote or averaging. The decision tree method, which exhibits high variance and a tendency to learn from noise, benefits significantly from bagging in terms of accuracy and noise resilience. The equation for the bagging classifier is shown in Eq. (2), with N being the number of models.
N: Number of base learners (e.g., decision trees).
3.3.4 Gradient Boosting Classifier
An ensemble learning algorithm called the Gradient Boosting classifier builds models one after the other to fix the errors of earlier models. It employs weak learners, typically decision trees, and then refines the model with an optimized loss function to increase its accuracy. It is a powerful accumulator that can capture intricate patterns, as each tree in the series focuses on the error margin left over from the previous sequence. However, in several situations where Precision is highly valued, Gradient boosting has been widely recognized for its capacity to provide correct responses with good predictive performance. Eq. (3) provides the Gradient boosting equation where the learning rate is
Deep learning is a type of machine learning that utilizes artificial neural networks (ANNs) with multiple processing layers to identify complex patterns in datasets. They are constructed similarly to the human brain, with multiple layers of neurons that can resolve issues related to image recognition or natural language processing. Deep learning works effectively with large, disorganized datasets because its techniques allow for directly extracting hierarchical characteristics from unprocessed data. These days, there is a “where” and a “when” of artificial intelligence.
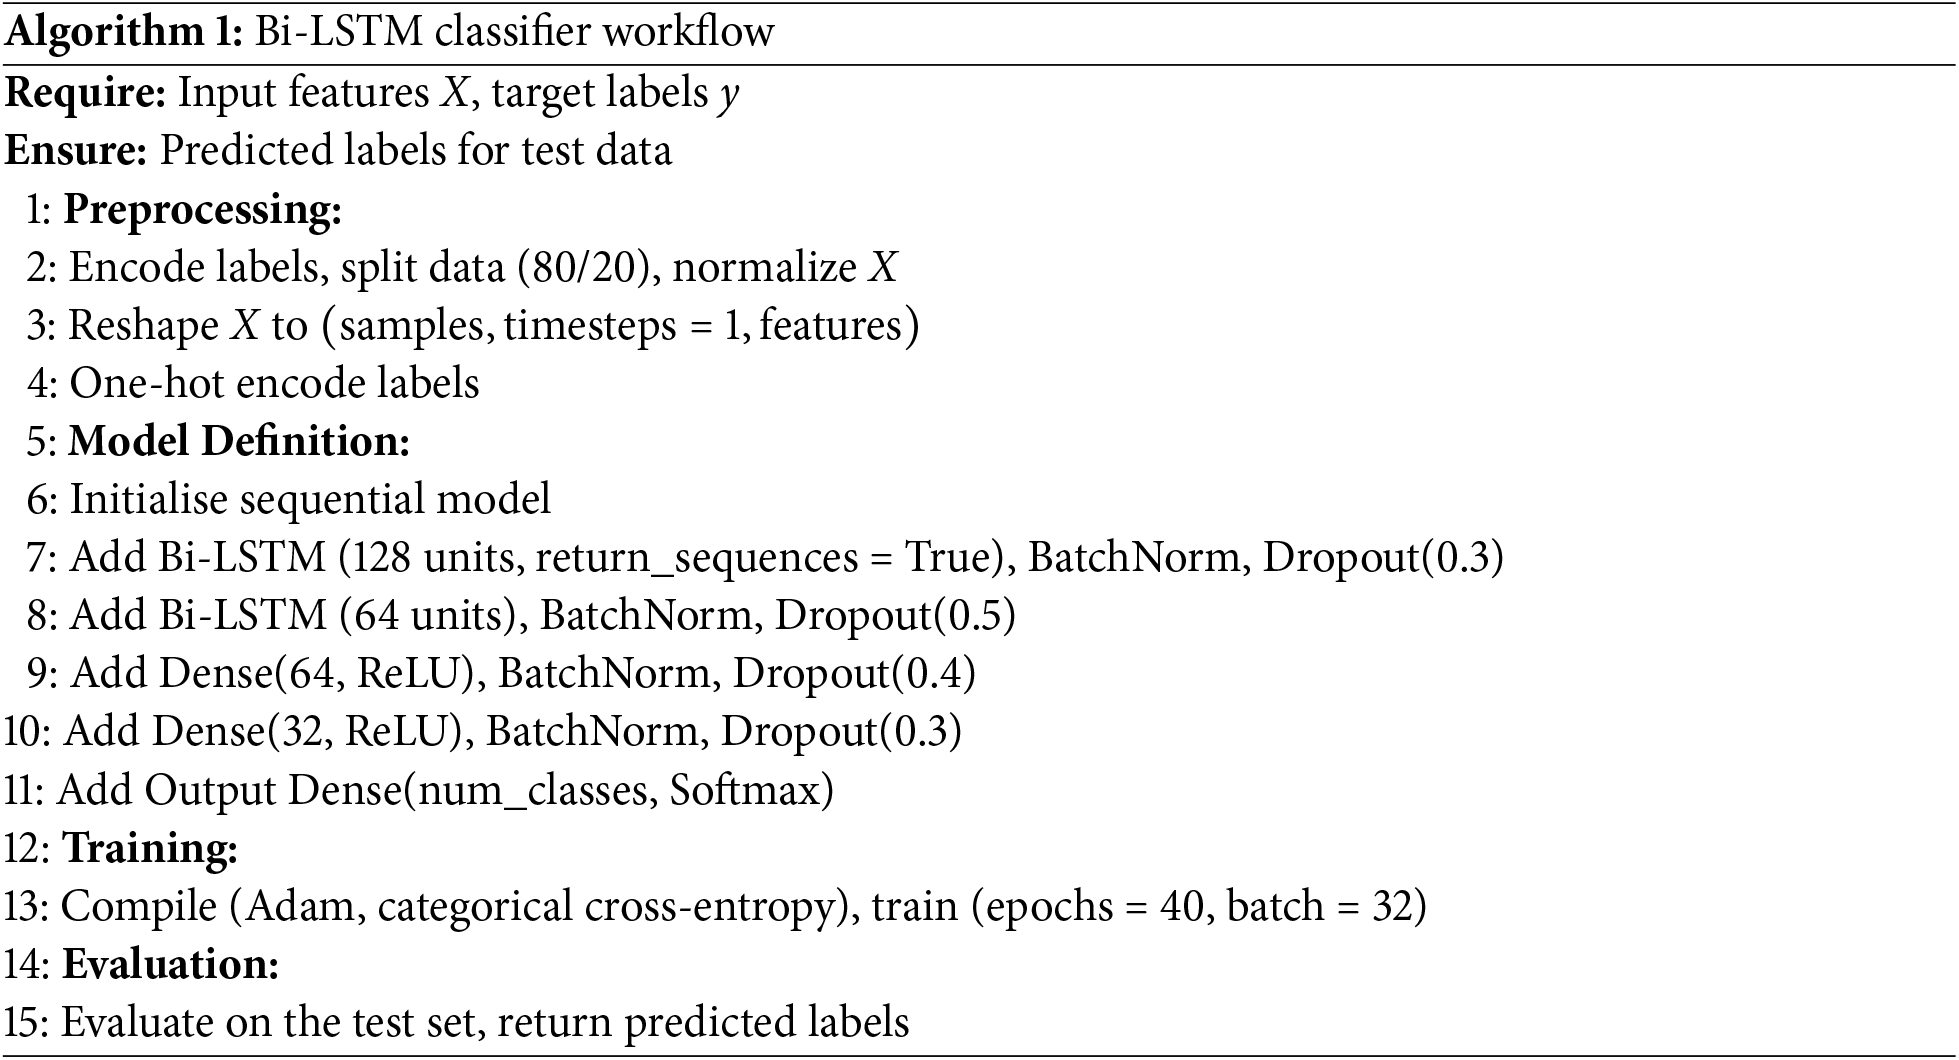
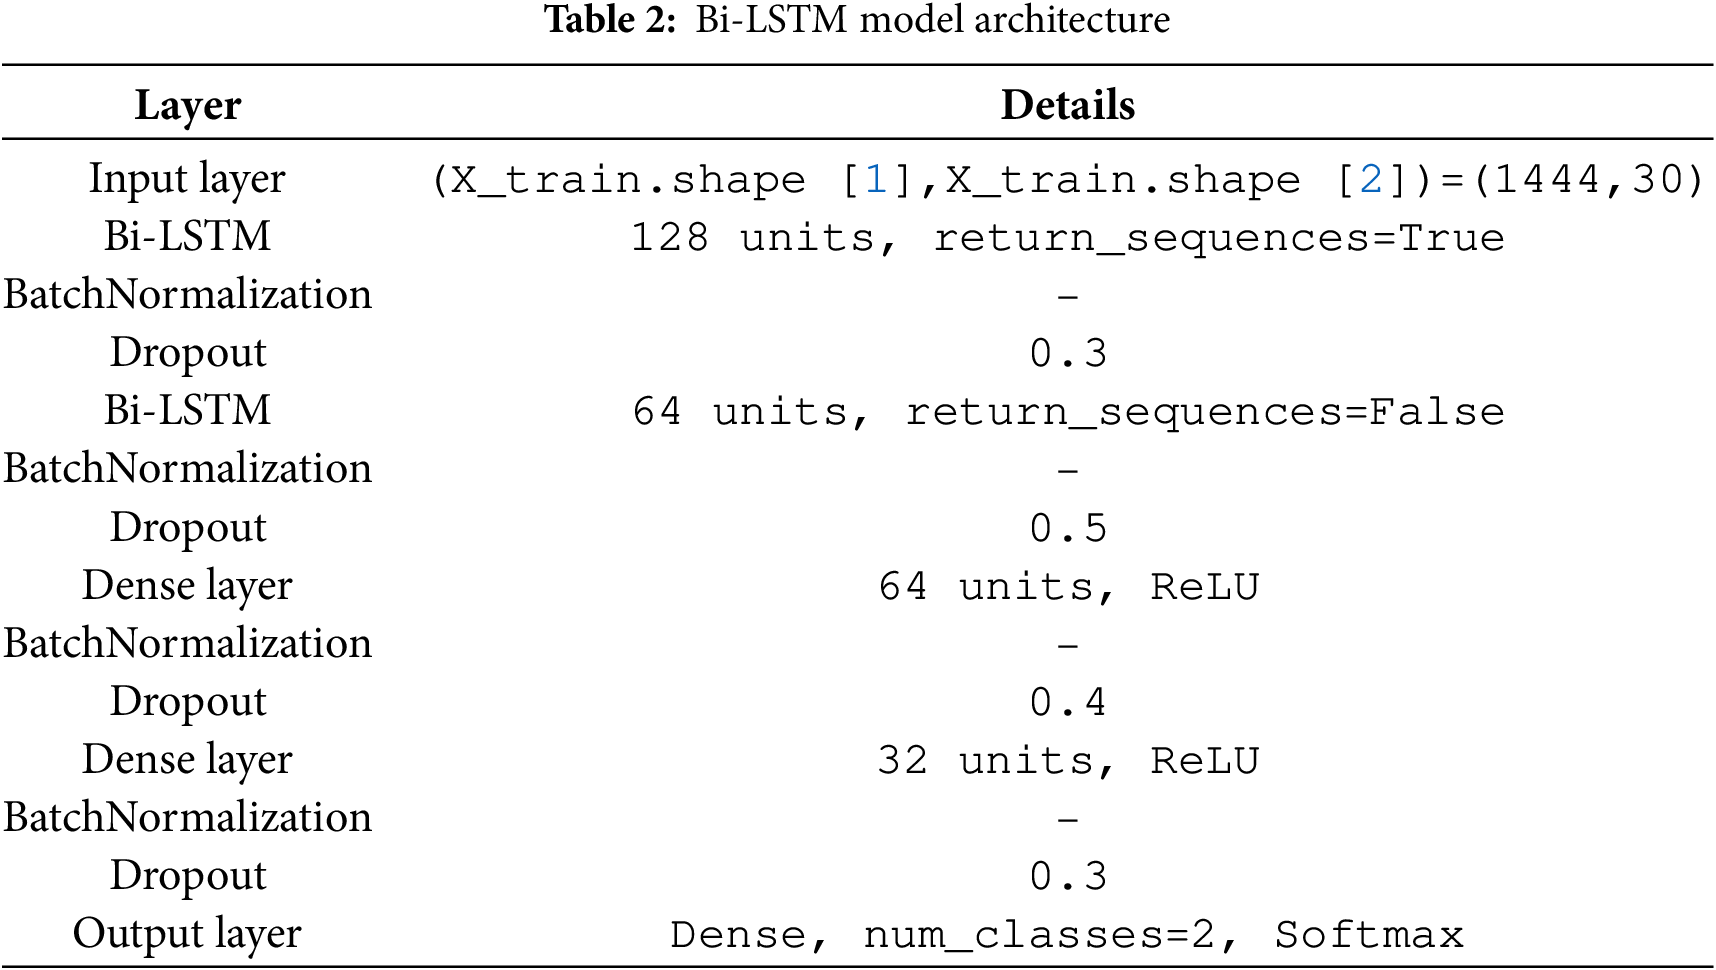
The model can simultaneously learn from past and future situations due to the architecture’s first bidirectional LSTM layer, which contains 128 units. To avoid overfitting, this layer generates sequences and is followed by Batch Normalisation and a Dropout layer with a rate of 0.3. Although the input does not return sequences in this layer, the second layer, which is designed as a BiLSTM, likewise has 64 units. The following steps are Batch Normalisation and a Dropout layer with a dropout rate of 0.5, as seen in Table 2. The essential features are extracted using regularization techniques (Dropout with corresponding dropout rates of 0.4 and 0.3) and scale standardization (Batch Normalization) in two densely connected layers with 64 and 32 neurons, respectively, and activation functions. The final dense layer returns the score for classifying the input into the specified number of classes using the softmax activation function. The equation for Bi-LSTM is given in Eq. (4).
Here,
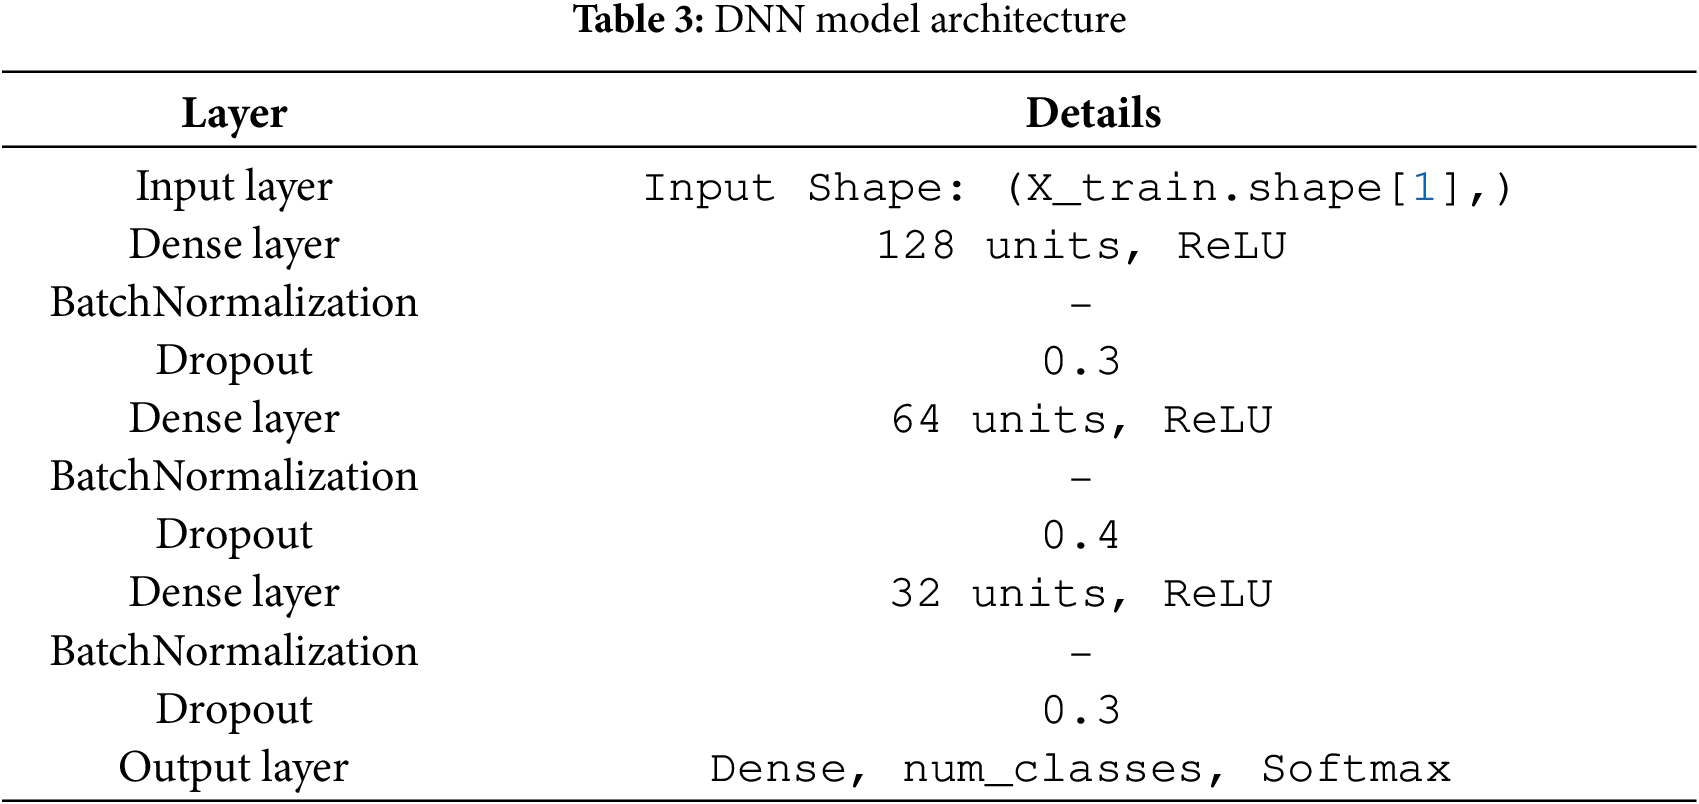
A dense layer, comprising 128 neurons with a ReLU activation function, constitutes the input layer, the initial layer of the model presented. Then comes the convex analysis, batch normalization, and, to prevent overfitting, a dropout layer with a dropout rate of 0.3. Table 3 displays the 64 neurons that comprise the next hidden layer, which has batch normalization, the ReLU activation function applied, and a dropout rate of 0.4. ReLU activation, batch normalization, and a dropout rate of 0.3 neurons result in 32 neurons in the third dense layer. Lastly, there are
Here, x: Input feature vector.
The domain of Explainable AI within machine learning involves developing algorithms that are understandable and reveal their internal decision-making processes to human readers. The user needs transparency from these systems to receive information about each prediction mechanism, since this helps users verify model accuracy and maintain impartiality alongside model stability. The system bridges the performance gap between models and digital understanding through automation, enabling stakeholders to follow ethical and administrative standards when making decisions.
4 Experimental Analysis and Results
The experimental analysis and results section focuses on comparing and analyzing the performance of the applied classifiers within the context of explainable machine learning for FDI attack detection in power systems. The experiments, therefore, involve comparisons and correlations that evaluate specific performance indicators and patterns of models to determine their detection aptitude and the impact of specific inputs on the models’ decision-making. Furthermore, this section describes methods for assessing the effectiveness and explainability of classifiers in the context of protecting power systems. We use accuracy, precision, recall and F1-score as the primary evaluation measures. Accuracy calculates the total percentage of actual outcomes that were correctly predicted among all the predictions of the model
Table 4 below shows the classification performance of different classifiers when the robust detection of FDI attacks in power systems has been evaluated. Out of all these classifiers, Bi-LSTM got the highest accuracy of 93%, which establishes its capability of capturing the temporal dependencies and patterns in the data, which will help when performing sequential anomaly detection in real life. Bagging was closely behind with a 91% accuracy, demonstrating its strength in Ensemble learning, where many weak learners are used to improve the overall learner. Finally, the XGB classifier provided a classification accuracy of 88% to the model; this approach established the competent capability of dealing with the relationships within the dataset via gradient-boosted decision trees. The performance of the DNN was observed at approximately 85%, presuming that a deeper DNN can detect more complex patterns in detail with the eight layers used, indicating that the DNN was slightly lagging behind the ensemble-based methods. Extra tree and GB classifiers achieved a relatively low accuracy of 77%; thus, our results indicate that both classifiers can identify certain anomalies but may be limited by the sheer complexity of the FDI attack patterns in power systems. From these results, it is even more apparent that models such as Bi-LSTM and Bagging should be used to detect abnormalities for more accurate results in areas of energy interest.
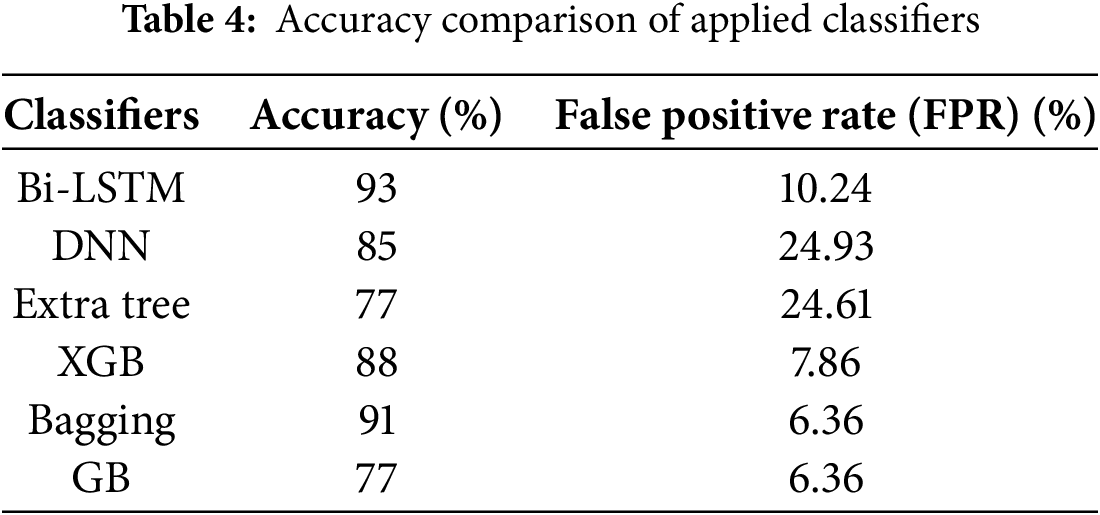
The evaluated models demonstrate a significant relationship between their accuracy performance and false-positive-rate levels, which can be observed in Table 4. The Bi-LSTM model demonstrated its highest accuracy level of 93% while dealing with minimal false alarms at an FPR of 10.24%. Real-time monitoring environments may suffer from decreased reliability because the FPR rates of 24.93% and 24.61% were discovered in the DNN and Extra-Tree models, although their accuracy levels remained moderate. Bagging and Gradient-Boosting (GB) achieved a balanced performance through their low FPR of 6.36% while Bagging also reached 91% accuracy. The robust performance from XGBoost resulted in minimal false detections with 7.86 percent FPR and satisfying accuracy rates of 88%. The results demonstrate that Bi-LSTM and ensemble methods outperform other models in FDI reduction, as they achieve higher stability and generalization capabilities, which are essential for reliable power system operation.
Out of all the machine learning classifiers applied in the current work, Bagging stands out particularly well in the confusion matrix, indicating relatively low false positive and false negative values compared to the other models. This ensemble-based system reduces misclassification between attack and non-attack cases, providing a balanced classification. XGB also shows efficient performance due to the use of a Gradient boosting mechanism to increase error rates, as shown in Fig. 3. However, conclusions based on the above, such as those from Extra Tree and GB, still exhibit a higher proportion of false negatives, indicating a tendency to overlook low attentiveness in identifying attacks, which may result in missing essential events in the Power System.
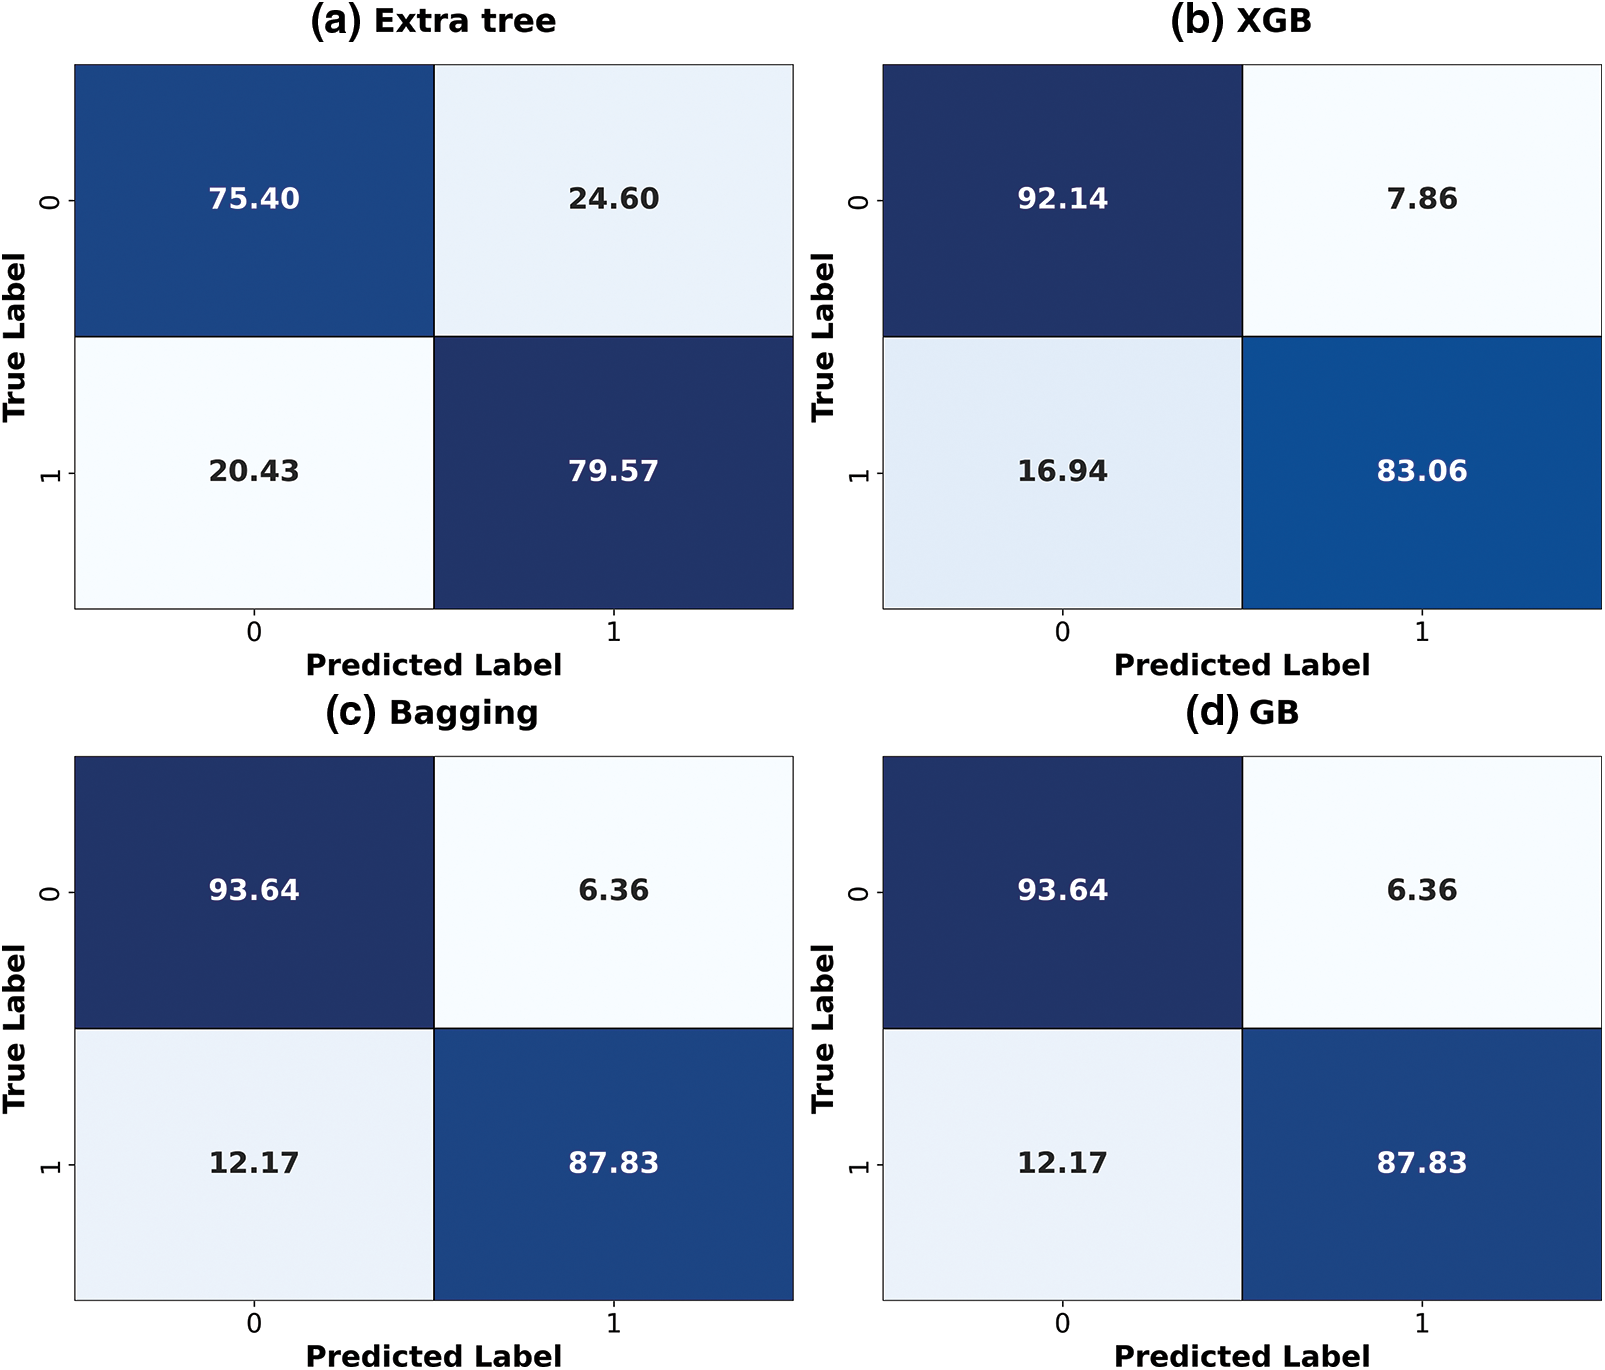
Figure 3: ML classifier’s confusion matrices
Thus, the curves of Bagging and XGB classifiers for classifying student laptops are relatively high and close to the upper left angle when the ROC curves of different classifiers are compared. This represents, therefore, high sensitivity (true positive rate) when the FPR is still low, as shown in Fig. 4. Extra tree and GB had the lowest seven-day ROC curves, indicating that the techniques are ineffective in differentiating between attack and no-attack scenarios. Both Bagging and XGB are better suited for robust detection of FDI attacks because it has been suggested that Bagging’s AUC is higher than XGB’s.

Figure 4: ML classifier’s ROC curves
Based on the suggested method for capturing temporal dependence information, it is demonstrated that the Bi-LSTM model has minimal false negative values for the confusion matrix of deep learning classifiers. Because of this, it is beneficial in identifying even more complex attack patterns. As previously demonstrated, the DNN is just as effective but somewhat more likely to generate false positives, which likely indicates that occasionally benign occurrences are mistakenly labeled as attacks, as seen in Fig. 5. This could result from relying too heavily on static features, which may not capture sequential information or utilize Bi-LSTM.
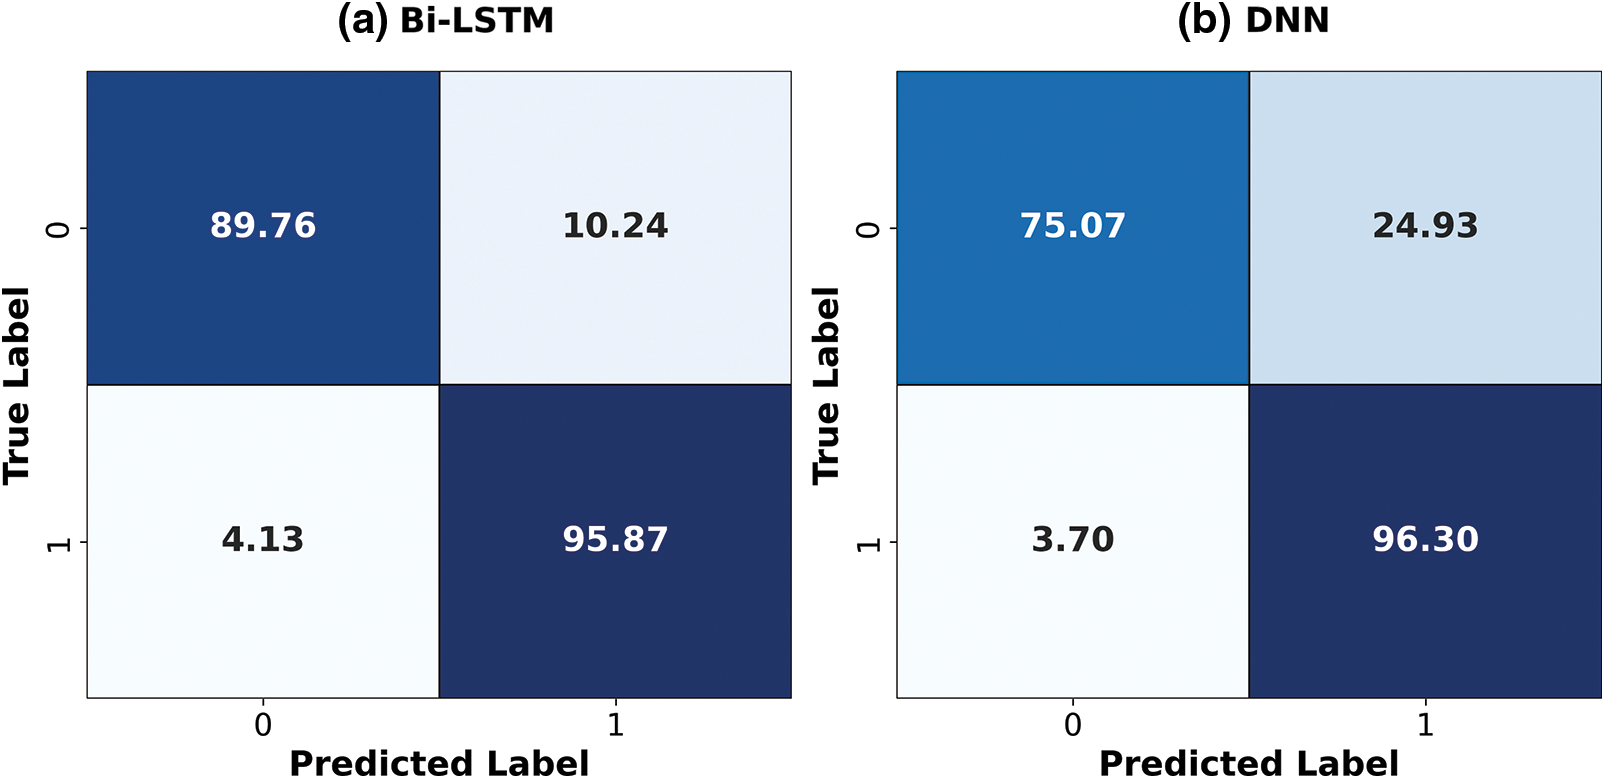
Figure 5: DL architecture’s confusion matrices
The Bi-LSTM model’s ROC curve plot is superior to the DNN model’s, with the graph positioned closer to the optimal location in the upper left corner. This is because Bi-LSTM has a low false positive rate, which is essential for efficient attack identification and improved sensitivity to variations in traffic flow. Despite having a respectable ROC curve, the DNN may not be as good as the Bi-LSTM due to the inherent challenges of modeling temporal structures, as seen in Fig. 6. The significance of Bi-LSTM as the top deep learning model for identifying FDI threats in power systems is supported by the fact that its AUC should be higher.
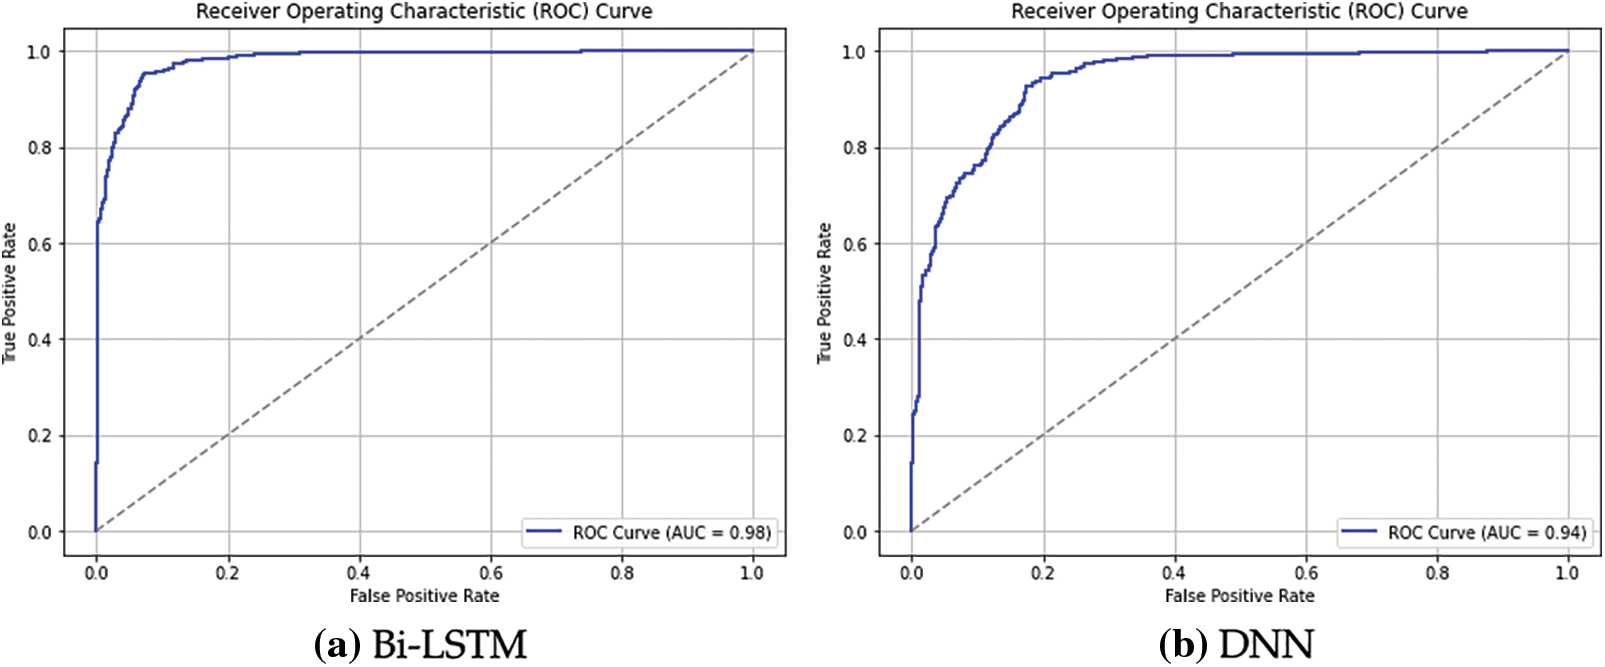
Figure 6: DL architecture’s ROC curves
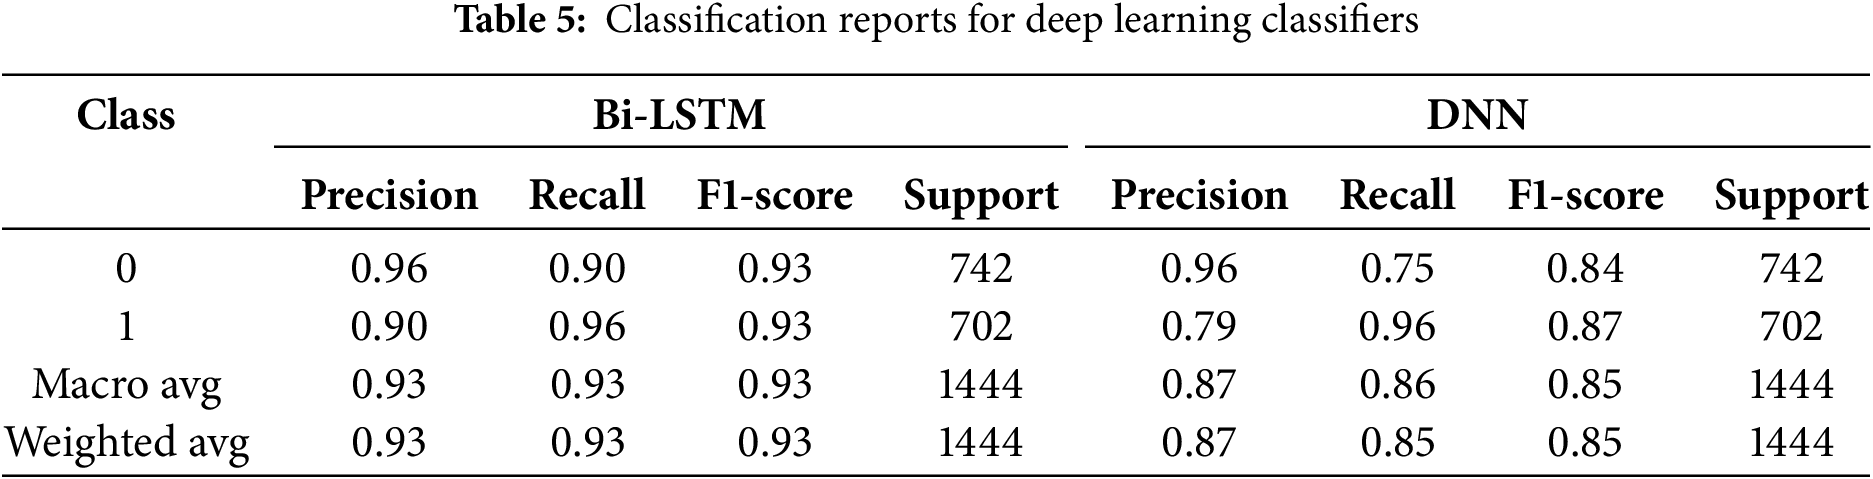
The classification report also demonstrates the accuracy of the models in identifying FDI on power systems. According to Table 5, Class 0, which includes non-attack cases, has a precision of 0.96, indicating that this method produces accurate results when differentiating between routine operations. However, Class 1 (attack instances) has a slightly lower precision of 0.90 due to a relatively higher number of false positives, indicating that the system sometimes struggles to differentiate between regular and attack traffic. This disparity suggests that although the model’s general performance is quite accurate, refinement can enhance attack detection accuracy while preserving the ability to classify regular system activity. The precision measurement for accurately identifying FDI attacks in the power system is presented in the produced classification report. The model’s substantial potential for correctly detecting typical behaviors with low false positives is demonstrated by its 0.96 precision for class 0 (non-attack cases). However, Class 1 (attack instances) has a much lower Precision, with 0.79, showing that the model is more likely to misclassify the normal data as attack data. This disparity suggests that, although the model’s presence provides a reasonable match to normal behavior, the approach may require further refinement to enhance the true positive detection of FDI attacks and minimize false positives.
As indicated in Table 6, the classification report for robust detection of FDI attacks in power systems shows that Class 0 (non-attack instances) is precise at 0.79, indicating a reasonable power of the classifier in real non-attack instances at a notably low rate of False Positives. Likewise, Class 1 (attack instances) yields a slightly lower precision of 0.76 due to the set’s bias of incorrectly labeling normal data as attack data. Given the precision values near both classes, the equal model performance of both classes has been highlighted, where further enhancement of Precision can benefit precise detection with the least false reports in the associated attack instances class. The results show an effective solution to the proposal regarding FDI attack classification reports for power systems. The Precision for Class 0 (non-attack instances) is 0.84, as shown in Table 6, which positively reflects its accuracy compared to the given normal data while having fewer incorrect positive results. Similarly, in the case of attack instances, the model’s Precision is even better at 0.91, which means that while improving the rate of detected attack instances, it does not send many normal data instances to the attacked zone. The relatively high Precision achieved by the cross-section of both classes demonstrates the proposed model’s effectiveness and solidity in protecting against over- or under-identifying FDI situations.
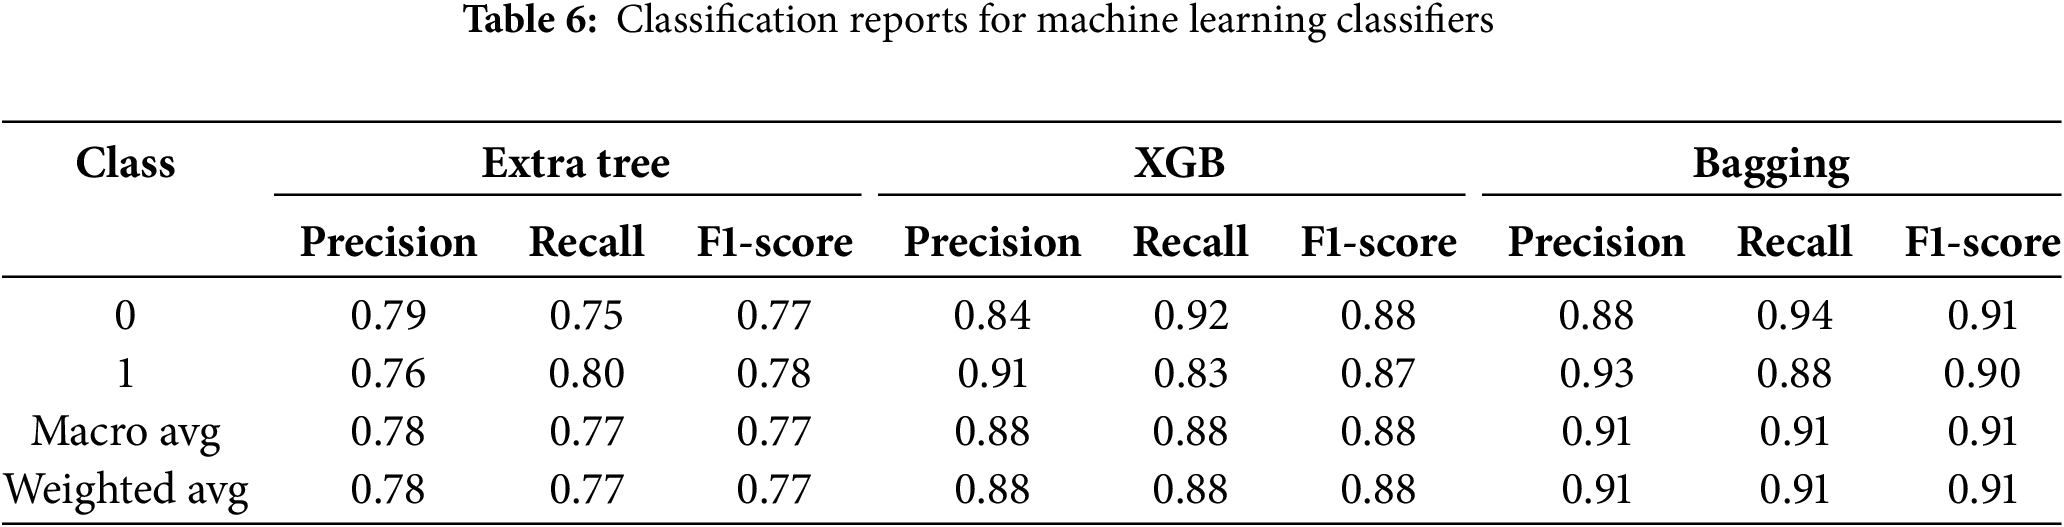
The classification report reveals a highly optimized framework for FDI detection in the power systems category. Using P, class 0 (non-attack instances) gives a measure of 0.88, as shown in Table 6, clearly indicating that the class can identify normal data without compromising the number of possible false positives. This is significantly less in Class 1 (attack instances), with 0.93 demonstrating how much better the model performs in detecting attacks while having a low tendency to misclassify non-attacks as attacks. These high-precision measures across both classes demonstrate the model’s strong reliability and reasonable false-positive and false-negative rates in critical situations involving FDI attacks. The classification report demonstrates how to design another highly efficient model to enhance the secure identification of FDI attacks in power systems. The Precision of Class 0 (non-attack instances) is 0.88, indicating a good capability of recognizing instances with a high percentage as non-attack instances and a low percentage of misclassification. Class 1 (attack instances) achieves a better result with a mean of 0.93, as shown in Table 6 being higher than or equal to the mean of non-attack instances under attack-free conditions, thus proving the advantage of the employed model in identifying attacks while being able to minimize misidentification of non-attacks as attacks. The uniqueness and reliability indices of the model are characterized by very high precision values in both classes, indicating excellent performance in identifying significant FDI cases.
Fig. 7 shows the LIME-based feature importance visualizations for six classifiers. This figure contains visualizations for Bi-LSTM, DNN, Extra Tree, XGBoost, Bagging, and Gradient Boosting. The visualizations show which features affected classification results for particular instances in the dataset. The LIME process identifies the key features that support prediction by highlighting them in blue and contradicts prediction results using orange coloring for each prediction model. Two prominent features that affected attack and non-attack differentiation include Feature_115, Feature_121 and Feature_102 in the Bi-LSTM and DNN model evaluations (a) and (b). Several key features demonstrated strong effectiveness for abnormality detection in XGBoost (d), Extra Tree (c), and GB (f) among tree-based model systems due to their persistent positive influence (e.g., Feature_123 and Feature_89). The feature importance output of Bagging (e) showed distribution across various features due to its ensemble structure of multiple weak learners. The LIME explanations perform dual functions by (1) ensuring that classifiers extract significant, understandable patterns and (2) providing the grid operators with viewer-friendly detection parameter understandability. The ability to interpret predictions is crucial when deploying Artificial Intelligence systems in critical infrastructure platforms, as operators require trustworthy insights for informed implementation decisions. The analysis of each model included assessing computational costs and latency as essential factors in determining real-time power system deployment capabilities.

Figure 7: Proposed classifier’s lime explanation
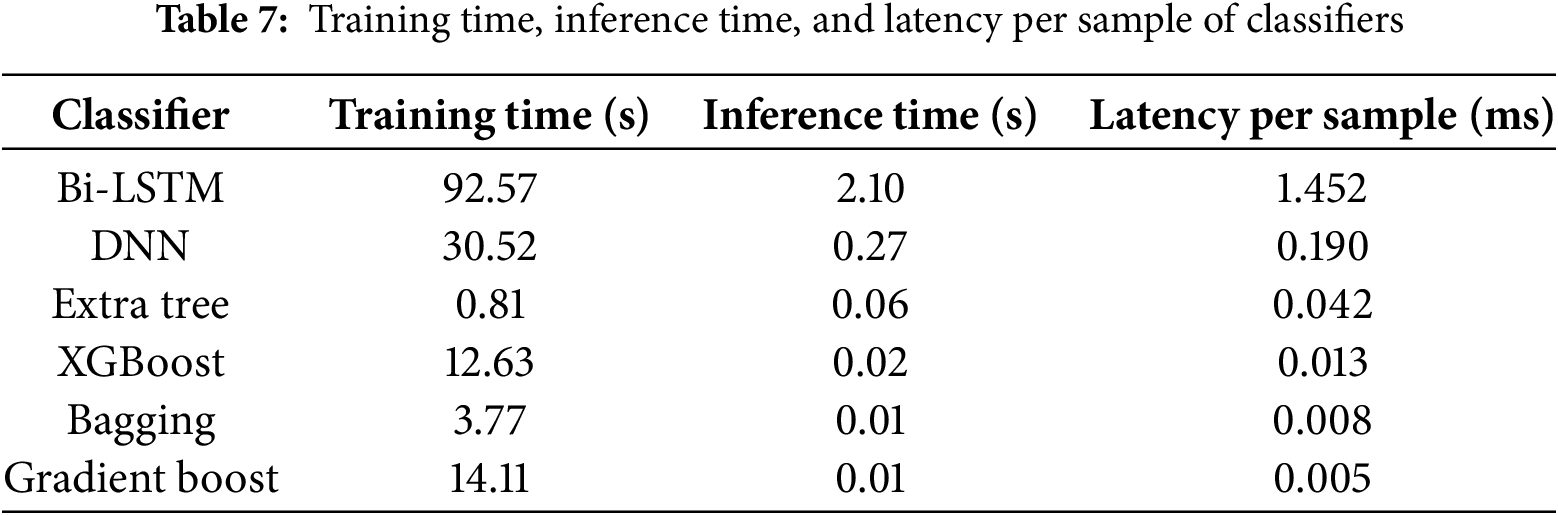
Each classifier shows its training duration, total inference time, and per-sample latency in Table 7. The training and inference workflows of Extra Trees, XGBoost, Bagging and Gradient Boosting models performed at exceptional speeds. Real-time prediction requires a rapid response, which makes Gradient Boosting the most efficient choice, as it delivers the shortest per-sample latency (0.005 ms). The Bi-LSTM model delivered acceptable results in inference speed (2.10 s) and produced a sample latency of 1.452 ms, which satisfies the requirements for real-time SCADA system monitoring. The DNN model demonstrated optimal performance in terms of the complexity-speed trade-off, as it processed data at times lower than Bi-LSTM while maintaining decent accuracy. Bi-LSTM provides optimal detection results, but lightweight ensemble models show higher potential for time-sensitive operational settings. The experimental data confirms that the presented model remains practical for deployment and supplies essential insights for improving future deployment-optimized systems.
The generalization ability of each classifier, combined with its robustness, was assessed through 5-fold cross-validation calculations, yielding average metric results. The Bi-LSTM model delivered superior results to every model tested through Table 8, reaching 0.94 accuracy, Precision, recall, and F1 scores. Detecting temporal dependencies within power system sequences becomes more effective with Bi-LSTM due to its ability to find these crucial dependencies. Through its implementation, the XGBoost model achieved high recall values (0.98) in attack detection; however, it resulted in compromised Precision. The ensemble learning methods of Bagging and Gradient Boosting deliver optimal results, achieving matched Recall and F1 scores, because they excel in ensemble-based learning techniques. The DNN and Extra Tree classifiers demonstrated reduced overall performance mainly because they showed inferior Precision and accuracy levels compared to other models when working with the dataset. The cross-validation analysis confirms Bi-LSTM as the preferred choice due to its accurate performance, which consistently maintains stable behavior across all metrics.

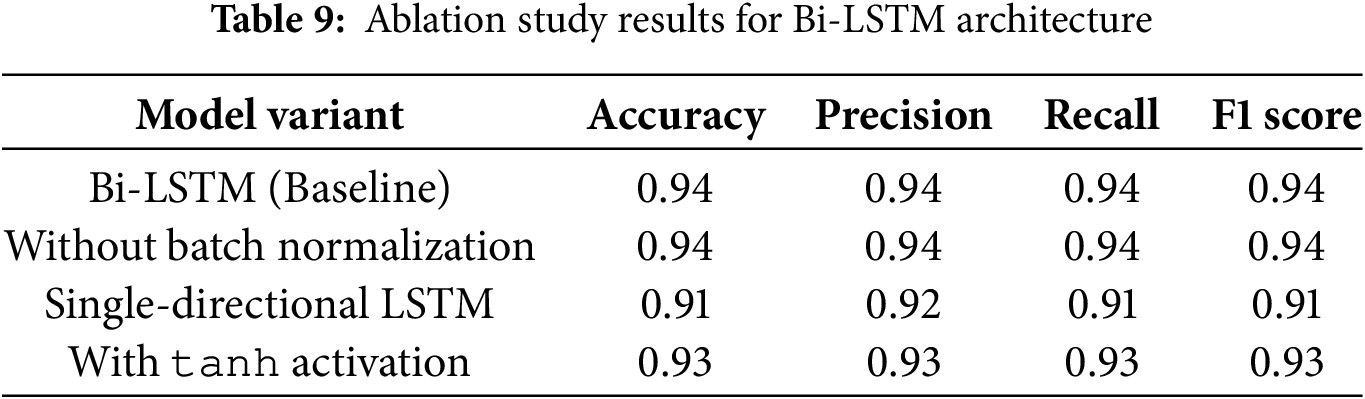
4.3 Ablation Study of the Bi-LSTM Model
The ablation study was conducted to determine which components of the Bi-LSTM model were most crucial for achieving its overall effectiveness. The analytical process focuses on measuring distinct layers and operations by sequentially altering and removing each fundamental component during evaluation. The evaluation outcomes identify which components contribute to improving model accuracy, maintaining stability, and enhancing generalizability.
Table 9 shows how different Bi-LSTM model components influence overall performance. Swapping out the Bidirectional LSTM structure for unidirectional LSTM layers diminished every evaluation metric by significant measures (for instance, F1-score dropped from 0.94 to 0.91). Using the tanh function instead of the ReLU activation in the proposed model resulted in a minimal performance reduction, yielding an F1-score measure of 0.93. ReLU proves superior since it offers better performance than tanh, despite sharing similar viability, as it minimizes the gradient disappearance problem during training. The ablation study demonstrates that the proposed model’s architectural choices were correct and shows how Bi-LSTM layers process sequential data effectively, alongside their resistance to architectural changes.
A bi-LSTM classifier is employed in the current approach to detecting fake data injection attacks in power systems accurately. Table 10 includes a comparison. When compared to the current study’s Approach Comparison, the Bi-LSTM classifier achieves an F1-Score of 93%, outperforming the previously suggested method by Boyaci et al. [26], which had an F1-Score of 90.14%. This performance improvement demonstrates that the proposed Bi-LSTM classifier can effectively detect ML data injections, which is crucial for maintaining system resilience and dependability in power systems. The success of the suggested strategy in terms of accurate detection and its resilience to breaking previous approaches is demonstrated by this increased F1-Score, which exhibits a superior balance between Precision and Recall.

The proposed Bi-LSTM model’s practical usability is equally important as its superior classification abilities when deployed in real-world smart grid settings. The high accuracy measurement of 93% may not guarantee the practical deployment of the model, as its running speed and computational expenses need to be considered. Modeling using Bi-LSTM systems offers an optimal balance between system complexity and the ability to track temporal patterns. This study implemented a low-latency detection framework using two stacked LSTM layers with regularisation because it operates effectively on standard power grid monitoring systems that provide real-time capabilities. The processing requirements of Bi-LSTM remain low compared to those of Transformer models, which enables deployment even on edge devices and SCADA systems without excessive resource utilization. The model’s properties enable it to perform effectively in real-time FDI attack detection operations in limited environments.
This paper proposed an integrated Bi-LSTM-based deep learning architecture and XAI techniques to improve FDI attack detection performance and explainability in power systems. Our approach differs from past research using black-box models or conventional machine learning methods because it integrates temporal sequential models with feature-level explanations, allowing operators to make informed and trustworthy decisions. A 5-fold cross-validation procedure demonstrated its use in guaranteeing the reliability and generalizability of our model. The Bi-LSTM model reached 93% average accuracy, which surpassed XGBoost at 89% and Bagging at 84%, along with Gradient Boosting at 81%. The ablation study confirmed that enabling bidirectional processing and ReLU activation contributed significantly to performance while showing minimal impact from batch normalization. The design parameters of the proposed architecture are validated through these findings, thereby demonstrating their suitability for deployment. The planned future research focuses on improving adaptability to stealthy or adaptive FDI attacks by designing online learning protocols that enable continual model update mechanisms. Our research includes plans to expand the dataset with genuine power plant data from various sources, thereby enhancing the framework’s generalization ability.
Acknowledgement: The authors extend their appreciation to the Deanship of Scientific Research and Libraries in Princess Nourah bint Abdulrahman University for funding this research work through the Research Group project, Grant No. (RG-1445-0064).
Funding Statement: The authors extend their appreciation to the Deanship of Scientific Research and Libraries in Princess Nourah bint Abdulrahman University for funding this research work through the Research Group project, Grant No. (RG-1445-0064).
Author Contributions: The authors confirm contribution to the paper as follows: study conception and design: Ghadah Aldehim, Shakila Basheer; data collection: Ghadah Aldehim, Shakila Basheer; analysis and interpretation of results: Ghadah Aldehim, Shakila Basheer, Ala Saleh Alluhaidan, Sapiah Sakri; draft manuscript preparation: Ghadah Aldehim, Shakila Basheer, Ala Saleh Alluhaidan, Sapiah Sakri. All authors reviewed the results and approved the final version of the manuscript.
Availability of Data and Materials: The data that support the findings of this study are openly available in Kaggle at [https://www.kaggle.com/datasets/bachirbarika/power-system] (accessed on 31 July 2025).
Ethics Approval: Not applicable.
Conflicts of Interest: The authors declare no conflicts of interest to report regarding the present study.
References
1. Cavus M. Advancing power systems with renewable energy and intelligent technologies: a comprehensive review on grid transformation and integration. Electronics. 2025;14(6):1159. doi:10.3390/electronics14061159. [Google Scholar] [CrossRef]
2. Al-Shetwi AQ, Hannan M, Al-Masri HM, Sujod MZ. Latest advancements in smart grid technologies and their transformative role in shaping the power systems of tomorrow: an overview. Progress Energy. 2025;7(1):012004. doi:10.1088/2516-1083/ada198. [Google Scholar] [CrossRef]
3. Goel S. A systematic literature review on past attack analysis on industrial control systems. Trans Emerg Telecomm Technol. 2024;35(6):e5004. doi:10.1002/ett.5004. [Google Scholar] [CrossRef]
4. Abdelkader S, Amissah J, Kinga S, Mugerwa G, Emmanuel E, Mansour DEA, et al. Securing modern power systems: implementing comprehensive strategies to enhance resilience and reliability against cyber-attacks. Res Eng. 2024;23:102647. doi:10.1016/j.rineng.2024.102647. [Google Scholar] [CrossRef]
5. Pinto SJ, Siano P, Parente M. Review of cybersecurity analysis in smart distribution systems and future directions for using unsupervised learning methods for cyber detection. Energies. 2023;16(4):1651. doi:10.3390/en16041651. [Google Scholar] [CrossRef]
6. Ekundayo F, Atoyebi I, Soyele A, Ogunwobi E. Predictive analytics for cyber threat intelligence in fintech using big data and machine learning. Int J Res Publ Rev. 2024;5(11):1–15. [Google Scholar]
7. Heidari A, Jafari Navimipour N, Unal M, Zhang G. Machine learning applications in internet-of-drones: systematic review, recent deployments, and open issues. ACM Comput Surv. 2023;55(12):1–45. doi:10.1145/3571728. [Google Scholar] [CrossRef]
8. Manias DM, Saber AM, Radaideh MI, Gaber AT, Maniatakos M, Zeineldin H, et al. Trends in smart grid cyber-physical security: components, threats and solutions. IEEE Access. 2024;12:161329–56. doi:10.1109/access.2024.3477714. [Google Scholar] [CrossRef]
9. ŞAHiN E, Arslan NN, Özdemir D. Unlocking the black box: an in-depth review on interpretability, explainability, and reliability in deep learning. Neural Comput Appl. 2025;37(2):859–965. doi:10.1007/s00521-024-10437-2. [Google Scholar] [CrossRef]
10. Wang S, Qureshi MA, Miralles-Pechuán L, Huynh-The T, Gadekallu TR, Liyanage M. Explainable AI for 6G use cases: technical aspects and research challenges. IEEE Open J Commun Soc. 2024;5(2):2490–540. doi:10.1109/ojcoms.2024.3386872. [Google Scholar] [CrossRef]
11. Bolgouras V, Ioannidis T, Politis I, Zarras A, Xenakis C. RETINA: distributed and secure trust management for smart grid applications and energy trading. Sustain Energy Grids Netw. 2024;38(23):101274. doi:10.1016/j.segan.2024.101274. [Google Scholar] [CrossRef]
12. Sarker IH, Janicke H, Mohsin A, Gill A, Maglaras L. Explainable AI for cybersecurity automation, intelligence and trustworthiness in digital twin: methods, taxonomy, challenges and prospects. ICT Express. 2024;10(4):935–58. doi:10.1016/j.icte.2024.05.007. [Google Scholar] [CrossRef]
13. Li Y, Wei X, Li Y, Dong Z, Shahidehpour M. Detection of false data injection attacks in smart grid: a secure federated deep learning approach. IEEE Trans Smart Grid. 2022;13(6):4862–72. doi:10.1109/tsg.2022.3204796. [Google Scholar] [CrossRef]
14. Gueriani A, Kheddar H, Mazari AC. Adaptive cyber-attack detection in IIoT using attention-based LSTM-CNN models. In: 2024 International Conference on Telecommunications and Intelligent Systems (ICTIS); 2024 Dec 14–15; Djelfa, Algeria. p. 1–6. [Google Scholar]
15. Gueriani A, Kheddar H, Mazari AC. Enhancing iot security with cnn and lstm-based intrusion detection systems. In: 6th International Conference on Pattern Analysis and Intelligent Systems (PAIS); 2024 Apr 24–25; El Oued, Algeria: IEEE. p. 1–7. [Google Scholar]
16. Reda HT, Anwar A, Mahmood A, Chilamkurti N. Data-driven approach for state prediction and detection of false data injection attacks in smart grid. J Modern Power Syst Clean Energy. 2022;11(2):455–67. doi:10.1109/pesgm51994.2024.10688898. [Google Scholar] [CrossRef]
17. Ashrafuzzaman M, Das S, Chakhchoukh Y, Shiva S, Sheldon FT. Detecting stealthy false data injection attacks in the smart grid using ensemble-based machine learning. Comput Secur. 2020;97(5):101994. doi:10.1016/j.cose.2020.101994. [Google Scholar] [CrossRef]
18. Zhang Y, Wang J, Chen B. Detecting false data injection attacks in smart grids: a semi-supervised deep learning approach. IEEE Trans Smart Grid. 2020;12(1):623–34. doi:10.1109/tsg.2020.3010510. [Google Scholar] [CrossRef]
19. Selvarajan S, Manoharan H, Al-Shehari T, Alsalman H, Alfakih T. Smart grid security framework for data transmissions with adaptive practices using machine learning algorithm. Comput Mater Contin. 2025;82(3):4339–69. doi:10.32604/cmc.2025.056100. [Google Scholar] [CrossRef]
20. Shankar A, Manoharan H, Khadidos AO, Khadidos AO, Selvarajan S, Goyal S. Transparency and privacy measures of biometric patterns for data processing with synthetic data using explainable artificial intelligence. Image Vis Comput. 2025;154:105429. doi:10.1016/j.imavis.2025.105429. [Google Scholar] [CrossRef]
21. Yu Z, Gao H, Cong X, Wu N, Song HH. A survey on cyber--physical systems security. IEEE Int Things J. 2023;10(24):21670–86. doi:10.1109/jiot.2023.3289625. [Google Scholar] [CrossRef]
22. Yu Z, Wang Z, Yu J, Liu D, Song HH, Li Z. Cybersecurity of unmanned aerial vehicles: a survey. IEEE Aerospace Electr Syst Mag. 2023;39(9):182–215. doi:10.1109/maes.2023.3318226. [Google Scholar] [CrossRef]
23. Shi H, Xie L, Peng L. Detection of false data injection attacks in smart grid based on a new dimensionality-reduction method. Comput Electr Eng. 2021;91(1):107058. doi:10.1016/j.compeleceng.2021.107058. [Google Scholar] [CrossRef]
24. Li B, Lu R, Xiao G, Li T, Choo KKR. Detection of false data injection attacks on smart grids: a resilience-enhanced scheme. IEEE Trans Power Syst. 2021;37(4):2679–92. doi:10.1109/tpwrs.2021.3127353. [Google Scholar] [CrossRef]
25. Mukherjee D, Chakraborty S, Ghosh S. Deep learning-based multilabel classification for locational detection of false data injection attack in smart grids. Electr Eng. 2022;104(1):259–82. doi:10.1007/s00202-021-01278-6. [Google Scholar] [CrossRef]
26. Boyaci O, Umunnakwe A, Sahu A, Narimani MR, Ismail M, Davis KR, et al. Graph neural networks based detection of stealth false data injection attacks in smart grids. IEEE Syst J. 2021;16(2):2946–57. doi:10.1109/jsyst.2021.3109082. [Google Scholar] [CrossRef]
Cite This Article
 Copyright © 2025 The Author(s). Published by Tech Science Press.
This work is licensed under a Creative Commons Attribution 4.0 International License , which permits unrestricted use, distribution, and reproduction in any medium, provided the original work is properly cited.
 Downloads
 Citation Tools