
 Submit a Paper
 Propose a Special lssue
 Open Access
ARTICLE

Deep Learning-Based Toolkit Inspection: Object Detection and Segmentation in Assembly Lines
1 Department of Mechanical Engineering, National Chung Cheng University, 168, University Rd., Min Hsiung, Chia Yi, 62102, Taiwan
2 Department of Biomedical Imaging, Chennai Institute of Technology, Sarathy Nagar, Chennai, 600069, India
3 Department of Computer Science and Engineering, Thapar Institute of Engineering and Technology, Patiala, 147001, India
4 Director of Technology Development, Hitspectra Intelligent Technology Co., Ltd., Kaohsiung, 80661, Taiwan
* Corresponding Author: Hsiang-Chen Wang. Email:
Computers, Materials & Continua 2026, 86(1), 1-23. https://doi.org/10.32604/cmc.2025.069646
Received 27 June 2025; Accepted 21 August 2025; Issue published 10 November 2025
 View Full Text
 Download PDF
Abstract
Modern manufacturing processes have become more reliant on automation because of the accelerated transition from Industry 3.0 to Industry 4.0. Manual inspection of products on assembly lines remains inefficient, prone to errors and lacks consistency, emphasizing the need for a reliable and automated inspection system. Leveraging both object detection and image segmentation approaches, this research proposes a vision-based solution for the detection of various kinds of tools in the toolkit using deep learning (DL) models. Two Intel RealSense D455f depth cameras were arranged in a top down configuration to capture both RGB and depth images of the toolkits. After applying multiple constraints and enhancing them through preprocessing and augmentation, a dataset consisting of 3300 annotated RGB-D photos was generated. Several DL models were selected through a comprehensive assessment of mean Average Precision (mAP), precision-recall equilibrium, inference latency (target ≥30 FPS), and computational burden, resulting in a preference for YOLO and Region-based Convolutional Neural Networks (R-CNN) variants over ViT-based models due to the latter’s increased latency and resource requirements. YOLOV5, YOLOV8, YOLOV11, Faster R-CNN, and Mask R-CNN were trained on the annotated dataset and evaluated using key performance metrics (Recall, Accuracy, F1-score, and Precision). YOLOV11 demonstrated balanced excellence with 93.0% precision, 89.9% recall, and a 90.6% F1-score in object detection, as well as 96.9% precision, 95.3% recall, and a 96.5% F1-score in instance segmentation with an average inference time of 25 ms per frame (≈40 FPS), demonstrating real-time performance. Leveraging these results, a YOLOV11-based windows application was successfully deployed in a real-time assembly line environment, where it accurately processed live video streams to detect and segment tools within toolkits, demonstrating its practical effectiveness in industrial automation. The application is capable of precisely measuring socket dimensions by utilising edge detection techniques on YOLOv11 segmentation masks, in addition to detection and segmentation. This makes it possible to do specification-level quality control right on the assembly line, which improves the ability to examine things in real time. The implementation is a big step forward for intelligent manufacturing in the Industry 4.0 paradigm. It provides a scalable, efficient, and accurate way to do automated inspection and dimensional verification activities.Keywords
Supplementary Material
Supplementary Material FileManufacturing is a crucial component of global economic growth, promoting trade, employment, and innovation. It accounts for around 15%–16% of global Gross Domestic Product (GDP) and is a crucial component of both developed and developing economies [1]. Modern manufacturing systems range from small-scale business units to fully automated smart factories that use real-time analytics, robotics, and IoT-enabled sensors to support large-scale production and productivity. To achieve sustained success in today’s intensely competitive global markets, companies must emphasize quality assurance and operational efficiency. As manufacturing expands and product complexity escalates, manual inspection techniques are insufficient to meet the rigorous demands for speed and accuracy.
The global industrial sector is experiencing a substantial transformation as it transitions from Industry 3.0 to Industry 4.0, leading to a more intelligent, interconnected, and automated manufacturing environment [2–4]. Industry 3.0 employed programmable logic controllers (PLC), robots, and digitalization, whereas Industry 4.0 utilizes cyber-physical systems, the Internet of Things (IoT), cloud computing, and artificial intelligence (AI) to create an entirely interconnected, intelligent, and adaptive industrial ecosystem [5]. In this new era, automation transcends mechanical operations to include cognitive decision-making informed by real-time data. IoT devices and smart sensors are incorporated throughout the production process to continuously monitor equipment health, track material flow, and collect critical operational data [6]. This information is later analyzed using AI and machine learning (ML) algorithms to enhance efficiency, dynamic scheduling, and predictive maintenance. Cloud-based technologies facilitate data sharing among departments and locations around the globe, enhancing supply chain coordination and operational transparency [7]. As a result, Industry 4.0 establishes a self-regulating production environment where humans, machines, and systems collaborate efficiently to boost output, decrease downtime, and maintain consistent high quality [8].
For decades, assembly lines have been a vital component of the manufacturing process, but despite the fact that they boost output, traditional assembly lines still heavily rely on human labor for essential tasks like product assembly, quality control, and inspection [9–11]. The tasks that require repetition and attention to detail, such as verifying the presence of tools in a toolkit, this reliance present challenges such as inconsistency, human error, tiredness, and reduced throughput. Manual operations can lead to delays, heightened operational costs, and considerable safety risks; thus, there is a need for automated, reliable solutions that enhance accuracy and efficiency on the assembly line [12]. Implementing automated inspection systems that utilize deep learning and computer vision not only facilitates the attainment of these goals but also aligns with the fundamental objectives of Industry 4.0 [13,14], including digital traceability, predictive maintenance, and data-driven process optimization. These systems are effective in eliminating defects and expensive rework by ensuring that each phase of manufacturing adheres to established standards. Manual visual inspection in industrial production lines has acknowledged limitations. Review studies indicate that error rates often range from 20% to 30%, suggesting that human inspectors may neglect a considerable number of defects. In specific inspection areas, such as semiconductor quality assurance, false negative rates have reached as high as 23%, whereas false positive rates are approximately 2%. Human-induced inconsistencies and detection inaccuracies result in quality challenges, waste, and production delays, underscoring the imperative for reliable, automated inspection solutions in Industry 4.0 environments [15].
In the last five years, adaptive automation systems have emerged as a prominent trend, facilitating real-time modifications with varying production demands. These systems employ AI algorithms and IoT devices to monitor and enhance assembly operations, thereby reducing downtime and increasing product efficiency [16]. For example, Vision-guided robotic systems have been deployed that assist in recognizing and adjusting components with remarkable precision, thus enhancing the precision and productivity of assembly processes [17].
Real-time monitoring and control of assembly line processes is possible with the integration of IoT devices. Data on machine performance, environmental conditions, and product quality are collected by sensors and linked equipment. This information can be subsequently utilized to forecast maintenance needs and minimize equipment failures. Furthermore, by overlaying digital instructions onto real components, augmented reality (AR) has been used to speed up the assembly process and reduce mistakes and training time [18]. Notwithstanding these developments, there are still a number of drawbacks, such as the high initial investment costs that may be burdensome for small and medium sized enterprises. Workforce adaptation presents additional challenges because employees may require retraining to appropriately use new technologies. Moreover, it can be challenging to integrate new technology with current infrastructure [19]. This study suggests an inexpensive, modular automation framework that prioritizes a smooth integration with existing systems in order to get over these challenges.
To address these issues, a low-cost, modular automation architecture that emphasizes smooth interface with current manufacturing systems has been recommended. A Windows-based program designed for real-time industrial use has been used to develop and implement an AI-powered toolkit inspection solution. To obtain synchronized RGB and depth data, the system makes use of two Intel RealSense D455f RGB-D cameras. This enables it to recognize and distinguish tools precisely, even in situations with low contrast backgrounds, overlapping sections, glossy surfaces, or occlusions [20]. The system is perfect for small and medium-sized organizations wishing to implement automation with minimal investment because it is designed to be plug-and-play and requires only a few adjustments to the current infrastructure. The deep learning models (YOLOV8, YOLOV5, YOLOV11, Masked R-CNN, Faster R-CNN) form the foundation of the system. It is able to detect tools accurately even when they are partially hidden, have the same form or size, or even tolerate pixel-level differences. The included Windows program allows you to view inspection findings in real time and features a user-friendly interface. Additionally, it allows you to configure the system, immediately detects any excess or missing tools, and maintains thorough logs for tracking and quality assurance [21]. The streamlined interface, which lessens the necessity for operator training, is one way to address the issue of workforce adaptability. By automating the inspection process, the solution improves accuracy, consistency, and speed in facilitating Industry 4.0 goals like intelligent automation, digital traceability, and data-driven operational efficiency.
Motivation:
• In addition to identifying the existence of tools, modern manufacturing demands precise measurement verification, especially for sockets, where size accuracy is vital for assembly quality. Real-time and in-line measurement is not possible with traditional methods, which reduces efficiency and may lead to issues.
• In response, a Windows software has been developed that consistently measures socket dimensions from RGB-D data by combining edge detection with YOLOV11 instance segmentation. With depth-calibrated scaling, the device can measure socket diameters with an accuracy of 0.2 mm. This enables specs to be verified on the assembly line.
• This feature enhances quality control, reduces human error, and also supports Industry 4.0 objectives by integrating intelligent, real-time dimensional inspection with automated production processes.
Research Gaps:
• Present assembly-line inspection is either manual or dependent solely on 2D vision, resulting in inconsistencies and elevated error rates.
• Limited research combines object detection and instance segmentation using RGB-D data for various toolsets.
• There is a deficiency in comparative analyses of contemporary deep learning architectures under stringent real-time constraints.
• No scalable, ready-to-deploy framework exists that demonstrates live verification of industrial toolkits.
Implications of This Research:
• Development and public dissemination of a 3300-image RGB-D dataset annotated for toolkit evaluation.
• Comprehensive assessment of five deep learning models (YOLOv5, YOLOv8, YOLOv11, Faster R-CNN, Mask R-CNN) regarding detection and segmentation tasks.
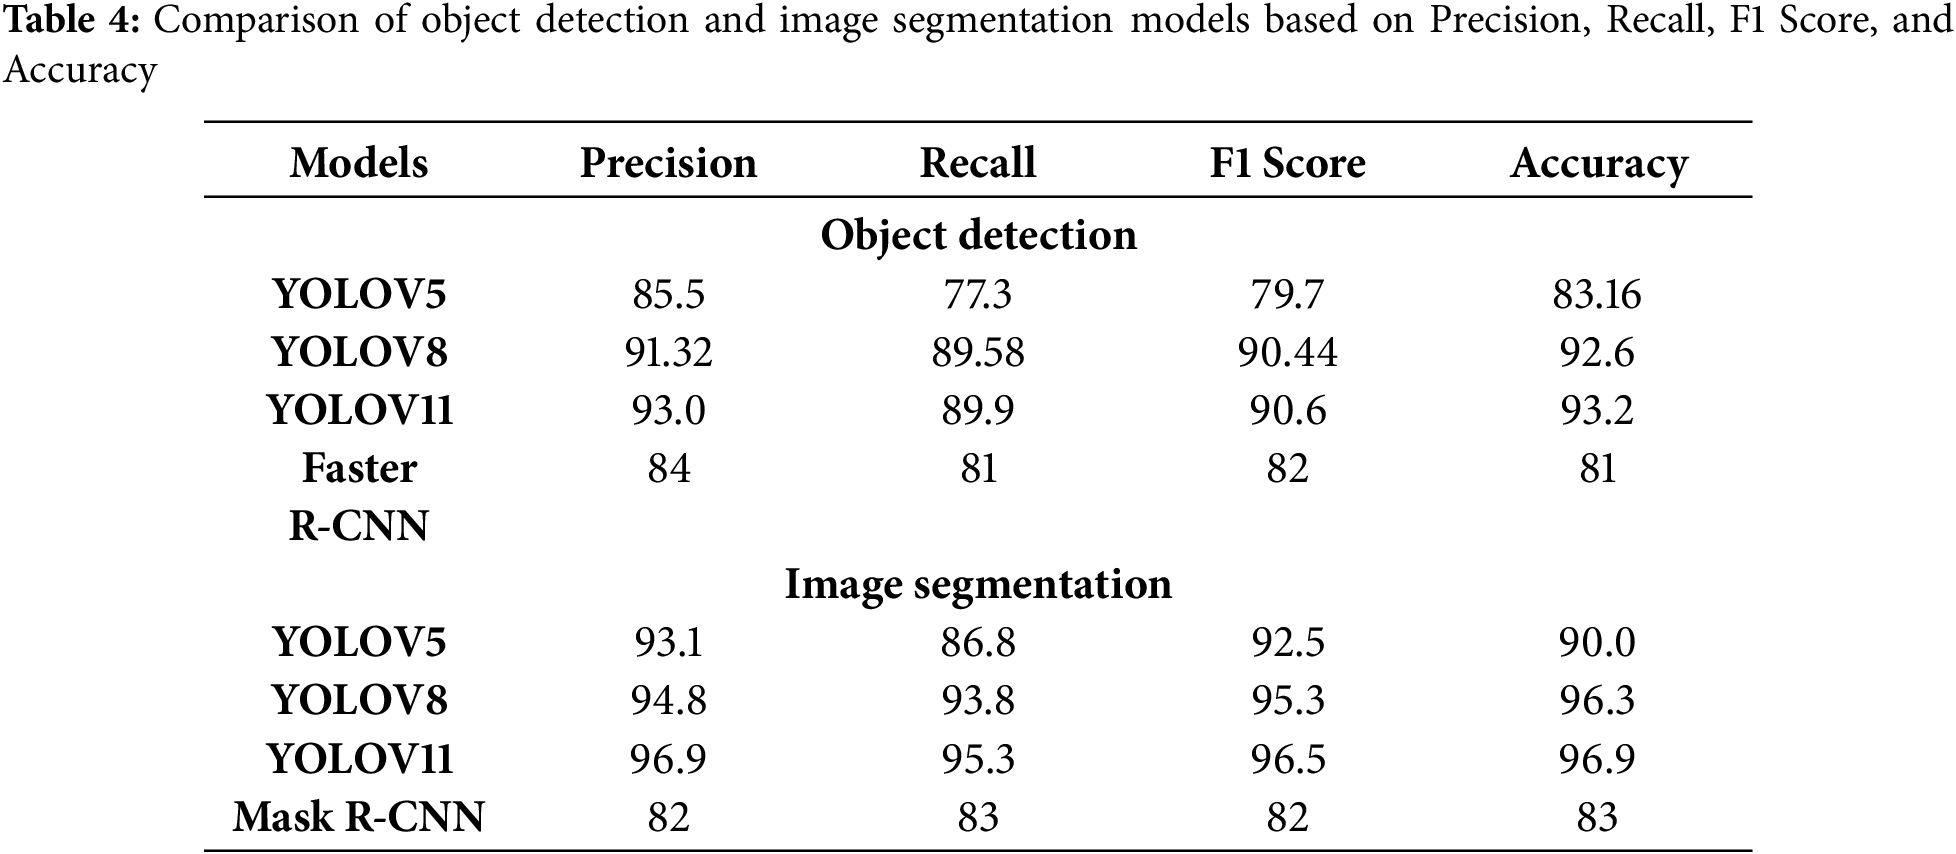
• YOLOv11 has been identified as the leading model, achieving 93.2% detection accuracy, 96.9% segmentation accuracy, and approximately 40 FPS inference.
• Creation and implementation of a real-time YOLOv11-based Windows application for live assembly line inspection.
• Assessment of the proposed system’s scalability, efficiency, and accuracy within an Industry 4.0 context.
The subsequent sections of this paper are structured as follows: Section 2 delineates the materials and methodologies, encompassing our dual RGB-D camera configuration, data acquisition and annotation protocols, as well as all preprocessing and augmentation procedures and delineates the deep learning models under examination—YOLOv5, YOLOv8, YOLOv11, Faster R-CNN, and Mask R-CNN—alongside the training protocols and evaluation metrics. Section 3 provides a thorough comparison of the performance of these models in object detection and instance segmentation tasks and subsequently illustrates the real-time implementation of our YOLOv11-based Windows application, emphasizing its inference speed, interface design, and integration within an assembly-line setting. Section 5 concludes with a summary of our contributions, addresses the system’s limitations, and delineates opportunities for future research.
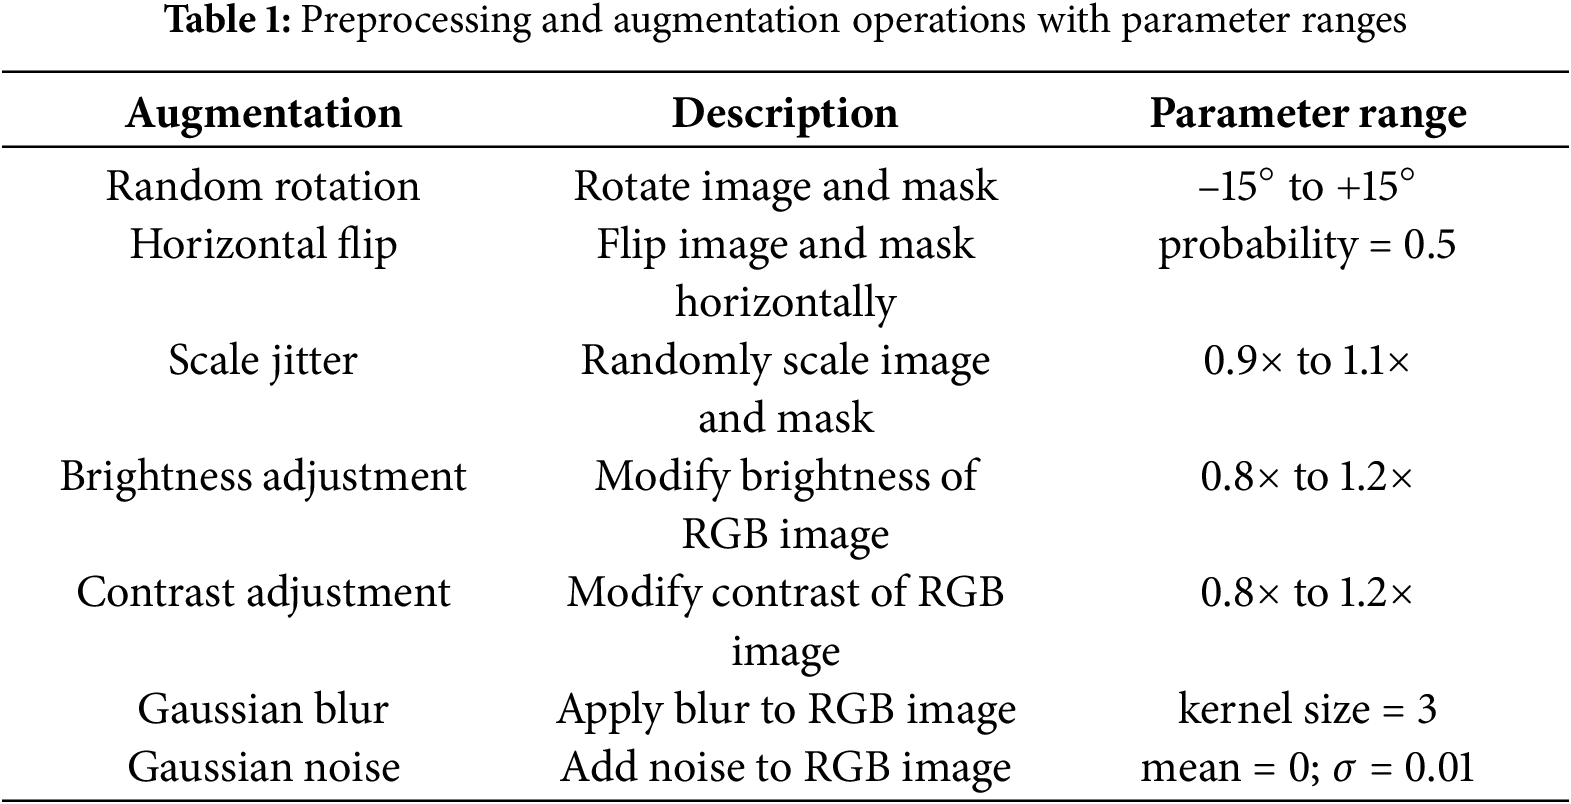
A total of 3300 RGB-D images of toolkits were captured using two Intel RealSense D455f depth cameras positioned in a top-down orientation. RGB frames were captured at a resolution of 1920 × 1080, while depth maps were obtained at 1280 × 720, both synced at 30 FPS. Toolkit cases were captured under varying lighting conditions and tool arrangements to enhance variability. The dataset had been randomly split into training (80%, 2640 images), validation (10%, 330 images), and test (10%, 330 images) subsets. Every image was labeled with bounding boxes and pixel-level masks using LabelMe, conforming to the COCO JSON standard. Tools were categorized into three classifications: small, medium, and long based on their physical characteristics. Two separate annotators executed every labeling, and any inconsistencies were reconciled through consensus to ensure high-quality ground truth. Before training, all images and their respective masks were scaled to 640 × 640 pixels and normalized utilizing the ImageNet mean and standard deviation. Throughout the training process, the subsequent online augmentations were implemented to enhance robustness, as illustrated in Table 1. In response to the underrepresentation of short and long tools relative to medium-sized tools, we employed a class-balanced sampling method during training to guarantee that each mini-batch has an equal amount of images from each tool type. Additionally, we used class weights in both the detection and segmentation loss functions, calculated as the inverse of class frequencies, to emphasize minority classes and improve recall for underrepresented tool types.
A comprehensive and diverse dataset is essential for training deep learning models to achieve precision in practical industrial applications. This study utilized two Intel RealSense D455f depth cameras to capture high-resolution images of toolkits at the summit while navigating the inspection area, as illustrated in Fig. 1. This study employed a dataset obtained directly from the assembly line at REDAI Precision Tools in Taichung, Taiwan, thereby creating authentic industrial circumstances for application in deployment scenarios. The acquisition scene portrayed genuine working conditions on the assembly line, encompassing standard background materials, lighting intensities, and the configuration and placement of tools and equipment. Notably, there was no obstruction of tools during data collection, ensuring that tools were clearly visible in each capture, hence permitting annotation and the creation of ground truth. Each image has both RGB and aligned depth information, enabling models to utilize not only color and texture cues but also depth data to more effectively distinguish between objects. The original dataset comprised 500 RGB-D photographs, and comprehensive data augmentation techniques were employed to enhance model generalization and resilience. The transformations comprised horizontal and vertical flips, 90° rotations (clockwise, counter-clockwise, and upside-down), random rotations within the range of −15° to +15°, image resizing to 640 × 640 pixels, and automatic orientation adjustment [22]. The improvements led to a fivefold increase in the dataset, resulting in the generation of 3000 improved photos [23]. Table 2 distinguishes between the frequency of occurrences prior to and subsequent to the augmentation. The collection comprises 14 distinct types of tools commonly utilized in industrial assembly: Adaptor, Allen Key, Bit Holder, Bit Sockets, Bits, Deep Socket, Extension Bar, Flex Handle, Ratchet Handles, S Handle, Sockets, Spanners, Long Bit Socket, and Universal Joint. Among these tools, there exists a wide range of material and surface properties, including certain instruments are composed of metal, lack insulation, and are fabricated from high-quality steel or chrome featuring reflecting surfaces. Furthermore, there exist impact tools featuring matte black coatings, along with a third category of insulated tools employed for electrical safety. The variety of material kinds, reflectivity, and surface textures complicates object recognition and segmentation, rendering the dataset excellent for evaluating model performance in real-world scenarios. Subsequent to augmentation, the dataset was partitioned into training, validation, and testing subsets utilizing a 70-20-10 distribution to guarantee consistent and impartial assessment. Fig. 2 illustrates the comprehensive workflow of the research. Fig. 2 illustrates our detailed workflow. Initially, unrefined RGB-D images are captured using two overhead RealSense D455f cameras. Images undergo preprocessing, including cropping, horizontal flipping, and rotation for augmentation. The annotated dataset is employed to train the YOLOv8 model, with its performance evaluated using confusion matrices and key metrics. The trained model is implemented as a Windows application, providing an easy interface for real-time toolkit identification and segmentation on the assembly line.
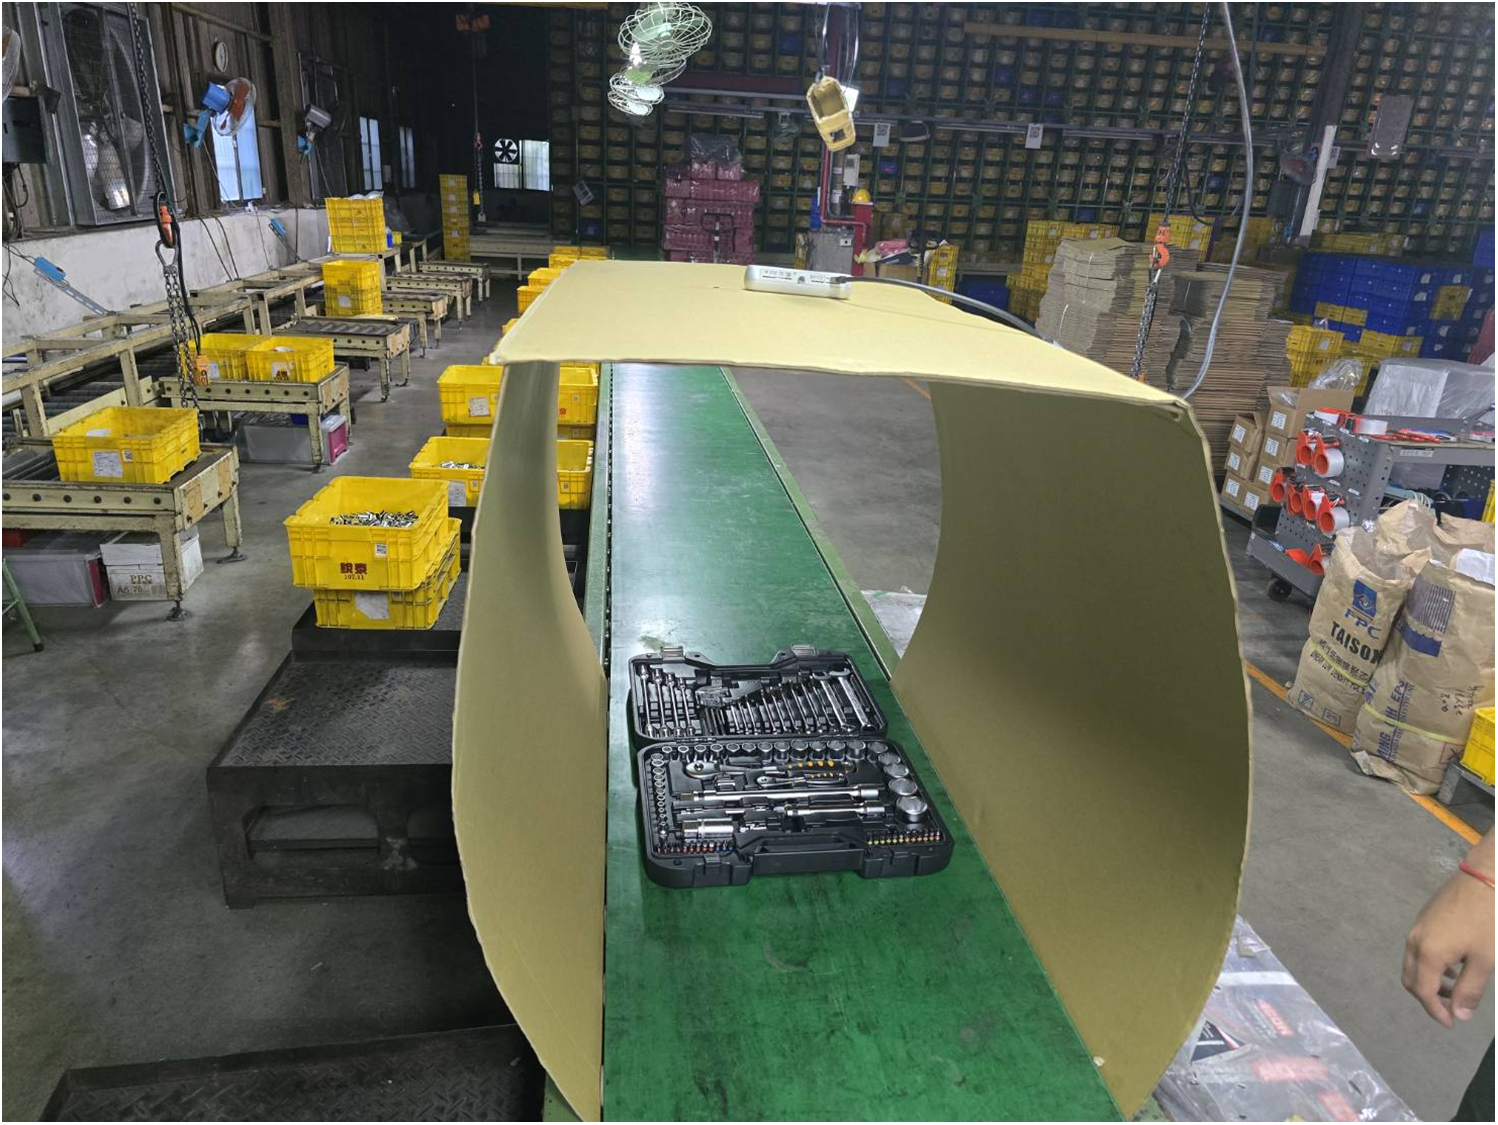
Figure 1: Custom sheet-metal enclosure mounted above the assembly line to create a controlled environment for accurate toolkit inspection using a dual-camera vision system
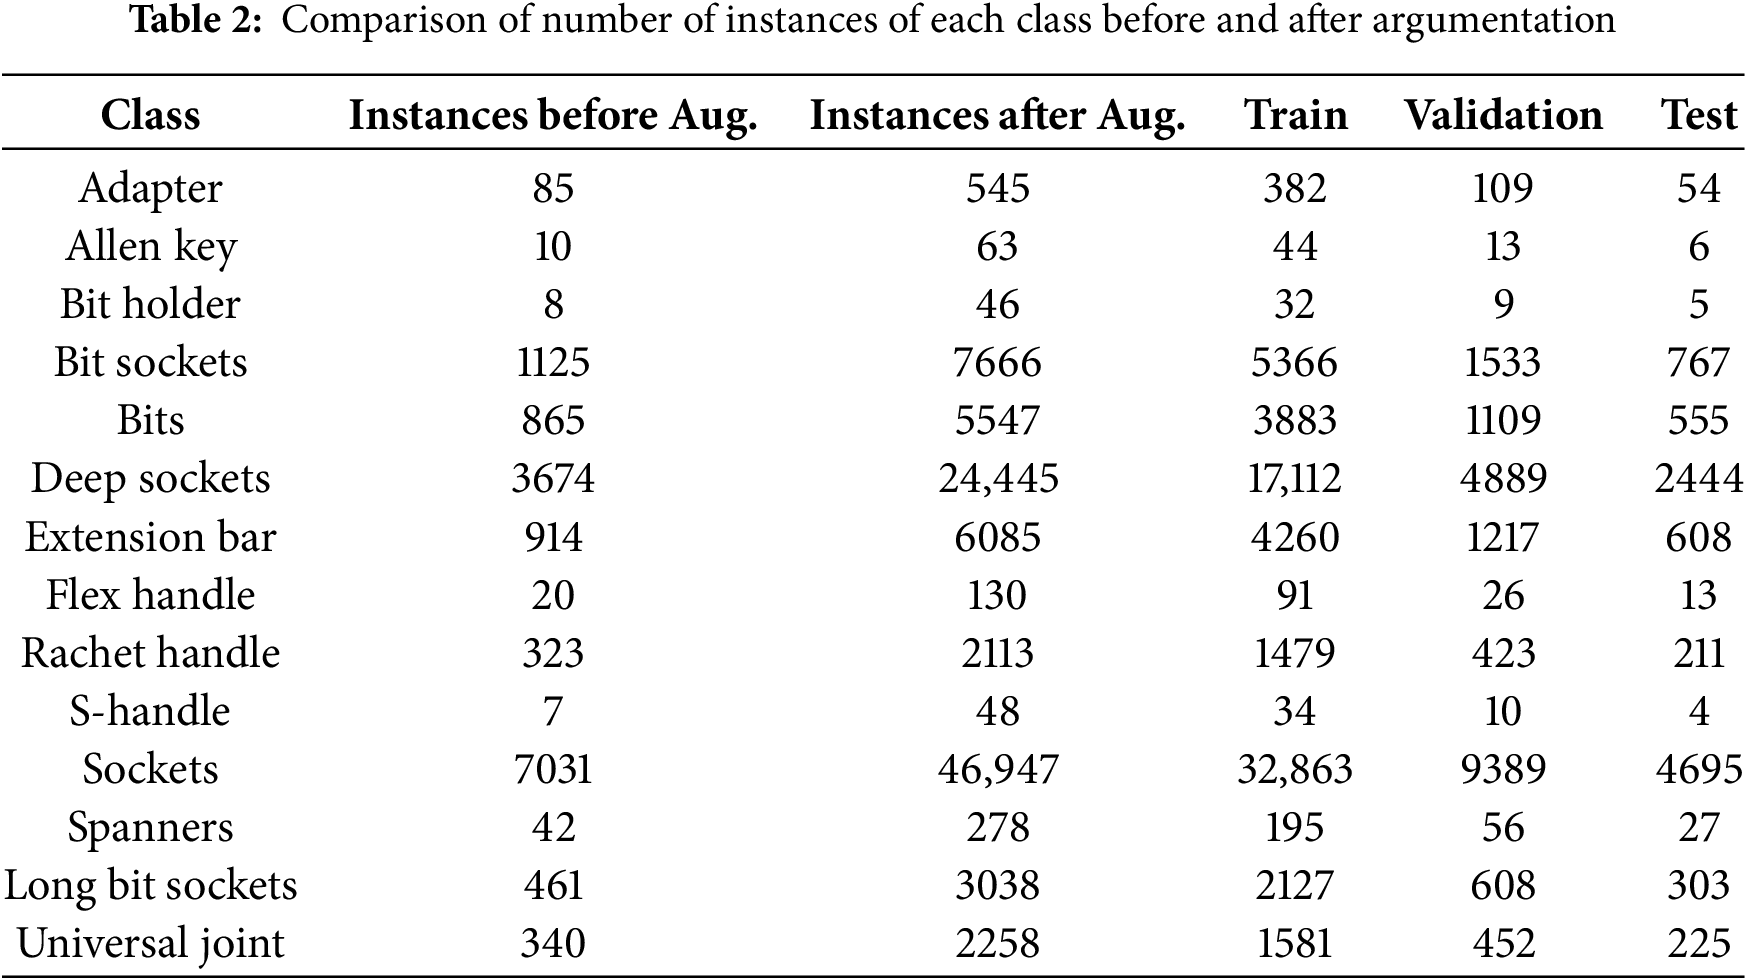
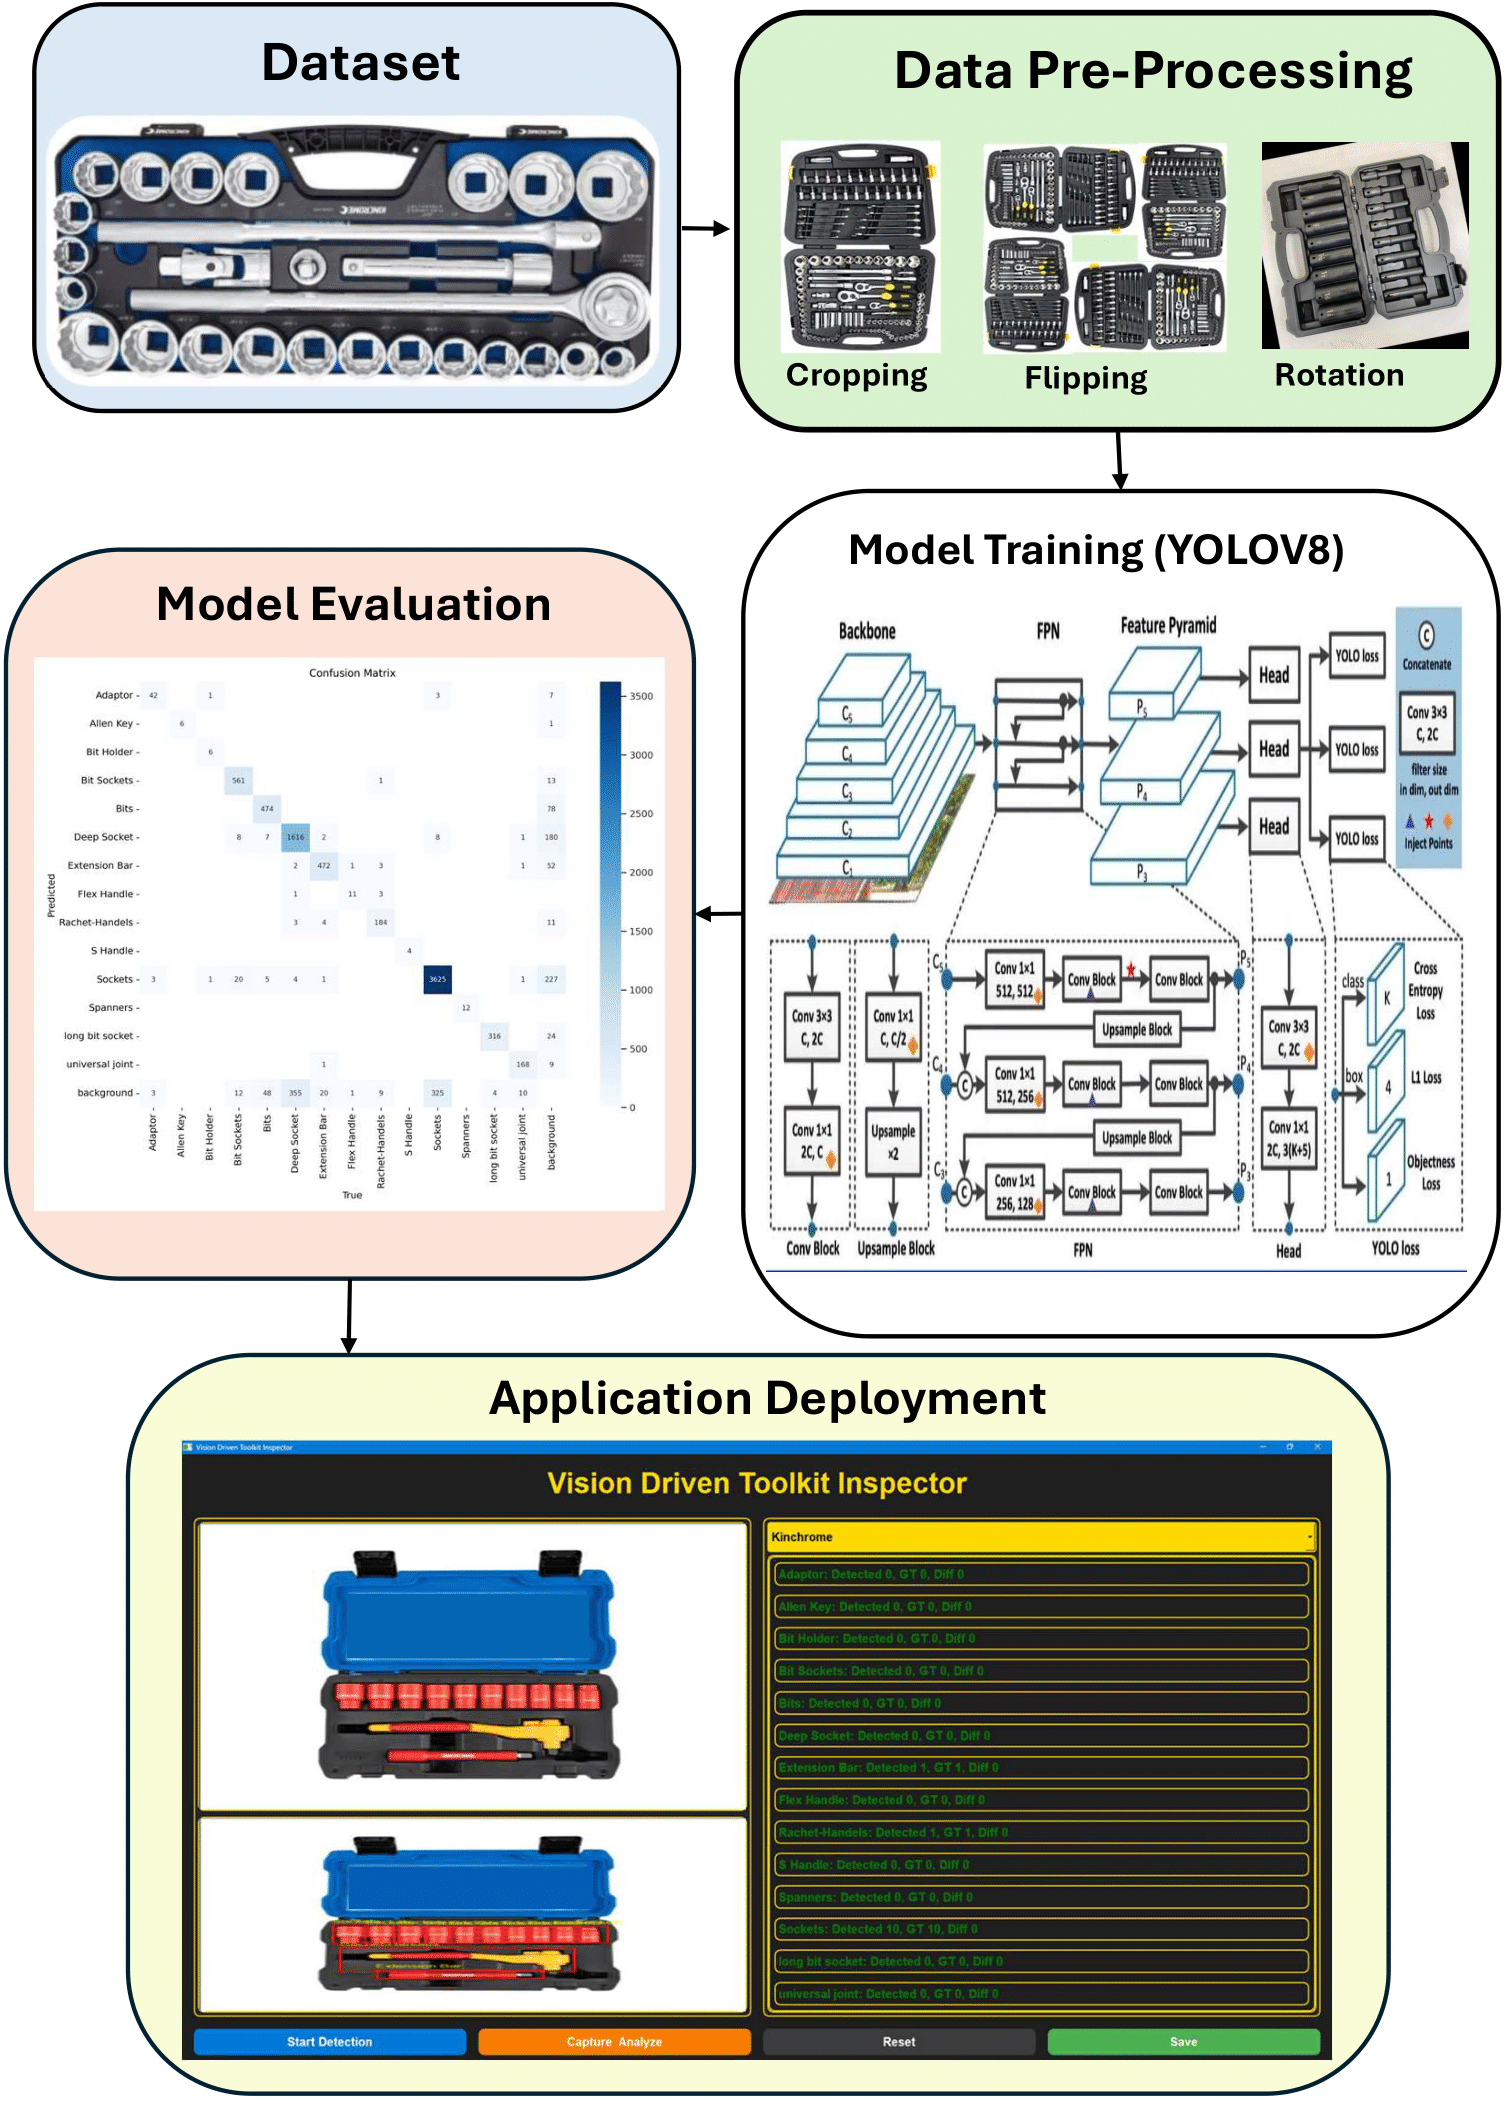
Figure 2: End-to-end pipeline of the Toolkit Inspector system
YOLOV5 Detection
YOLOv5 is a single-stage object detection model designed for real-time processing [24]. The architecture comprises four essential components: input, backbone, neck, and head. Input is responsible for image preprocessing, including scaling and data augmentation. The backbone, often CSPDarknet53, extracts significant visual features from the image, utilizing Cross Stage Partial (CSP) connections to enhance gradient flow while minimizing computational demands [25]. The neck often incorporates a Path Aggregation Network (PANet) that amalgamates data from several scales to enhance semantic representation. The Head successfully achieves detection by densely predicting bounding boxes, objectness scores, and class probabilities across many feature maps. The loss function of YOLOV5 comprises three elements: bounding box regression loss, objectness loss, and classification loss. The total loss is represented by Eq. (1). The bounding box regression loss utilizes Complete Intersection over Union (CIoU), enhancing IoU by factoring in overlap area, center distance, and aspect ratio as delineated in Eq. (2). The objectness loss employs Binary Cross-Entropy (BCE) as delineated in Eq. (3). YOLOV5 generally employs the Stochastic Gradient Descent (SGD) or Adam optimizer [26]. The parameter update rule in SGD is written in Eq. (4).
where b is the predicted box and
YOLOV5 Segmentation
YOLOV5 for image segmentation incorporates an additional segmentation head into the fundamental object identification architecture to enhance its efficiency. The approach retains the same Input, Backbone (CSPDark-net53), and Neck (PANet or FPN) components utilized in object identification, facilitating shared feature extraction [16]. The primary difference is that YOLOV5 includes a segmentation-specific head with the object detection head. This segmentation head generates pixel-wise masks for each identified object, facilitating instance segmentation. To restore spatial resolution, the segmentation head often employs a lightweight decoder that up-samples the features using techniques such as transposed convolutions or interpolation. Convolutional layers further enhance these feature maps to provide binary masks that correspond to the identified item bounding boxes. The segmentation output includes a corresponding mask, bounding boxes, and class labels for each object. Eq. (5) illustrates that the loss function for YOLOV5 segmentation comprises the aggregation of detection loss and mask segmentation loss.
Ldet is the detection loss, which is made up of the bounding box regression, objectness, and classification components. Lmask is the mask segmentation loss, which is often calculated using BCE across pixel values, as shown in Eq. (6) [27]. In terms of optimization, YOLOV5 segmentation continues to employ SGD or Adam optimizers to adjust the weights. The segmentation head introduces a slight increase in processing time, although it preserves YOLOV5’s capacity for real-time inference.
where m is the ground mask and ŝ is the predicted mask.
YOLOV8 Detection
YOLOV8 is a notable advancement in the YOLO series, designed to enhance precision and adaptability [28,29]. It does not utilize anchors as YOLOv5 does; rather, it employs a novel architecture that emphasizes performance and simplicity. It comprises four essential components: Input, Backbone, Neck, and Head, similar to YOLOV5, although there are numerous significant distinctions [30]. The Backbone employs a CSP-style architecture, enhanced by C2F modules that optimize gradient flow and reduce the parameter count. The Neck functions similarly to an FPN for integrating elements across several scales, although it operates more swiftly. A significant enhancement in YOLOv8 is the decoupled head, which differentiates the processes of object classification and box regression, resulting in accelerated learning compared to earlier YOLO models. The Head forecasts the object’s center, dimensions, and classification without employing designated anchors. Eq. (1) delineates the loss function, which encompasses bounding box regression loss, objectness loss, and classification loss. The bounding box loss integrates Distribution Focal Loss (DFL) with an IoU-based loss, often CIoU, as seen in Eq. (7) [31,32]. YOLOV8 employs the Adam optimizer, incorporating decoupled weight decay into Adam’s update formula as delineated in Eq. (8). It features an anchor-free architecture, decoupled heads, and enhanced regularization techniques, rendering it more precise and dependable for a broader spectrum of detecting applications.
where η is the learning rate and λ is the weight decay coefficient.
YOLOV8 Segmentations
The YOL0V8 instance segmentation incorporates a segmentation head to enhance YOLOV8’s core object detection capabilities, facilitating precise object mask identification. The Input, Backbone utilizing Concatenated Convolutional Feature Fusion (C2F) modules, and Neck are identical to those in the detection form. The Head has been augmented to accommodate both detection and segmentation tasks, and is further subdivided into three branches: one for bounding box regression, one for classification, and one for mask prediction. The mask branch typically employs a lightweight decoder and dynamic mask heads to generate binary masks for each item. In instance segmentation, the overall loss function is identical to Eqs. (5) and (6); it comprises the aggregate of the detection and mask segmentation losses. The optimization process mirrors that of detection, with weight adjustments often executed via the Adam optimizer for enhancement, as illustrated in Eq. (8). In contrast to object detection, the segmentation variation maintains the same foundational efficiency and design principles while incorporating a specialized mask prediction head. This results in an augmented computing burden, although it enhances visual understanding by providing both localization (bounding boxes) and form (masks). Despite its complexity, YOLOV8 instance segmentation operates in real time and is suitable for applications requiring exceptional spatial precision [32].
YOLOV11 Detection
The YOLO family has had multiple advancements culminating in YOLOv11, incorporating diverse architectural improvements pertaining to feature extraction, multi-scale reflection, and real-time inference capabilities. The complete design of YOLOv11 is depicted in Table 3, alongside YOLOv5 and YOLOv8 for comparative analysis. YOLOV11 presents an enhanced object detection system that emphasizes precision, velocity, and adaptability [33,34]. The model is constructed using an encoder-decoder architecture. The encoder (backbone) extracts features, whereas the decoder (head) generates predictions. The backbone features a Cross Stage Partial module with 3 × 3 Convolutions (k) × 2 layers (C3K2), an enhanced variant of CSP blocks that optimizes gradient flow and diminishes the parameter count. It utilizes C2F blocks and Spatial Pyramid Pooling—Fast (SPPF) to effectively integrate contextual data from various sizes. FPN and PANet methodologies facilitate feature amalgamation, hence enhancing robust multi-scale predictions. The detection head provides bounding boxes, objectness scores, and class probabilities. YOLOV11’s loss function comprises multiple components to enhance localization, objectness, and classification. Eq. (1) illustrates the overall loss Ltotal. Lbox Localization loss, generally employing CIoU loss as delineated in Eq. (9). In this context, ρ represents the Euclidean distance between the centers of the boxes, c denotes the diagonal length of the smallest enclosing box, and α signifies the penalty terms associated with the aspect ratio. The often employed optimizer is SGD, as delineated in Eq. (4).
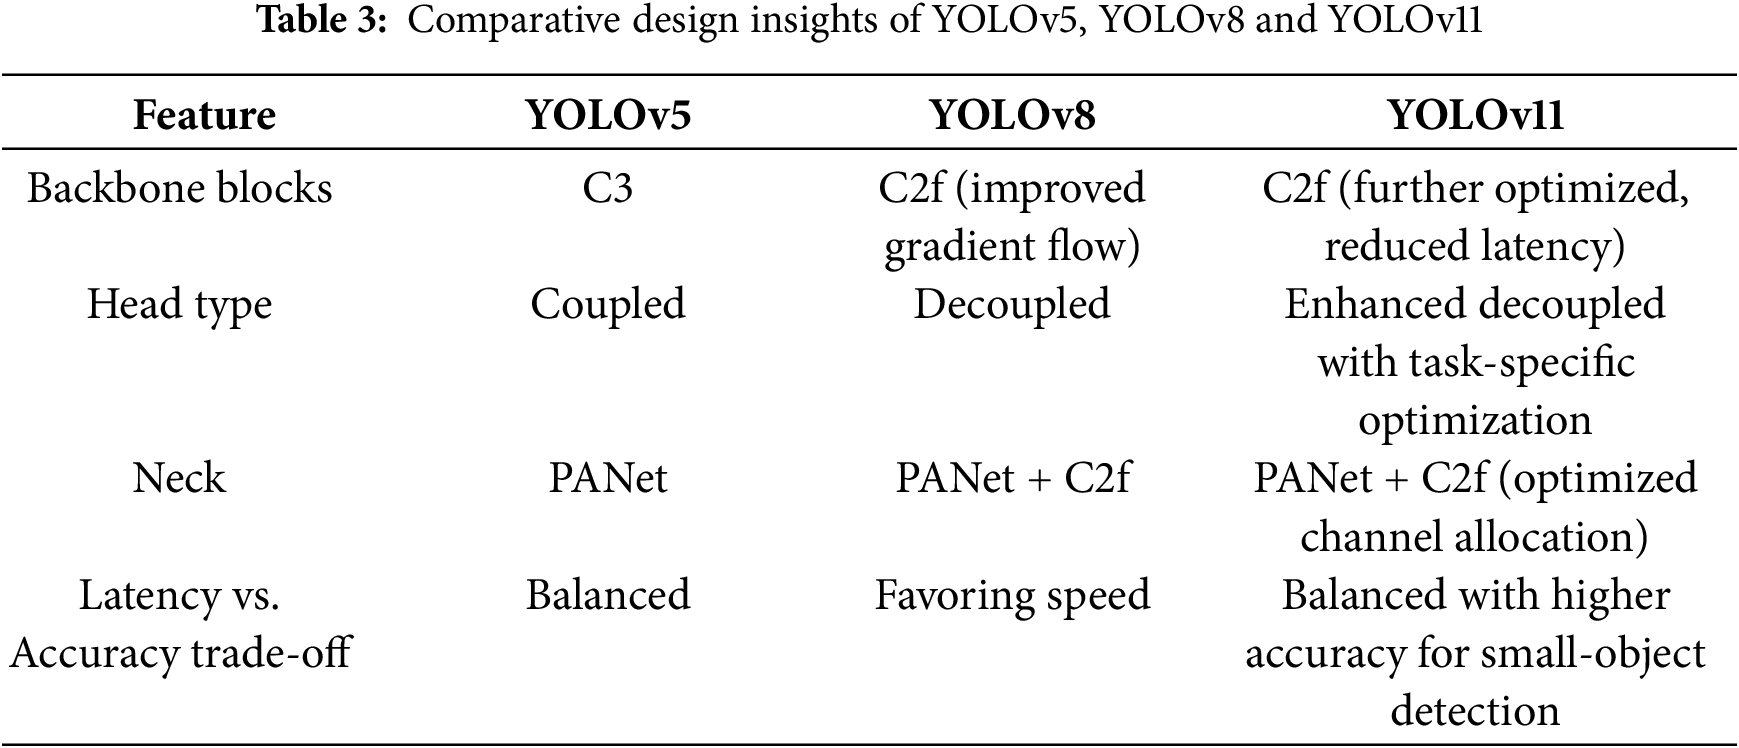
The improved version of the C3 module (YOLOv5) and the prior C2f in YOLOv8 seek to optimize gradient flow and promote feature reutilization. The C2f module improves training efficiency for small-scale spatial details by integrating supplementary shortcut connections and partitioning the feature map into smaller, manageable parts, which is essential for identifying small and partially occluded instruments. SPPF (Spatial Pyramid Pooling Fast) can be preserved and enhanced to minimize latency, enabling the network to effectively capture multi-scale contextual information without significant inference time expenses. The Decoupled Head (K) delineates the classification and regression routes subsequent to the neck layer and independently optimizes three subordinate models: objectness, class-specific probability, and bounding box regression. This minimizes task overlap, which is advantageous when classes display analogous geometric variations. The neck of YOLOv11 incorporates the bottom-up path aggregation principle from PANet alongside C2f blocks, which improve the preservation of low-level information and promote the integration of high-level features from RGB-D inputs. Improvements in YOLOV11 provide superior convergence and generalization, establishing it as an effective model for real-time object detection.
YOLOV11 Segmentation
YOLOv11 introduces a segmentation mode that is both versatile and extends beyond conventional object detection [35]. This mode predicts bounding boxes and class probabilities while simultaneously producing pixel-level masks for each identified object. This mode employs the identical encoder-decoder architecture as detection, but incorporates an additional segmentation head beside the detection head. The segmentation head typically comprises a lightweight up-sampling decoder and convolutional layers that generate binary or multiclass masks aligned with bounding boxes. The architecture effectively distributes computations across the detection and segmentation branches, maintaining real-time performance. Eq. (10) shows that the segmentation loss is frequently made up of binary cross-entropy and Dice loss. Where LDice = 1 − (2 ∗ |P ∩ G|)/(|P| + |G|), with P and G representing predicted and ground truth masks, respectively.
Unlike detection mode, which produces imprecise rectangular outputs, segmentation mode yields accurate object contours, crucial for applications such as autonomous driving, medical imaging, and image analysis. Segmentation requires increased memory and processing capacity; nevertheless, its architecture is optimized to minimize inference time. YOLOV11 facilitates the transition between detection and segmentation tasks using multi-task training and shared weights in its model architecture. Segmentation generally provides greater depth and utility when shape and spatial context are significant. Detection mode remains superior for applications requiring efficiency and speed.
Faster R-CNN
The Faster R-CNN architecture consists of four main components: object detection, region proposal, RoI pooling, and feature extraction [36,37]. The input image is initially processed through a deep convolutional neural network, often VGG-16 or ResNet, to generate a feature map. Subsequently, a Region Proposal Network (RPN) utilizes sliding windows to propose regions that may harbor items. Each proposal has an “objectness” score indicating the likelihood of including an object. The designated regions are reallocated onto the feature map and conveyed by RoI Pooling, which standardizes the features of each zone to a uniform size. Classification is accomplished by transmitting these fixed-size feature maps over completely connected layers. The loss function of Faster R-CNN encompasses both classification and regression objectives; Eq. (11) delineates the overall loss L for the Region Proposal Network (RPN) and the detection head.
pi is the anticipated chance that anchor is an object, pi* is the ground-truth label (1 if positive, 0 if otherwise) and ti and ti* are the predicted and ground-truth bounding box coordinates, respectively. Lcls is the log loss for each class, and Lreg is the smooth L1 loss that is shown in Eqs. (12) and (13).
SGD minimizes the loss by adjusting the weights to get the lowest feasible total loss across batches. Employing SGD with momentum accelerates the algorithm’s convergence to the optimal solution while mitigating the risk of entrapment in local minima. Faster R-CNN achieves great accuracy in object detection at a satisfactory speed due to its design and training methodology.
Mask R-CNN
Mask R-CNN is an enhanced iteration of Faster R-CNN capable of performing both object detection and instance segmentation [38]. The third branch of Mask R-CNN is introduced to predict a pixel-wise segmentation mask for each detected instance, while Faster R-CNN constructs bounding boxes and class labels for detected objects. The architecture of Mask R-CNN closely follows that of Faster R-CNN [39]. The input image is first processed by a feature extraction network to create feature maps, which are subsequently input into a Region Proposal Network (RPN) to generate item proposals. Object suggestions are subsequently refined using RoI Align, an improvement over RoI Pooling that rectifies quantization mistakes, and are then allocated into three simultaneous branches: classification, bounding box regression, and mask prediction. The mask prediction branch, a Fully Convolutional Network (FCN), delineates the object’s shape within the bounding box by producing a fixed-size binary mask for each Region of Interest (RoI). Eq. (14) illustrates that the loss function of Mask R-CNN comprises three components. Mask R-CNN performs an additional duty of instance segmentation compared to Faster R-CNN, without significantly diminishing accuracy or performance. It is highly beneficial in domains like as medical imaging, autonomous vehicles, and picture manipulation that require distinct object boundaries.
To more precisely assess the model’s performance, the tools in the dataset were classified into three categories: small, medium, and large, according to their physical dimensions and configurations. Compact implements such as adapters, Allen keys, and universal joints are challenging to identify due to their restricted surface area and propensity to be obscured or blended with the background, especially within a cluttered toolbox. Medium tools, such as Bit Sockets, Sockets, and Deep Sockets, are easier to identify due to their uniform shapes and distinct edges. Nonetheless, their cylindrical shapes and optical resemblances may lead to sporadic misdiagnosis. Extended tools, including Bit Holders, Extension Bars, Flex Handles, Ratchet Handles, S Handles, Spanners, and Long Bit Sockets, are more conspicuous owing to their dimensions. However, they are more vulnerable to occlusion and truncation, which can affect the quality of segmentation. This classification enables a comprehensive assessment of model effectiveness across various tool types. Table 4 presents the Precision, Recall, F1-Score, and Accuracy for both detection and segmentation models. To provide an equitable and unbiased comparison of the models, all were trained and assessed on the identical dataset partition, with 70% designated for training, 20% for validation, and the final 10% for testing. Moreover, all training protocols utilized the same data augmentation methods. The model settings were standardized: an initial learning rate of 0.001, a batch size of 16, the SGD optimizer with a momentum of 0.937, and training conducted for 300 epochs. All investigations were performed on a standardized hardware platform consisting of an NVIDIA RTX 4090 GPU (12 GB VRAM), Intel Core i9-13900K CPU, and 64 GB of RAM to ensure uniform processing conditions. Inference speed measurements (FPS) were performed utilizing a uniform input resolution (640 × 640) and standardized preparation protocols, guaranteeing an unbiased assessment of runtime performance.
In the performance evaluation of DL models on tiny tools, YOLOV11 consistently surpassed other models in both detection and segmentation across all three components. YOLOV11 exhibited the highest detection accuracy (98.2%) and recall (92%) for the Universal Joint. It achieved the highest segmentation precision (96.5) and mAP50 (99.7%), surpassing YOLOV8 and YOLOV5, but Mask R-CNN lagged significantly. YOLOV8 (92.7%) excelled at spotting the Adapter, whereas YOLOV11 had superior performance in both precision (85.6%) and recall (85.4%). It exhibited superior segmentation, achieving a precision of 95.2% and a mAP50 of 94.3%, indicating enhanced instance mask quality compared to other models. Despite the limited instances of the Allen Key, YOLOV11 excelled in both detection (precision: 90.33%, recall: 100%) and segmentation (precision: 93%, mAP50: 88.6%), whereas Mask R-CNN was unable to identify it. Segmentation models, particularly YOLOV11, outperformed detection models across all three tools due to their ability to capture intricate spatial details crucial for small or partially obscured objects. Consequently, while detection establishes presence and position, segmentation, especially YOLOV11, enhances accuracy in boundary delineation, making it the superior technique for examining small tools in complex industrial environments.
The assessment of medium-sized tools reveals that YOLOV11 consistently outperforms in both detection and segmentation (refer to Supplementary S1: Fig. S5 for the confusion matrix of YOLOV11, Fig. S9 for the precision, recall, accuracy, and loss graphs of YOLOV11, and Fig. S13 for the corresponding graphs of YOLOV11). YOLOV11 exhibited the highest detection accuracy (99.8%) and recall (92.3%) for Bit Sockets (refer to Supplementary S1: Fig. S6 for the Precision, Recall, Accuracy, and Loss graphs of YOLOV11, Table S3 for the classification report of YOLOV11, and Table S7 for the classification report of YOLOV11). It achieved superior mask precision (99%), recall (95.5%), and mAP50 (97.4%) for segmentation, surpassing YOLOV8 and YOLOV5. Faster R-CNN had somewhat inferior detection performance (precision: 96%, recall: 87%), but Mask R-CNN performed sub optimally in segmentation tasks. The detection outcomes for Sockets were comparable for YOLOV11 (precision: 95.8%, recall: 90.5%). Nonetheless, YOLOV11 demonstrated superior segmentation capabilities, with a precision of 97.6% and a mAP50 of 96.7%. This enhanced the clarity of object boundaries and facilitated the differentiation of instances, particularly in congested scenarios. YOLOV11 outperformed YOLOv8 and YOLOv5 in segmenting Deep Sockets, achieving a precision of 97%, a recall of 96%, and an mAP50 of 96%. Refer to Supplementary S1: Fig. S1 for the confusion matrix of YOLOv5, Fig. S2 for the precision, recall, accuracy, and loss graphs, Table S1 for the classification report of YOLOv5, Fig. S4 for the precision, recall, and accuracy loss graphs, Fig. S8 for the confusion matrix of YOLOv5, and Table S5 for the classification report of YOLOv5. Nonetheless, its detection performance (precision: 91.4%, recall: 80.8%) was comparable to YOLOV8 and somewhat superior to that of YOLOV5. It is noteworthy that segmentation accuracy significantly surpassed detection for Deep Sockets across all models. This indicates that segmentation is more dependable in the presence of barriers and varying illumination conditions. All YOLO models performed adequately with medium tools; however, YOLOV11 regularly outperformed the others, particularly in segmentation tasks. This illustrates the significance of pixel-level accuracy in managing tools that overlap, reflect, and undergo shape alterations in actual assembly line environments.
The assessment of elongated tools indicates that YOLOV11 consistently surpassed other models in both detection and segmentation capabilities. This type delivers the most precise and dependable outcomes for intricate, elongated instruments. YOLOV11 exhibited outstanding segmentation efficacy (mask precision: 98.4%, recall: 100%) and flawless detection precision (100%) for Bit Holders. Conversely, YOLOV5 encountered considerable challenges in detection, achieving a recall of merely 12.5%. While all models effectively identified extension bars, YOLOV11 exhibited the superior detection (Precision: 95%, Recall: 93.4%) and segmentation metrics (mask mAP50: 97.5%), ensuring the exact delineation of all borders. Flex Handles performed optimally with YOLOV11, exhibiting impeccable segmentation accuracy and a recall rate of 99.7%. Yolov8 exhibited superior detection performance (Precision: 80.5%, Recall: 84.6%). In the category of Ratchet Handles, YOLOV11 excelled, achieving impressive metrics for recognition (Precision: 93.3%, Recall: 89.9%) and segmentation (Precision: 99.4%, Recall: 97.8%), even with tools that exhibited curvature or textural variations. S handles were difficult to locate, although Yolov8 exhibited the highest recall rate of 100%. YOLOV11, conversely, achieved superior segmentation results (mask precision: 97.1%, recall: 94.6%), indicating its enhanced capability in delineating intricate shapes. Long Bit Sockets were optimally managed by YOLOV11, exhibiting high detection precision (96.6%), recall (96.4%), and segmentation quality (mask precision: 97.4%, recall: 94.7%), but YOLOV5 had markedly worse segmentation performance. Ultimately, all models accurately identified spanners, despite their limited quantity. However, YOLOV11 exhibited superior segmentation depth and boundary accuracy. Segmentation, particularly with YOLOV11, frequently outperformed detection for spatial accuracy, robustness under partial occlusion, and classification confidence across all elongated tools. The identification of toolkits has three principal challenges: (1) Intra-class similarity is high; most tools have similar forms. The Decoupled head improves YOLOv11’s efficacy in situations necessitating classification distinction; (2) The C2f module, when utilized for partially obscured small objects, leads to a degradation of detail and gradient transmission, thereby augmenting the ability to detect additional sockets concealed by other instruments; (3) Multi-scale detection in restricted settings—The optimal PAN-FPN neck capitalizes on low-level spatial data and amalgamates semantic information to accurately delineate insect contours during instance segmentation.
The detailed architectural benefits clarify why YOLOv11 demonstrates enhanced performance in both detection and segmentation of our RGB-D industrial inspection dataset. The YOLOV11 based application was augmented to enable real-time socket dimension measuring using edge detection, in addition to detection and segmentation. This feature uses segmentation masks to isolate each socket and subsequently utilizes calibrated edge-based analysis to determine sizes in millimeters. The results were largely congruent with manual measurements, exhibiting a measurement accuracy of approximately ±0.2 mm. During real-time testing on the manufacturing line, socket diameters of 21.0, 24.0, and 26.0 mm were accurately measured. Fig. 3 illustrates the interface of the deployed application, which concurrently does socket recognition, segmentation, and accurate diameter calculation on live video feeds. In conclusion, YOLOV11 consistently surpassed all other models across all categories small, medium, and large regardless of its application in object detection or image segmentation, despite minor fluctuations in performance based on tool size. Fig. 4 illustrates a live demonstration of the vision-driven toolkit inspector application. Owing to its intricate architectural design and formidable feature extraction skills, YOLOV11 exhibited exceptional performance across various visual circumstances and tool categories, solidifying its status as the most dependable option for contemporary production environments. Figs. 5 and 6 illustrate the outcomes of all segmentation and detection methods. (Refer Figs. S15 and S16 for more images of detection and segmentation)
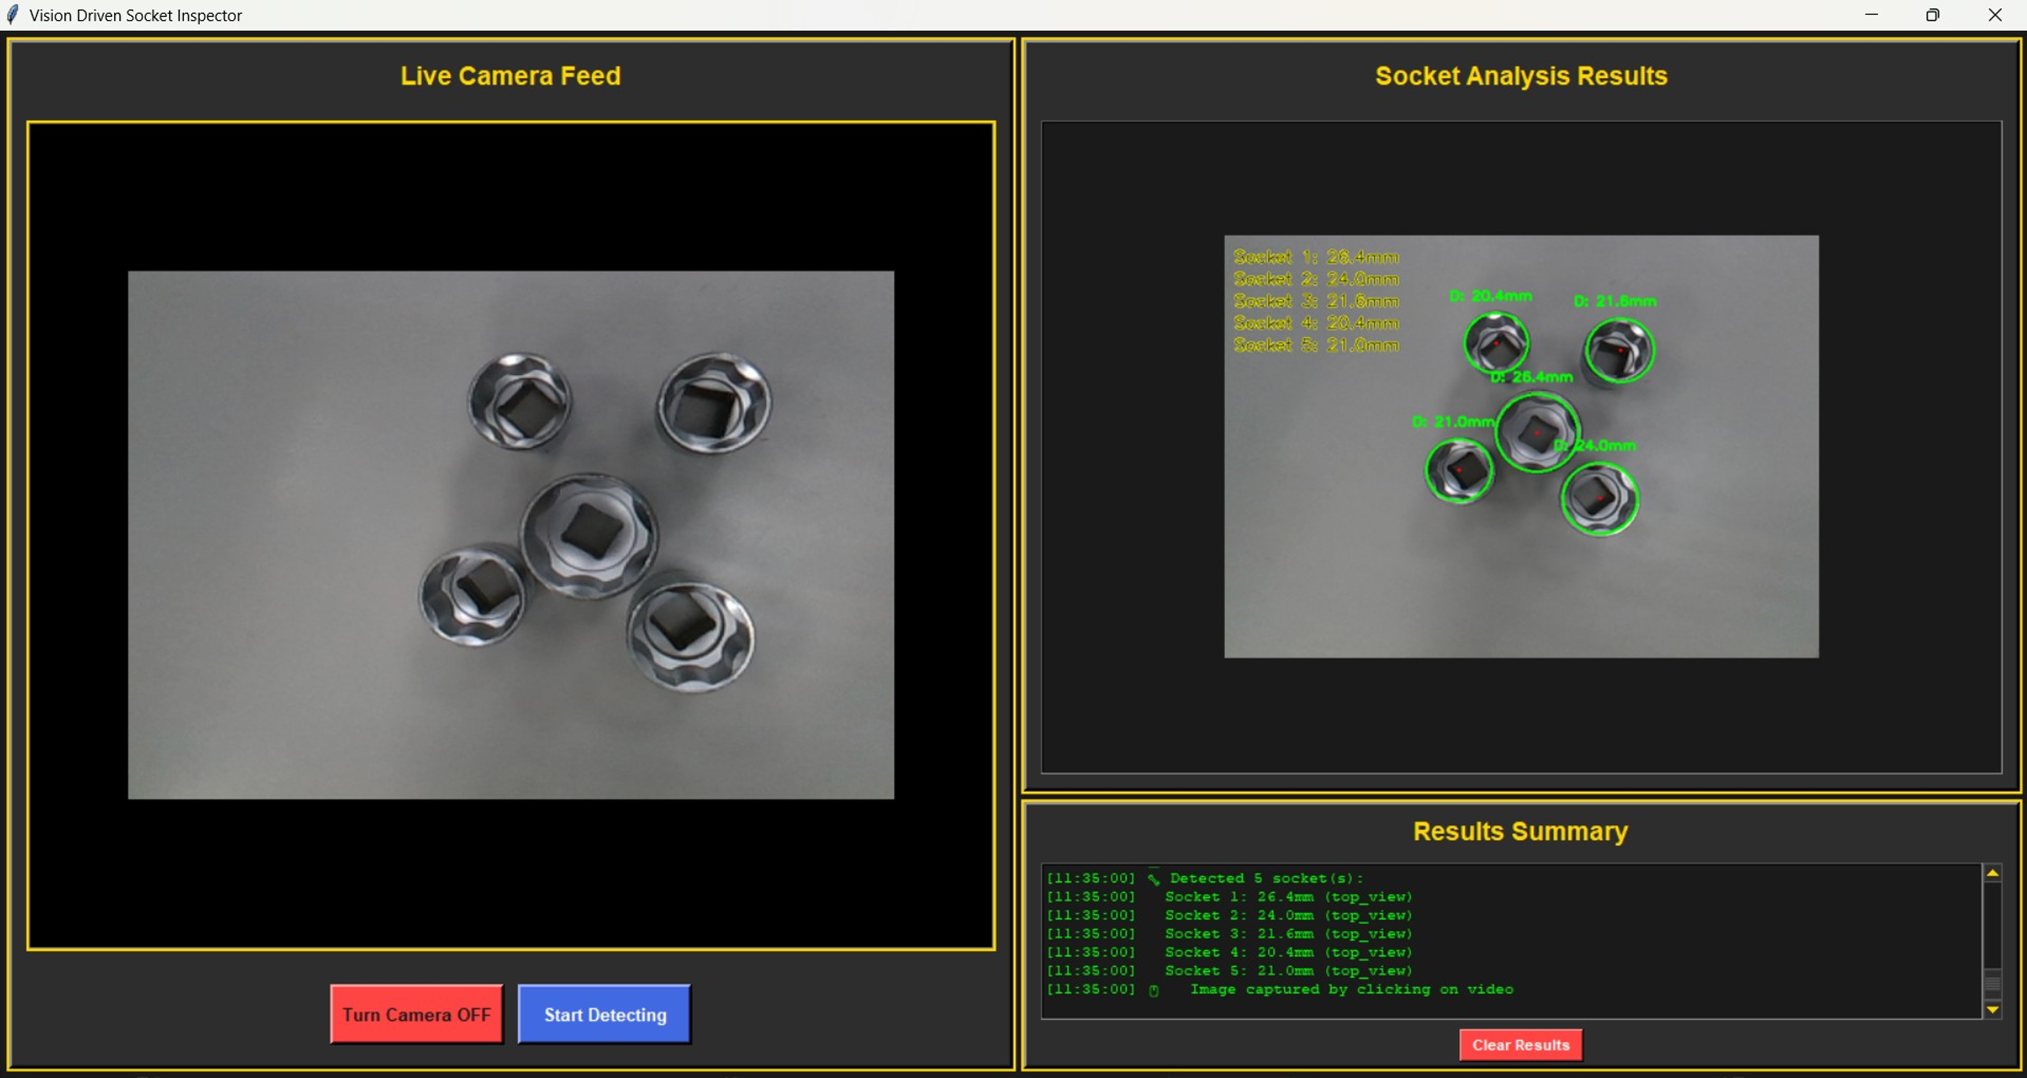
Figure 3: The Windows-based Vision Toolkit Inspector application interface. The left panel shows live RGB-D input with socket detection and segmentation using YOLOv11, while the right panel displays real-time diameter measurements of selected sockets using edge detection. The system enables precise specification validation during assembly line operations
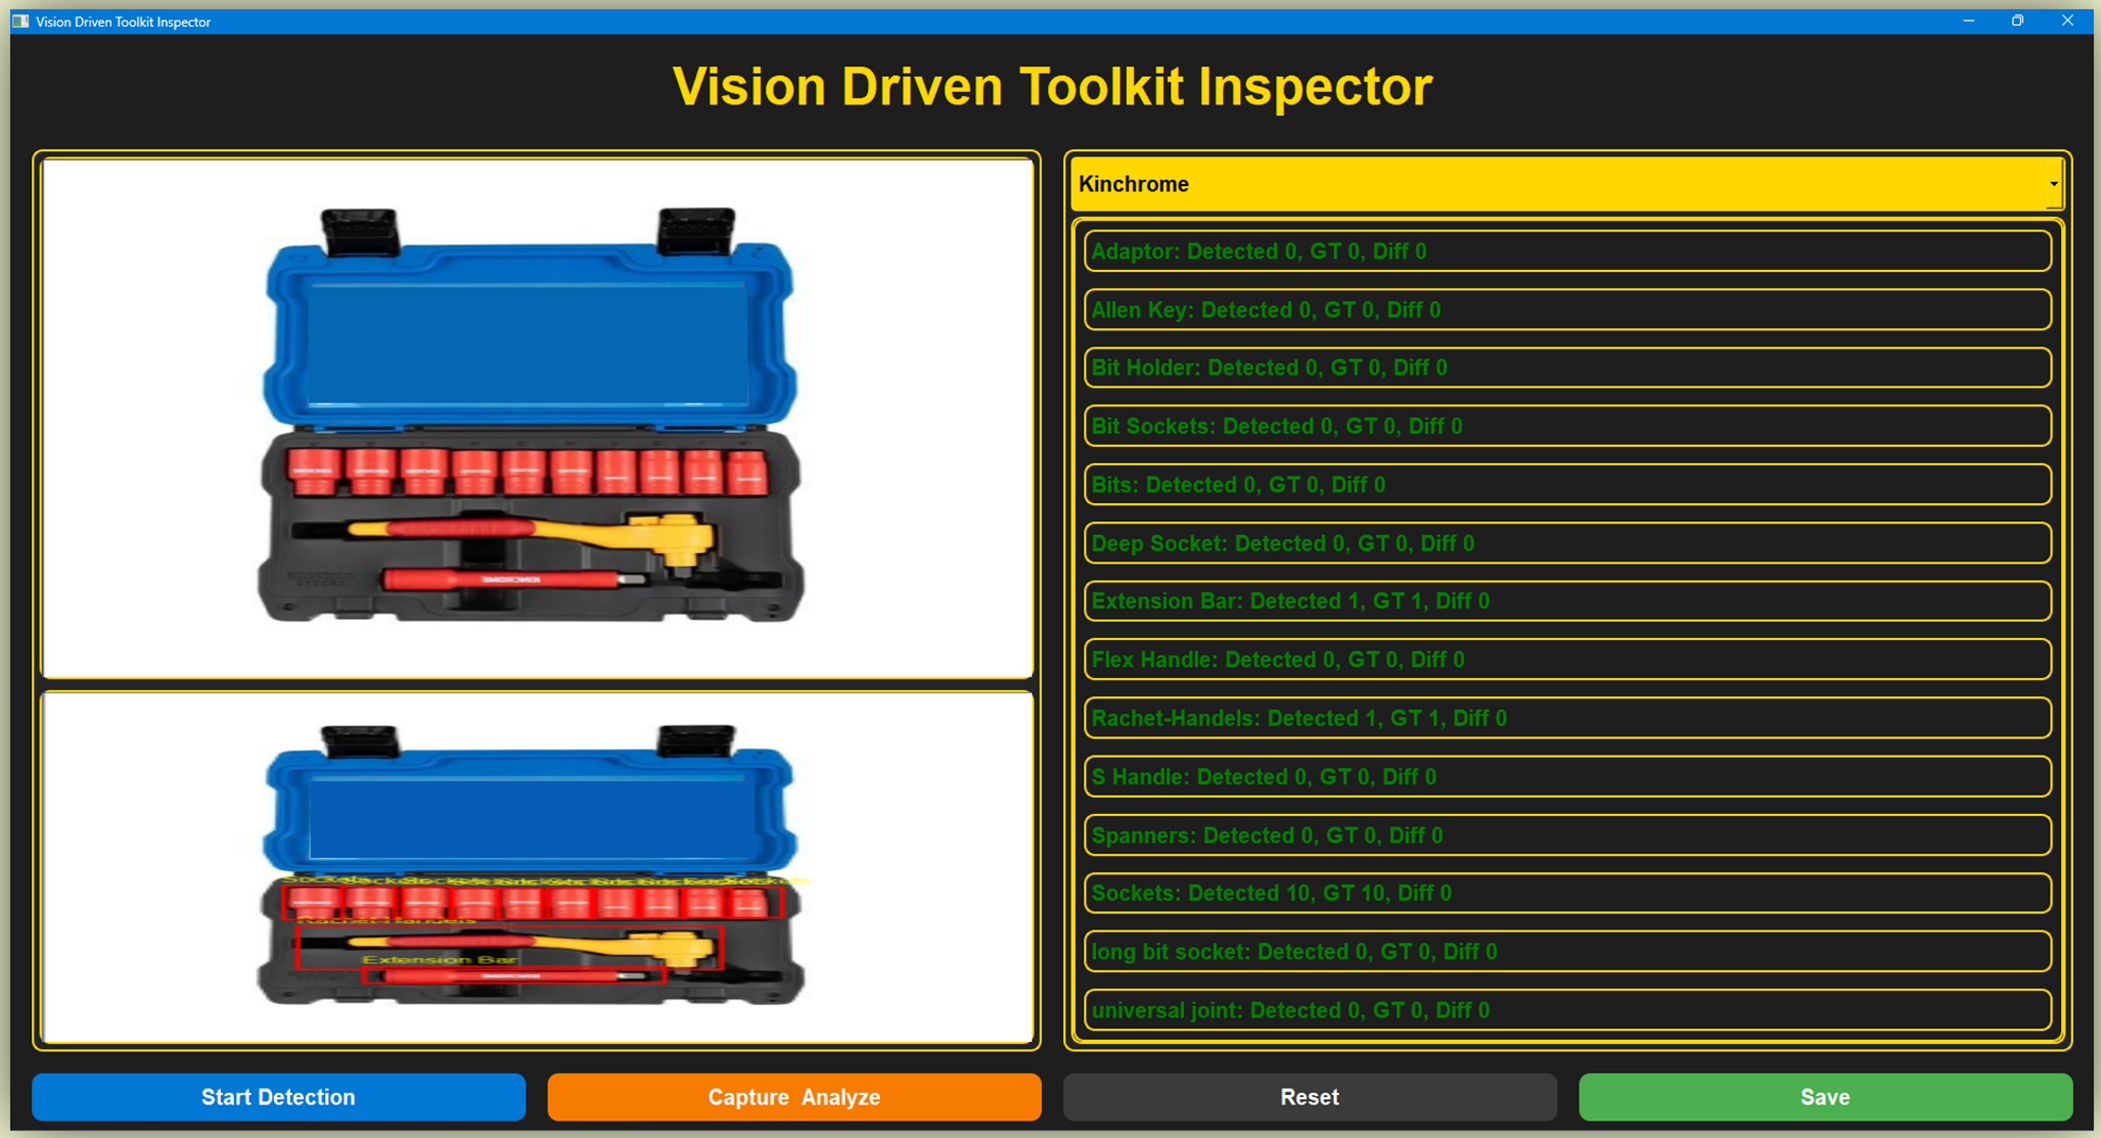
Figure 4: The Vision Driven Toolkit Inspector uses a live video stream to inspect toolkits. When “Capture Analyze” is clicked, it captures the current frame, detects the tools (like sockets), and displays the results, highlighting any missing or extra items
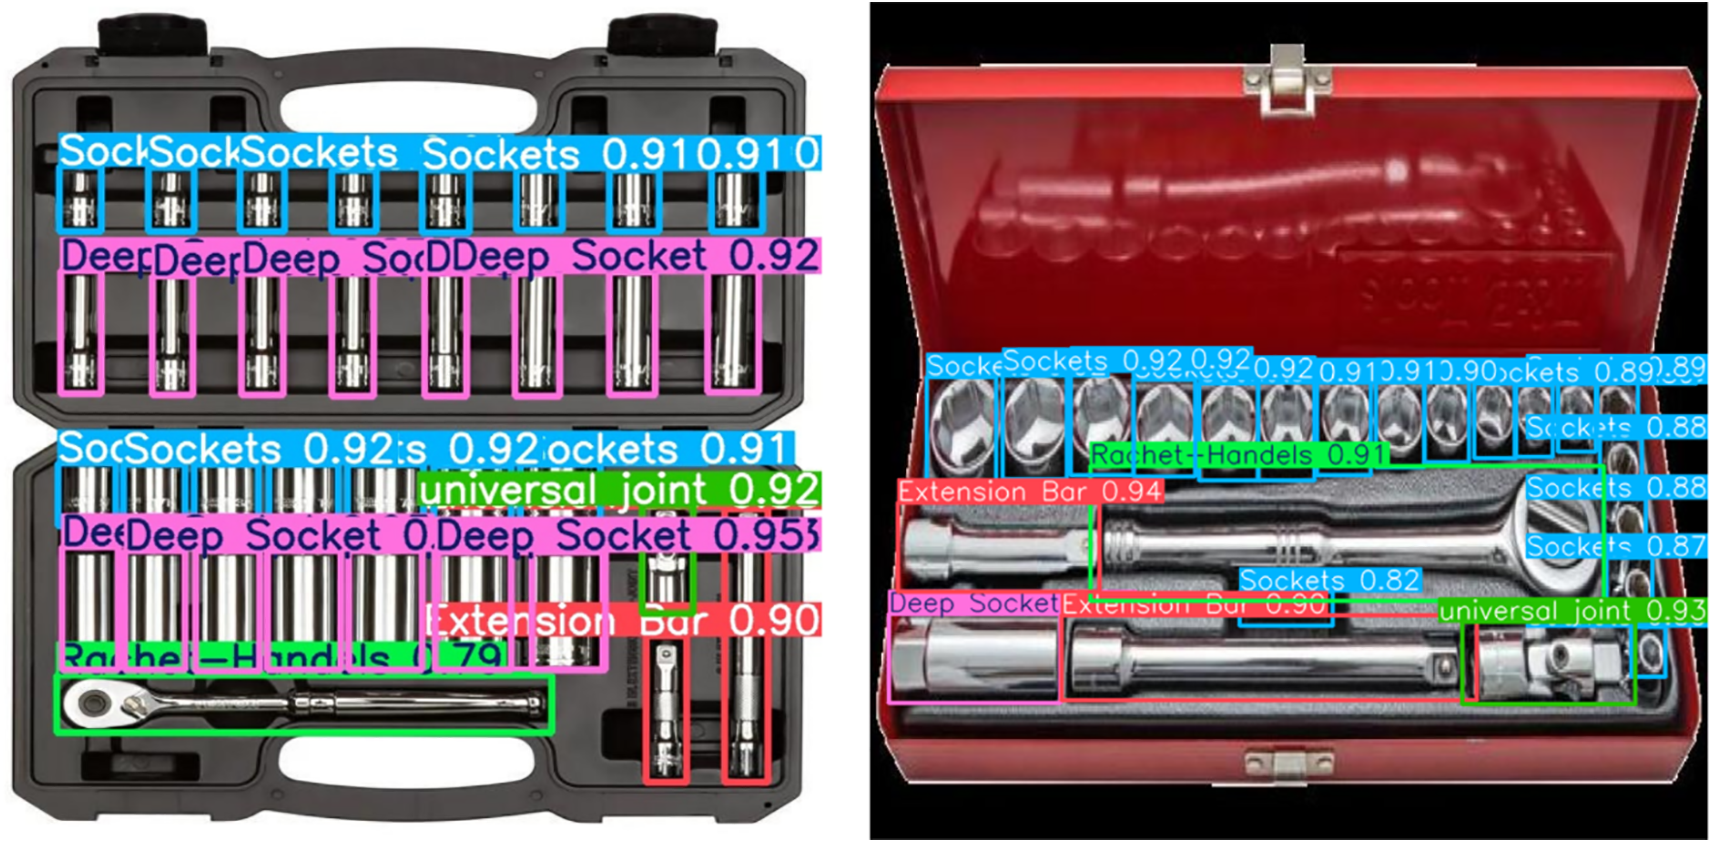
Figure 5: Comparison of the results of object detection on two distinct toolkit configurations, showing their class and confidence level. The left picture displays detections with high precision in a plastic casing, while the right picture shows detections with different levels of confidence in a metal case. Both pictures show important equipment like sockets, extension bars, Ratchet handles, and universal joints (see Supplementary S1: Fig. S15 for Detection Results)
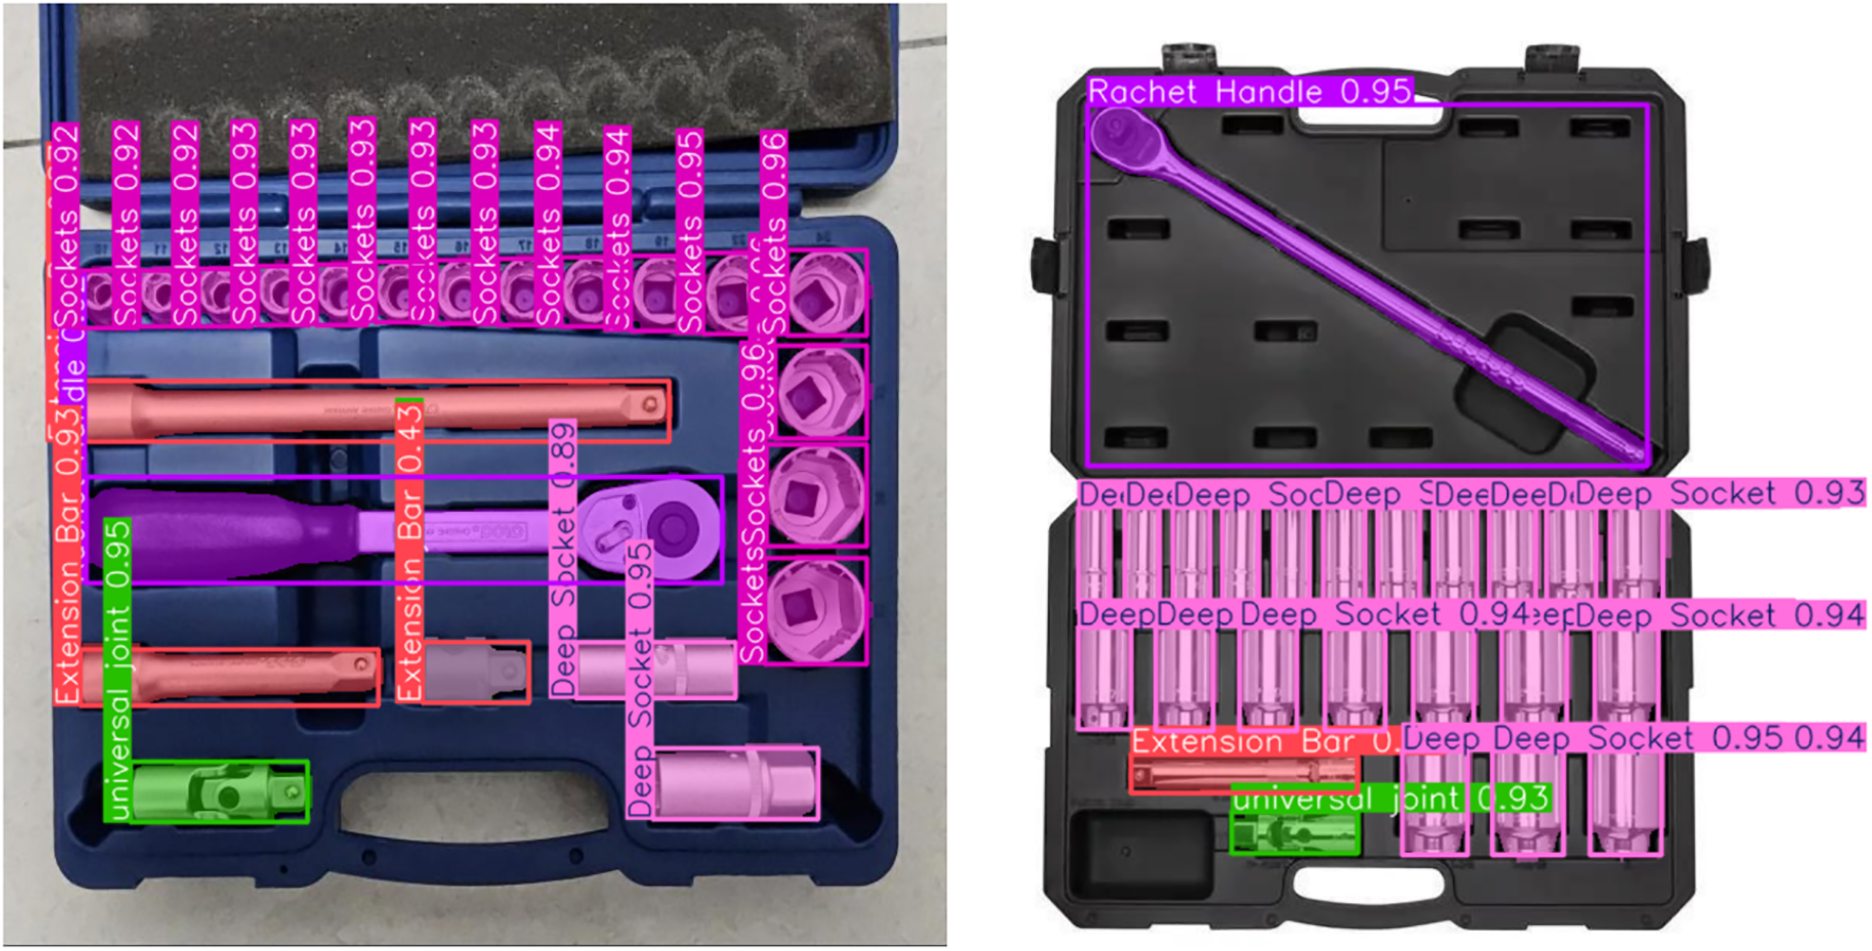
Figure 6: A visual comparison of the outcomes of image segmentation using deep learning models on toolkit images. Tools are classified and labelled like sockets, deep sockets, extension bars, Ratchet handles, and universal joints with their respective confidence scores (see Supplementary S1: Fig. S16 for the segmentation Results)
YOLOv11 exhibited enhanced accuracy in detection and segmentation relative to other models, a result of particular architectural and computational attributes. YOLOv11 utilizes an enhanced C2f backbone network that demonstrates reduced parameter redundancy relative to YOLOv5 and YOLOv8, hence enhancing feature reuse and lowering computational expenses. This trade-off enables the model to capture complex details without falling prey to overfitting on extraneous features. YOLOv11 utilizes a decoupled head with an improved architecture, enabling the independent training of classification and regression, hence enhancing convergence and stability among visually analogous classes. This architectural enhancement improves the localization of small objects in relation to YOLOv8. YOLOv11 demonstrates a rapid inference speed of approximately 40 FPS, but possessing an equal or marginally greater number of parameters than YOLOv8, due to its efficient use of convolutional blocks and a streamlined neck architecture (see Supplementary S1: Table S2 for the classification Report of YOLOV8, Fig. S10 for the confusion Matrix of YOLOV8; Fig. S11 for the Precision, Recall, Accuracy and loss Graphs of YOLOV8 and Table S6 for the classification Report of YOLOV8). The relatively lower FPS of Faster R-CNN and Mask R-CNN is due to their reliance on a two-stage detection pipeline, which improves accuracy in specific instances but is inadequate for high-throughput real-time inspection tasks (see Supplementary S1: Fig. S7 for the confusion Matrix of Faster R-CNN, Table S4 for the classification Report of Faster R-CNN, Fig. S14 for the confusion Matrix of Mask R-CNN and Table S8 for the classification Report of Mask R-CNN). The quantitative and structural analysis supports the conclusion that the accuracy-latency trade-off of YOLOv11 is significantly beneficial, making it the ideal selection for the proposed application of industrial toolbox inspection.
The developed Windows application was deployed and evaluated on a normal office desktop computer lacking a specialist GPU to confirm its suitability for cost-sensitive industrial settings. This system features an Intel Core i5-10400F processor, integrated Intel UHD 630 graphics, 16 GB of DDR4 RAM, a 512 GB SATA SSD, and runs on Windows 10 Pro (64-bit). The application exhibited a stable performance of approximately 40 FPS throughout laboratory testing under sole CPU operation, with an average latency from image capture to detection output of about 58 ms. The findings demonstrate that the system may deliver real-time inference without requiring high-performance GPUs, indicating its potential for wider industrial applications. The technology is presently functional at REDAI Precision Tools in Taichung, Taiwan, as it is seamlessly incorporated into an active production line. In an industrial environment, it can manage streaming synchronous pairs of RGB-D cameras at 30 frames per second per stream, enabling real-time recognition and instance segmentation while documenting discovered instances and producing operator interface overlays. In these practical conditions of data logging across a network, synchronization of many devices, and further needs from the operator interface, the average frames per second (FPS) was maintained at 38.6, with an average latency of 74 ms. The accuracy closely aligned with laboratory performance, exhibiting detection mAP values of 92.7 and 93.2, and segmentation values of 96.1 and 96.9. These findings validate the application’s effectiveness in production settings under real-world restrictions, sustaining both speed and precision while fulfilling user demands for ongoing and real-time industrial inspection. In future projects, we plan to explore advanced RGB-D data fusion techniques to enhance the tool detection system. We plan to investigate multi-stream networks, early and late fusion techniques, and feature-level integration of RGB and depth data. These methods will allow us to leverage the synergistic attributes of color and depth data, particularly in complex and cluttered toolkits. Additionally, we want to implement domain-specific improvements, including customized loss functions and attention mechanisms tailored for the tool identification job, which may augment model performance, particularly in challenging scenarios like occlusions, reflections, or overlapping tools. These advancements will augment the resilience and accuracy of the toolkit inspection system, advancing the application of deep learning in industrial automation.
During the evaluation process, numerous failure occurrences were uncovered that highlight the system’s limitations. In cases of occluded tools, where one tool is partially hidden by another, the model often fails to recognize the occluded tool or mistakenly categorizes it as part of the foreground. This may occur when the tool’s edges are not fully recognizable, resulting in the segmentation model struggling to differentiate the tool from background noise. Additionally, specular reflections from metallic objects, such as chrome handles or polished sockets, create highlights that interfere with edge recognition, leading to incomplete or inaccurate segmentation masks. Misclassifications often occur when tools with similar forms or finishes are grouped together, as the model may confuse them due to insufficient training data on these subtle distinctions. Future research on occlusion detection will emphasize improving dataset diversity by including more complex scenarios with varied tool settings and complicated occlusions. We plan to implement advanced RGB-D data fusion techniques to improve occlusion management by leveraging depth information to infer hidden elements of tools. To mitigate specular reflections, we plan to exploit reflection-invariant features or implement specialized image preprocessing approaches that reduce glare and enhance tool delineation. To rectify misclassifications due to slight form variations, employ attention mechanisms to improve differentiation between similar tool types, alongside data augmentation approaches like CutMix or MixUp to produce a broader array of training examples. These enhancements will improve the system’s durability and accuracy in practical industrial environments.
The system features a real-time dimensional measurement module to enhance inspection accuracy and address issues such as visual resemblance, occlusion, and tool overlap. The software accurately estimates socket sizes (±0.2 mm) by integrating YOLOV11-based segmentation with edge detection and depth-calibrated scaling. This enables you to locate the tools and verify their conformity to the precise physical standards for assembly. This capacity is highly beneficial in sectors such as automotive and aircraft, where minor dimensional discrepancies can lead to assembly or safety issues. It is now feasible to distinguish between sockets that appear identical yet vary significantly in size (for instance, 21.0 vs. 24.0 mm). This enhances the efficiency, automation, and reliability of quality control. This enhancement reduces the system’s dependence on human measuring instruments, hence increasing its utility in complex and dynamic industrial environments.
The development of an automated vision-based inspection system signifies a substantial advancement in facilitating dependable and intelligent inspection inside industrial settings, in accordance with Industry 4.0 goals [40]. However, its current use is limited by various limitations, with one primary issue being the dataset’s insufficient size and lack of diversity. Despite the application of data augmentation techniques that expanded the dataset from 500 to 3000 photos, this fivefold increase is inadequate to adequately represent the intrinsic diversity found in actual assembly situations. The tool classes are restricted to 14 types, constraining the system’s capacity for generalization. The current model may misclassify various variants with nuanced differences in shape, size, and finish seen in real-world toolkits due to insufficient exposure. Moreover, the majority of the training data was collected under regulated lighting conditions with standardized toolbox arrangements, indicating a lack of environmental variability in the dataset [41]. In actual industrial environments, the illumination fluctuates, and the tools are frequently misaligned. Consequently, this complicates the model’s ability to manage unusual or intricate scenarios, thereby constraining its current applicability.
A key challenge is identifying tools that are dispersed, overlapping, or unevenly oriented within the toolkit. In specific circumstances, the system struggles to detect the edges of tools, particularly those that are diminutive or partially obscured by other implements [42]. The issue is exacerbated by reflective metallic tools, including sockets, chrome handles, and polished adaptors, which produce specular highlights that hinder edge detection and confound segmentation algorithms. These reflections persist even with the use of anti-reflective coatings, potentially impacting the efficacy of deep learning models. Furthermore, when numerous reflecting tools are in proximity or stacked, the segmentation masks frequently merge, complicating the correct counting or grouping of the tools [43]. In cluttered situations, detection effectiveness significantly diminishes due to occlusions, glare, and insufficient contrast, all of which add to prediction uncertainty. These limitations underscore the need for more flexible and resilient detection systems capable of handling a broader spectrum of physical and sensory situations.
Future modifications can be contemplated to augment the system’s performance and adaptability [44]. A promising method involves incorporating dimensional verification capabilities by leveraging the depth information provided by Intel RealSense cameras. The methodology could be extended to quantify the exact physical dimensions of each tool, encompassing its length, diameter, and profile, via the utilization of calibrated depth mapping or 3D point cloud reconstruction techniques. This would enable the accurate identification of absent or mismatched components. Furthermore, this would facilitate specification-level validation, which is crucial in a high-precision manufacturing setting [45]. Moreover, subsequent research may focus on creating tailored deep learning models specifically for the dataset, employing hyperparameter optimization and model-specific enhancements such as attention mechanisms or deformable convolutions. Integrating multiple detection models into an ensemble can enhance accuracy by using the strengths of each network [46]. The dataset can be enhanced by acquiring empirical data from several industrial environments and producing synthetic data through domain-randomized 3D rendering. To facilitate scalability, the system can be optimized for deployment on edge computing devices, employing low-latency processing and federated learning to enable continuous model enhancement while preserving data confidentiality. With these advancements, the vision-based inspection framework can evolve into a comprehensive, robust, and intelligent system capable of real-time accuracy verification of tools across diverse industrial environments. Currently, only Zendehdel et al. (2023) have investigated real-time toolkit recognition in an industrial setting; however, their approach detects each tool sequentially, one at a time, relying solely on a single YOLOv5 detection model [47]. In contrast, our solution simultaneously detects all tools within a toolkit “in a box”, evaluates multiple state-of-the-art models for object detection and instance segmentation, and integrates the highest-performing model into a fully functional Windows program for real-time assembly-line inspection. In future study, we aim to explore the utilization of RGB-D data for precise dimensional verification of tools, particularly for evaluating socket diameters and other essential tool dimensions. We plan to employ depth data from Intel RealSense cameras to execute 3D point cloud reconstruction techniques for the accurate measurement of the length, diameter, and profile of each tool in the toolkit. This would enable the system to identify and segment tools while simultaneously validating their physical requirements in real time, hence improving functionality for applications necessitating exact measurements, such as high-precision manufacturing settings. The application of RGB-D data for dimensional verification will substantially improve the current system, increasing its robustness and accuracy in real-world industrial settings.
This research introduces a robust, vision-based inspection system designed for application in practical industrial environments. The objective is to automate and enhance quality control in the assembly line in alignment with Industry 4.0 goals. The study assesses various deep learning models, including YOLOV5, YOLOv8, YOLOv11, Faster R-CNN, and Mask R-CNN, for object detection and instance segmentation, employing an RGB-D dual-camera setup and a thoroughly annotated dataset. To enable a thorough performance analysis, the tools were categorized into three classifications: small, medium, and lengthy. YOLOV11 consistently outperformed all other models, achieving a detection accuracy of 93.2% and a segmentation accuracy of 96.9%. This resulted from its efficient architecture and capacity to manage complex visual scenarios. The segmentation models, especially YOLOV11, demonstrated remarkable proficiency in differentiating overlapping and similarly shaped tools while accurately delineating object boundaries, making them extremely appropriate for meticulous visual inspection tasks. The system functioned effectively in a real-time environment, where it could swiftly and accurately identify removed or misplaced tools in live video feeds. This study introduces a scalable and intelligent methodology for automated toolkit verification in industrial settings by integrating precise model predictions with a practical deployment architecture. The findings indicate that contemporary deep learning techniques are effective for industrial inspection and establish a solid foundation for future innovations and broader applications in smart factories and automated assembly lines. The technology also facilitates real-time socket dimension measuring by edge detection, allowing for specification-level inspection with sub-millimetre precision. This further enhances its utility for quality-critical applications in automated manufacturing. Future endeavours will focus on enhancing and diversifying our RGB-D dataset through real-world data collection and synthetic 3D rendering, while integrating depth-based 3D reconstruction for precise dimensional validation. We will create customized architectures employing attention mechanisms and deformable convolutions, investigate ensemble detection-segmentation techniques, and improve models via pruning and quantization for robust, real-time edge deployment with on-device adaptability.
Acknowledgement: Not applicable.
Funding Statement: National Science and Technology Council, the Republic of China, under grants NSTC 113-2221-E-194-011-MY3 and Research Center on Artificial Intelligence and Sustainability, National Chung Cheng University under the research project grant titled “Generative Digital Twin System Design for Sustainable Smart City Development in Taiwan.
Author Contributions: Conceptualization, Devansh Gupta and Hsiang-Chen Wang; methodology, Devansh Gupta and Arvind Mukundan; software, Riya Karmakar and Arvind Mukundan; validation, Devansh Gupta and Riya Karmakar; formal analysis, Devansh Gupta; investigation, Devansh Gupta, Riya Karmakar, Arvind Mukundan, and Hsiang-Chen Wang; resources, Arvind Mukundan; data curation, Devansh Gupta; writing—original draft preparation, Devansh Gupta; writing—review and editing, Devansh Gupta, Hsiang-Chen Wang, and Arvind Mukundan; visualization, Devansh Gupta; supervision, Hsiang-Chen Wang and Arvind Mukundan; project administration, Hsiang-Chen Wang; funding acquisition, Hsiang-Chen Wang. All authors reviewed the results and approved the final version of the manuscript.
Availability of Data and Materials: The data presented in this study are available in this article upon considerable request to the corresponding author (Hsiang-Chen Wang).
Ethics Approval: Not Applicable.
Conflicts of Interest: Author Hsiang-Chen Wang was employed by the company Hitspectra Intelligent Technology Co., Ltd. The remaining authors declare that the research was conducted in the absence of any commercial or financial relationships that could be construed as a potential conflict of interest.
Supplementary Materials: The supplementary material is available online at https://www.techscience.com/doi/10.32604/cmc.2025.069646/s1. Fig. S1. Confusion Matrix of YOLOV5; Fig. S2. Precision, Recall, Accuracy and loss Graphs; Table S1 Classification Report of YOLOV5; Fig. S4. Precision, Recall, Accuracy and Loss Graphs; Table S2 Classification Report of YOLOV8; Fig. S5. Confusion Matrix of YOLOV11; Fig. S6. Precision, Recall, Accuracy and Loss Graphs of YOLOV11; Table S3 Classification Report of YOLOV11; Fig. S7. Confusion Matrix of Faster R-CNN; Table S4 Classification Report of Faster R-CNN; Fig. S8. Confusion Matrix of YOLOV5; Fig. S9. Precision, Recall, Accuracy and Loss Graphs of YOLOV11; Table S5 Classification Report of YOLOV5; Fig. S10. Confusion Matrix of YOLOV8; Fig. S11. Precision, Recall, Accuracy and Loss Graphs of YOLOV8; Table S6 Classification Report of YOLOV8; Fig. S13. Precision, Recall, Accuracy and Loss Graphs of YOLOV11; Table S7 Classification Report of YOLOV11; Fig. S14. Confusion Matrix of Mask R-CNN; Table S8 Classification Report of Mask R-CNN; Fig. S15 Detection Results; Fig. S16 Segmentation Results.
References
1. Haraguchi N, Cheng CFC, Smeets E. The importance of manufacturing in economic development: has this changed? World Dev. 2017;93(4):293–315. doi:10.1016/j.worlddev.2016.12.013. [Google Scholar] [CrossRef]
2. Machado CG, Winroth MP, Ribeiro da Silva EHD. Sustainable manufacturing in Industry 4.0: an emerging research agenda. Int J Prod Res. 2020;58(5):1462–84. doi:10.1080/00207543.2019.1652777. [Google Scholar] [CrossRef]
3. Ghobakhloo M. The future of manufacturing industry: a strategic roadmap toward Industry 4.0. J Manuf Technol Manag. 2018;29(6):910–36. doi:10.1108/jmtm-02-2018-0057. [Google Scholar] [CrossRef]
4. Zheng T, Ardolino M, Bacchetti A, Perona M. The applications of Industry 4.0 technologies in manufacturing context: a systematic literature review. Int J Prod Res. 2021;59(6):1922–54. doi:10.1080/00207543.2020.1824085. [Google Scholar] [CrossRef]
5. Rai R, Tiwari MK, Ivanov D, Dolgui A. Machine learning in manufacturing and Industry 4.0 applications. Abingdon, UK: Talylor Francis Group; 2021. p. 4773–8. [Google Scholar]
6. Frank AG, Dalenogare LS, Ayala NF. Industry 4.0 technologies: implementation patterns in manufacturing companies. Int J Prod Econ. 2019;210:15–26. [Google Scholar]
7. Zheng P, Wang H, Sang Z, Zhong RY, Liu Y, Liu C, et al. Smart manufacturing systems for Industry 4.0: conceptual framework, scenarios, and future perspectives. Front Mech Eng. 2018;13(2):137–50. doi:10.1007/s11465-018-0499-5. [Google Scholar] [CrossRef]
8. Moraes EB, Kipper LM, Hackenhaar Kellermann AC, Austria L, Leivas P, Moraes JAR, et al. Integration of Industry 4.0 technologies with Education 4.0: advantages for improvements in learning. Interact Technol Smart Educ. 2023;20(2):271–87. doi:10.1108/itse-11-2021-0201. [Google Scholar] [CrossRef]
9. Boysen N, Schulze P, Scholl A. Assembly line balancing: what happened in the last fifteen years? Eur J Oper Res. 2022;301(3):797–814. doi:10.1016/j.ejor.2021.11.043. [Google Scholar] [CrossRef]
10. Cohen Y, Naseraldin H, Chaudhuri A, Pilati F. Assembly systems in Industry 4.0 era: a road map to understand Assembly 4.0. Int J Adv Manuf Technol. 2019;105(9):4037–54. doi:10.1007/s00170-019-04203-1. [Google Scholar] [CrossRef]
11. Rossit DA, Tohmé F, Frutos M. An Industry 4.0 approach to assembly line resequencing. Int J Adv Manuf Technol. 2019;105(9):3619–30. doi:10.1007/s00170-019-03804-0. [Google Scholar] [CrossRef]
12. Priya SK, Jayakumar V, Kumar SS. Defect analysis and lean six sigma implementation experience in an automotive assembly line. Mater Today Proc. 2020;22(10):948–58. doi:10.1016/j.matpr.2019.11.139. [Google Scholar] [CrossRef]
13. Fuertes G, Zamorano J, Alfaro M, Vargas M, Sabattin J, Duran C, et al. Opportunities of the technological trends linked to Industry 4.0 for achieve sustainable manufacturing objectives. Sustainability. 2022;14(18):11118. doi:10.3390/su141811118. [Google Scholar] [CrossRef]
14. Sony M, Naik S. Key ingredients for evaluating Industry 4.0 readiness for organizations: a literature review. Benchmarking. Int J. 2020;27:2213–32. doi:10.1108/BIJ-09-2018-0284. [Google Scholar] [CrossRef]
15. Stallard MM, MacKenzie CA, Peters FE. A probabilistic model to estimate visual inspection error for metalcastings given different training and judgment types, environmental and human factors, and percent of defects. J Manuf Syst. 2018;48(1):97–106. doi:10.1016/j.jmsy.2018.07.002. [Google Scholar] [CrossRef]
16. Lin H-D, Jheng C-K, Lin C-H, Chang H-T. Utilizing deep learning for defect inspection in hand tool assembly. Sensors. 2024;24(11):3635. doi:10.3390/s24113635. [Google Scholar] [PubMed] [CrossRef]
17. Tuncer MC, Ozkan NF, Ulutas BH. A systematic approach to assess visual inspection tasks: an assembly line case. Int J Product Qual Manag. 2020;29(3):418–38. doi:10.1504/ijpqm.2020.106024. [Google Scholar] [CrossRef]
18. Genta G, Galetto M, Franceschini F. Product complexity and design of inspection strategies for assembly manufacturing processes. Int J Prod Res. 2018;56(11):4056–66. doi:10.1080/00207543.2018.1430907. [Google Scholar] [CrossRef]
19. Ahmad HM, Rahimi A. Deep learning methods for object detection in smart manufacturing: a survey. J Manuf Syst. 2022;64(1):181–96. doi:10.1016/j.jmsy.2022.06.011. [Google Scholar] [CrossRef]
20. Ashourpour M, Azizpour G, Johansen Keditors. Real-time defect and object detection in assembly line: a case for in-line quality inspection. In: International Conference on Flexible Automation and Intelligent Manufacturing. Porto, Portugal: Springer; 2023. doi:10.1007/978-3-031-38241-3_12. [Google Scholar] [CrossRef]
21. Jamwal A, Agrawal R, Sharma M. Deep learning for manufacturing sustainability: models, applications in Industry 4.0 and implications. Int J Inf Manag Data Insights. 2022;2(2):100107. doi:10.1016/j.jjimei.2022.100107. [Google Scholar] [CrossRef]
22. Karafili E, Spanaki K, Lupu EC. An argumentation reasoning approach for data processing. Comput Ind. 2018;94(5):52–61. doi:10.1016/j.compind.2017.09.002. [Google Scholar] [CrossRef]
23. Maharana K, Mondal S, Nemade B. A review: data pre-processing and data augmentation techniques. Glob Transit Proc. 2022;3(1):91–9. doi:10.1016/j.gltp.2022.04.020. [Google Scholar] [CrossRef]
24. Khanam R, Hussain M. What is YOLOv5: a deep look into the internal features of the popular object detector. arXiv:2407.20892. 2024. [Google Scholar]
25. Mahasin M, Dewi IA. Comparison of CSPDarkNet53, CSPResNeXt-50, and EfficientNet-B0 backbones on YOLO v4 as object detector. Int J Eng Sci Inf Technol. 2022;2(3):64–72. doi:10.52088/ijesty.v2i3.291. [Google Scholar] [CrossRef]
26. Zhang Zeditor. Improved adam optimizer for deep neural networks. In: 2018 IEEE/ACM 26th International Symposium on Quality of Service (IWQoS). Piscataway, NJ, USA: IEEE; 2018. doi:10.1109/iwqos.2018.8624183. [Google Scholar] [CrossRef]
27. Ho Y, Wookey S. The real-world-weight cross-entropy loss function: modeling the costs of mislabeling. IEEE Access. 2019;8:4806–13. doi:10.1109/access.2019.2962617. [Google Scholar] [CrossRef]
28. Terven J, Córdova-Esparza D-M, Romero-González J-A. A comprehensive review of YOLO architectures in computer vision: from YOLO1 to YOLO8 and YOLO-NAS. Mach Learn Knowl Extr. 2023;5(4):1680–716. doi:10.3390/make5040083. [Google Scholar] [CrossRef]
29. Sohan M, Sai Ram T, Rami Reddy CVeditors. A review on yolov8 and its advancements. In: International Conference on Data Intelligence and Cognitive Informatics. Tirunelveli, India: Springer; 2024. doi:10.1007/978-981-99-7962-2_39. [Google Scholar] [CrossRef]
30. Wang X, Gao H, Jia Z, Li Z. BL-YOLOv8: an improved road defect detection model based on YOLOv8. Sensors. 2023;23(20):8361. doi:10.3390/s23208361. [Google Scholar] [PubMed] [CrossRef]
31. Zheng Z, Wang P, Liu W, Li J, Ye R, Ren Deditors. Distance-IoU loss: faster and better learning for bounding box regression. In: Proceedings of the AAAI Conference on Artificial Intelligence; 2020 Feb 7–12; New York, NY, USA. [Google Scholar]
32. Du S, Zhang B, Zhang P, Xiang Peditors. An improved bounding box regression loss function based on CIOU loss for multi-scale object detection. In: Proceedings of the 2021 IEEE 2nd International Conference on Pattern Recognition and Machine Learning (PRML); 2021 Jul 16–18; Chengdu, China. doi:10.1109/prml52754.2021.9520717. [Google Scholar] [CrossRef]
33. Khanam R, Hussain M. Yolov11: an overview of the key architectural enhancements. arXiv:2410.17725. 2024. [Google Scholar]
34. Alkhammash EH. Multi-classification using YOLOv11 and hybrid YOLO11n-mobilenet models: a fire classes case study. Fire. 2025;8(1):17. doi:10.3390/fire8010017. [Google Scholar] [CrossRef]
35. Sapkota R, Karkee M. Comparing YOLOv11 and YOLOv8 for instance segmentation of occluded and non-occluded immature green fruits in complex orchard environment. arXiv:2410.19869. 2024. [Google Scholar]
36. Ren S, He K, Girshick R, Sun J. Faster R-CNN: towards real-time object detection with region proposal networks. Adv Neural Inf Process Syst. 2015;28(6):1–9. doi:10.1109/tpami.2016.2577031. [Google Scholar] [PubMed] [CrossRef]
37. Ren S, He K, Girshick R, Sun J. Faster R-CNN: towards real-time object detection with region proposal networks. IEEE Trans Pattern Anal Mach Intell. 2016;39(6):1137–49. doi:10.1109/tpami.2016.2577031. [Google Scholar] [PubMed] [CrossRef]
38. He K, Gkioxari G, Dollár P, Girshick Reditors. Mask R-CNN. In: Proceedings of the IEEE International Conference on Computer Vision; 2017 Oct 22–19; Venice, Italy. doi:10.1109/iccv.2017.322. [Google Scholar] [CrossRef]
39. Bharati P, Pramanik A. Deep learning techniques—R-CNN to mask R-CNN: a survey. In: Computational intelligence in pattern recognition. Singapore: Springer; 2020. p. 657–68. doi:10.1007/978-981-13-9042-5_56. [Google Scholar] [CrossRef]
40. White A, Karimoddini A, Karimadini M. Resilient fault diagnosis under imperfect observations—a need for Industry 4.0 era. IEEE/CAA J Autom Sin. 2020;7(5):1279–88. doi:10.1109/jas.2020.1003333. [Google Scholar] [CrossRef]
41. Hayat A, Shahare V, Sharma AK, Arora N. Introduction to Industry 4.0. In: Blockchain and its applications in Industry 4.0. Berlin/Heidelberg, Germany: Springer; 2023. p. 29–59. [Google Scholar]
42. Jasperneite J, Sauter T, Wollschlaeger M. Why we need automation models: handling complexity in Industry 4.0 and the internet of things. IEEE Ind Electron Mag. 2020;14(1):29–40. doi:10.1109/mie.2019.2947119. [Google Scholar] [CrossRef]
43. Hrechuk A, Bushlya V. Automated detection of tool wear in machining and characterization of its shape. Wear. 2023;523:204762. doi:10.1016/j.wear.2023.204762. [Google Scholar] [CrossRef]
44. Agrawal N, Yang M-J, Xanthopoulos C, Thangamariappan V, Xiao J, Ho C-Weditors, et al. Automated socket anomaly detection through deep learning. In: Proceedings of the 2020 IEEE International Test Conference (ITC); 2020 Nov 3–5; Washington, DC, USA. doi:10.1109/itc44778.2020.9325269. [Google Scholar] [CrossRef]
45. Ribeiro J, Lima R, Eckhardt T, Paiva S. Robotic process automation and artificial intelligence in Industry 4.0—a literature review. Procedia Comput Sci. 2021;181(1):51–8. doi:10.1016/j.procs.2021.01.104. [Google Scholar] [CrossRef]
46. Papulová Z, Gažová A, Šufliarský Ľ. Implementation of automation technologies of Industry 4.0 in automotive manufacturing companies. Procedia Comput Sci. 2022;200(2):1488–97. doi:10.1016/j.procs.2022.01.350. [Google Scholar] [CrossRef]
47. Zendehdel N, Chen H, Leu MC. Real-time tool detection in smart manufacturing using You-Only-Look-Once (YOLO) v5. Manuf Lett. 2023;35(10):1052–9. doi:10.1016/j.mfglet.2023.08.062. [Google Scholar] [CrossRef]
Cite This Article
 Copyright © 2026 The Author(s). Published by Tech Science Press.
This work is licensed under a Creative Commons Attribution 4.0 International License , which permits unrestricted use, distribution, and reproduction in any medium, provided the original work is properly cited.
 Downloads
 Citation Tools