
 Submit a Paper
 Propose a Special lssue
 Open Access
ARTICLE

Enhancing Lightweight Mango Disease Detection Model Performance through a Combined Attention Module
1 Department of Electrical Engineering, National Chin-Yi University of Technology, Taichung, 411030, Taiwan
2 Graduate Institute, Prospective Technology of Electrical Engineering and Computer Science, National Chin-Yi University of Technology, Taichung, 411030, Taiwan
3 Department of Informatics Management, Politeknik Negeri Sriwijaya, Palembang, 30139, Indonesia
4 Department of Information Technology, Takming University of Science and Technology, Taipei City, 11451, Taiwan
* Corresponding Author: Sung-Jung Hsiao. Email:
Computers, Materials & Continua 2026, 86(2), 1-31. https://doi.org/10.32604/cmc.2025.070922
Received 28 July 2025; Accepted 16 September 2025; Issue published 09 December 2025
 View Full Text
 Download PDF
Abstract
Mango is a plant with high economic value in the agricultural industry; thus, it is necessary to maximize the productivity performance of the mango plant, which can be done by implementing artificial intelligence. In this study, a lightweight object detection model will be developed that can detect mango plant conditions based on disease potential, so that it becomes an early detection warning system that has an impact on increasing agricultural productivity. The proposed lightweight model integrates YOLOv7-Tiny and the proposed modules, namely the C2S module. The C2S module consists of three sub-modules such as the convolutional block attention module (CBAM), the coordinate attention (CA) module, and the squeeze-and-excitation (SE) module. The dataset is constructed by eight classes, including seven classes of disease conditions and one class of health conditions. The experimental result shows that the proposed lightweight model has the optimal results, which increase by 13.15% of mAP50 compared to the original model YOLOv7-Tiny. While the mAP50:95 also achieved the highest results compared to other models, including YOLOv3-Tiny, YOLOv4-Tiny, YOLOv5, and YOLOv7-Tiny. The advantage of the proposed lightweight model is the adaptability that supports it in constrained environments, such as edge computing systems. This proposed model can support a robust, precise, and convenient precision agriculture system for the user.Keywords
In several regions, the mango plant has economic value and provides economic growth, including in Taiwan, where Mango has become one of the major production farms. The demand for mangoes increases year by year, which is indicated by the increase in production farms [1]. Taiwan mango has a good quality and is distributed both locally and exported to several countries, including Japan and Korea. However, the challenge is how to optimize mango productivity to meet export and Local needs. Monitoring the growth of mango plants is crucial as part of efforts to increase productivity both in quantity and quality [2]. The AI-based approach is a solution for monitoring the optimal growth of the mango plant through vision mechanisms. The indicators that can be seen from plant growth are mango leaves, where early detection can be done as a preventive action, whether the mango leaves are growing optimally or there are pests and diseases [3]. The vision mechanism captures the input image of the current condition of the mango plant, and then the embedded model processes the input data and provides real-time information to the user. Object detection models play an important role in processing the input image into current information that is useful for users [4]. YOLO object detection is an adaptive, high-speed, and accurate object detection model for recognizing instance objects within continuous images [5]. In line with the development of edge computing technology, which has advantages in data processing but has limited resources, the YOLO model needs to adapt to these conditions. Therefore, a YOLO tiny version was constructed to adjust to computational cost but still maintain its accurate performance [6].
Several previous studies have utilized a lightweight model related to an agricultural field to perform plantation growth or pest monitoring. Shi et al. [7] introduced FeYOLO, which is the lightweight model of the improved YOLOv7-tiny to detect disease-silkworms. A channel attention mechanism called the channel recalibration model (CRM) is adopted to enhance the feature extraction capability of the model. In addition, a spatial enhancement module (SEM) is integrated to improve detection performance by highlighting the deep contextual information. The comparative experiment has been conducted and indicates that the proposed model has gained the optimal result compared to the other models. Wang et al. [8] developed OW-YOLO, which is employed to detect the obstructed walnuts. The proposed model integrated YOLOv8s and a dilated weighted residual-dilated residual block (DWR-DRB) in the backbone structure of the model. In head-structured, it is modified by replacing the original head with LADH to improve model efficiency. The experimental result represents the computational cost, and the weight size is reduced by 37.3% and 48.1%, respectively. A lightweight broccoli detection in a complex environment (LBDC-YOLO) has been constructed by Zuo et al. [9] to perform broccoli detection, which was implemented in a robot. The modification is constructing a Slim-neck design, which is based on GSConv, while the backbone structure is integrated with triple attention. The accuracy result is 94.44% while the computational complexity is reduced by 32.1% compared to the original model, YOLOv8n. Zheng et al. [10] construct Star-YOLO to detect weeds in a cotton field. The original model employs YOLOv8, which is modified by two improvements: the first is structuring the C2f module and backbone by Star Block, and the second is implementing DySample in the Upsample operation. The mAP50 and mAP50:95 performances achieve the percentage scores of 98.0% and 95.4%, respectively. Meng et al. [11] integrate the multi-scale variable kernel convolution (MKConv) in the proposed YOLO-MSM model to detect maize leaf disease. The model size has reduced significantly, resulting in 5.4 MB, and improved the precision and recall performance by 0.66% and 1.61%, respectively, compared to the original model. Meanwhile, this study will utilize YOLOv7-tiny, which employs the extended efficient layer aggregation networks (E-LAN) to improve the learning ability of the model’s network structure while maintaining the original gradient path [12]. By this mechanism, the model can achieve the optimal parameter utilization. In addition, YOLOv7-tiny has fewer layers compared to the original YOLOv7, which can provide a lightweight model to support constrained environments such as edge computing systems.
However, the challenge regarding object detection is high complexity with multiple intersections and background noise, which has the potential to reduce the performance of the model. Therefore, the highlighted problem in this study is how to construct the proposed model, which has an optimized object detection task, especially for complex objects such as leaves with random patterns and noisy backgrounds; the model is able to remain focused on the target object so that it has reliability and is adaptable in its conditions. To improve the original model, an attention mechanism is needed, either improving how the model performs the feature extraction operation or focusing on spatial and channel aspects. Thus, an additional module that performs as the attention mechanism is needed, which focuses on capturing only the relevant information, enabling the model to be more adaptive to perform detection tasks with high computational efficiency. In addition, employing the attention mechanism can enhance feature extraction capability, the model better understands the contextual case, and improve model efficiency [13].
The implementation of an attention mechanism has been adopted in a YOLO-based model to perform the object detection task in the agricultural field. Kumar et al. [14] integrate the YOLO model and the Cross-Attention encoder module, which is a combination of the loss function of pairwise triplet, which is utilized in cattle verification. The proposed model is implemented in muzzle image and represents an accuracy of 93.67%. Liu et al. [15] developed YOLO-TBD, which is implemented for detecting the tea bud by combining the TBAM module (Triple-branch attention mechanism) and the YOLO model. The C2f module in the original YOLO model is replaced by the constructed mechanism, which is called self-correction group convolution (SCGC). The comparative experimental result demonstrates that the proposed model has the most optimal results, which gains the mAP of 94.5%. Ye et al. [16] implement Mamba-like linear attention (MLLA) in the YOLO model to address several problems, such as complex background and glue line morphology. The strategy is to extract the global and local features to enhance the accuracy of detection. The proposed model achieves a high mAP, obtaining the percentage value of 95.2%. Meanwhile, in this study, a novel module C2S is constructed to perform an attention mechanism, which is the integration of a convolutional block attention module (CBAM), coordinate attention (CA) module, and squeeze-and-excitation (SE) module. The proposed C2S module has several advantages regarding the ability to enhance feature fusion capability and reduce computational complexity. Incorporating the C2S module into YOLOv7-tiny allows the model to have better long-range capture dependency, more efficiency, and improved detection task ability [17]. The proposed model will be implemented to monitor the mango plant by detecting whether mango leaves have a disease or not, which is defined by eight classes, including seven classes of disease and one class of healthy condition. In conclusion, the contributions of this study are as follows:
(1) Developing a precision agriculture system for mango leaf disease detection by incorporating the lightweight object detection method to provide a convenient, precise, and low-cost monitoring system.
(2) Constructing the proposed lightweight object detection method for mango leaf disease by integrating the baseline model YOLOv7-tiny and the combined attention module mechanism, called the C2S module.
(3) Providing a comprehensive model evaluation by several experiments, including model performance on the dataset, an ablation study, an attention module experiment, and a comparative experiment involving different algorithms.
This paper consists of several sections as follows: Section 2 is materials and methods, including dataset development, an overview of the baseline model, the construction of the C2S module, and the architecture of the proposed model. Section 3 consists of the comprehensive experiments, such as analysis proposed model on the dataset, comparative experiment on different module positions, ablation experiment, comparative experiment through different deep learning algorithms, and implementation in a practical application. Section 4 represents the conclusions of the study and future works.
The dataset collection is based on eight classes consisting of “antracnose”, “Bacterial Canker”, “Cutting Weevil”, “Die Back”, “Gall Midge”, “Sooty Mold”, “Powdery Mildew”, and “Health” which are sourced from several public repositories and private datasets with the percentage ratio of 65% and 35%, respectively. The private dataset is taken in the location of Taiping District, Taichung City, Taiwan, with a latitude of 24°8′49″ north and a longitude of 120°43′54″ east. Fig. 1 represents a sample of the image dataset.
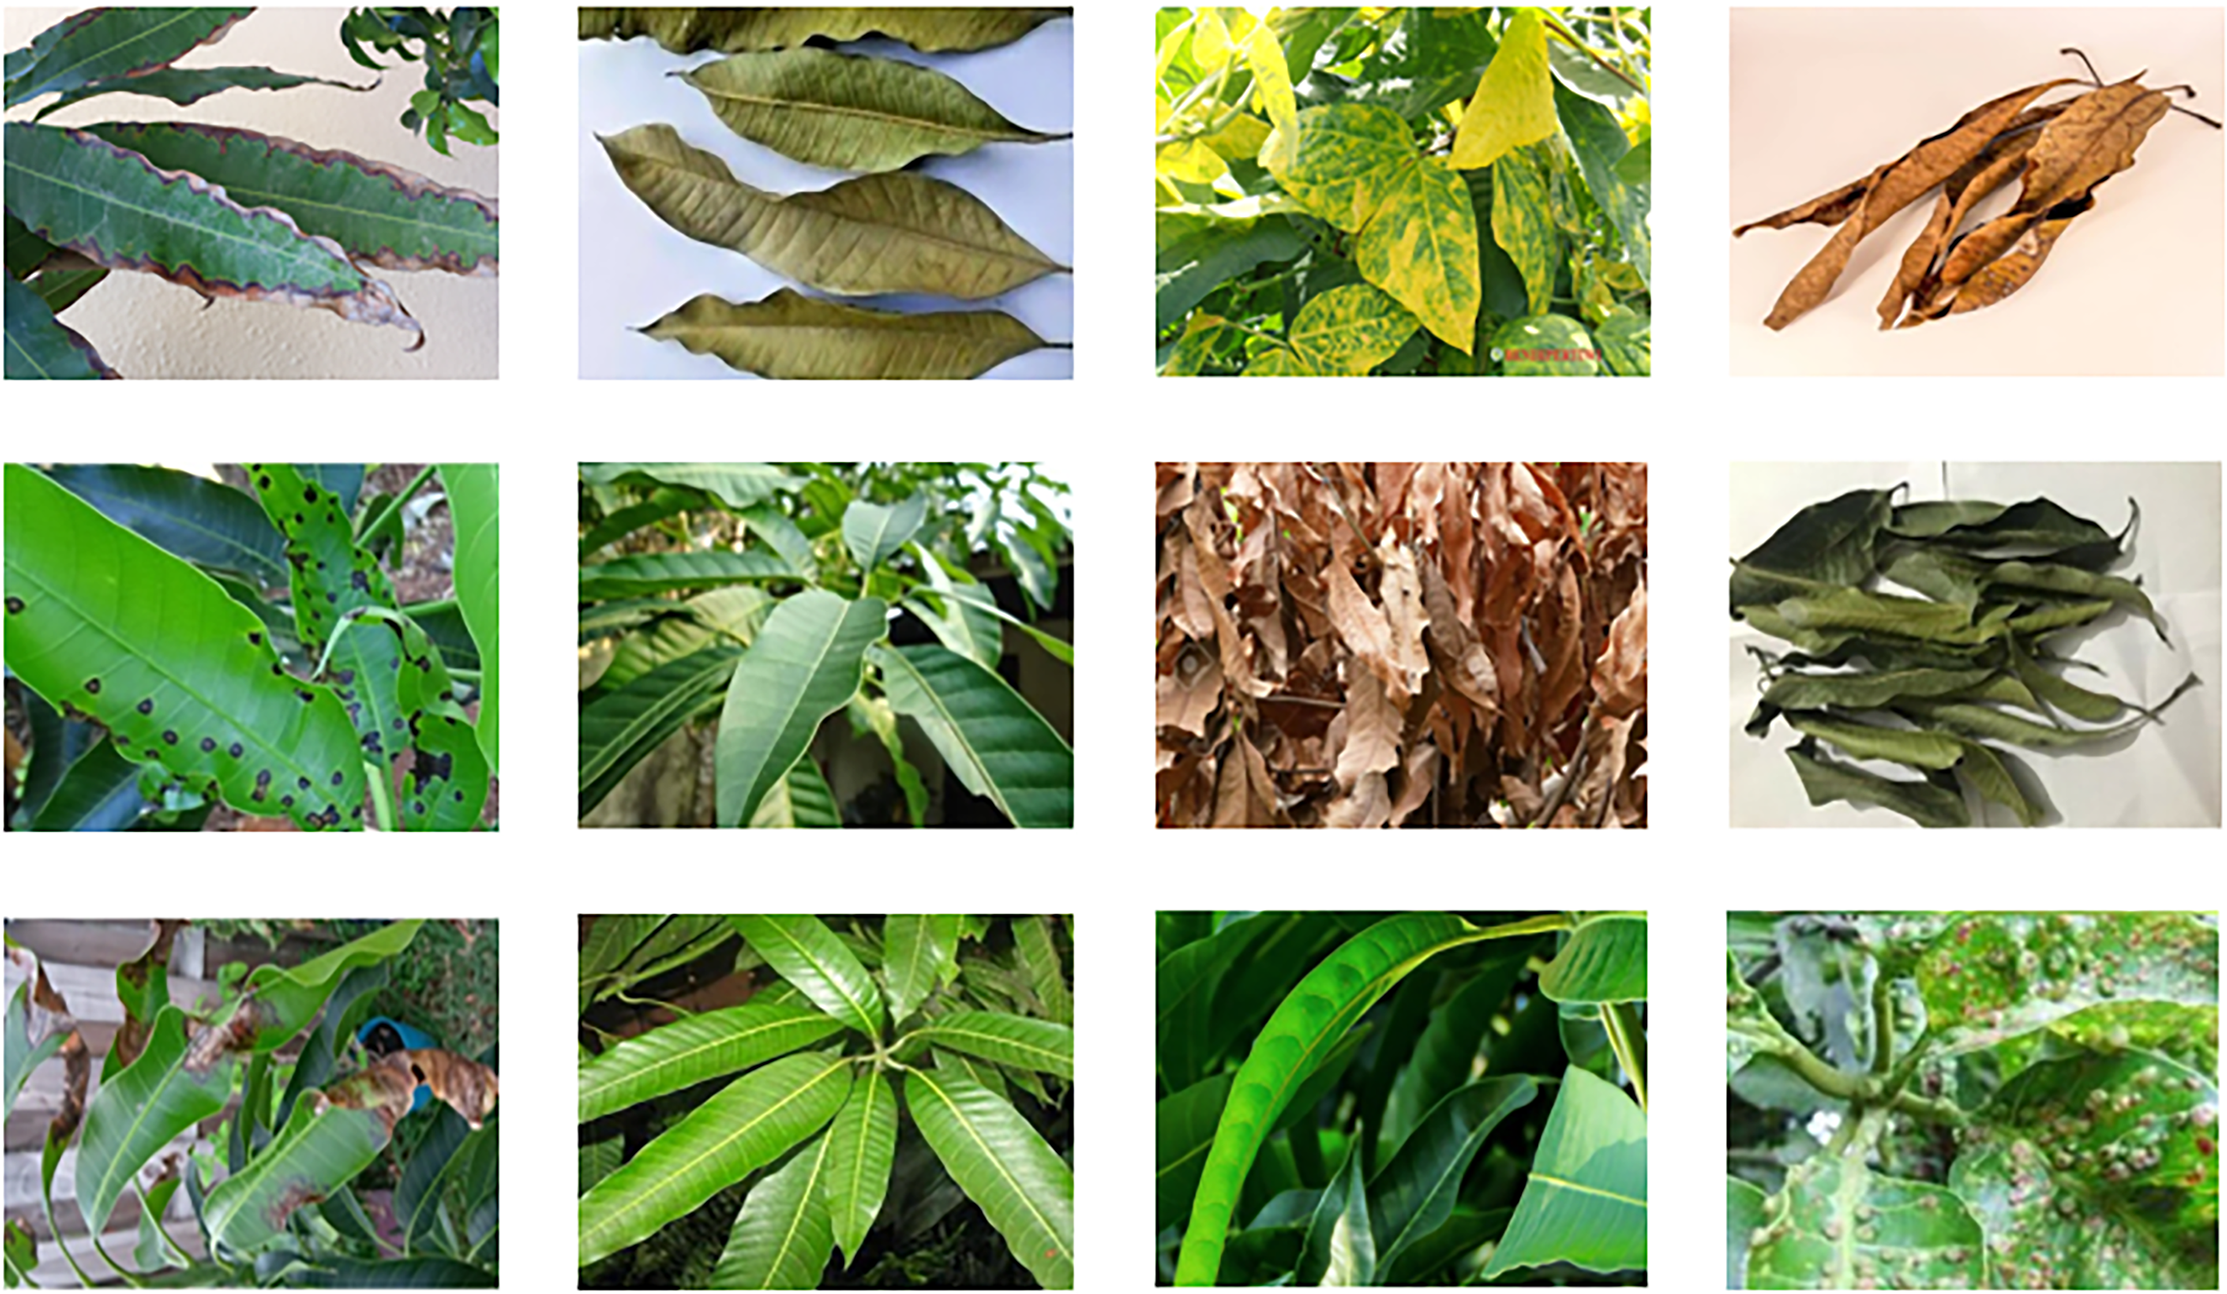
Figure 1: Mango leaf sample image dataset
The initial image data for the development of the Mango dataset consists of 3425 images. Fig. 2 depicts the image percentages from the eight datasets, where imbalance occurs, especially in the classes of “powdery mildew”, “sooty mold”, and “die back”, which have the percentage of the total image of 7.0%, 4.0%, and 5.4%, respectively. Meanwhile, the classes of “bacterial canker” and “health” have the dominant percentages, 27.4% and 25.3%, respectively.
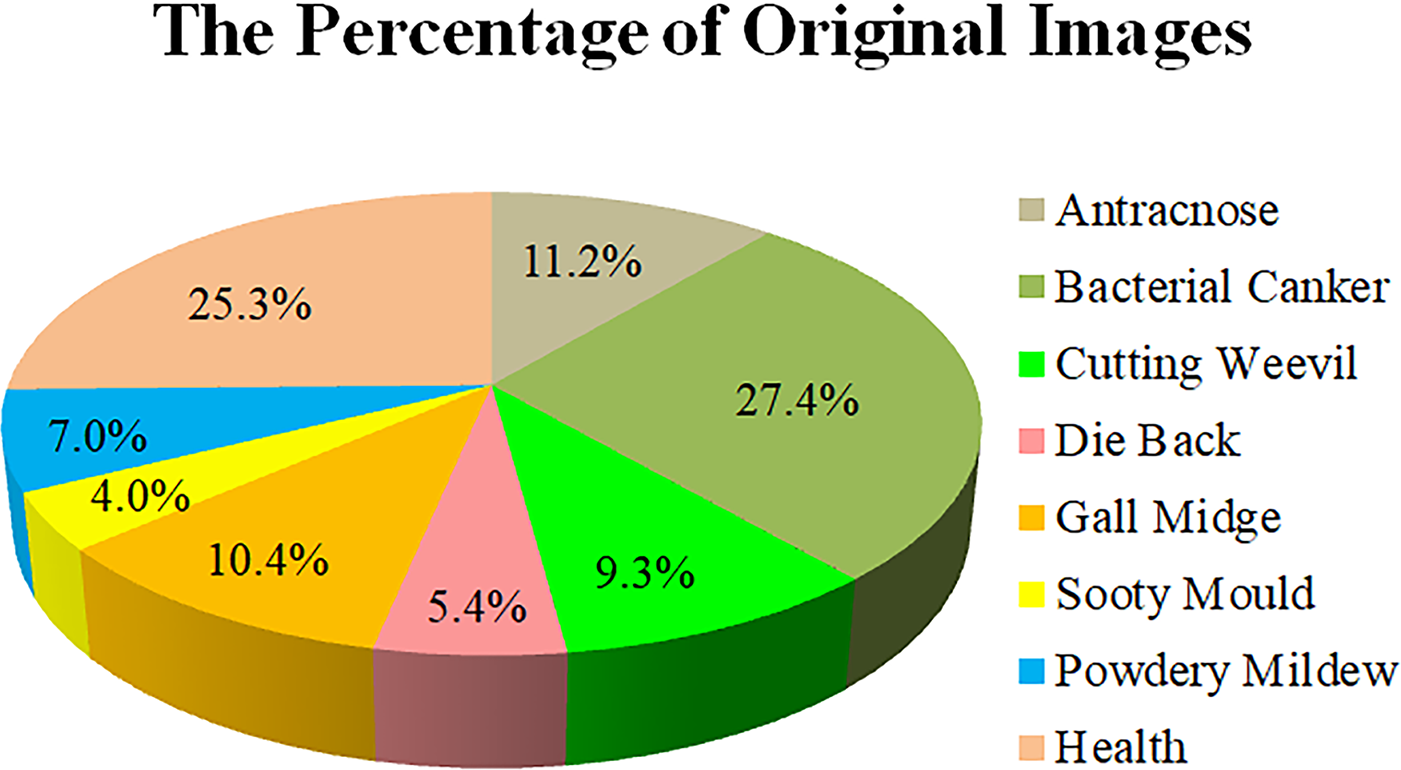
Figure 2: Each class percentage of the initial collected images
The imbalanced dataset can impact the model detection performance, as it will have a lack of knowledge due to the smaller class percentage compared to the dominant class percentage. Thus, the model accuracy for a particular class will be very high; otherwise, the model accuracy will be very low, especially for a low percentage of the class. In order to address these issues, image enhancement through the implementation of an image augmentation technique needs to be conducted as a method to balance the image dataset [18]. In this study, we employ three mechanisms of image augmentation techniques, including flipping, rotating, and Gaussian blur. Flipping is done with two methods: horizontal and vertical flipping. The horizontal flipping is flipped along the y-axis or vertical axis and generates the mirror image with the direction from left to right. The vertical axis is conducted by the x-axis or by flipping the image from top to bottom. The condition of the mango leaf is random with many positions; flipping both horizontally and vertically can increase model robustness. Fig. 3 represents how the horizontal and vertical flipping convert the original image. Eqs. (1) and (2) represent the vertical and horizontal flipping, respectively, where in Eq. (1) the y-axis is converted into h – 1 – y, where h represents the image’s height. In Eq. (2), only the x-axis is mapped into ω – 1 – x, where the image’s width is indicated by ω.
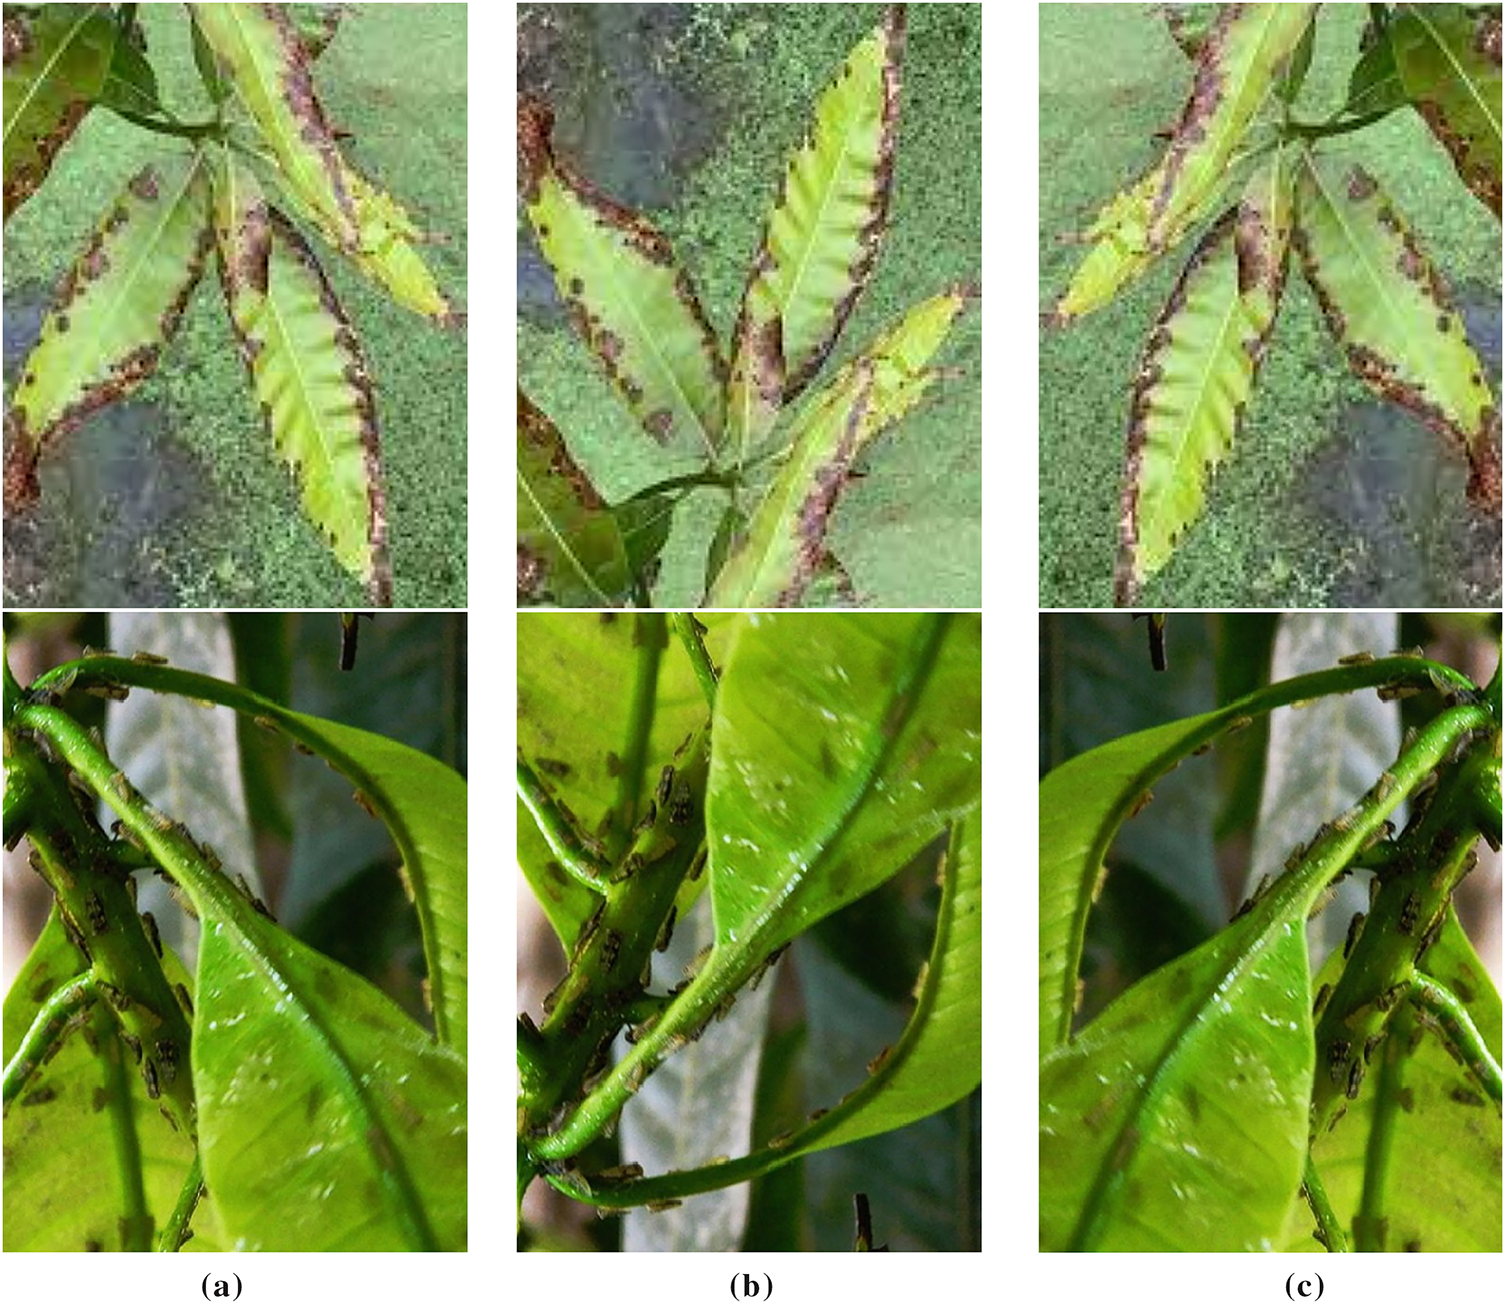
Figure 3: Image augmentation technique. (a) original image; (b) vertical flipping; (c) horizontal flipping
The rotation technique is implemented by incorporating rotation 90° and 270°, which are represented in Fig. 4. Technically, the implementation of rotation utilizes trigonometric functions, including the sine and cosine, as represented in Eqs. (3) and (4).
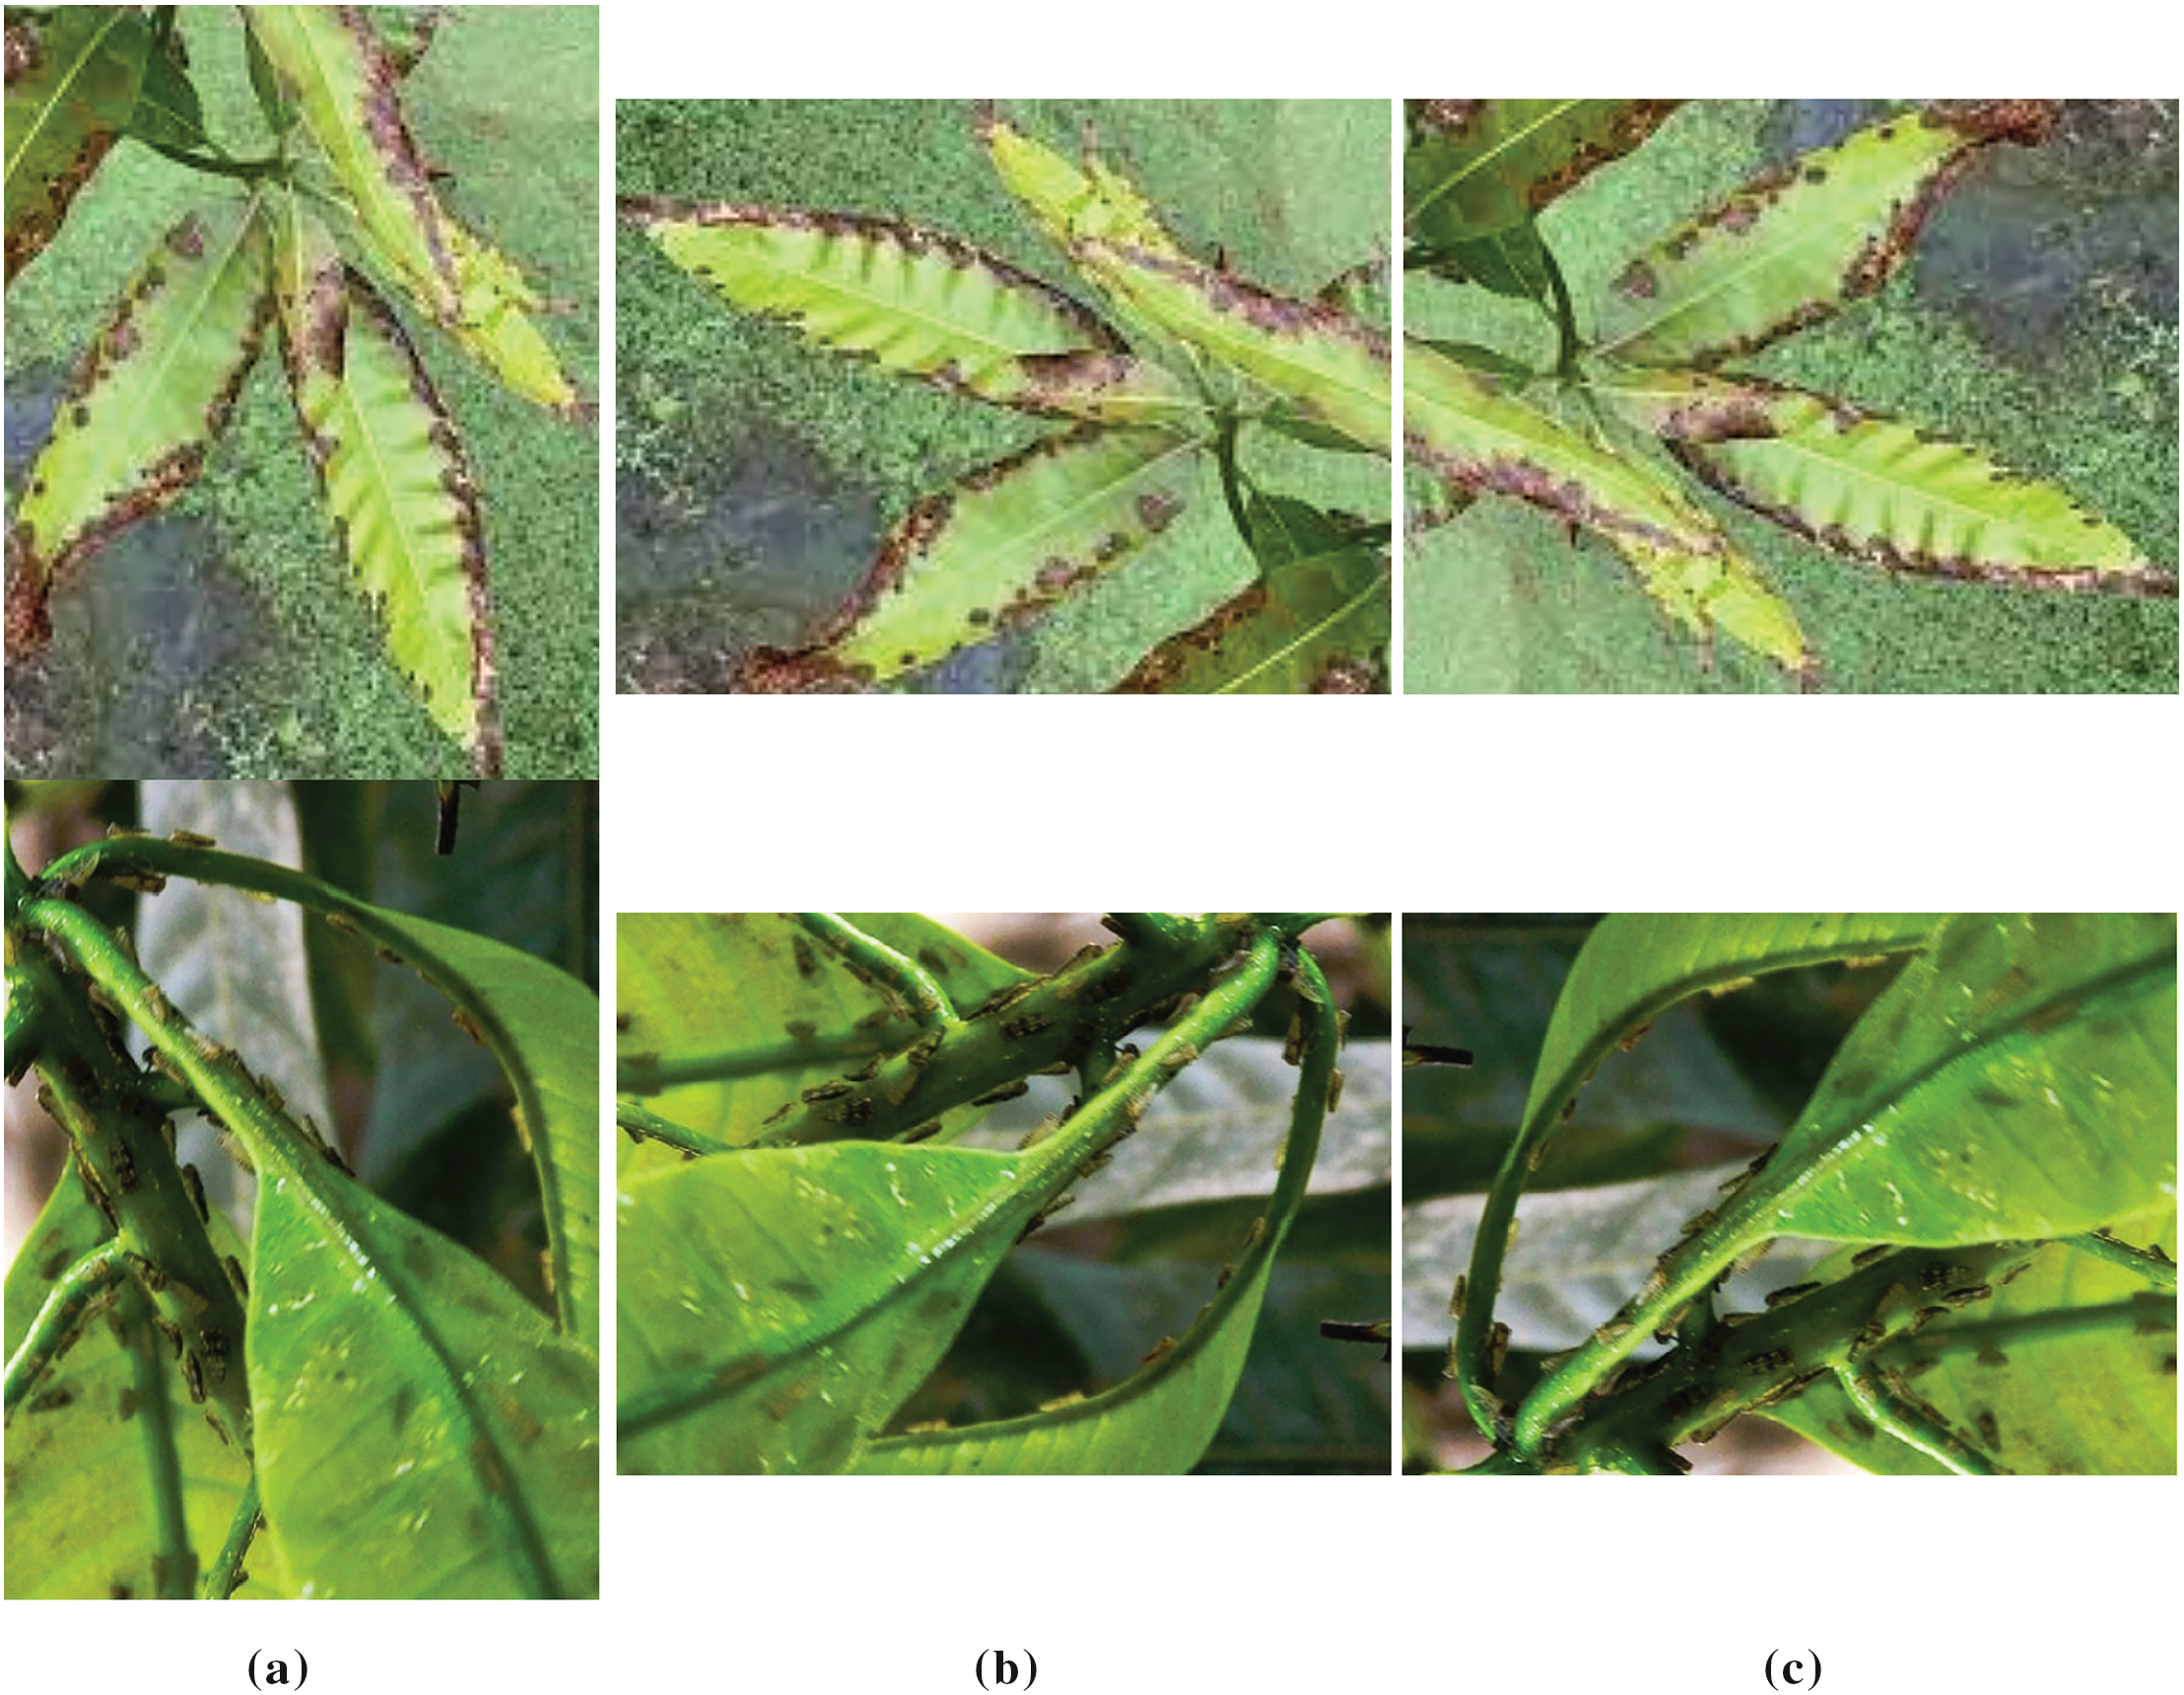
Figure 4: Image augmentation technique. (a) original image; (b) 90° rotation; (c) 270° rotation
Gaussian blur is utilized to smooth an image by implementing the Gaussian function in averaging the values of nearby pixels. The results of Gaussian blur can obtain the reduction of image noise, variation of texture, and minor details. The formulation of Gaussian blur is represented in Eq. (5), which σ indicates as Gaussian distribution standard deviation and
The results of dataset balancing are shown in Fig. 5, with image percentages ranging from 10% to 14%. The “powdery mildew”, “sooty mold”, and “die back” classes initially had very low percentages, and then have percentages that tend to be balanced with the other classes.
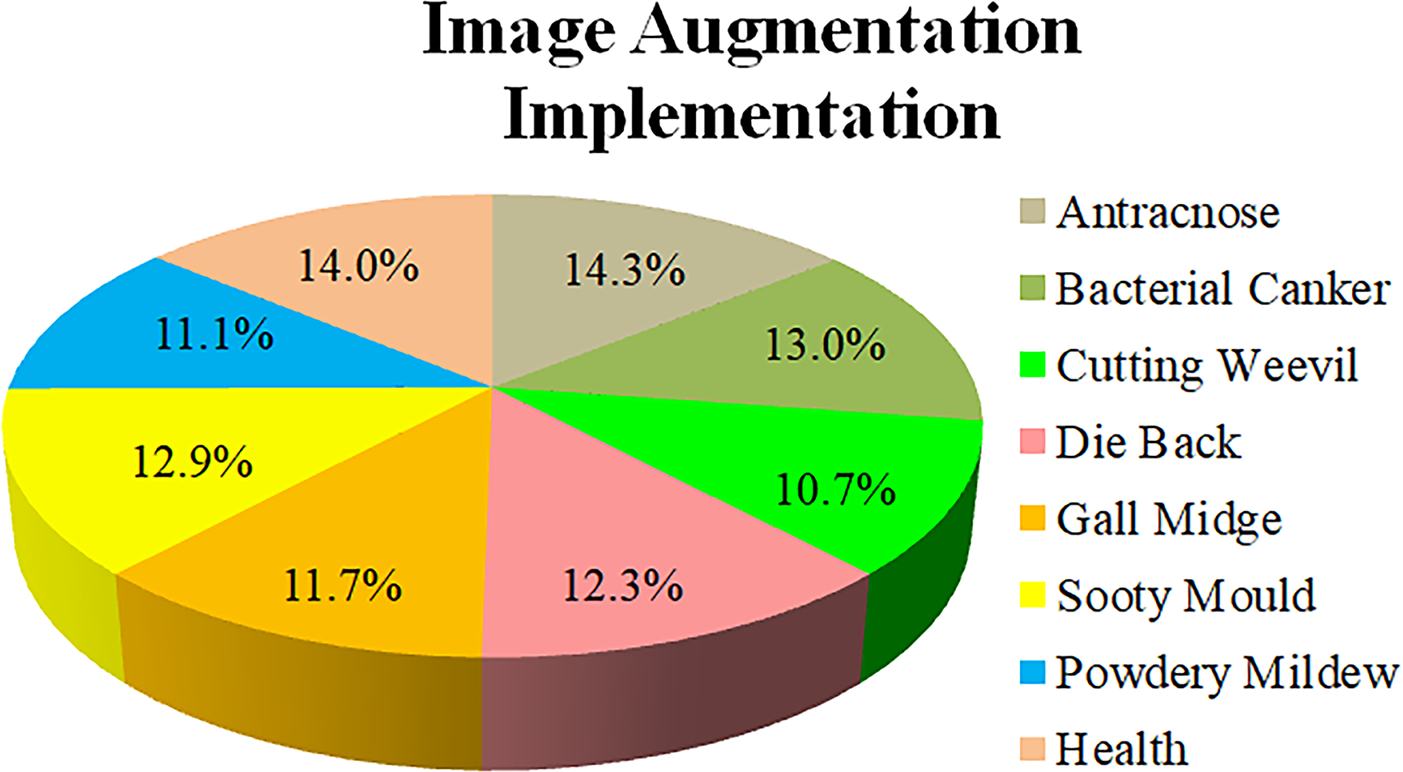
Figure 5: The percentage of the class after image augmentation implementation
The final result of this implementation obtained 9524 images, which were determined by 8 classes. Then the data is divided into training, validation, and testing data with the ratios of 70%, 20%, and 10%, respectively. The detailed number of class datasets is represented in Table 1 as follows:
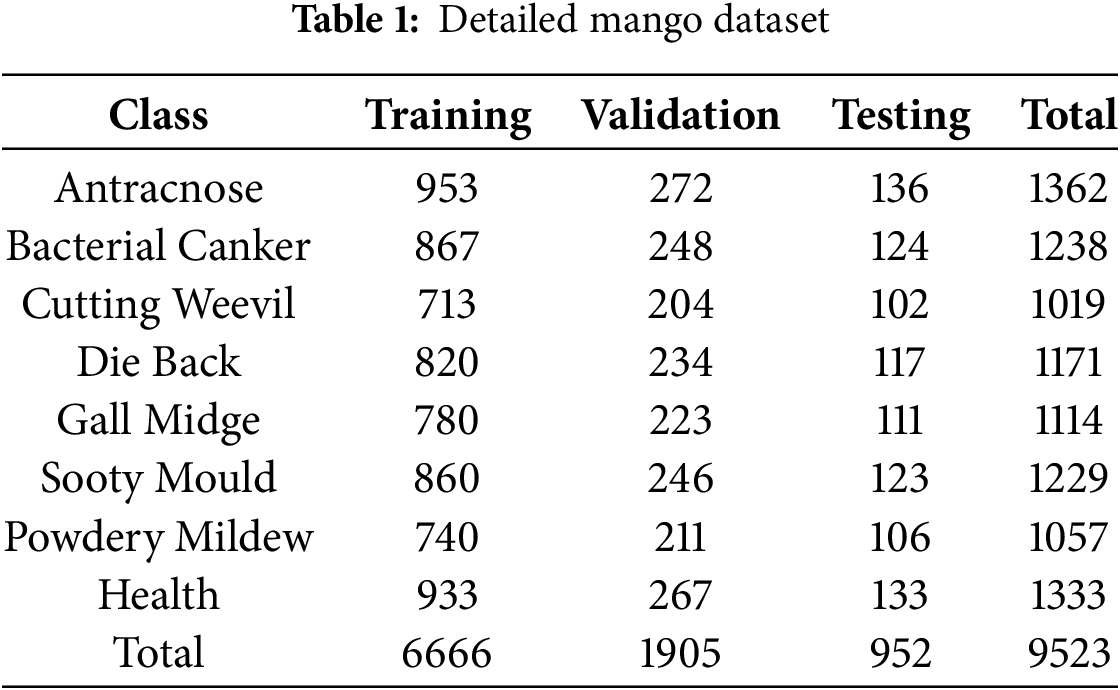
The dataset is available online and can be accessed through the link https://github.com/mangoleavesexperiment/mangodisease (accessed on 15 September 2025). The eight classes in the mango dataset were determined based on the common disease conditions found in mango leaves, which consist of seven diseases. One additional class represents normal leaf conditions, categorized as the “Health” class in the class label. The next stage is the annotation process, which in this study utilizes LabelImg software annotation tools. Annotation is conducted by creating a box on the target object; thus, the model can recognize the object’s context during training data. When generating a box, the option of classes will appear that represent the target object. One image has the potential to have several class names. For example, there are several classes in one image, which consist of “gall midge”, “anthracnose”, “health”, and “die back”. The output of this annotation process is a .TXT file which contains several elements, such as class ID, the center x-coordinate of the bounding box, the center y-coordinate of the bounding box, the bounding box normalized width, and the bounding box normalized height.
The advantages of the YOLOv7 version are the implementation of the extended efficient layer aggregation networks (E-ELAN) and model scaling [12]. The three concepts of E-ELAN aim to continuously improve the learning capabilities of the networks by maintaining their original gradient path, which consists of expanding, shuffling, and merging the cardinality. The layer architecture in the transition layer is unchanged by E-ELAN, and only the computational block architecture is changed. The concept of expansion is represented by the utility of group convolution in expanding both channels and the cardinality of the computational block by the same parameter for each computational block in the computational layer. Shuffle is indicated by a computational block that calculates the feature map and shuffles it into g groups, and concatenates them together. This g group is then added to conduct merging cardinality. Fig. 6 depicts the structure of E-ELAN.
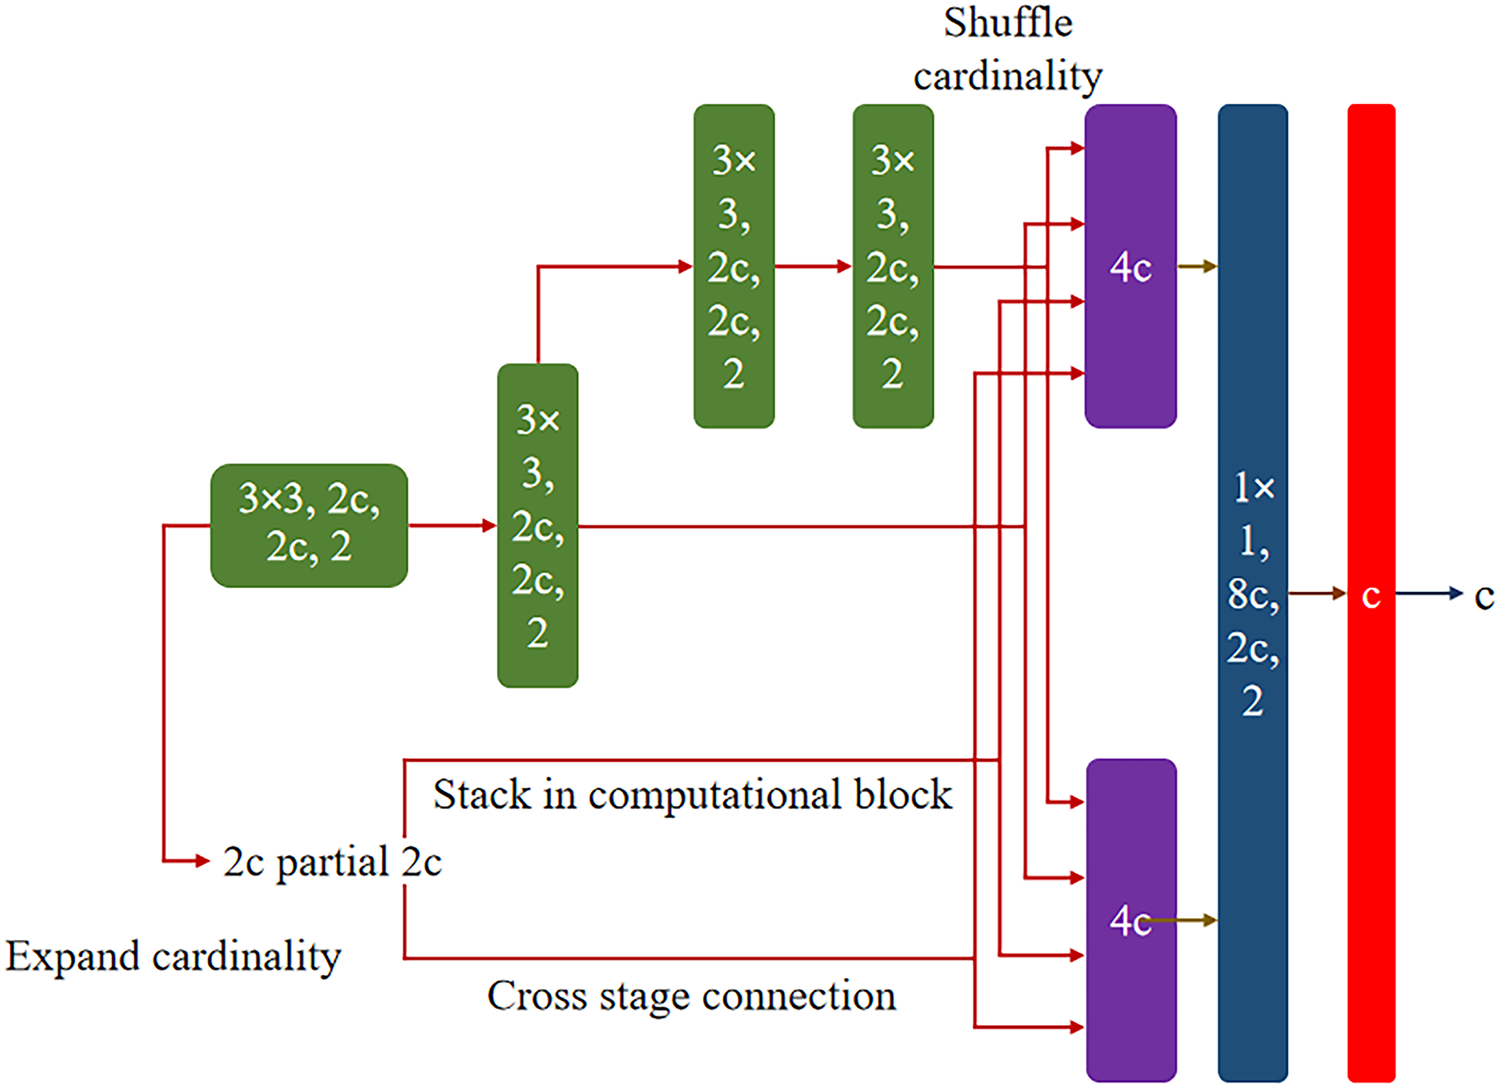
Figure 6: The structure of E-ELAN
The architecture of the YOLOv7-tiny version is depicted in Fig. 7, which consists of several layers, such as CBL, E-LAN, MaxPool, and SPPCSPC. The structure of the YOLOv7-tiny includes the backbone, neck, and head. The backbone structure conducts feature extraction by several layers: CBL, E-ELAN, and MaxPool. YOLOv7-tiny employs SPPCSPC, which is part of the cross-stage partial channel, which also functions to reduce computational costs and enhance the network’s gradient flow. In addition, several concatenation operations and the UpSampling layer were adopted into the neck structure. At the end of the structure, which is represented by the head structure, the three branches are generated to perform object prediction.
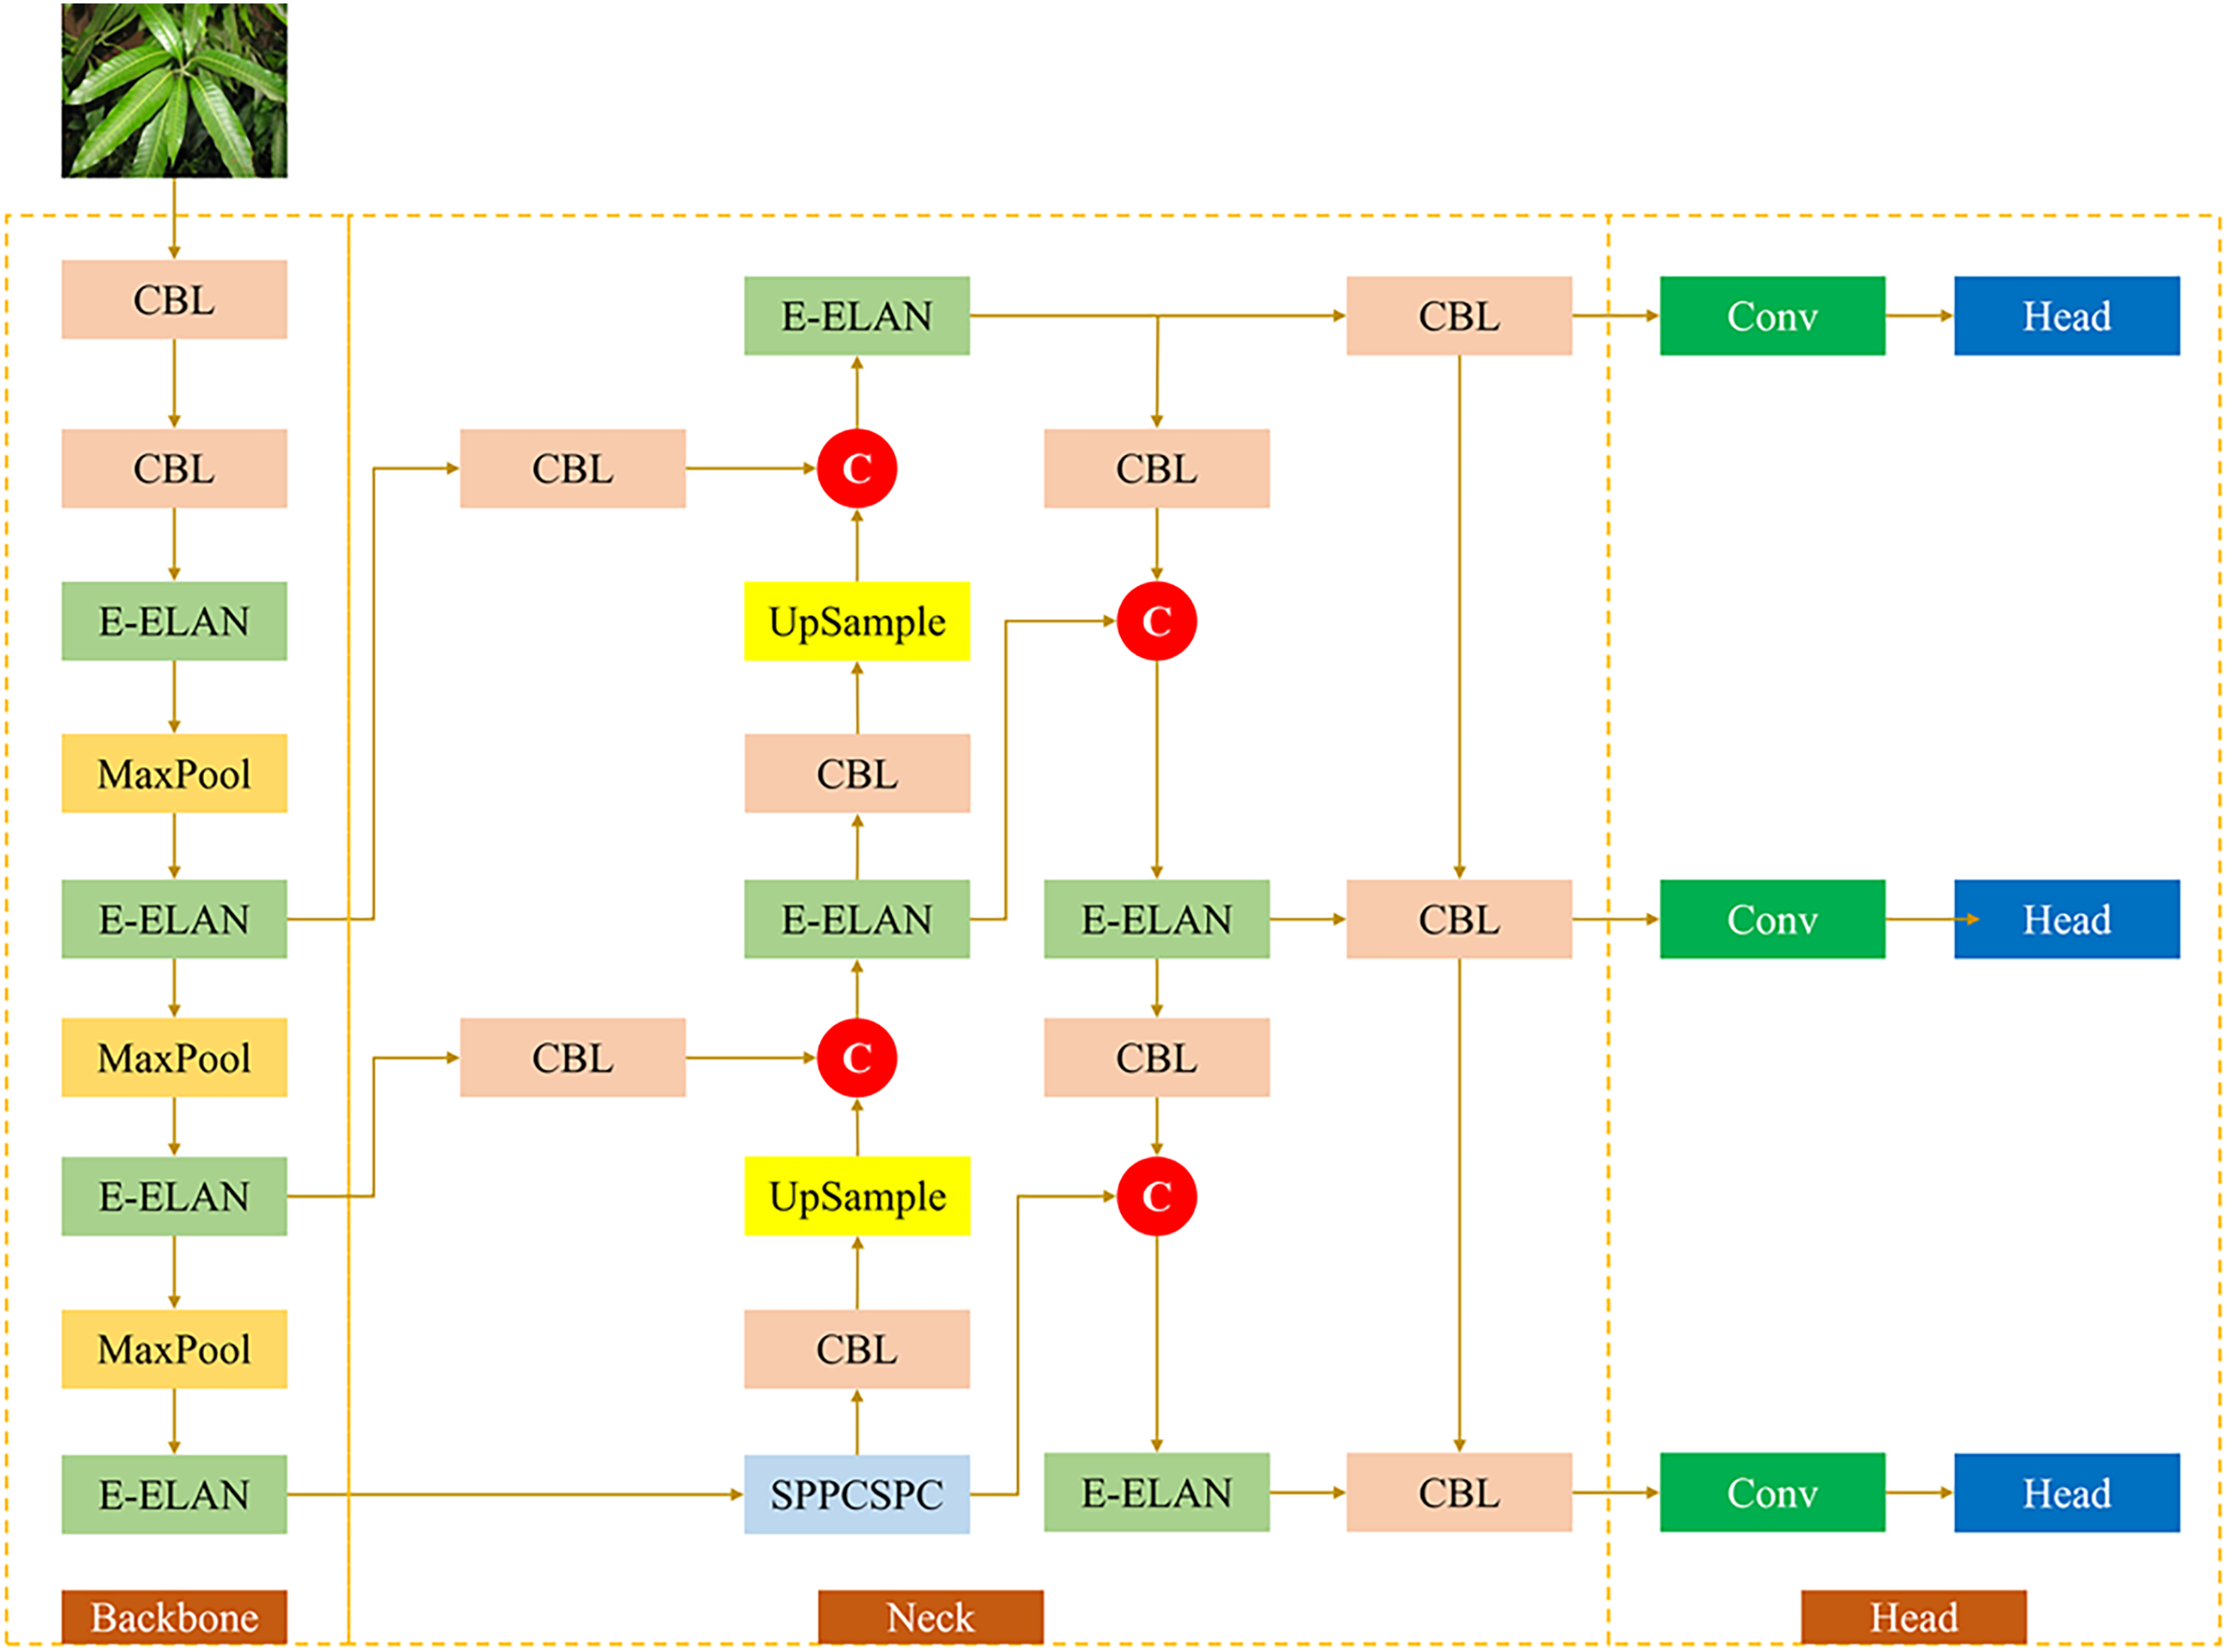
Figure 7: The architecture of YOLOv7-tiny
YOLOv7-tiny incorporates the loss function, which integrates the three loss function elements, including confident loss function, classification loss function, and bounding box regression loss function as denoted by
where
where
where IoU represents the overlap between the bounding box prediction (A) and ground truth (B), which is expressed in Eq. (10).
where A and B denote the area of the prediction box and the ground truth box. The angle cost
where
where
where
where
2.3 The Construction of the C2S Module
As mentioned above, the proposed C2S module is the integration of sub-modules, which consist of CBAM, CA module, and SE module. These three models have advantageous characteristics that, if integrated, will provide the advancement of attention modules regarding capturing short and long dependencies, enhancing feature fusion capabilities, and gaining model efficiency. Fig. 8 depicts the structure of the C2S module. The feature extraction operation is conducted by the CBAM module, where the input feature is processed by the two mechanisms, including the channel attention module (CAM) and spatial attention module (SAM), to obtain the refined feature. Then, the refined features are distributed into the coordinate attention (CA) module in order to enhance the model’s capability regarding capturing the short and long-range dependencies. Therefore, the model is more powerful, adaptable, and has high accuracy detection performance. The output process from this stage has two directions; the first is directly transmitted into a convolutional operation, and the second is then incorporated with the output of the convolutional operation 3 × 3 by the element-wise multiplication, which is finally proceeded by the Conv2D layer. The proposed C2S attention module has a three-stage mechanism fused to increase model sensitivity in capturing only the important information during the feature extraction operation, maintaining the efficiency of the computational cost, parameter, and size. Therefore, implementing the proposed C2S module in the model can address the issues related to the study regarding the implementation of the object detection model in detecting mango leaf diseases, which have random and multi-intersection images, a noisy background, and high target object complexity.
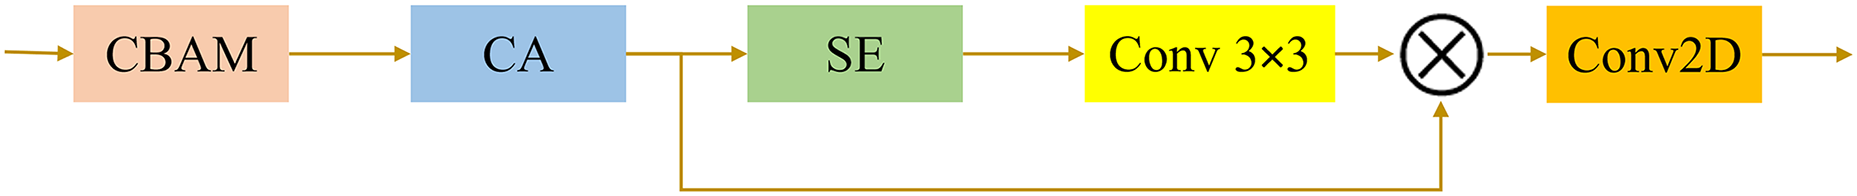
Figure 8: The structure of the C2S module
The detailed structure of the proposed C2S is depicted in Fig. 9, where the module processes an input tensor of size C × H × W (Channels, Height, Width) through multiple parallel and sequential pathways. There are three directions, with two directions going to MaxPool and AvgPool, followed by the multilayer perceptron (SharedMLP), and the other direction going to a multiplication operation along with the merged SharedMLP output to generate channel-wise attention weight. The same mechanism is repeated through two pooling layers and followed by a 7 × 7 convolution layer in order to create spatial attention maps, which are then multiplied with the original input to optimize the features. The next two directions lead to the Conv2d layer and re-weight. The two pooling layers are incorporated after the Conv2d layer, which generates a 1D feature encoding operation represented by C × H × 1 and C × 1 × W. The original input is distributed to the re-weight layer along with the multiplication element-wise output to enhance the accuracy and refine the feature. The GlobalAvgPool layer is involved in the next layer to squeeze the spatial dimension and then followed by a FullyConnected layer, ReLu activation function, and the second FullyConnected layer. Then, the channel attention weight is generated by the Sigmoid activation function. A 3 × 3 convolution layer and Conv2d are incorporated to increase the attention module’s performance.
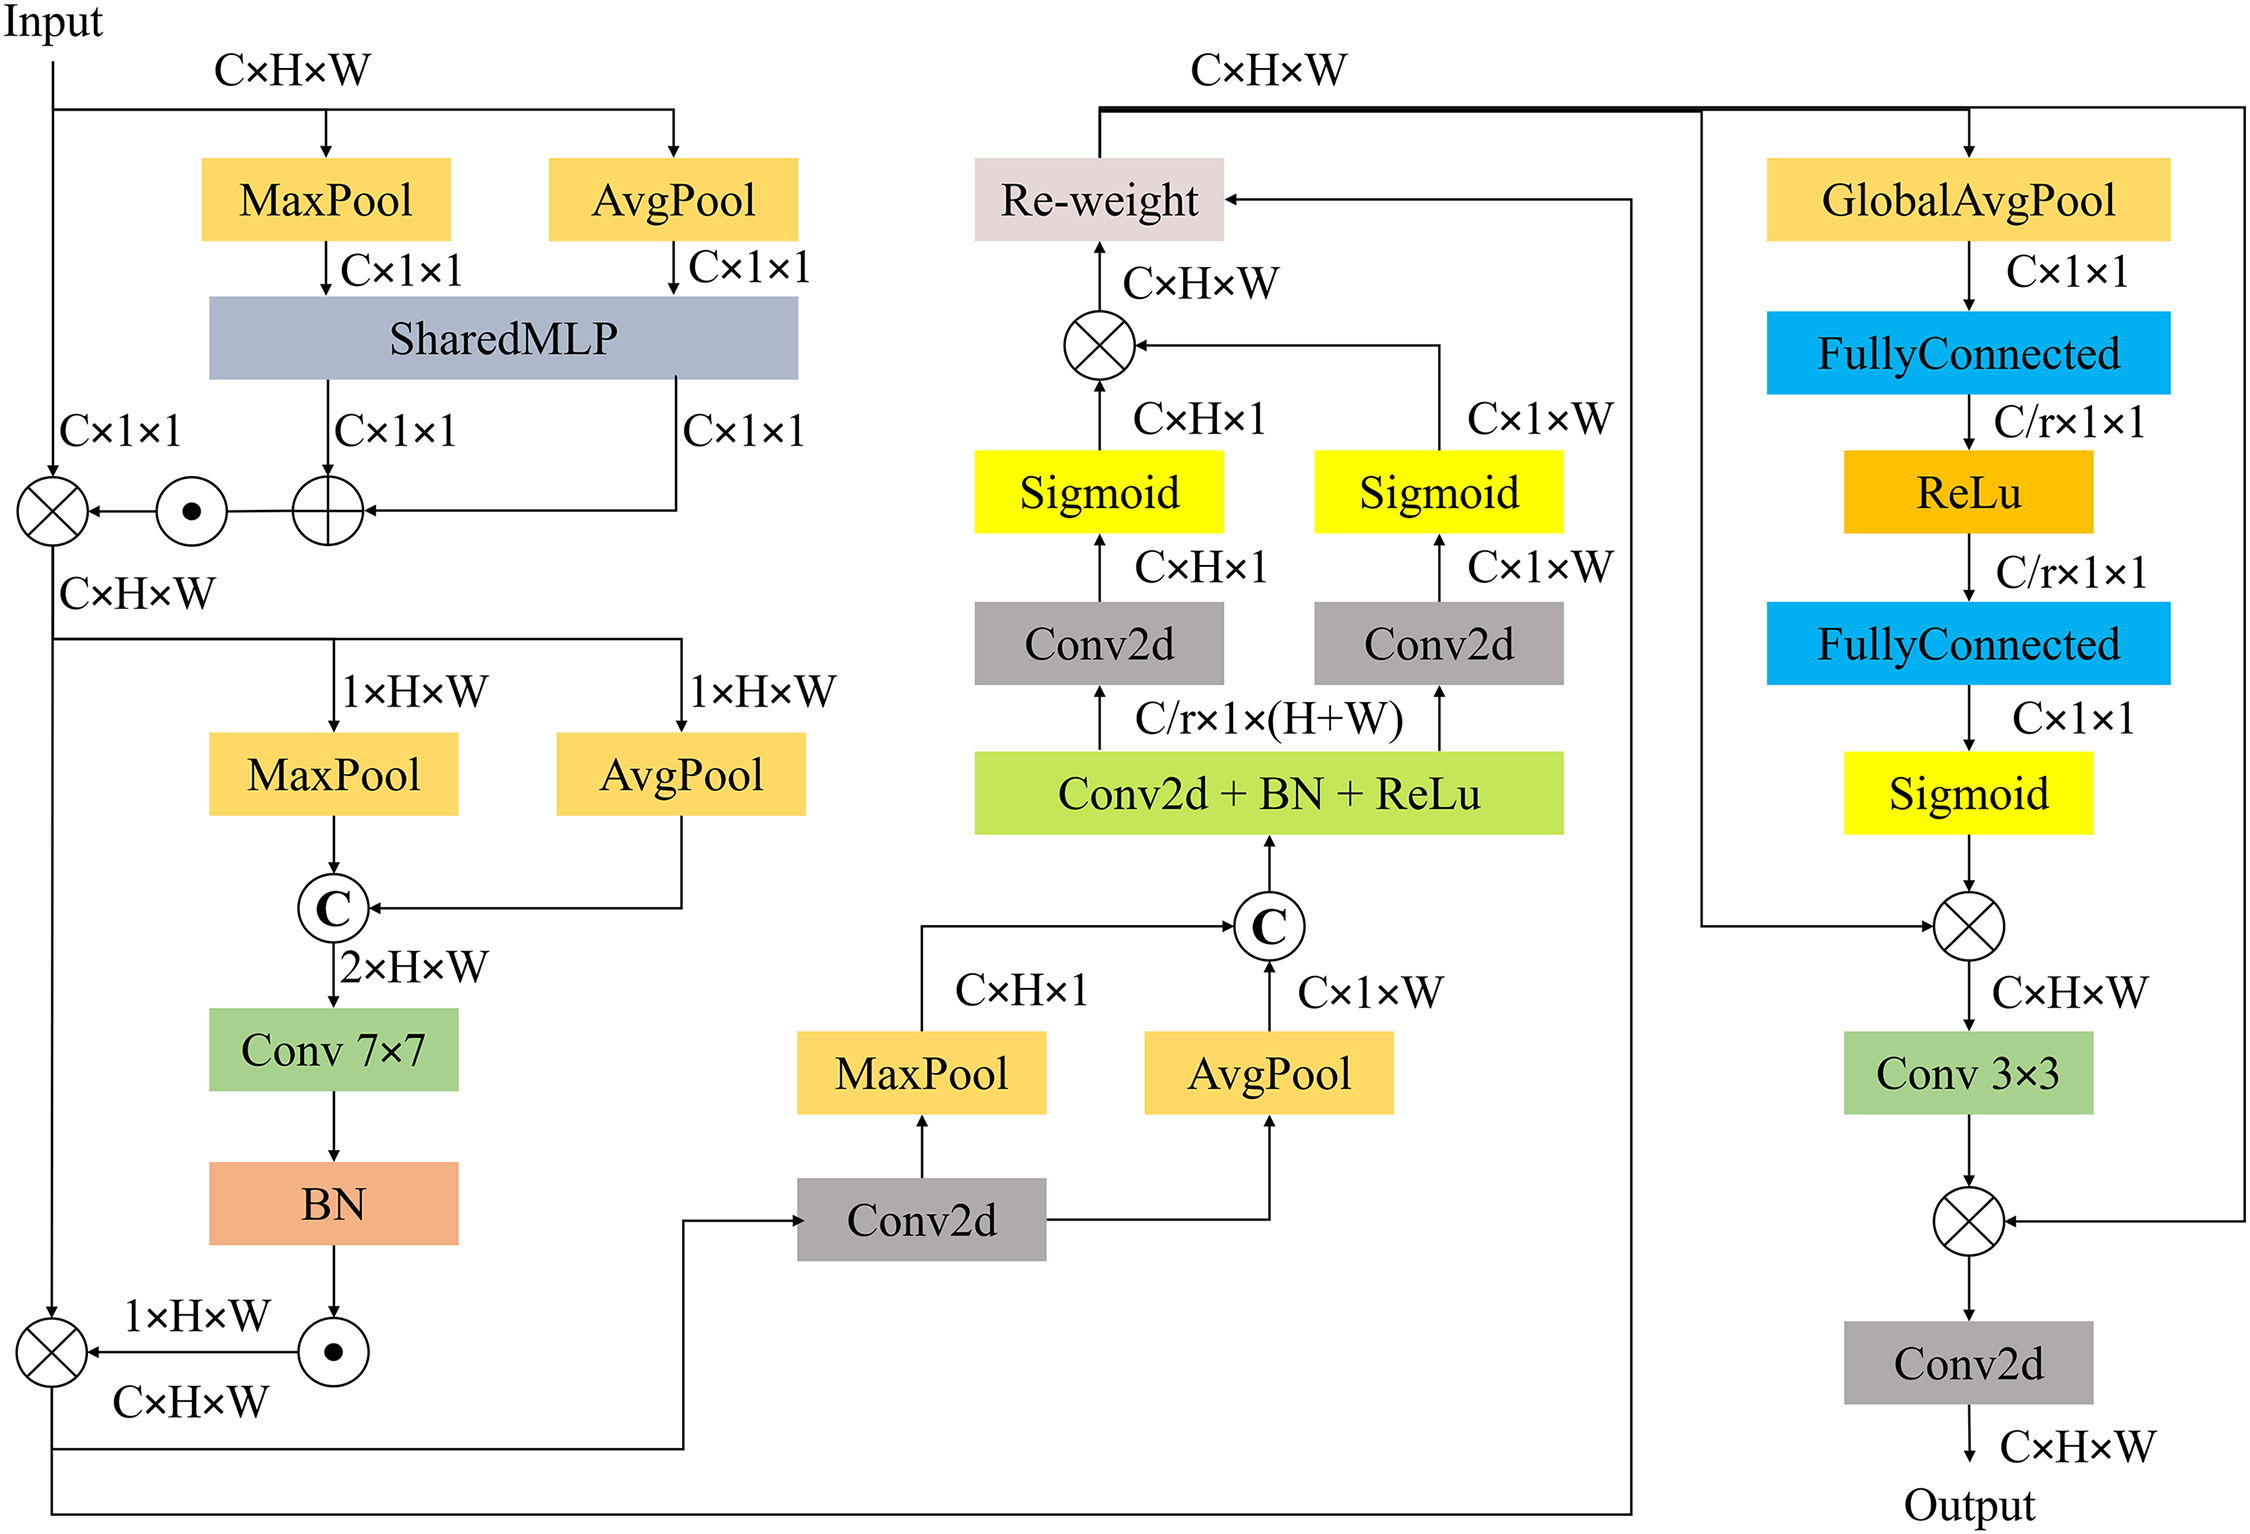
Figure 9: The detailed structure of the C2S module
Convolutional Block Attention Module (CBAM) focuses on how to extract the important information within the image’s features by two principal dimensions, including channel and spatial axes [19]. The mechanism used is the channel attention module (CAM) [20] on the original input feature. The resulting feature based on CAM is then multiplied with the original input feature, which gains the
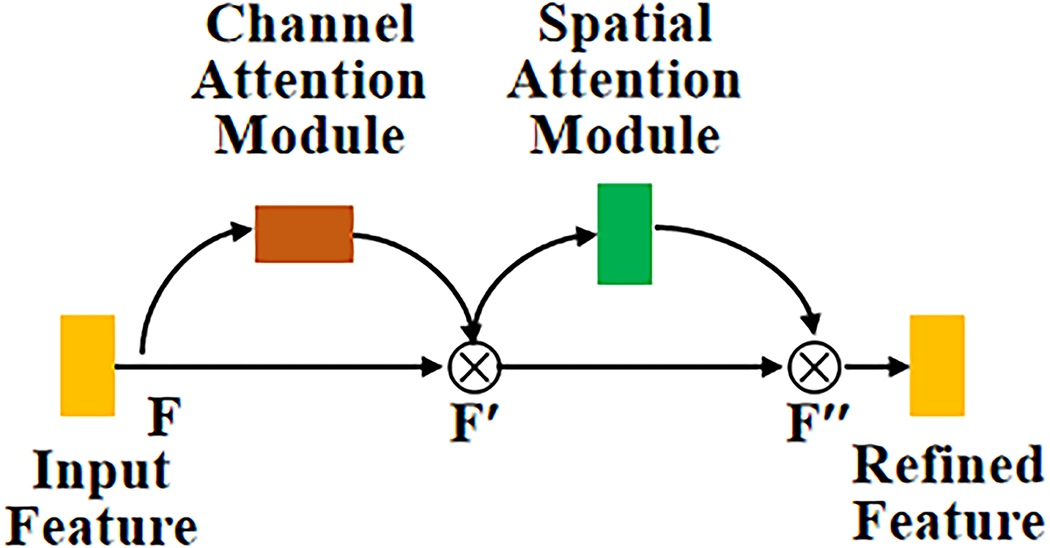
Figure 10: The structure of CBAM
The input feature is represented by
Technically, CAM utilizes the two pooling methods: MaxPool and AvgPool to process the input feature. Then the output process from the pooling operation is forwarded into the shared multi-layer perceptron (MLP), then the two outputs from the shared MLP are forwarded to the convolution layer by the element-wise summation operation to represent
where
The coordinate attention (CA) module has characteristics in the feature tensor transformation that are different from the attention channel. The CA module transforms the feature into two 1D features, and then these features are aggregated. This mechanism enables the CA module to capture long-range dependencies through spatial direction [21]. The overall structure of the CA module is represented in Fig. 11.
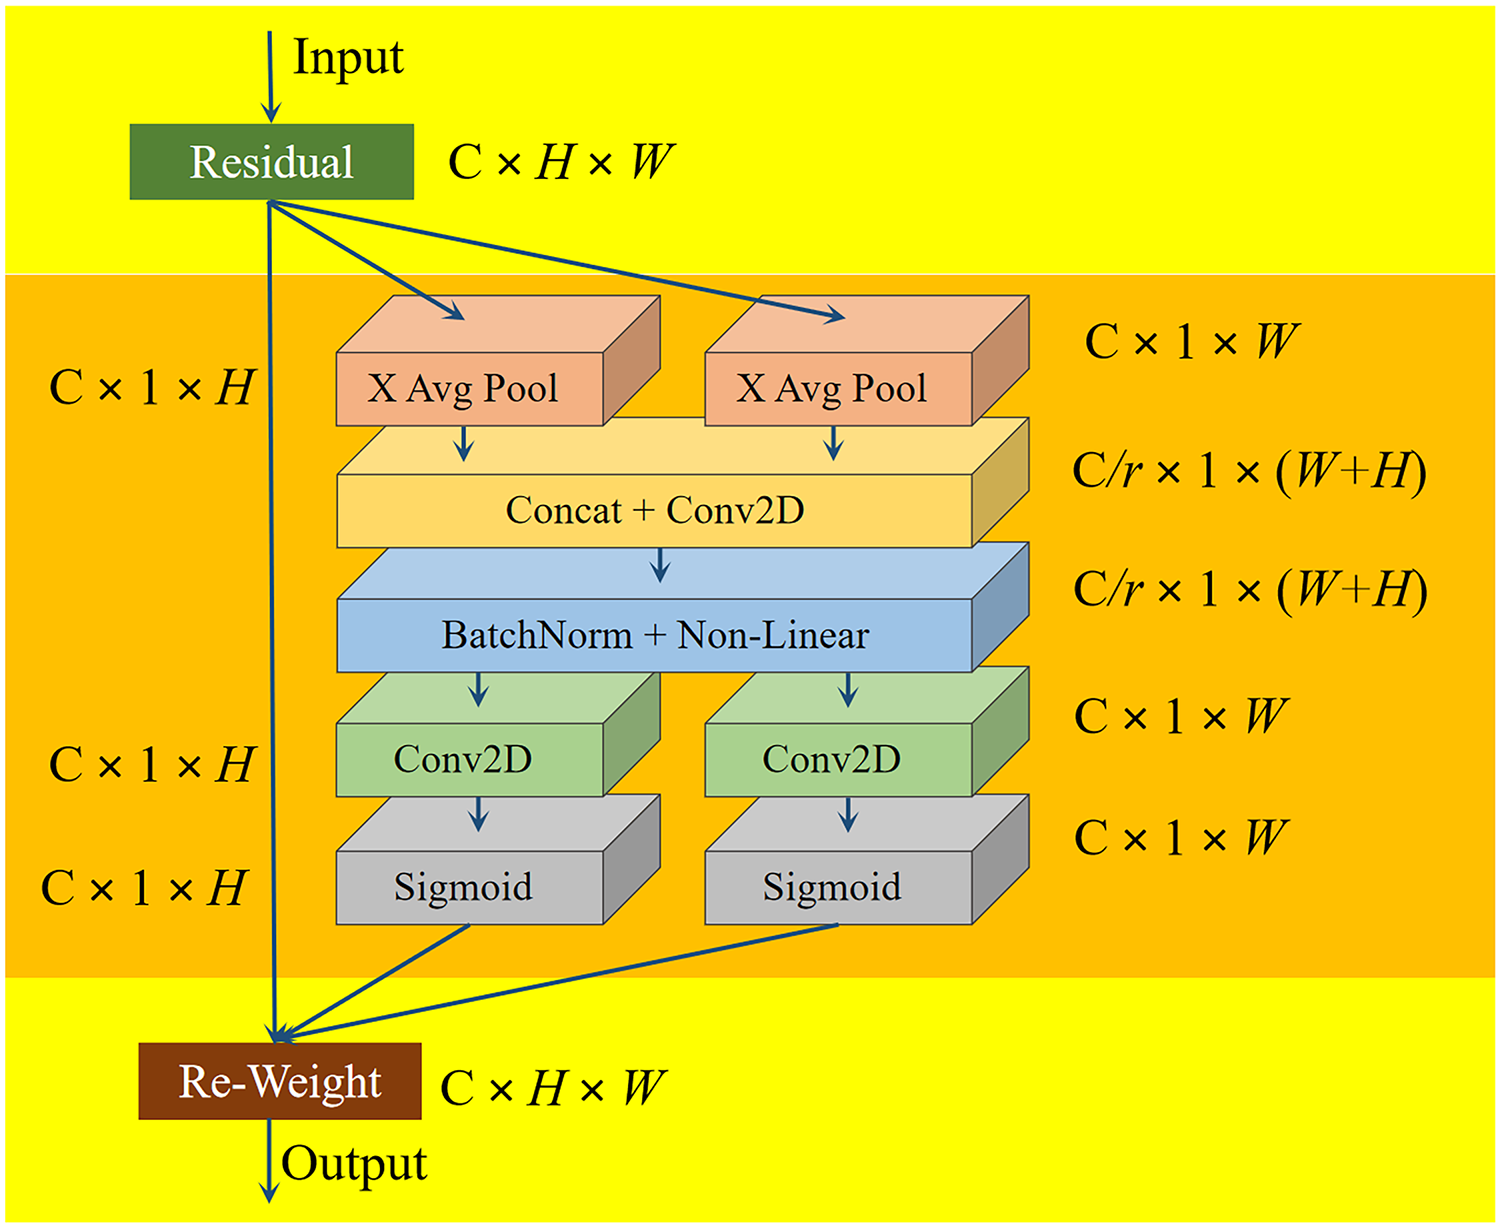
Figure 11: The structure of the CA module
CA module employs several feature tensor as the input that represented by
In CA, Eq. (19) is distributed into two 1D feature encoding operations, including the horizontal and vertical coordinates, which are represented by pooling kernels of
These two directions then aggregate by incorporating the concatenation and are then distributed into transformation function of
where
where
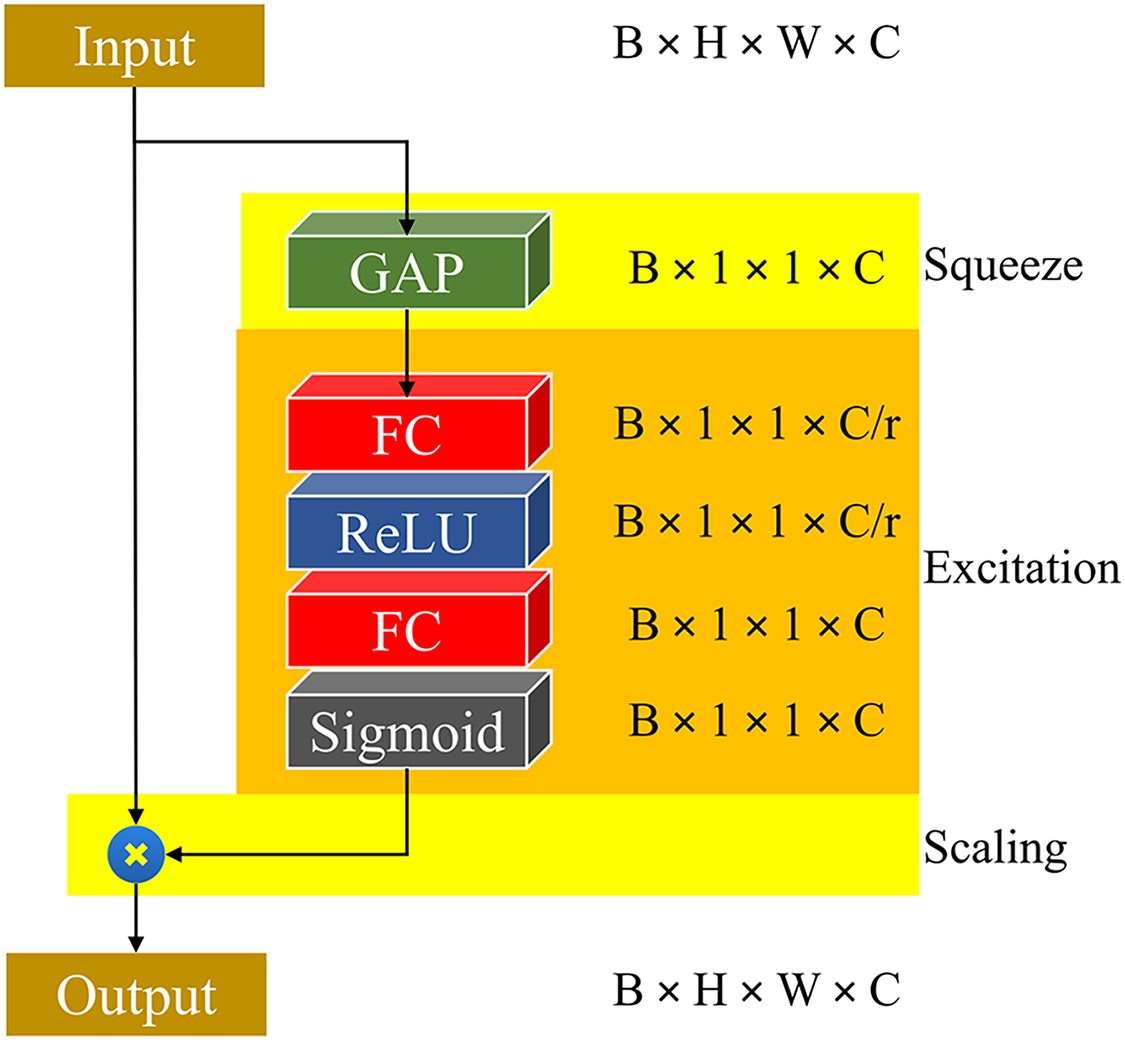
Figure 12: The structure of the SE module
SE blocks structure is consists of computational unit which originally is the transformed of the input
where
The proposed C2S attention module consists of the established sub-modules that have high-performance detection that is adaptive in improving the feature representation by using feature channels and the important regions within the feature map through CBAM, the ability to capture the important information and preserving the long-range dependency through the CA module, while maintaining its computational cost. And the integrated SE modules, which systematically perform a “squeeze” process on the spatial dimension by involving GAP operation, which is then reprocessed with “excitation” by multiplying the original feature map by a set of weights. Therefore, through the integration of sub-modules, the proposed C2C is powerful in feature extraction capability to enhance tiny object detection performance with the minimum computational cost. Several attention modules have been developed in the previous study, such as the position attention module developed by Liu et al. [23], which is implemented in the U-Net model for obtaining more context information. The contextual information is encoded into local features and technically consists of three layers; the first layer conducts reshaping and transposing, the second feature map layer triggers the softmax activation function before being distributed into a feature note chart, a multiplication operation is involved within the output of the feature note chart, and the third layer is the feature map. Ji et al. [24] construct the efficient channel-time attention module (ETAM), which is a combination of efficient channel attention and a temporal attention module. The purpose of the ETAM module is to improve the reconstruction quality and compression efficiency implemented in the image compression method. The initial module structure implements GAP operation, followed by one-dimensional convolution to generate the weights of channel-wise attention and model the interaction of local cross-channels. Then, the sigmoid activation function is used to normalize the channel’s weight. The second layer of the input is directly involved in the multiplication operation with the output of the efficient channel attention module, which is then distributed to the TAM module. Meanwhile, Chen et al. [25] developed the lightweight dual attention module (LDAM) that integrates several attention modules, including the efficient channel attention (ECA) module, simple attention module (SimAM), and pixel attention guided (Pag) module. The proposed LDAM module is placed in a feature learning structure, which is initially integrated with a convolutional layer and followed by the depthwise convolutional layer. The purpose of LDAM implementation is to allow the neural network to classify the malware, including raw binary and memory images, effectively. In addition, enhancing the deep learning model accuracy, EfficientNet in classifying the vehicle system malware.
2.4 The Proposed Lightweight Mango Leaf Disease Detection
Fig. 13 represents the architecture of the proposed lightweight model in which the C2S is integrated into the original model YOLOv7-Tiny. The position of the embedded C2S module consists of three layers connecting the neck and head structure of the YOLOv7-Tiny model. The implementation of the C2S module in this position is a representation of the most optimal module placement through comparative experiments of C2S module positions at several locations, including the backbone, neck, and head. Technically, the comparative experiment result of different C2S positions will be discussed in Section 3.2. The integration of the C2S module in the original YOLOv7-tiny model can increase the detection model performance, including capturing long-range dependency, enhancing the model’s accuracy, and improving the feature fusion operation to achieve information feature sensitivity. The evaluation of model performance will be conducted by several experiments, such as model performance analysis, comparative experiments, and an ablation study. The complete intersection of union (CIoU) loss function is involved in the proposed model to perform bounding box regression measurement comprehensively and effectively, which incorporates the three fundamental geometric factors, including overlap area, central point distance, and consistency of aspect ratio. The CIoU is the extended version of distance IoT (DIoU), which aims to address the issue regarding the aspect ratio. The formulation of CIoU is represented in Eq. (27).
where
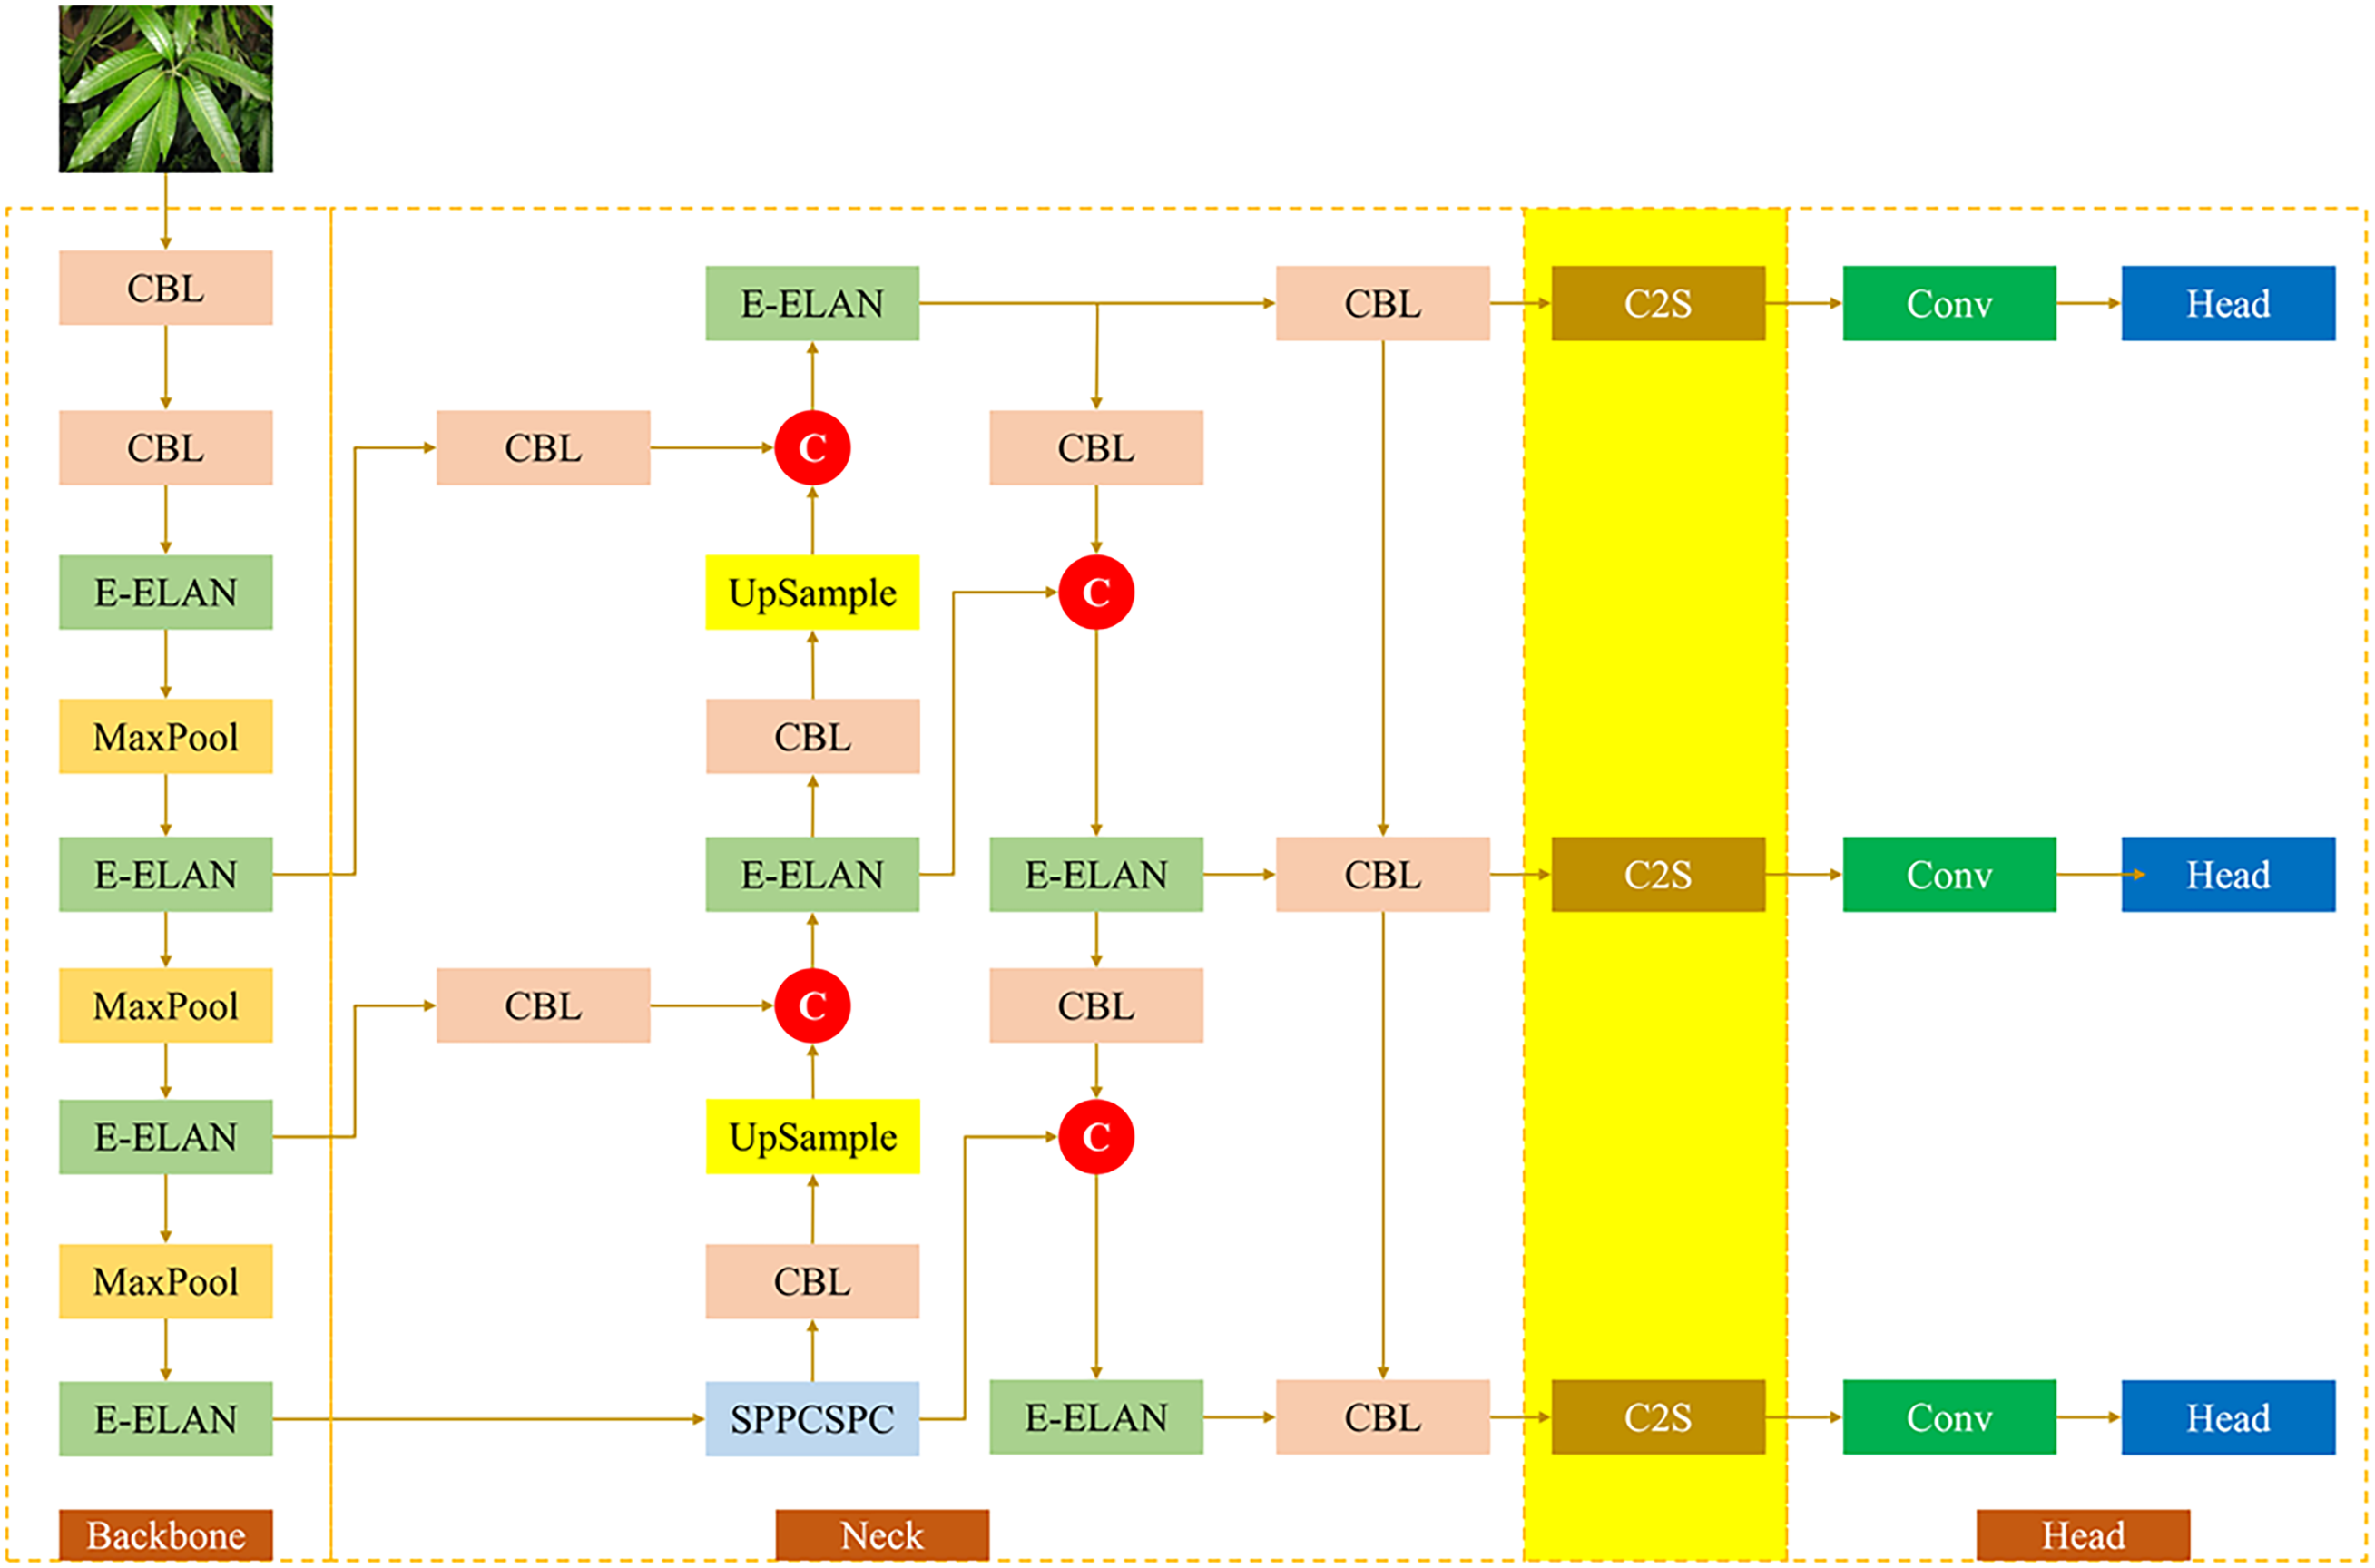
Figure 13: The proposed model architecture
2.5 The Experimental Configuration
The technical stages carried out in this study are represented in Fig. 14, where the initial stage is determining and collecting images of mango leaves based on eight classes, then the image augmentation technique is implemented to enhance the data set size, which is later divided into training, validating, and testing data. The next stage is developing the C2S module and conducting comparative experiments by implementing the C2S module into different positions in the original YOLOv7-tiny to determine which position has the optimal result. Several experiments will be conducted to evaluate model performance, including model performance on the dataset, ablation, study, comparative experiment, which involves different deep learning algorithms, and model implementation into a practical application.
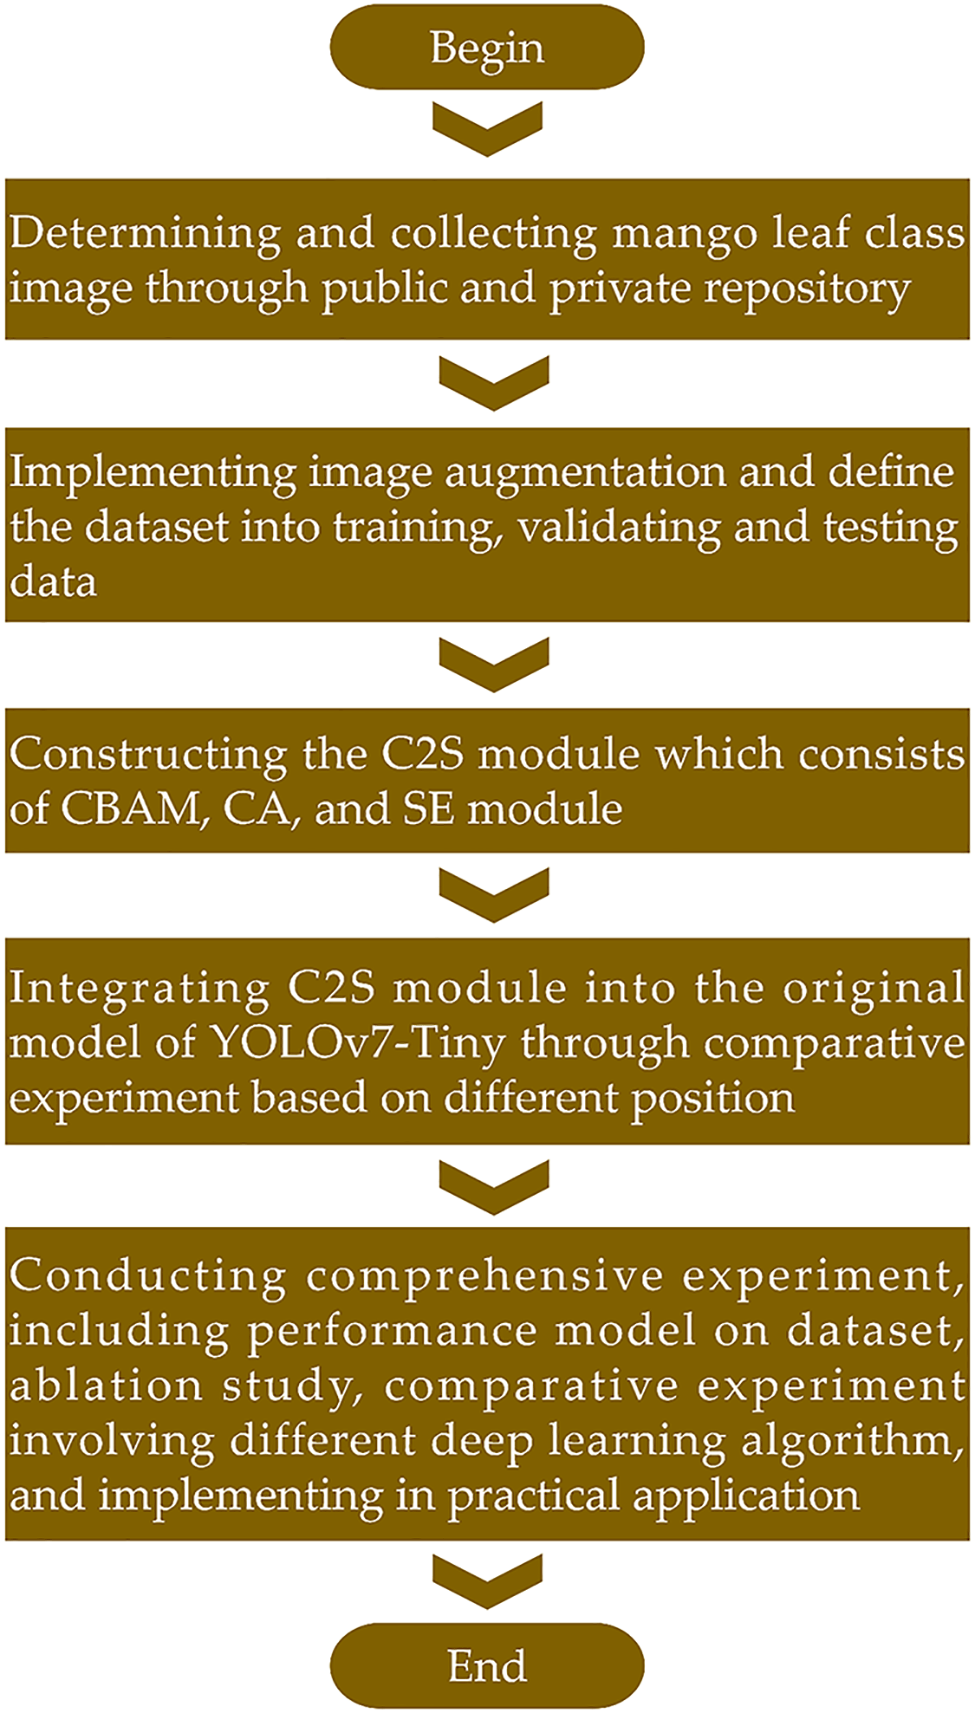
Figure 14: Experimental flowchart of the study
2.5.1 Hardware and Software Specification
Several hardware and software components are included in the study to optimize the proposed model experiment, such as:
(a) GeForce RTX 4070 GPU
GeForce RTX 4070 is equipped with 3rd-gen RT Cores and 4th-gen Tensor Cores. It supports CUDA cores of 5888, 184 TMUs (texture mapping units), and 46 RT cores (ray tracing). In addition, GeForce RTX 4070 is supported by 64 ROPs (raster operation units) and the interface of 192-bit. It has a built-in 3× port connection for display and an HDMI port. Memory capacity is 12 Giga-byte GDDR6X RAM with an optimal speed of 21 Gbps. Two cooling fans are placed to enable keeping the cool temperature in the entire system. The maximum power draw rate is 200 W, and the minimum power requirement is 650 W. Fig. 15 represents the GPU of NVIDIA GeForce RTX 4070. Several hardware and software components are included in the study to optimize the proposed model experiment, such as:
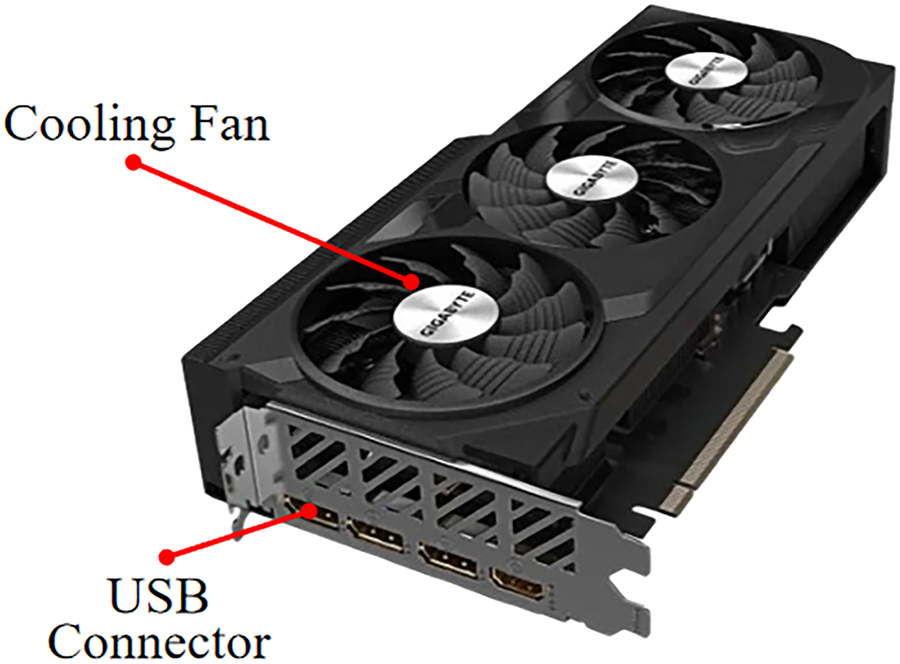
Figure 15: NVIDIA GeForce RTX 4070
(b) CPU Intel 13th Gen Intel® Core™ i5-13500
Released by Intel, which has a total cores and threads of 14 cores and 20, respectively. The maximum turbo frequency is 4.80 GHz, the efficient-core maximum turbo frequency is 3.50 GHz, the performance-core base frequency is 2.50 GHz, and the efficient-core base frequency is 1.80 GHz. Processor base power is 65 W, and maximum turbo power is 154 W.
(c) Logitech Camera 960-001063
Built in 3 mega-pixel camera with a maximum resolution of 1280 × 720 pixels, supports video modes of 720p. The connector is USB 2.0 and black in color. The supported operating system includes Windows and Mac. The minimum processor speed and RAM are 1 GHz and 512 megabytes, respectively.
(d) LabelImg
LabelImg is an image annotation tool that aims to make labels by drawing the bounding box on the target or instance object, as represented in Fig. 16. Annotation is an important part for developing an object detection model; thus, the model can understand the context object detected [26]. LabelImg has the advantages, including being user-friendly, having low memory consumption, and being plug-and-play.
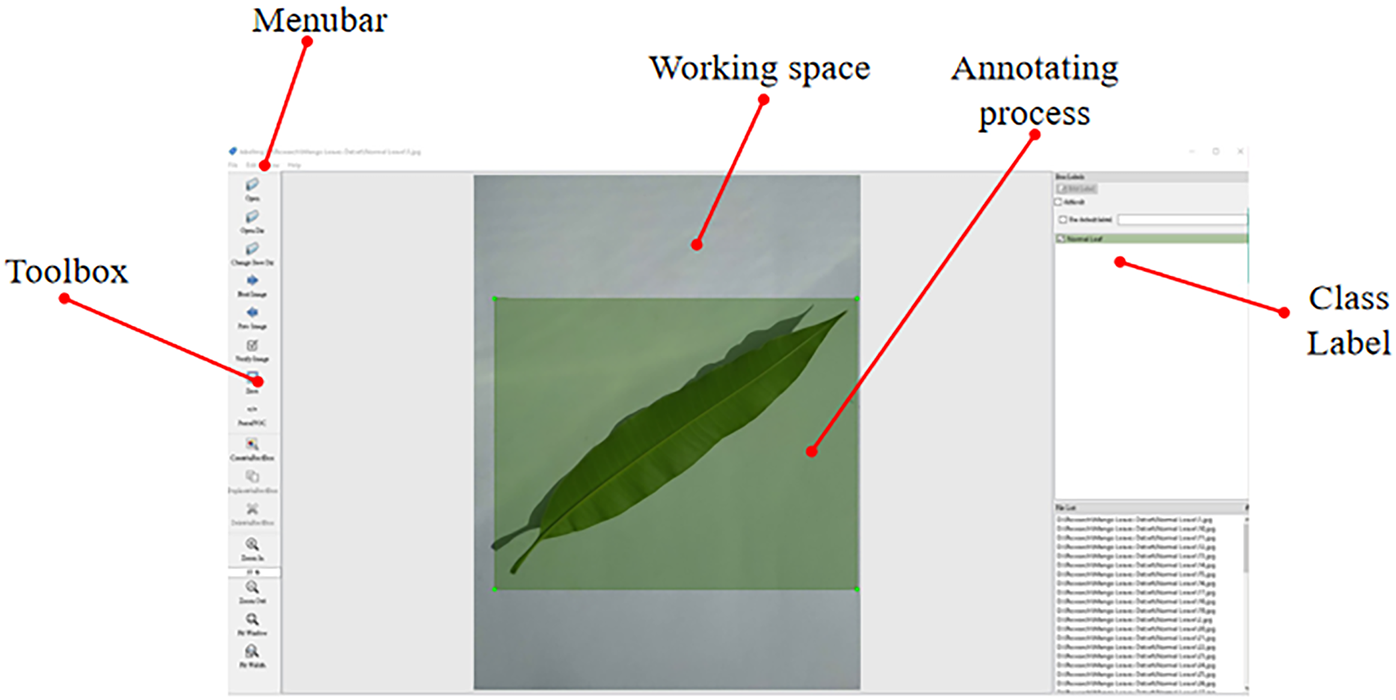
Figure 16: IDE of LabelImg software
(e) OpenCV
OpenCV stands for open source computer vision, which is an open source library which natively written in C++, but can support other programming languages such as Java, JavaScript, and Python. There are more than 2500 optimized algorithm libraries, both classic and state-of-the-art computer vision algorithms, whose purpose for image manipulation, face recognition, eye tracking, object movement, etc. In this study, OpenCV will be utilized to implement image augmentation by rotation, flipping, and scaling.
In order to validate the model performance, we need performance indicators as the evaluation metrics. The two highlighted model performances will be evaluated, including detection performance and model efficiency. Detection performance is represented by indicator metrics such as precision, recall, F1-score, and mean average precision (mAP). Meanwhile, model efficiency is indicated by model size and number of parameters. Precision represents the model’s ability to predict data that is positive or true positive (TP) [27]. The higher the precision, the easier it will be for the model to avoid false positives (FP), so that the model will be more reliable. The formulation refers to Eq. (28).
Recall, also known as sensitivity, represents the model’s ability to detect how much the correct result of the model is based on the positive case, or TP. The higher recall indicates the model can minimize false negatives (FN), as formulated in Eq. (29).
F1-score represents the harmonious value of recall and precision. The higher value of F1-score indicates the model has a high value for both precision and recall, which model can effectively identify the actual positive value or TP while avoiding both FP and FN. Eq. (30) represents the formulation of the F1-score.
mAP represents the model’s detection capability, which is the average of the Average Precision (AP) over all the model’s classes. The trade-off between recall and precision is incorporated in mAP [28], which also considers both FP and FN. The overall formulation is in Eq. (31).
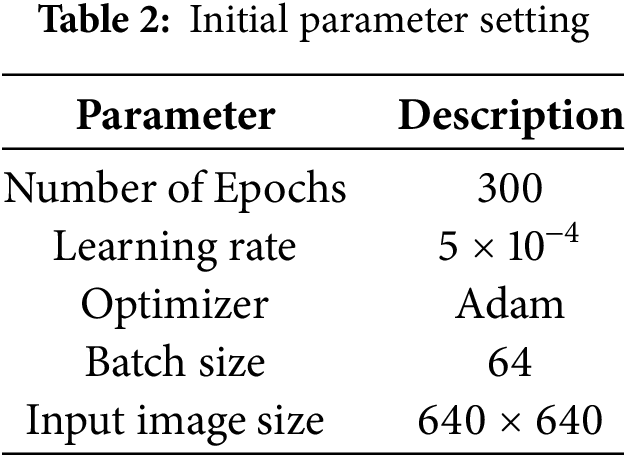
This section represents the findings from several experiments, including an analysis of the proposed model on a dataset that indicates which class has achieved the optimal results. Validation of the C2S module is also conducted to evaluate which module location within the architecture provides the best performance. In addition, an ablation study, comparative experiments based on different deep learning algorithms, and model deployment are conducted to validate the proposed model’s performance. The initial hyperparameter becomes the reference standard in conducting the experiment to provide an objective and optimal result. Table 2 represents the initial hyperparameters in the study.
3.1 The Proposed Model Analysis on the Dataset
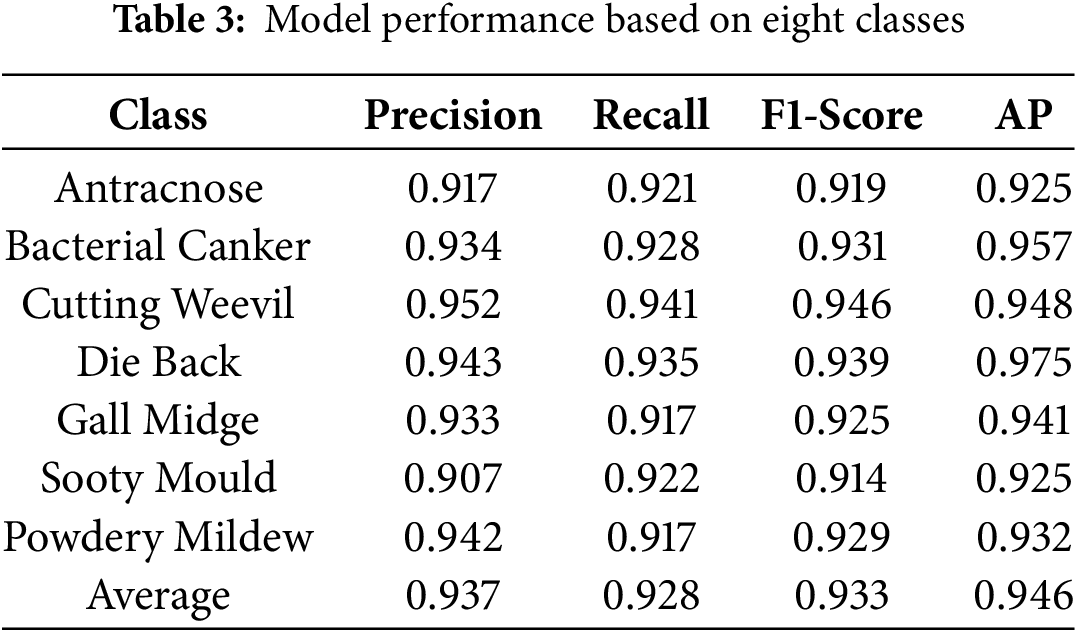
Table 3 represents the experimental results based on eight classes, which are indicated by four metrics, including precision, recall, F1-score, and average precision (AP). The average result of precision metrics is higher than 0.9, which indicates the good performance of the trained model. However, several classes have the lowest value for each metric indicator. For example, the “sooty mold” class gained the precision value of 0.907, which means that the ability of the model in positive prediction in that class is lower compared to the other class. By contrast, the class “sooty mold” is not the lowest value for the metric indicator “recall”, which has the value of 0.922, which is higher compared to “anthracnose”, “gall midge”, and “powdery mildew”. Meanwhile, the highest value of precision result is in the class “health”, which gains the result value of 0.970. The average value of recall metrics is 0.928, which has the top two results, including “cutting weevil” and “health”, which generate the values of 0.941 and 0.944, respectively. The recall metric represents the sensitivity of the model, which means the capability of the model to find all the relevant objects within the entire image. F1-score, which is the harmonic value of precision and recall, represents the average result of 0.933. Meanwhile, AP represents the model performance accuracy for each class, indicating the optimal performance that achieves an AP higher than 0.9. The top three classes consist of “bacterial canker”, “die back”, and “health”, which gain the AP value of 0.957, 0.975, and 0.962, respectively. The average AP value, called mAP, achieves the value of 0.946.
The training and validation loss of the proposed model is represented in Fig. 17, which is indicated by black and red line colors, respectively. The loss value indicates the discrepancy between the prediction task by the proposed model and the annotation of the ground truth. The lower loss value represents that the model is more robust and accurate in predicting both bounding box localization and classification tasks. The training loss value in the initial epoch is 2.0, whereas the validation loss is about 2.3. In the first 100 epochs, there was a significant decrease in the loss value of both training and validation loss. At the end of epoch 300, the training and validation loss values gained the result of 0.050 and 0.058, respectively.
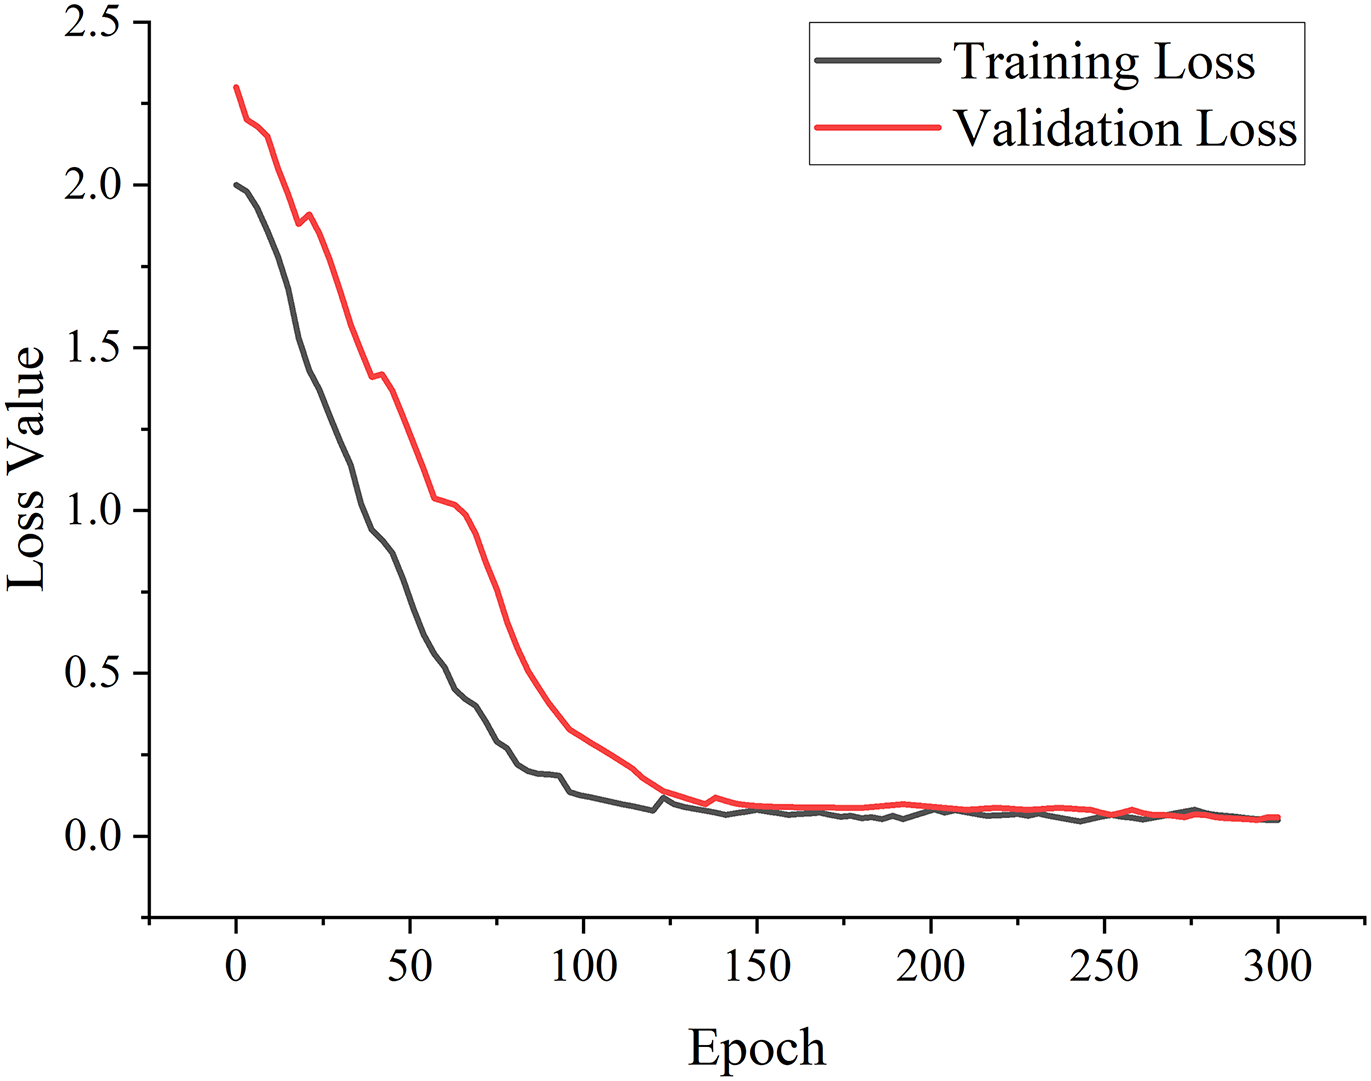
Figure 17: Training and validation loss value of the proposed model
3.2 Comparative Experiment on Different C2S Module Positions
In order to validate the proposed C2S module performance, a comparative experiment is conducted by integrating the C2S module into five different positions in the architecture of YOLOv10. Fig. 18 depicts the module configuration experiments placed in five different locations, which are indicated by P1, P2, P3, P4, and P5. P1 and P2 are placed between the backbone and neck structure, which connects the second and the third E-ELAN modules and the CBL module in the neck structure. P3 is placed between the fourth E-ELAN module in the backbone structure and the SPPCSPC module in the neck structure. P4 is placed in the neck structure, which connects E-ELAN and CBL within two layers. Meanwhile, P5 consists of three layers that connect the CBL module in the neck structure and head structure. In this experiment, the hyperparameter configuration of the training model refers to Table 4.
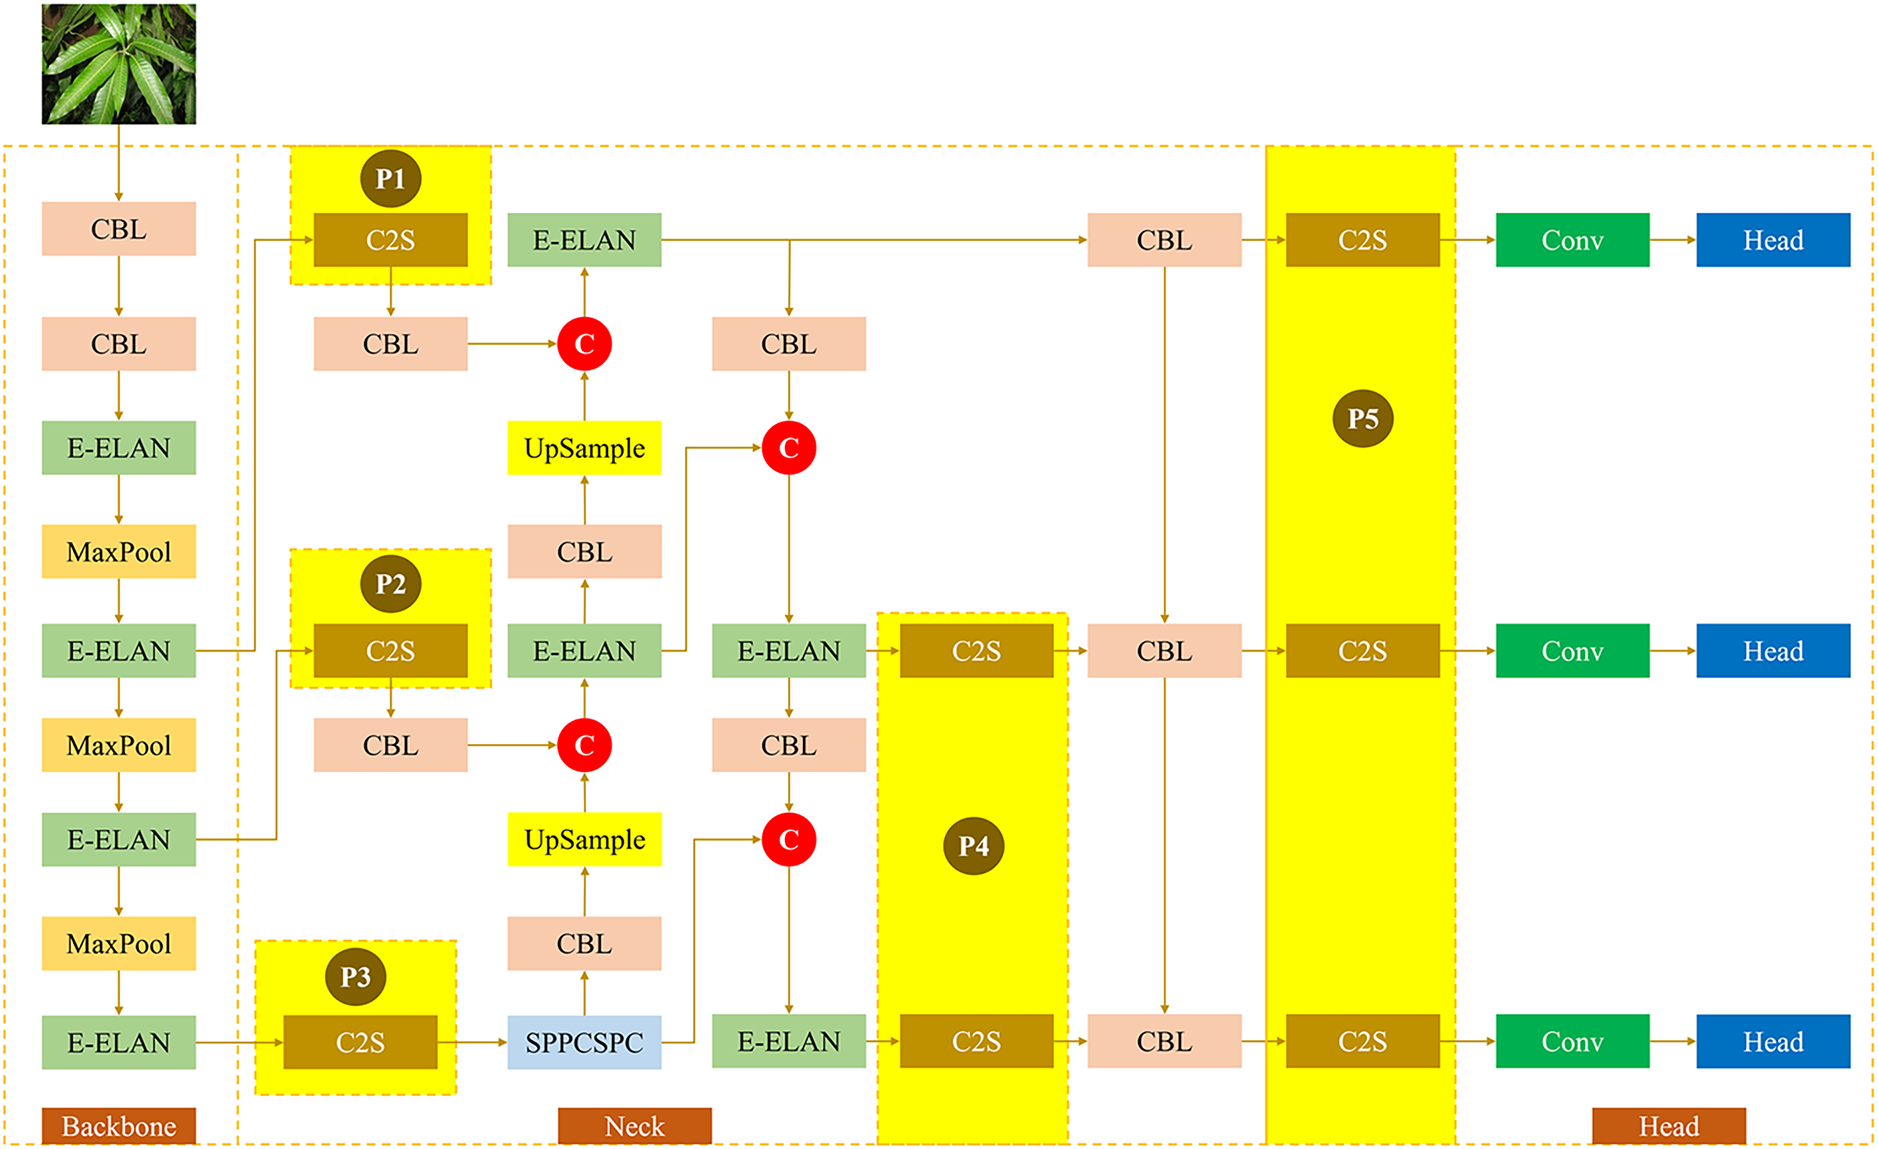
Figure 18: Five positions of the C2S module
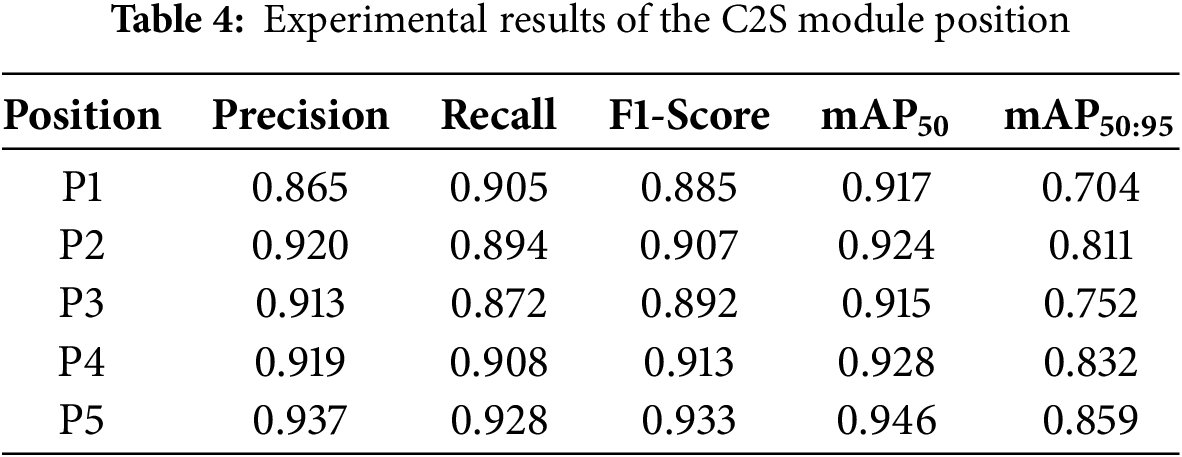
The experimental results of the C2S module position are represented in Table 4, which consists of five metric indicators, including precision, recall, F1-score, mAP50, and mAP50:95. In terms of precision, all models have a value higher than 0.5, except P1, which gained a value of 0.865. While in metrics of recall, there are two models that have a value under 0.9, including P2 and P3, which have the values of 0.894 and 0.872, respectively. The other model has achieved a value higher than 0.9, which consists of P1, P4, and P5. The F1-score also has two models that achieved values under 0.9, such as P1 and P3, with the F1-score of 0.885 and 0.892. The top two of the F1-score are P4 and P5, which gain 0.913 and 0.933, respectively. Meanwhile, mAP50 indicates that all of the models have achieved a value greater than 0.9, with the highest value being P5. The two lowest mAP50 are P1 and P3, which have the values of 0.917 and 0.915, respectively. The metrics of mAP50:95 that represent the mAP within the threshold between 0.50 to 0.95 indicate the P5 model has achieved the highest results with the value of 0.895. There are two models that have a value under 0.8, including P1 and P3. While P2 and P3 have the value of 0.811 and 0.832, respectively. Based on this C2S module position, it is concluded that P5 has the optimal results for all evaluation metrics of model performance. If it is analyzed further, the implementation of P1, P2, and P3 in the model structure has one embedded layer that conducts the single process of the attention module mechanism. By contrast, the P4 model has a double layer, which means double processing for the implemented attention mechanism in the model architecture. Therefore, as a consequence, the model size, parameter complexity, and computational cost will also be enhanced. However, the proposed C2S module consists of sub-modules which has good adaptability and maintain computational efficiency, such as the ability to reduce parameter complexity. Thus, either the number of parameters or the model size obtained will not increase significantly. This is also adopted in the P5 model, which has three layers to perform the processing of the implemented attention mechanism. Although the training result of the P5 model has gained the highest accuracy and has three embedded layers, the increase in computational cost is acceptable and not significant compared to the P1, P2, P3, and P4. In conclusion, the P5 model has been evaluated as having the optimal result and the best position attention module configuration, which will later be adopted into the proposed lightweight mango leaf disease detection architecture.
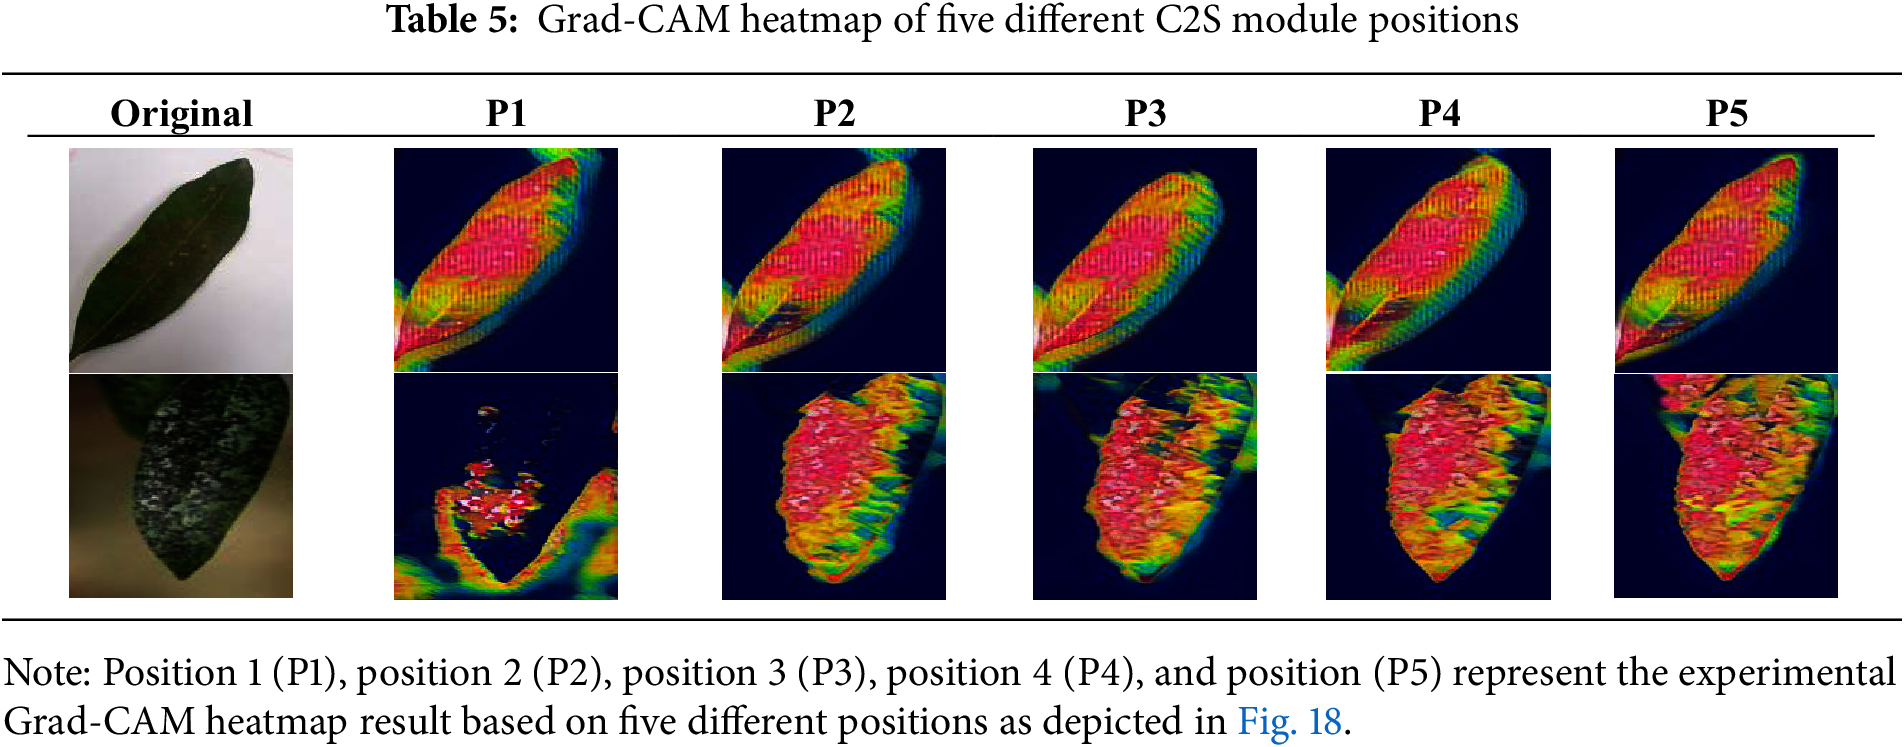
Table 5 represents the gradient-weighted class activation mapping (Grad-CAM) heatmap of five C2S positions. The purpose of this validation was to determine the optimal position of the five C2S module positions, including P1, P2, P3, P4, and P5. In the first row, P1 and P2 produce overlapping heatmaps at the top and bottom of the object. Meanwhile, in P3, the heatmap output does not cover the entire target area, especially at the top of the target object. P5 has an optimal representation, showing a balanced heatmap and selecting the entire target object. The second row represents a more complex object with low light conditions and has a blurred target object. P1 has a suboptimal output, as the model cannot select the target object. The heatmaps on P2, P3, and P4 represent a much stronger and more concentrated focus on the lesion area. P5 has the strongest heatmap results, indicated by intense concentration on the lesion area and demonstrating the model’s ability to localize the diseased part of the mango leaf. From the condition of the heatmap, P5 position has more focus on the lesion on the object compared to other positions
An ablation study is conducted to evaluate the attention module’s performance within the lightweight module. In this experiment, a combination of single and multiple attention modules that integrate into the baseline model, YOLOv7-tiny, was carried out. There are eight models that will be incorporated into the ablation study experiment, as represented in Table 6. The first model is the baseline model, which represents the original model. Model 1, Model 2, and Model 3 are the integration between baseline and single module, which consists of CBAM, CA, and SE modules. Models 4, 5, and 6 are a combination of the baseline model and the two single modules. For example, model 5 is the integrated model between the baseline and the module of CBAM and SE. The proposed model is the combination of baseline and C2S, which is the integration of CBAM, CA, and SE modules. The baseline model represents the F1-score of 0.805 and mAP50 of 0.836, while in the proposed model, there is an increase in F1-score, mAP50, and mAP50:95 of 15.90%, 13.16%, and 23.60%, respectively. However, in the combination of baseline and single models, such as model 1, model 2, and model 3, the increase is not significant. For example, in model 1, the increase of F1-score, mAP50, and mAP50:95 are under 10%, which are 4.28%, 6.94%, and 4.17%, respectively.
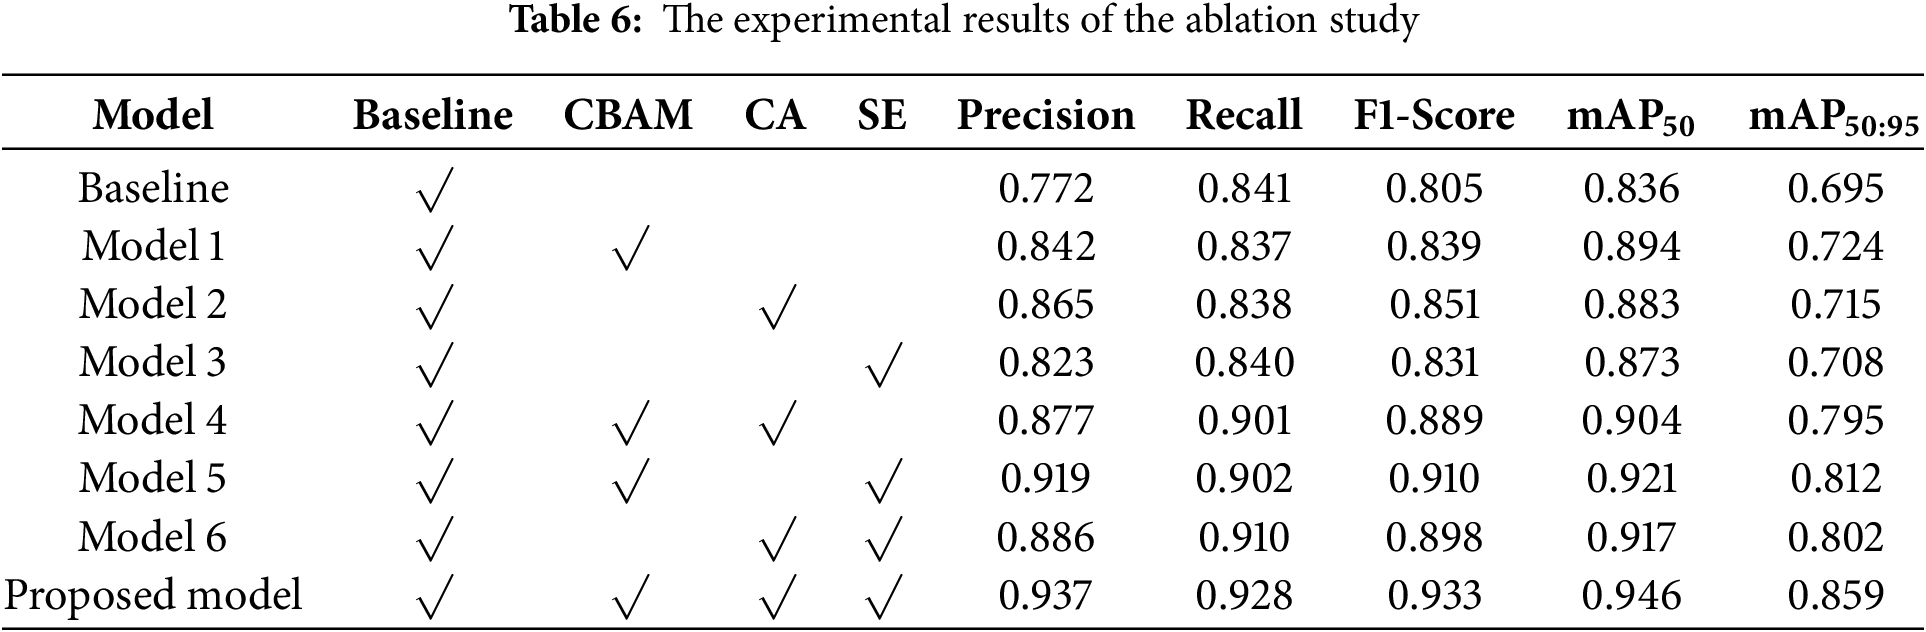
Table 7 represents how efficient the eight models are on edge computing devices, which consist of four indicator metrics, including model weight (megabytes or MB), power consumption (watts or W), memory usage (gigabytes or GB), and real-time inference latency (frames per second or FPS). The baseline model generates a model weight value of 6.8 MB and has the lowest power consumption compared to other models. Compared to the baseline model, the proposed model has 2 W higher power consumption, compared to the baseline model, which produces 5.5 W. On the memory usage metrics, the entire model has a value under 1 GB. The baseline model still has the smallest value, which gains 0.653 GB of the memory usage, while models 4, 5, 6, and the proposed model have the memory usage of 0.825, 0.847, 0.801, and 0.876 GB, respectively. Meanwhile, the real-time inference latency of all the models is in the range of 20 FPS to 22 FPS.
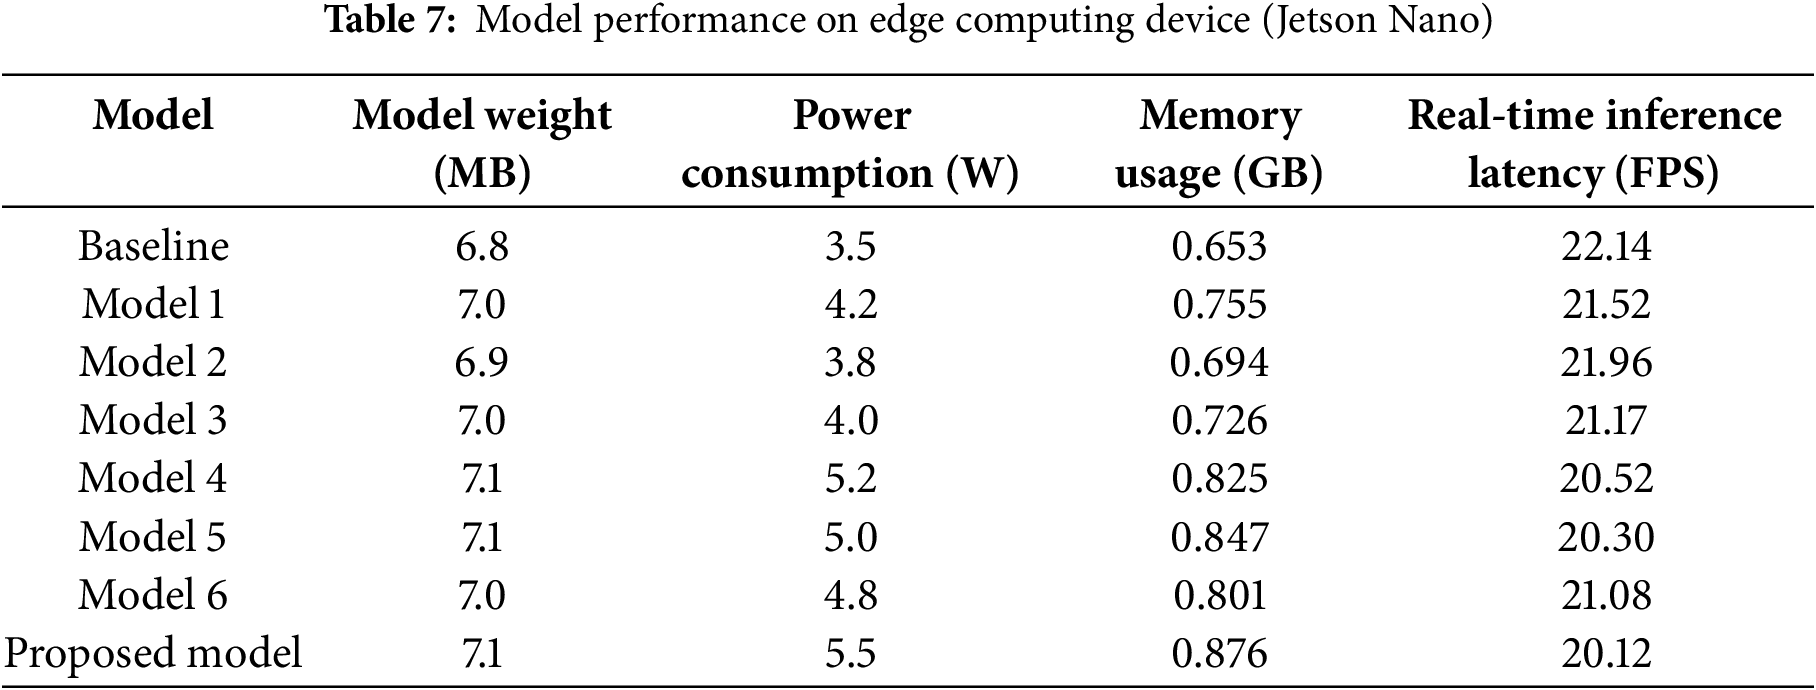
Fig. 19 represents the mAP values, including mAP50 and mAP50:95, which are indicated by red and green colors, respectively. The baseline model has the lowest mAP50 and mAP50:95, which yield the values of 0.836 and 0.695, respectively. Model 3, which is a combination of baseline and SE module, has achieved the mAP50 and mAP50:95 values of 0.873 and 0.708, respectively. The combination of baseline and two modules indicates the mAP50 has gained a value greater than 0.9, as depicted in model 6, which represents the mAP50 value of 0.917. Meanwhile, the proposed model, which implements the C2S module, has the highest values of mAP50 and mAP50:95, achieving values of 0.946 and 0.859, respectively. On average, models that implement a single module, such as model 1, model 2, and model 3, have an average increase in mAP50 of 5.35% which consists of the increasing percentage of 6.45%, 5.32%, and 4.24%, respectively. Model 4, Model 5, and Model 6, which are the integration of baseline and the combination of two modules, have achieved the increasing percentage of 7.52%, 9.23%, and 8.83% with an average increasing percentage of 8.53%. Meanwhile, the proposed model, as mentioned above, has a higher percentage increase compared to the combined single or two modules. The proposed model implements the C2S module, which integrates the three modules, including CBAM, CA, and the SE module, thus enhancing the performance of the model’s detection ability.
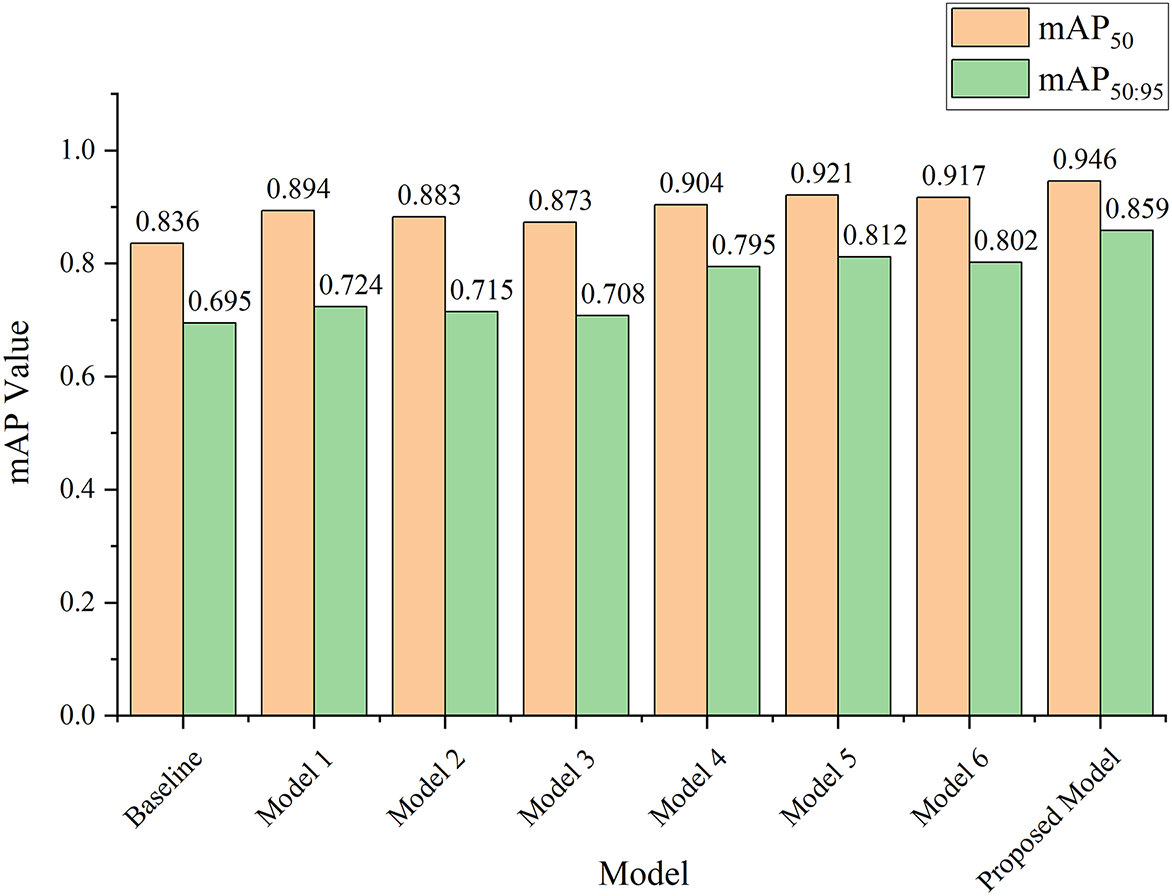
Figure 19: The results of the mAP value for each model
Fig. 20 depicts the inference latency and power consumption of the eight models incorporated in the ablation study. Mostly, the combination of two attention modules has a higher power consumption compared to the single attention module of the baseline model. This happens because in this study, a major fundamental change is not conducted to the structure of the model, for example, replacing the backbone structure with the attention mechanism, but embedding the attention mechanism into the model structure; therefore, the power consumption slightly increased.
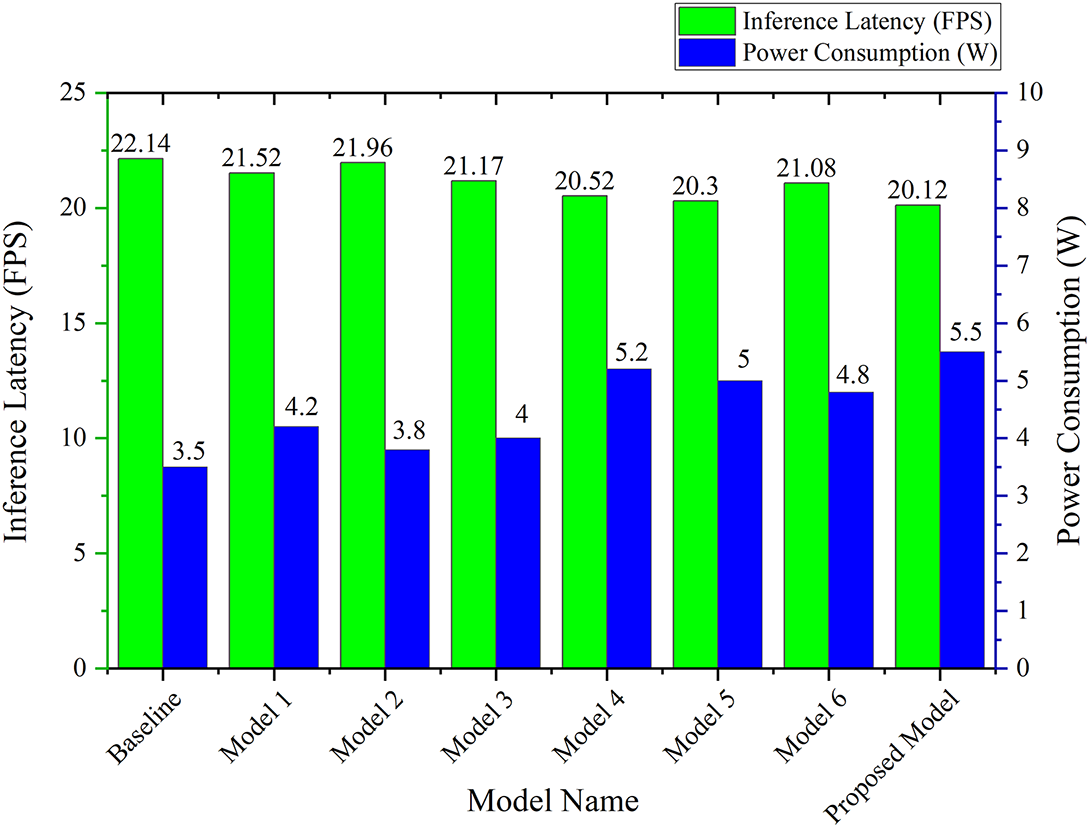
Figure 20: Inference latency and power consumption of each model on Jetson Nano
3.4 Model Performance on Different Deep Learning Algorithms
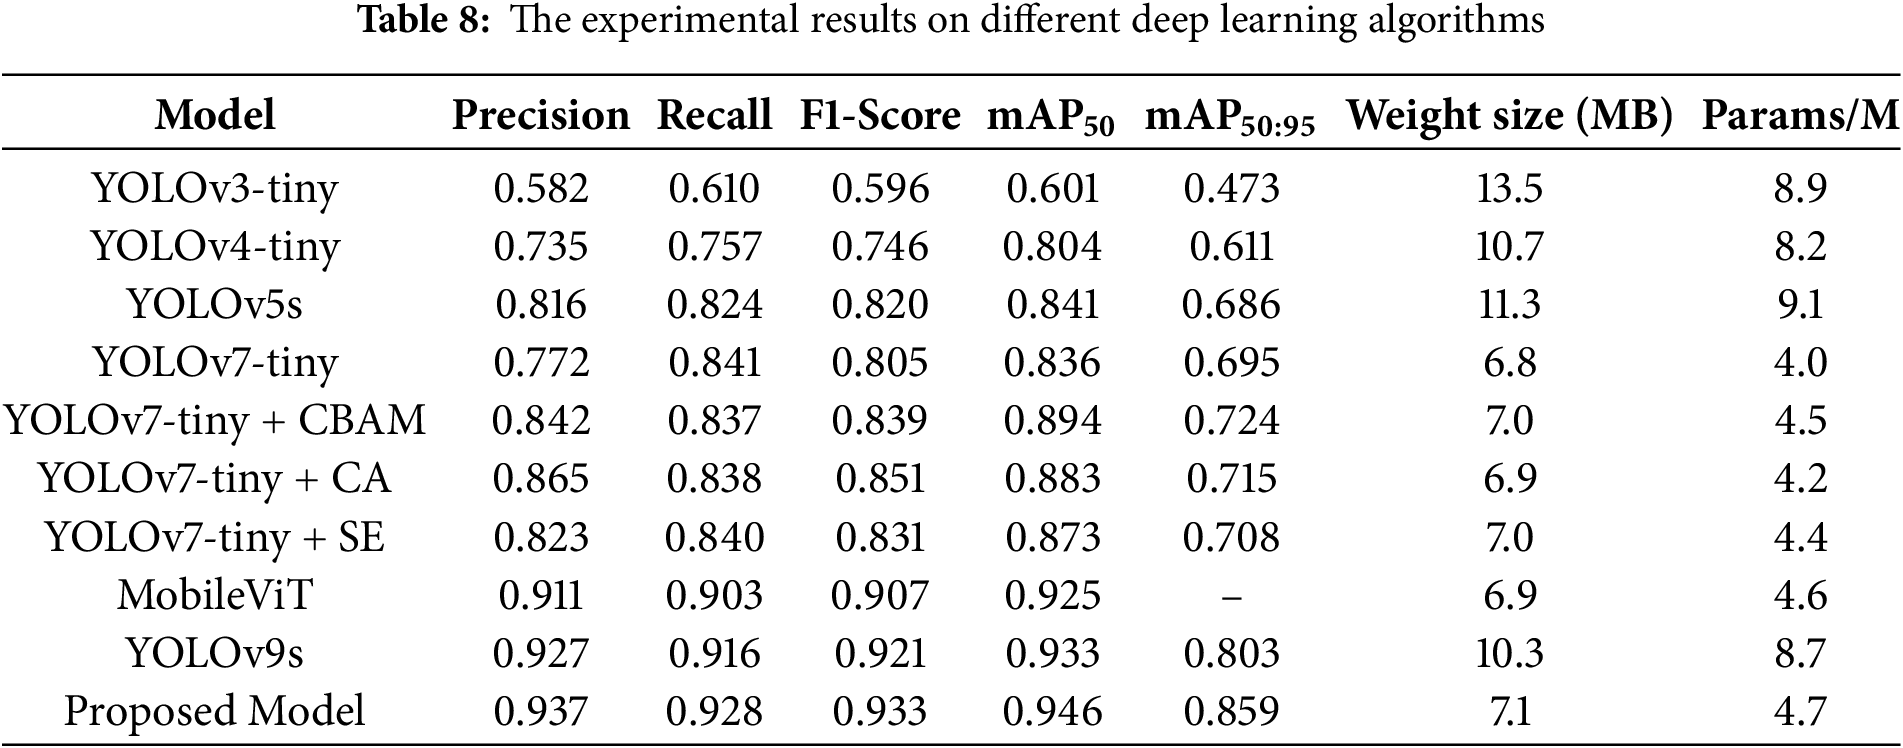
The ten different deep learning algorithms are incorporated in the comparative experiment to evaluate the performance of the proposed model, including YOLOv3-tiny, YOLOv4-tiny, YOLOv5s, YOLOv7-tiny, YOLOv7-tiny + CBAM, YOLOv7-tiny + CA, YOLOv7-tiny + SE, MobileViT, YOLOv9s, and the proposed model. In the previous experiment metrics indicator focuses on detection performance; meanwhile, in this experiment, the model efficiency indicator will be involved, which consists of weight size (MB) and number of parameters (Params/M). Table 8 represents the experimental results of the deep learning algorithm. YOLOv3-Tiny has a lower detection performance compared to other algorithms, where precision, recall, F1-Score, mAP50, and mAP50:95 have achieved the result of 0.582, 0.610, 0.596, 0.601, and 0.473, respectively. In terms of precision, the three models, including MobileViT, YOLOv9s, and the proposed model, have a value higher than 0.9, while YOLOv5 has achieved 0.816. YOLOv4-Tiny and YOLOv7-Tiny have the values of 0.735 and 0.772, respectively. The combined YOLOv7-tiny and attention module, such as YOLOv7-tiny + CBAM, YOLOv7-tiny + CA, and YOLOv7-tiny + SE, has a precision value higher than 0.8, which obtains the value of 0.842, 0.865, and 0.823, respectively. In aspect of recall metrics, five models have the range value between higher than 0.8 and under the value of 0.9, which consists of YOLOv5s, YOLOv7-tiny, YOLOv7-tiny + CBAM, YOLOv7-tiny + CA, and YOLOv7-tiny + SE. While the proposed model achieves the highest recall value compared to the other algorithms and MobileViT and YOLOv9s gained the recall values of 0.911 and 0.927, respectively. Otherwise, YOLOv3-tiny has achieved the value of the recall only 0.610. mAP50 of the five algorithms represents that the proposed model has gained the highest value, that is, 0.946. The six models, including YOLOv4-tiny, YOLOv5s, YOLOv7-tiny, YOLOv7-tiny + CBAM, YOLOv7-tiny + CA, and YOLOv7-tiny + SE, achieved the mAP50 value of 0.804, 0.841, 0.836, 0.894, 0.883, and 0.873, respectively. MobileViT and YOLOv9s have achieved the mAP50 value of 0.925 and 0.933, respectively.
The weight size and number of parameter results are depicted in Fig. 21, where the x-axis represents the number of parameters and the y-axis is mAP50. Ten different models were placed in different positions on the scatter graph. YOLOv3-Tiny is in the right-bottom position, which indicates a high model size but has low performance of mAP50. While YOLOv5s has achieved the highest model size, which gains 11.3 MB, the mAP50 is 0.841. YOLOv7-Tiny, which is indicated by a triangle-red shape, is in the left-side position with a model size of 4.0 MB, while the proposed model has a model size of 4.7 MB. The combination of YOLOv7-tiny + CBAM, YOLOv7-tiny + CA, and YOLOv7-tiny + SE has obtained the model size of 4.5, 4.2, and 4.4 MB, respectively. The model size of the proposed model is 17.5% higher compared to the original model, YOLOv7-Tiny. However, the proposed model has achieved the highest performance mAP50 compared to other deep learning algorithms.
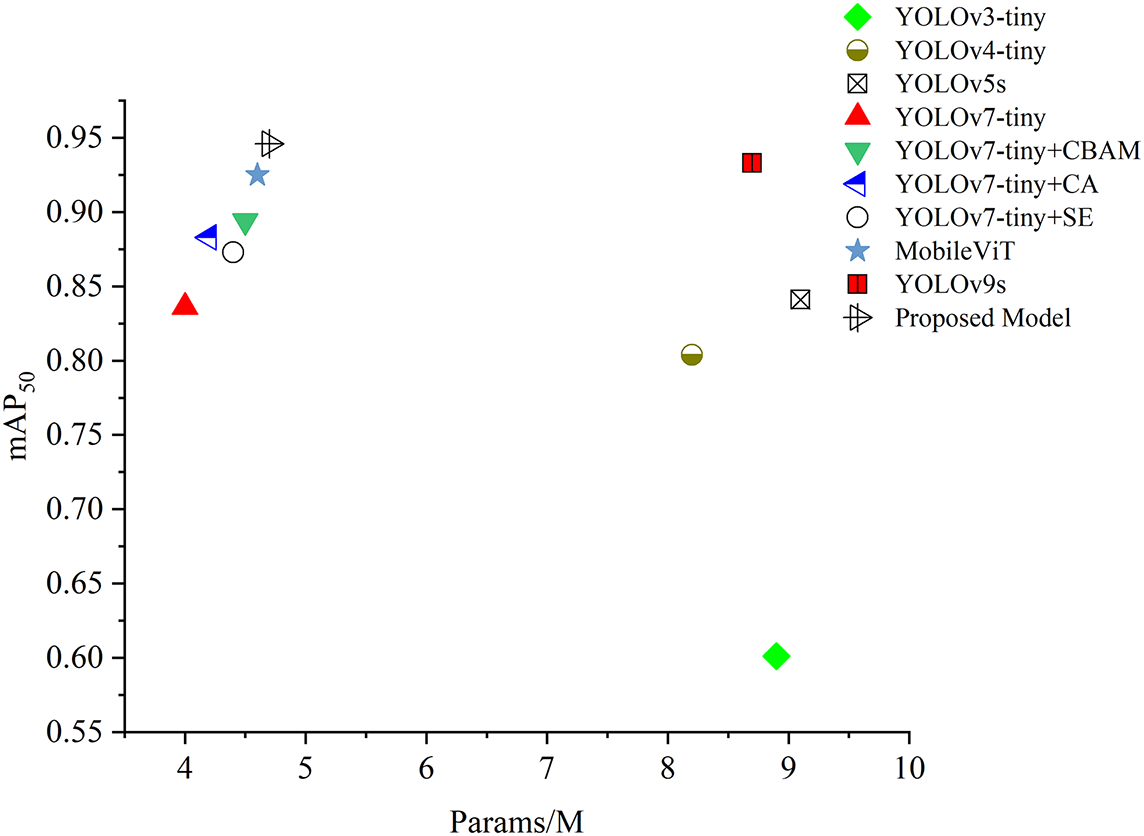
Figure 21: Params/M vs. mAP50
In practical application, the model needs to be deployed and embedded into a hardware system, such as an edge computing system. Fig. 22 depicts the configuration of model deployment where vision sensing is employed to capture the current condition of the object, the mango leaf. After data is received, it is then transmitted into an edge computing system, where the study utilizes Jetson Nano B01 version that has the advantages regarding its powerful and small dimensions, which support an edge computing system. The Graphics Processing Unit (GPU) of Jetson Nano is Maxwell with 128 NVIDIA CUDA cores, while the Central Processing Unit (CPU) is a Quad-core ARM Cortex-A57. Storage and memory capacity are 16 and 4 gigabytes, respectively. The proposed lightweight model is embedded into the device to perform the detection task and image preprocessing. The feature extraction process is conducted at this stage; thus, the model can determine which class and location it belongs to. The prediction output result of the detection task is the detection result with the bounding box, class name, and confidence level of the class detected. User interface is developed into a web and mobile-based design, which allows users to access directly the current condition of the mango plant, the potential disease that harms the leaf, as a monitoring and early detection system.
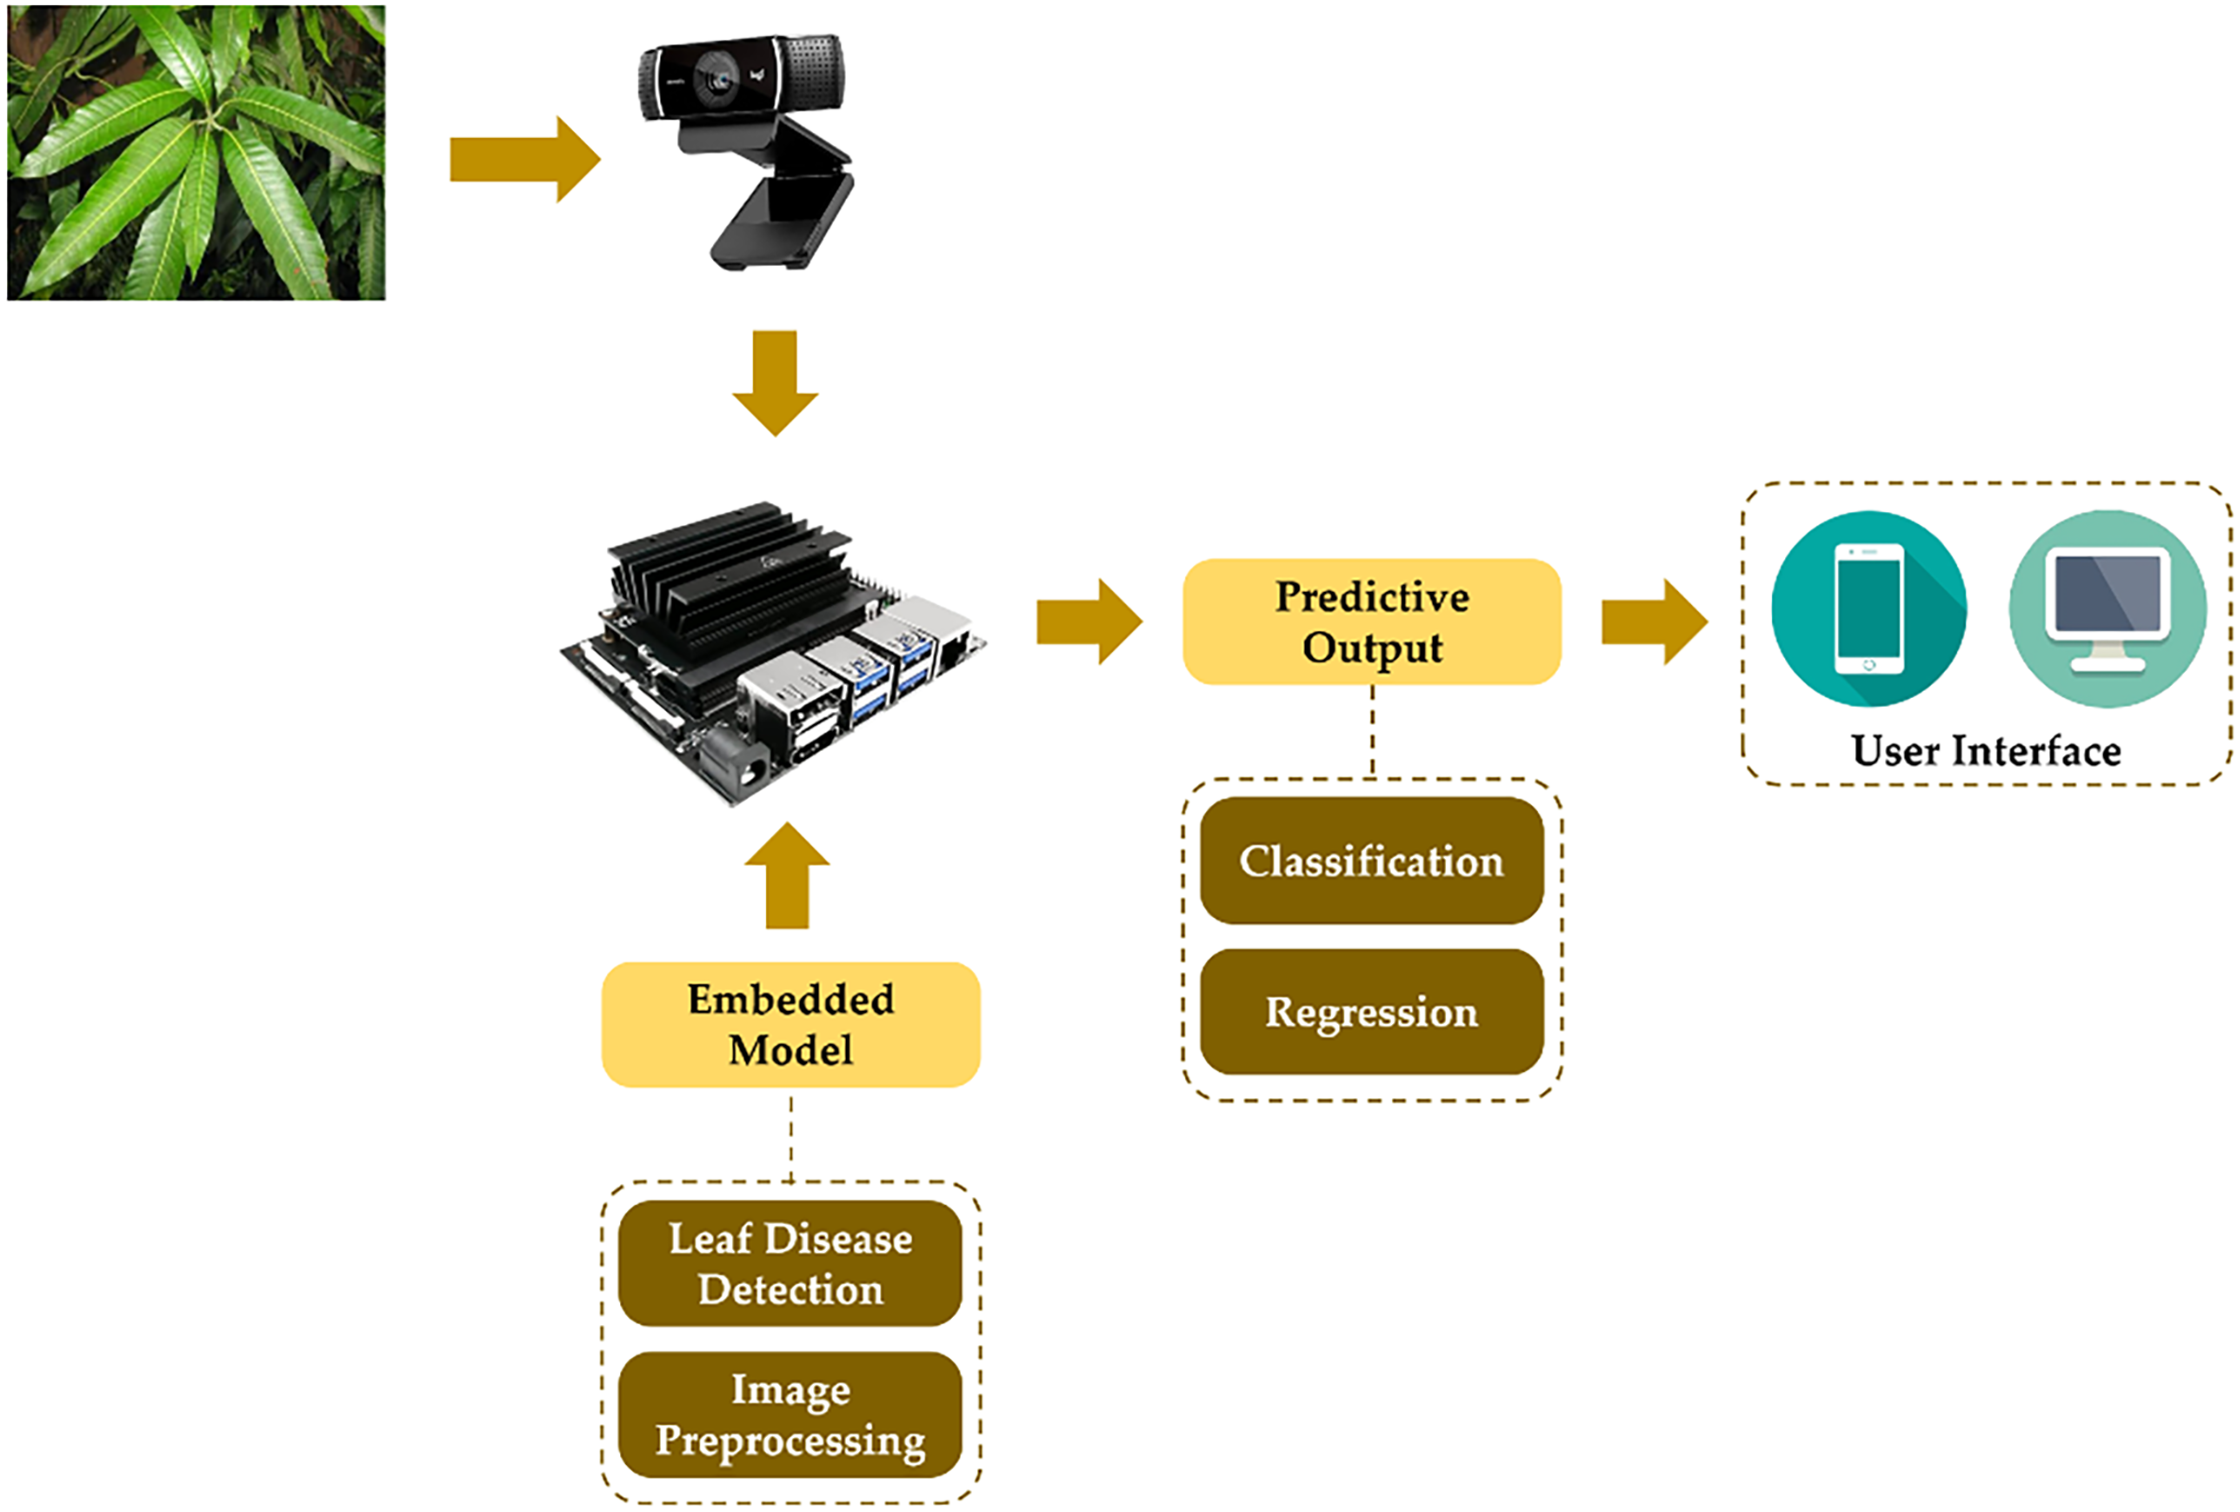
Figure 22: Model deployment setting
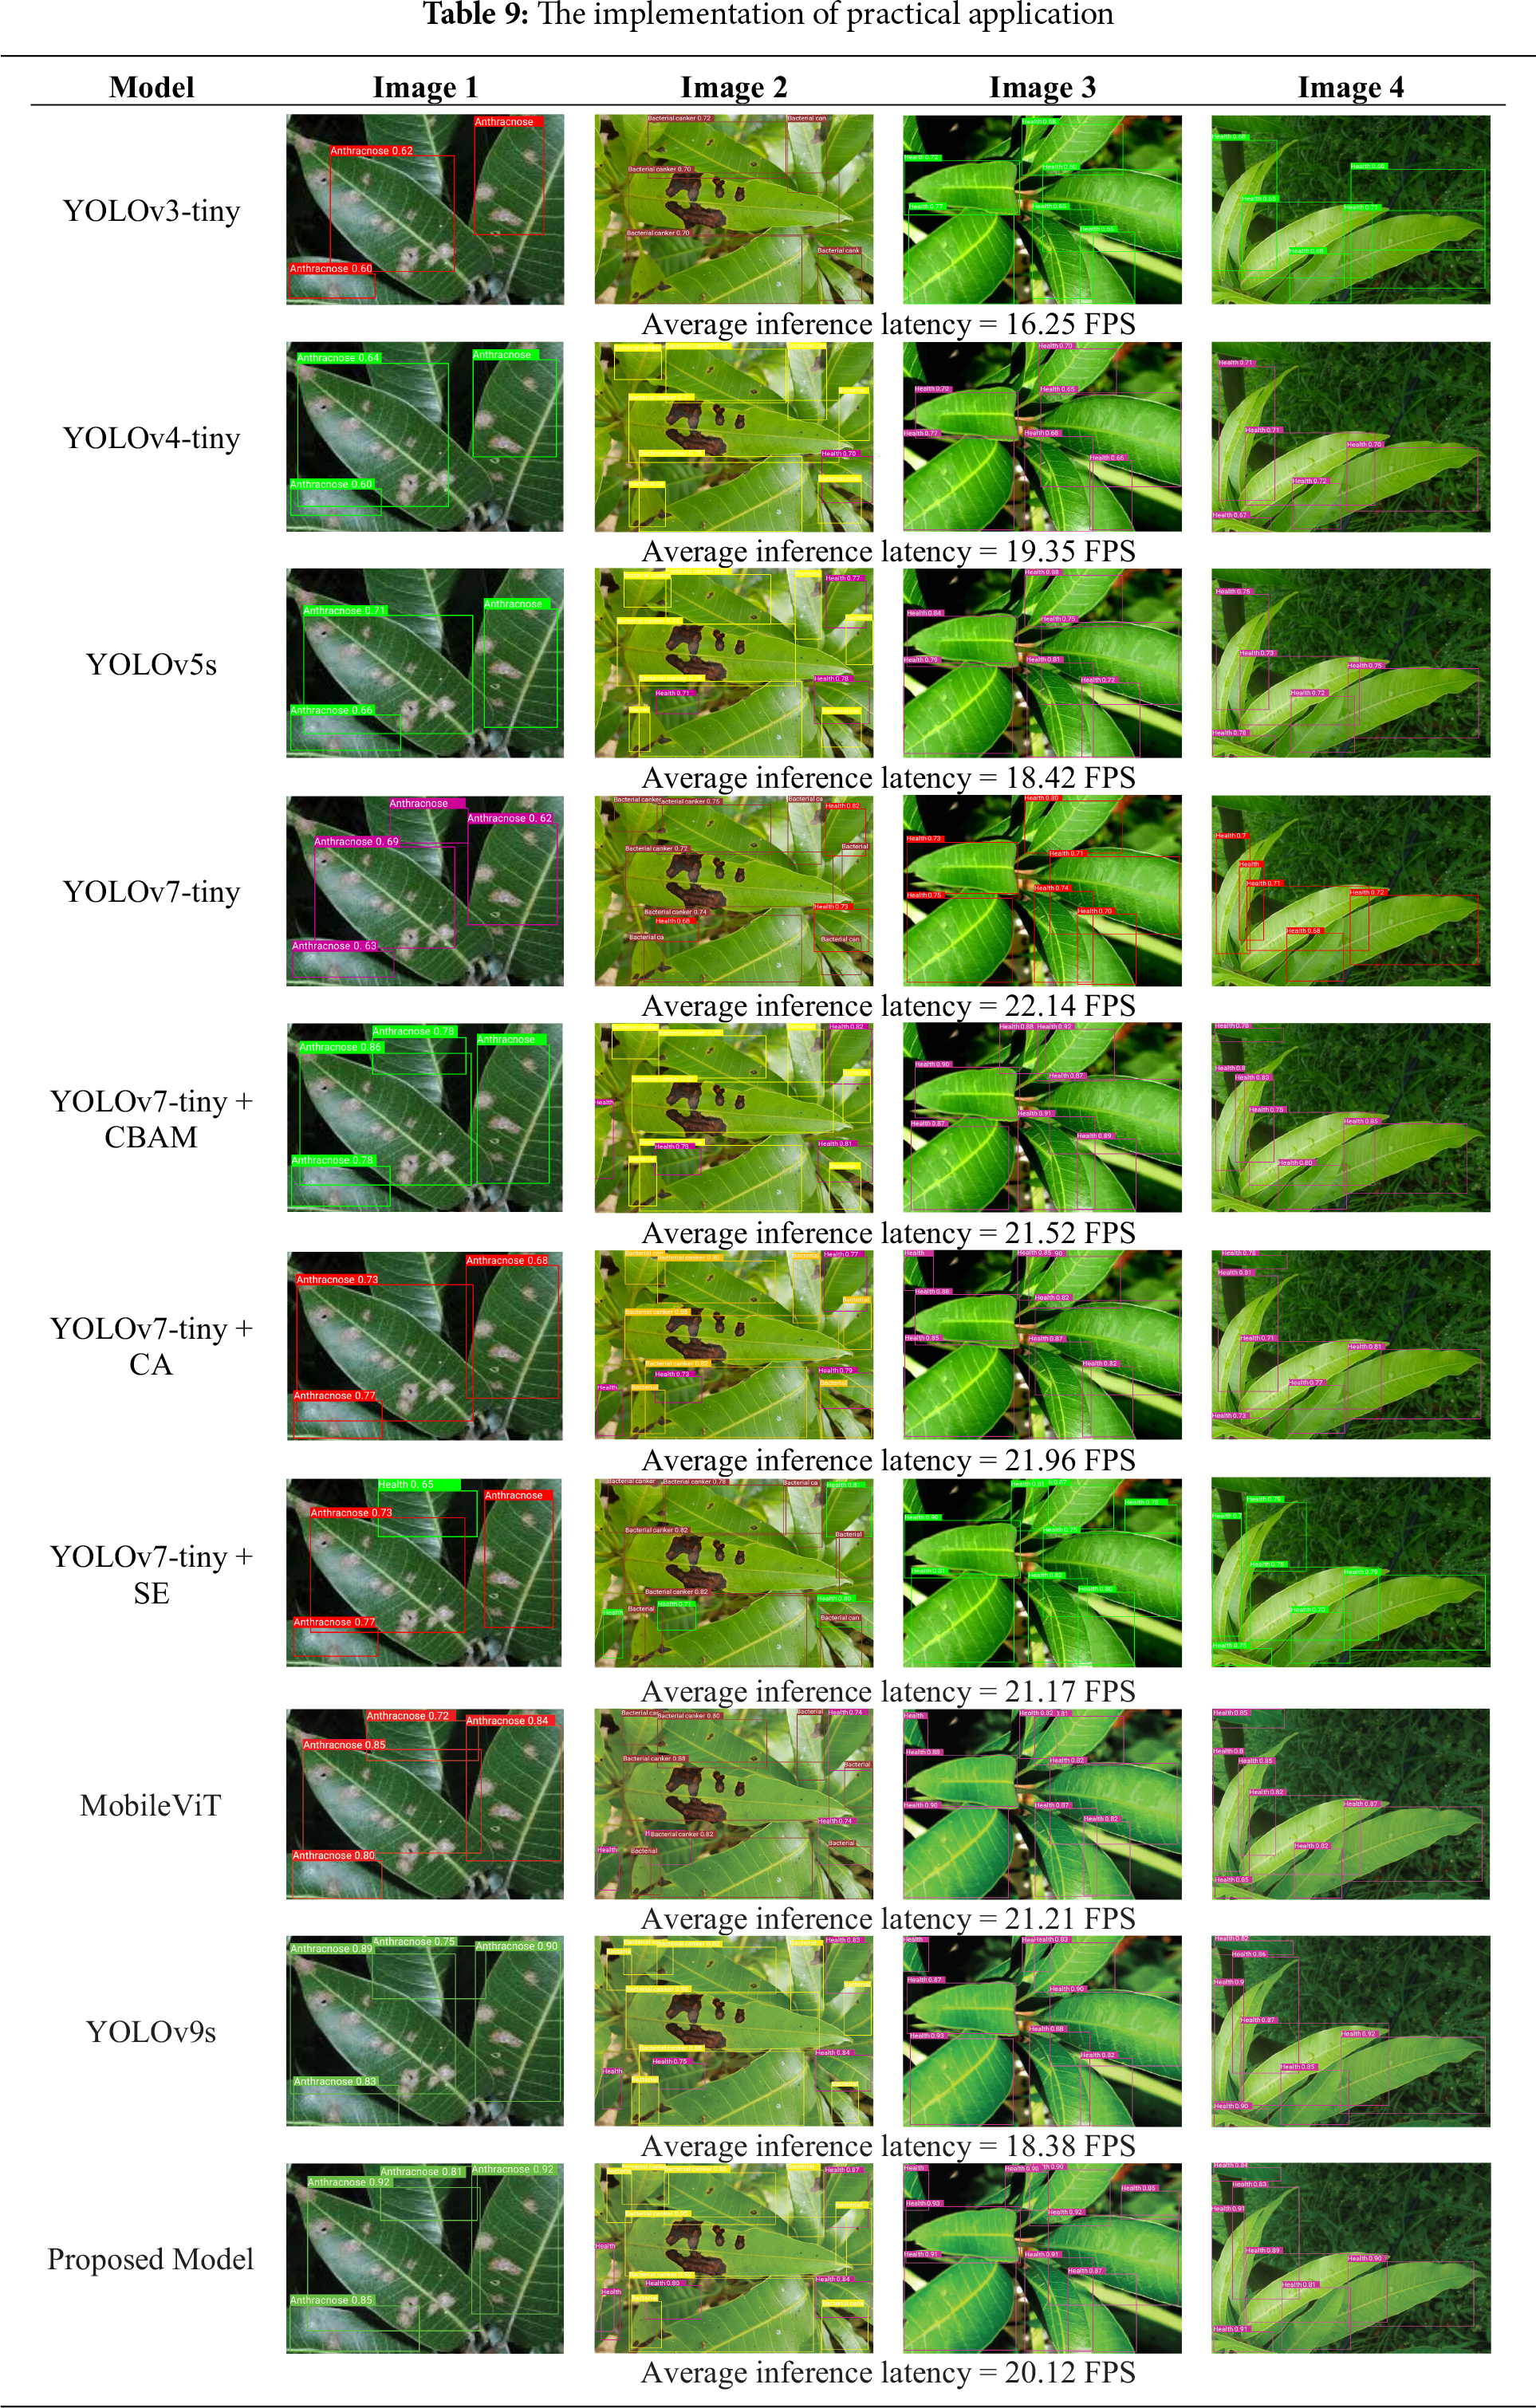
Table 9 represents the results of model performance in real-world image data with three mango leaf conditions, including image 1, image 2, image 3, and image 4. Image 1 shows a mango leaf with anthracnose disease, image 2 shows a combination of healthy and unhealthy mango leaves, image 3 shows healthy mango leaves, and image 4 shows healthy mango leaves with a complex background. The experimental results show that the proposed model is capable of detecting complex mango leaf conditions, especially in image 2, where the model detects multiple target objects, such as leaves with bacterial canker disease and leaves with healthy conditions. Compared with the model performance in YOLOv3-tiny, the model only detects target objects with leaves with bacterial cancer disease, while leaves with the health condition or class “health” are not detected by the model. In image 1, all models can detect diseased leaves, but in YOLOv7-tiny+SE, there is misclassification, where the model detects leaves with the class label “Health”. Some models detect fewer target objects compared to the proposed model. For example, YOLOv3-tiny and YOLOv4-tiny only detect three target objects. While in image 4, the proposed model can detect the mango leaves optimally within the noisy background. The real-time inference latency is measured by frames per second (FPS) to see how edge computing impacts the model’s performance. YOLOv3-tiny has a lower average inference latency compared to the other models, which is 16.25 FPS. This is because the computational cost of edge computing models is higher, resulting in lower real-time inference latency. Meanwhile, the proposed model produces a real-time average inference latency of 20.12 FPS, which is lower than several other models, such as YOLOv7-tiny, YOLOv7-tiny+CBAM, YOLOv7-tiny+SE, and MobileViT. In addition, power consumption is a key aspect of the edge computing model’s performance. It also indicates the model’s efficiency in practical applications. The lower the power consumption, indicated by watts (W), the more efficient the model’s performance. In this study, YOLOv3-tiny has the highest power consumption, which is 6.2 W. Meanwhile, the lowest power consumption is 3.5 W, namely YOLOv7-tiny. The proposed model itself produces a power consumption of 5.5 W, and other models have power consumption in the range between 3.8 and 5.5 W.
The proposed model, which implements C2S modules into the neck-to-head structure, contributes to increasing model performance, especially for tiny objects like mango leaves that have multiple intersections and complex backgrounds. C2S enhances the feature mapping process through the neck structure, further improving the performance of the head detector. However, there are several potential challenges in practical applications regarding the inference speed of the device and scalability. In this study, we implement the C2S by embedding the C2S module into the neck-to-head structure without changing the fundamental structure, for example, improving the backbone structure by replacing several layers with the complex attention mechanism or replacing some CBL parts on the neck structure with an attention module. Therefore, the resulting impact on practical applications is an increase in detection accuracy performance through the confidence score generated by the model. Meanwhile, in terms of the resulting computational cost, it is slightly higher when compared to implementing the module through total improvement by replacing several fundamental layers, whether in the backbone or neck structure. Therefore, it has the potential for a slightly lower inference latency when compared to the complex improvement model as exemplified above. However, when compared to the original YOLOv7-Tiny model, there is no difference in inference speed, and the proposed model even has an advantage in detection performance accuracy. In terms of scalability, in practical applications, the proposed model has superior scalability compared to the original model, but has a potential limitation where the model cannot yet perform the detection task for very small and blurry leaves accompanied by complex backgrounds. So this is a concern going forward, how the model is able to perform detection tasks for such extreme conditions.
4 Conclusions and Future Works
This study has constructed the proposed lightweight mango leaf disease, which integrates YOLOv7-tiny and the combined attention module to enhance the detection performance and model efficiency. The combined attention module integrates the advantages of three modules, including CBAM, CA, and the SE module, as the C2S module to enhance feature extraction performance, model capability, especially for tiny objects, and maintain model efficiency. The attention module position comparative experiment has involved five different positions of C2S modules in the backbone, neck, and head structure. The results indicate that the fifth position (P5) has the optimal performance, which connects the neck and head structure of the model. The impact of the proposed C2S module on the proposed model is increasing detection performance, especially for complex and tiny objects such as mango leaves, which are represented in both the ablation study and comparative experiment, where the proposed models have outstanding performance. Therefore, this study can provide an intelligent detection model in the agricultural field that has high precision, adaptivity, and convenience to the user. As for future direction, the model improvement can also be conducted by integrating the backbone structure with the attention module, which focuses on the feature extraction task and multi-scale efficiency.
Acknowledgement: This work is supported by National Science and Technology Council (NSTC) Taiwan and Department of Electrical Engineering at the National Chin-Yi University of Technology. The authors would like to thank the National Chin-Yi University of Technology, Takming University of Science and Technology, Taiwan, for supporting this research.
Funding Statement: This work is supported by National Science and Technology Council (NSTC) Taiwan, Grant No. NSTC 113-2221-E-167-023.
Author Contributions: The authors confirm contribution to the paper as follows: conceptualization: Wen-Tsai Sung and Indra Griha Tofik Isa; methodology: Indra Griha Tofik Isa; software: Indra Griha Tofik Isa; validation: Sung-Jung Hsiao; formal analysis: Wen-Tsai Sung; writing—original draft preparation: Indra Griha Tofik Isa; writing—review and editing: Sung-Jung Hsiao. All authors reviewed the results and approved the final version of the manuscript.
Availability of Data and Materials: All data supporting this study is provided as supplementary information accompanying this paper can be accessed through the link: https://github.com/mangoleavesexperiment/mangodisease (accessed on 15 September 2025).
Ethics Approval: Not applicable.
Conflicts of Interest: The authors declare no conflicts of interest to report regarding the present study.
References
1. Lin CH, Chiou KD, Lee SR, Shih PY, Lee CR, Lin YR. The genetic diversity of mango (Mangifera indica L.) germplasm in Taiwan by high-throughput single-nucleotide polymorphism genotyping. Plants People Planet. Forthcoming 2025;104(4):39. doi:10.1002/ppp3.70080. [Google Scholar] [CrossRef]
2. Wu MY, Ke CK. Development and application of intelligent agricultural planting technology—the case of tea. In: 2020 International Symposium on Computer, Consumer and Control (IS3C); 2020 Nov 13–16; Taichung City, Taiwan. doi:10.1109/is3c50286.2020.00018. [Google Scholar] [CrossRef]
3. Lee WL, Chiou KD, Chang KS. Tropical fruit breeding in Taiwan: technology and cultivars. Acta Hortic. 1205;2018(1205):577–88. doi:10.17660/actahortic.2018.1205.72. [Google Scholar] [CrossRef]
4. Ariza-Sentís M, Vélez S, Martínez-Peña R, Baja H, Valente J. Object detection and tracking in precision farming: a systematic review. Comput Electron Agric. 2024;219:108757. doi:10.1016/j.compag.2024.108757. [Google Scholar] [CrossRef]
5. Redmon J, Divvala S, Girshick R, Farhadi A. You only look once: unified, real-time object detection. In: 2016 IEEE Conference on Computer Vision and Pattern Recognition (CVPR); 2016 Jun 27–30; Las Vegas, NV, USA. doi:10.1109/CVPR.2016.91. [Google Scholar] [CrossRef]
6. Adami D, Ojo MO, Giordano S. Design, development and evaluation of an intelligent animal repelling system for crop protection based on embedded edge-AI. IEEE Access. 2021;9:132125–39. doi:10.1109/access.2021.3114503. [Google Scholar] [CrossRef]
7. Shi H, Li L, Zhu S, Wu J, Hu G. FeYOLO: improved YOLOv7-tiny model using feature enhancement modules for the detection of individual silkworms in high-density and compact conditions. Comput Electron Agric. 2025;231:109966. doi:10.1016/j.compag.2025.109966. [Google Scholar] [CrossRef]
8. Wang H, Yun L, Yang C, Wu M, Wang Y, Chen Z. OW-YOLO: an improved YOLOv8s lightweight detection method for obstructed walnuts. Agriculture. 2025;15(2):159. doi:10.3390/agriculture15020159. [Google Scholar] [CrossRef]
9. Zuo Z, Gao S, Peng H, Xue Y, Han L, Ma G, et al. Lightweight detection of broccoli heads in complex field environments based on LBDC-YOLO. Agronomy. 2024;14(10):2359. doi:10.3390/agronomy14102359. [Google Scholar] [CrossRef]
10. Zheng L, Zhu C, Liu L, Yang Y, Wang J, Xia W, et al. Star-YOLO: a lightweight and efficient model for weed detection in cotton fields using advanced YOLOv8 improvements. Comput Electron Agric. 2025;235:110306. doi:10.1016/j.compag.2025.110306. [Google Scholar] [CrossRef]
11. Meng Y, Zhan J, Li K, Yan F, Zhang L. A rapid and precise algorithm for maize leaf disease detection based on YOLO MSM. Sci Rep. 2025;15(1):6016. doi:10.1038/s41598-025-88399-1. [Google Scholar] [PubMed] [CrossRef]
12. Wang CY, Bochkovskiy A, Liao HM. YOLOv7: trainable bag-of-freebies sets new state-of-the-art for real-time object detectors. In: 2023 IEEE/CVF Conference on Computer Vision and Pattern Recognition (CVPR); 2023 Jun 17–24; Vancouver, BC, Canada. doi:10.1109/CVPR52729.2023.00721. [Google Scholar] [CrossRef]
13. Park H, Paik J. Pyramid attention upsampling module for object detection. IEEE Access. 2022;10:38742–9. doi:10.1109/access.2022.3166928. [Google Scholar] [CrossRef]
14. Kumar N, Sharma A, Kumar A, Singh R, Singh SK. Cattle verification with YOLO and cross-attention encoder-based pairwise triplet loss. Comput Electron Agric. 2025;234:110223. doi:10.1016/j.compag.2025.110223. [Google Scholar] [CrossRef]
15. Liu Z, Zhuo L, Dong C, Li J. YOLO-TBD: tea bud detection with triple-branch attention mechanism and self-correction group convolution. Ind Crops Prod. 2025;226:120607. doi:10.1016/j.indcrop.2025.120607. [Google Scholar] [CrossRef]
16. Ye T, Huang S, Qin W, Tu H, Zhang P, Wang Y, et al. YOLO-FIX: improved YOLOv11 with attention and multi-scale feature fusion for detecting glue line defects on mobile phone frames. Electronics. 2025;14(5):927. doi:10.3390/electronics14050927. [Google Scholar] [CrossRef]
17. Liu Y, Wang X. SAR ship detection based on improved YOLOv7-tiny. In: Proceedings of the 2022 IEEE 8th International Conference on Computer and Communications (ICCC); 2022 Dec 9–12; Chengdu, China. doi:10.1109/ICCC56324.2022.10065775. [Google Scholar] [CrossRef]
18. Xu M, Yoon S, Fuentes A, Park DS. A comprehensive survey of image augmentation techniques for deep learning. Pattern Recognit. 2023;137(1):109347. doi:10.1016/j.patcog.2023.109347. [Google Scholar] [CrossRef]
19. Woo S, Park J, Lee JY, Kweon IS. CBAM: convolutional block attention module. In: Computer vision—ECCV 2018. Berlin/Heidelberg, Germany: Springer; 2018. p. 3–19. doi:10.1007/978-3-030-01234-2_1. [Google Scholar] [CrossRef]
20. Sun Y, Jiang M, Guo H, Zhang L, Yao J, Wu F, et al. Multiscale tea disease detection with channel-spatial attention. Sustainability. 2024;16(16):6859. doi:10.3390/su16166859. [Google Scholar] [CrossRef]
21. Hou Q, Zhou D, Feng J. Coordinate attention for efficient mobile network design. In: 2021 IEEE/CVF Conference on Computer Vision and Pattern Recognition (CVPR); 2021 Jun 20–25; Nashville, TN, USA. doi:10.1109/cvpr46437.2021.01350. [Google Scholar] [CrossRef]
22. Hu J, Shen L, Sun G. Squeeze-and-excitation networks. In: Proceedings of the 2018 IEEE/CVF Conference on Computer Vision and Pattern Recognition; 2018 Jun 18–23; Salt Lake City, UT, USA. doi:10.1109/CVPR.2018.00745. [Google Scholar] [CrossRef]
23. Liu Y, Duan Y, Zhang X, Zhang W, Wang C. FEPA-Net: a building extraction network based on fusing the feature extraction and position attention module. Appl Sci. 2025;15(8):4432. doi:10.3390/app15084432. [Google Scholar] [CrossRef]
24. Ji X, Yang X, Yue Z, Yang H, Zheng B. Deep learning image compression method based on efficient channel-time attention module. Sci Rep. 2025;15(1):15678. doi:10.1038/s41598-025-00566-6. [Google Scholar] [PubMed] [CrossRef]
25. Chen J, Wu M, Huang H. LDAM: a lightweight dual attention module for optimizing automotive malware classification. Array. 2025;26:100396. doi:10.1016/j.array.2025.100396. [Google Scholar] [CrossRef]
26. Nemade SB, Sonavane SP. Co-occurrence patterns based fruit quality detection for hierarchical fruit image annotation. J King Saud Univ Comput Inf Sci. 2022;34(7):4592–606. doi:10.1016/j.jksuci.2020.11.033. [Google Scholar] [CrossRef]
27. Foody GM. Challenges in the real world use of classification accuracy metrics: from recall and precision to the Matthews correlation coefficient. PLoS One. 2023;18(10):e0291908. doi:10.1371/journal.pone.0291908. [Google Scholar] [PubMed] [CrossRef]
28. Hossin M, Sulaiman MN. A review on evaluation metrics for data classification evaluations. Int J Data Min Knowl Manag Process. 2015;5(2):1–11. doi:10.5121/ijdkp.2015.5201. [Google Scholar] [CrossRef]
Cite This Article
 Copyright © 2026 The Author(s). Published by Tech Science Press.
This work is licensed under a Creative Commons Attribution 4.0 International License , which permits unrestricted use, distribution, and reproduction in any medium, provided the original work is properly cited.
 Downloads
 Citation Tools