
 Submit a Paper
 Propose a Special lssue
 Open Access
ARTICLE

An RMD-YOLOv11 Approach for Typical Defect Detection of PV Modules
1 School of New Energy and Power Engineering, Lanzhou Jiaotong University, Lanzhou, 730070, China
2 School of Automation and Electrical Engineering, Lanzhou Jiaotong University, Lanzhou, 730070, China
* Corresponding Author: Shuaibing Li. Email:
(This article belongs to the Special Issue: Industrial Big Data and Artificial Intelligence-Driven Intelligent Perception, Maintenance, and Decision Optimization in Industrial Systems-2nd Edition)
Computers, Materials & Continua 2026, 86(3), 78 https://doi.org/10.32604/cmc.2025.071644
Received 09 August 2025; Accepted 06 November 2025; Issue published 12 January 2026
 View Full Text
 Download PDF
Abstract
In order to address the challenges posed by complex background interference, high miss-detection rates of micro-scale defects, and limited model deployment efficiency in photovoltaic (PV) module defect detection, this paper proposes an efficient detection framework based on an improved YOLOv11 architecture. First, a Re-parameterized Convolution (RepConv) module is integrated into the backbone to enhance the model’s sensitivity to fine-grained defects—such as micro-cracks and hot spots—while maintaining high inference efficiency. Second, a Multi-Scale Feature Fusion Convolutional Block Attention Mechanism (MSFF-CBAM) is designed to guide the network toward critical defect regions by jointly modeling channel-wise and spatial attention. This mechanism effectively strengthens the specificity and robustness of feature representations. Third, a lightweight Dynamic Sampling Module (DySample) is employed to replace conventional upsampling operations, thereby improving the localization accuracy of small-scale defect targets. Experimental evaluations conducted on the PVEL-AD dataset demonstrate that the proposed RMD-YOLOv11 model surpasses the baseline YOLOv11 in terms of mean Average Precision (mAP)@0.5, Precision, and Recall, achieving respective improvements of 4.70%, 1.51%, and 5.50%. The model also exhibits notable advantages in inference speed and model compactness. Further validation on the ELPV dataset confirms the model’s generalization capability, showing respective performance gains of 1.99%, 2.28%, and 1.45% across the same metrics. Overall, the enhanced model significantly improves the accuracy of micro-defect identification on PV module surfaces, effectively reducing both false negatives and false positives. This advancement provides a robust and reliable technical foundation for automated PV module defect detection.Keywords
With the rapid advancement of PV power generation technology, the performance and operational status of PV modules directly determine the overall efficiency and reliability of PV systems [1]. However, during manufacturing, transportation, and long-term operation, defects such as micro-cracks, broken grids, hot spots, and foreign object contamination frequently emerge as a result of factors including production imperfections, mechanical stress, or environmental influences [2,3]. These defects not only cause power degradation but may also induce localized overheating, accelerating equipment ageing and potentially leading to safety hazards. Therefore, achieving efficient and accurate defect detection in PV modules is essential—not only for optimizing system performance and operational efficiency but also for deepening the scientific understanding of performance degradation mechanisms in PV modules.
Currently, prevalent PV defect detection methodologies primarily include manual visual inspection, electrical performance testing, and electroluminescence (EL) imaging. Although manual inspection is cost-effective, it suffers from low efficiency and is prone to subjective bias. Electrical performance testing and infrared thermography [4–6] can partially reflect the overall performance of PV modules; however, they exhibit limited capability in detecting and localizing subtle or micro-scale defects. Electrical impedance imaging (EII) [7,8] offers high accuracy in micro-crack detection but depends on complex instrumentation and time-consuming procedures, rendering it unsuitable for real-time or large-scale monitoring applications. Moreover, conventional image-processing-based machine vision approaches—such as threshold segmentation [9], edge detection [10], and morphological analysis [11]—are highly sensitive to variations in illumination, contamination, and surface texture. These limitations often lead to false positives and false negatives, exposing their inadequate robustness and generalization ability under complex conditions.
As a result, existing detection techniques exhibit significant deficiencies in sensitivity, real-time performance, and adaptability to diverse operational environments. Furthermore, there remains a lack of systematic investigation into the early-stage evolution of PV module defects and the associated mechanisms driving performance degradation. This gap represents a critical scientific and technical challenge in the field of PV module defect detection. Addressing it through high-precision detection technologies and mechanism-oriented research is of great significance for improving PV module reliability and ensuring the safe and stable operation of PV systems.
In recent years, deep learning–based object detection algorithms—particularly the YOLO (You Only Look Once) family of models—have been extensively applied to industrial visual inspection tasks due to their end-to-end architecture and high detection efficiency [12]. Continuous advancements in detection accuracy, computational speed, and model design from YOLOv3 to YOLOv10 have substantially driven the progress of intelligent defect detection. Pan et al. [13] proposed an enhanced YOLOv5-based method (YOLO-ACF) that integrates an Adaptive Complementary Fusion (ACF) module for defect detection in PV panel electroluminescence (EL) images. This approach improved mean Average Precision (mAP) while achieving model light weighting and acceleration, reducing parameters by 12.9% and increasing the frame rate by 5%. Zhang and Yin [14] developed a modified YOLOv5 model for solar cell defect detection by incorporating a deformable CSP module, an Efficient Channel Attention (ECA-Net) mechanism, optimized multi-scale prediction heads, and advanced data augmentation strategies, resulting in an average detection accuracy of 89.64%. Cao et al. [15] presented an improved YOLOv8 algorithm (YOLOv8-GD) tailored for distributed PV defect detection. Through the introduction of DW-Conv, GSConv, and BiFPN structures, their model achieved superior accuracy and inference speed on both a self-constructed dataset and the PVEL-AD benchmark. Aktouf et al. [16] developed a YOLOv10-based framework for solar cell defect detection by integrating Channel Interaction Blocks (CIB) and Parallel Spatial Attention (PSA) modules, achieving a high mAP@0.5 of 98.5% on a dataset comprising 10,500 EL images. Zhu et al. [17] proposed the C2DEM-YOLO model for PV module defect detection, which incorporates a C2Dense feature extraction module, a cross-space multi-scale attention mechanism, and auxiliary regression boxes to enhance detection accuracy and generalization capability. In addition, Yadav et al. [18] introduced an explainable Attention-based Fuzzy Residual Convolutional Network (AFRCNet), combining convolutional feature extraction, fuzzy reasoning, and residual attention mechanisms to improve the precision and interpretability of PV cell defect identification and classification.
Overall, these studies have contributed to notable improvements in detection accuracy, inference speed, and model compactness. Nevertheless, challenges persist in effectively identifying complex defect types—such as composite, densely distributed, and fine-crack defects—where existing models still exhibit issues of misdetection and omission.
To address the above problems, this paper proposes an improved PV module defect detection model based on the YOLOv11 algorithm—RMD-YOLOv11, which mainly includes the following three aspects of improvement:
(1) The RepConv module is introduced in the backbone part of YOLOv11 to enhance the model’s accuracy for composite defects and fine cracks. convolution module in the Backbone part of YOLOv11, in order to enhance the model’s ability to extract fi-ne-grained defect features such as micro-cracks and finger interruption, while considering the computational efficiency of the inference stage.
(2) An improved MSFF-CBAM module is designed, which embeds multiple scale convolution kernels before the channel attention module and the spatial attention module, respectively, so as to enhance the model’s capability of sensing defect features of different sizes, and to realize richer contextual modeling and stronger feature expression ability, which significantly im-proves the detection effect of small target and weak texture defects.
(3) The DySample module is used to replace the original upsampling operation, which enhances the semantic consistency and fusion ability between multi-scale feature maps, thus further improving the localization accuracy of small target defects. The experiments are validated based on the PVEL-AD and ELPV PV module defect datasets, and the results show that the proposed RMD-YOLOv11 model outperforms the original YOLOv11 model in terms of precision, recall, and mAP, and possesses a good inference speed, which demonstrates its potential for wide application in the field of PV module defect detection.
The remainder of this paper is organized as follows: Section 2 introduces the underlying principles and architecture of the improved YOLOv11 algorithm. Section 3 presents the experimental validation, performance analysis, and comparative discussion based on real datasets. Finally, Section 4 concludes the study and outlines directions for future research.
2 Improved YOLOv11 Algorithm Model
In this paper, to overcome the limitations of traditional detection methods and address the deficiencies of existing YOLO-based improvement strategies, the YOLOv11 model is further enhanced. The proposed improvements can be summarized in the following three aspects:
• The standard convolutional layers in the backbone are replaced with the RepConv module. Leveraging its multi-branch training and single-branch inference characteristics, this modification enhances the model’s capability to extract fine-grained and complex defect features—such as micro-cracks and hot spots—while maintaining high inference efficiency.
• A multi-scale feature fusion CBAM is introduced, combining both channel and spatial attention pathways. This design enables the network to concentrate more effectively on critical defect regions, thereby improving the relevance and expressiveness of feature representations. The multi-scale fusion mechanism further facilitates the simultaneous perception of diverse defect types, ranging from minute cracks to large-area surface anomalies.
• The conventional upsampling operation is replaced with a DySample module capable of adaptive weight adjustment during feature map reconstruction. This design significantly enhances semantic consistency across scales and improves the localization accuracy of small or concealed defects (e.g., hidden micro-cracks).
These three improvements achieve synergistic optimization from the perspectives of feature extraction, interference suppression, and resolution reconstruction, enabling the proposed model to achieve concurrent enhancements in both detection accuracy and inference efficiency for PV module defect detection tasks. The detailed network architecture of the proposed RMD-YOLOv11 model is illustrated in Fig. 1.
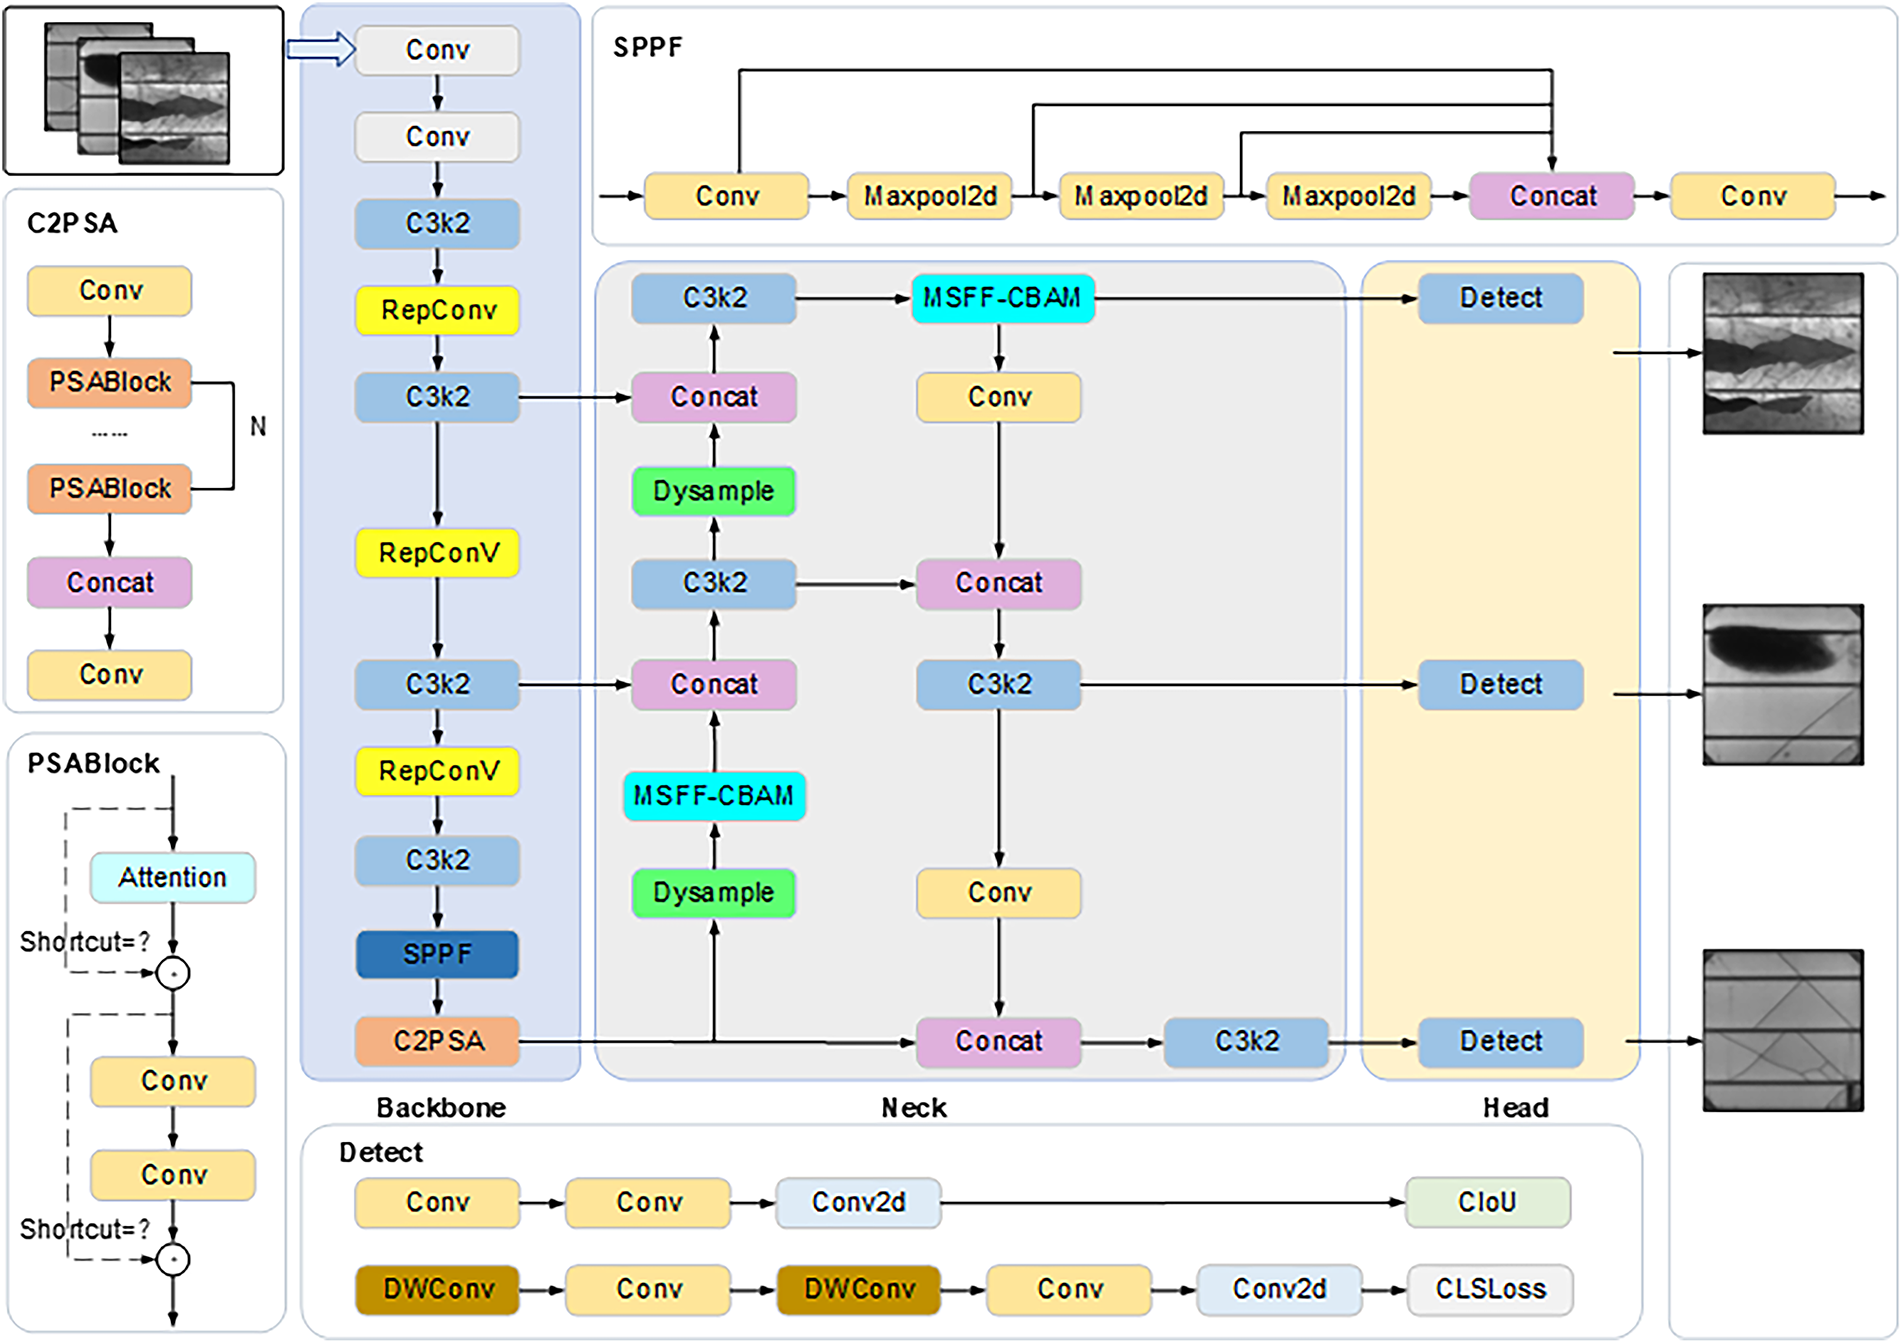
Figure 1: Structure of improved YOLOv11 network
2.2 RepConv Convolution Module
RepConv is a model re-parameterization technique designed to enhance both the efficiency and performance of deep neural networks by consolidating multiple computational branches into a single equivalent structure during the inference stage [19,20]. The core concept involves employing a multi-branch convolutional configuration during training to improve the network’s representational capacity and learning flexibility. At the inference stage, the parameters of all auxiliary branches are mathematically re-parameterized and merged into the main convolutional branch, thereby eliminating redundant computations and significantly reducing both computational overhead and memory consumption. The structural design of the RepConv module is illustrated in Fig. 2.
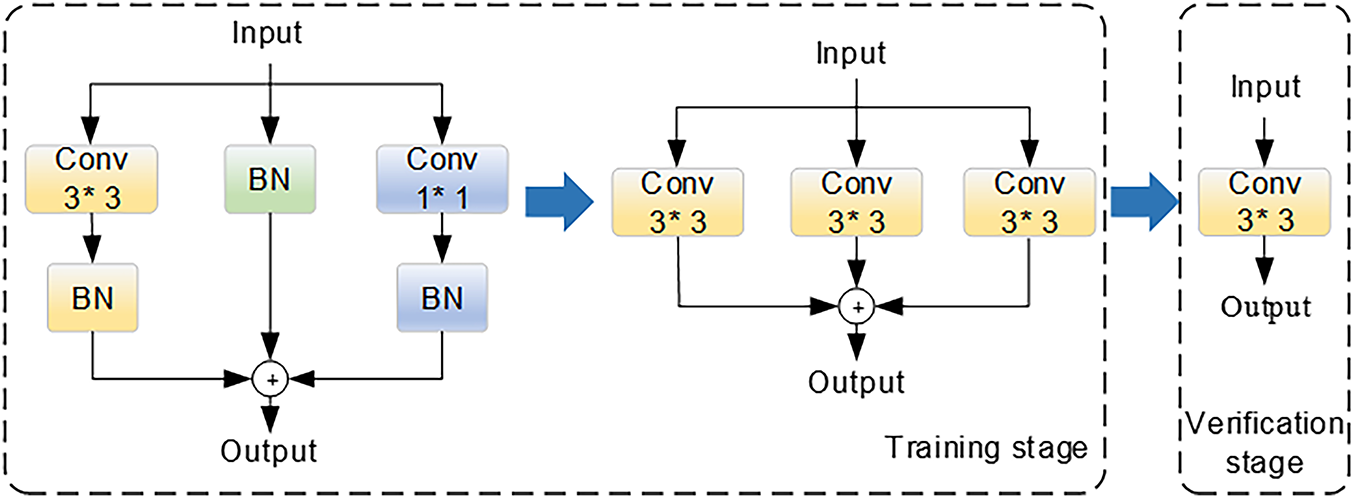
Figure 2: Structure of RepConv
The computational procedure of the Conv convolutional layer is shown in (1):
where W(x) is the weight matrix of Conv, b is the bias, and x is the image input feature.
The Batch Normalization (BN) improves the training speed and stability of the model by normalizing the distribution of the input at each layer. Specifically, the internal covariate bias problem is alleviated by normalizing each batch of input data so that the input distribution of each layer maintains a mean of 0 and a variance of 1. The computational procedure is shown in Eq. (2):
where γ is the scaling parameter, var is the variance, mean = avg(x) is the mean function and β is the translation parameter, which is obtained by bringing Eq. (1) into Eq. (2):
The fusion formula combines the 3 × 3 convolution and BN layer into a single convolution operation, thus simplifying the model structure during inference. Firstly, the RepConv convolution introduces a residual connection structure that enhances the model’s nonlinear expression capabilities while preserving the original features. This enhancement is designed to improve the model’s capacity to detect fine-grained defects, such as micro-cracks and finger interruption. This is of particular importance in the context of battery panel images, which frequently exhibit blurred defect boundaries and a wide variety of shapes. Secondly, RepConv convolution employs a multi-branch structure (for example, 3 × 3 convolution, 1 × 1 convolution, identity, etc.) to extract rich features during the training stage. It then simplifies these features to a single convolution by fusion formula during the inference stage. This process takes into account both detection accuracy and inference efficiency. Finally, the module has the capacity to integrate a depth-separable convolution design, which is a combination of channel-wise convolution and point-wise convolution. This enables more accurate extraction of texture and structural information from each channel. The result is an improvement in robustness against hidden defects in complex backgrounds.
2.3 Multi-Scale Feature Fusion Convolutional Block Attention Mechanism
The Convolutional Block Attention Mechanism (CBAM) significantly enhances the feature representation capability of deep models by explicitly modeling attention in both channel and spatial dimensions [21,22]. The channel attention submodule focuses on discriminative feature channels, while the spatial attention submodule emphasizes important spatial locations. Compared with mainstream attention mechanisms such as SENet [23,24], ECA-Net [25], and Coordinate Attention (CA) [26], CBAM jointly models channel and spatial relationships, enabling the network to better perceive critical features and their spatial distribution. In this work, the original CBAM is improved by introducing a Multi-Scale Feature Fusion CBAM [27–29], whose structure is illustrated in Fig. 3.
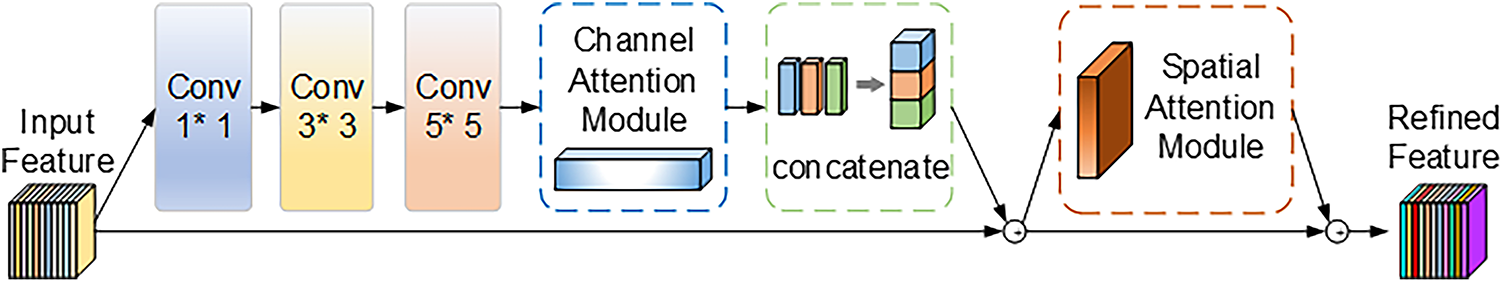
Figure 3: Structure of MSFF-CBAM
In the proposed architecture, the input feature map undergoes three parallel convolution operations—1 × 1, 3 × 3, and 5 × 5—to achieve multi-scale feature extraction. The 1 × 1 convolution compresses channels and extracts fine-grained information, the 3 × 3 convolution focuses on medium-scale local patterns, and the 5 × 5 convolution captures broader contextual semantics. Each branch independently extracts spatial features such as textures and edges at different levels, making the network adaptable to various defect sizes (large, medium, and small) commonly found in PV module images. The outputs of the multi-scale convolutions are then fed into the channel attention module (shown in Fig. 4), where each scale branch undergoes global average pooling and max pooling to extract statistical descriptors. The attention weights are generated using a shared Multilayer Perceptron (MLP) or convolutional network, after which the features are channel-weighted, concatenated, and fused to form a unified representation rich in multi-scale information.
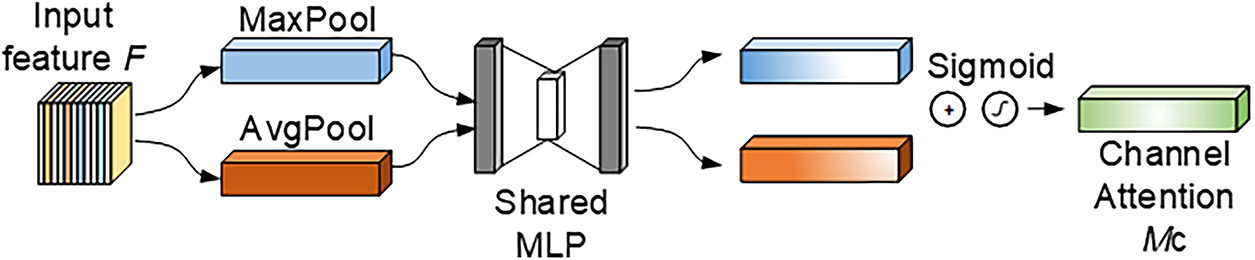
Figure 4: Channel attention module
Subsequently, the fused feature maps are passed into the spatial attention module, which applies pooling operations along the channel axis to produce max-pooled and average-pooled feature maps. These are combined via a convolutional operation, and a Sigmoid activation generates spatial attention maps with weights ranging from 0 to 1, emphasizing critical regions while suppressing background noise (as shown in Fig. 5). This mechanism markedly enhances the model’s sensitivity to localized defect regions and improves its ability to detect intricate flaws—such as micro-cracks, scratches, and finger interruptions—within the YOLOv11 framework. In summary, the MSFF-CBAM achieves a seamless integration of multi-scale feature extraction and dual-attention fusion, providing substantial benefits in information richness, target focusing, and detection robustness. It is particularly effective for PV module detection under uneven illumination or severe texture variation conditions.
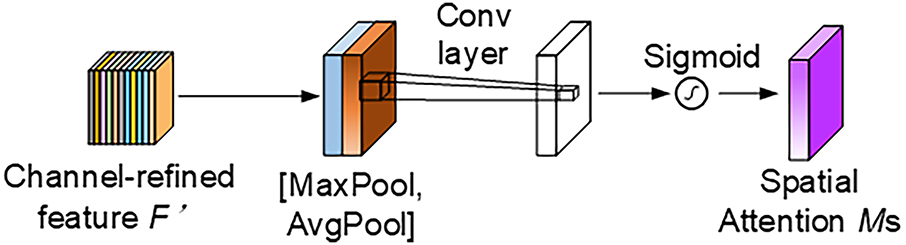
Figure 5: Spatial attention module
2.4 DySample Upsampling Module
The DySample module is a lightweight, efficient, and dynamically learnable upsampling mechanism that adaptively generates sampling weights based on input features, enabling weighted fusion of neighboring feature points [30]. Compared to traditional kernel-based upsampling methods, DySample achieves superior accuracy with fewer parameters and reduced computational complexity. By employing a point-sampling strategy, it performs fewer floating-point operations while preserving key feature information and details. Consequently, it enhances the representational power of the feature maps and is widely used in detection, segmentation, and super-resolution tasks.
As shown in Fig. 6, the DySample module combines a dynamic sampling-based up-sampling mechanism and a structural design, which mainly contains two core components: one is the dynamic up-sampling mechanism (as shown in Fig. 6a), which is used to generate a set S of sampling coordinates based on the input feature maps X, and reconstruct the input features through the grid-sample function, so as to obtain the upsampled feature maps X′. The formula for this process is shown in Eq. (4):
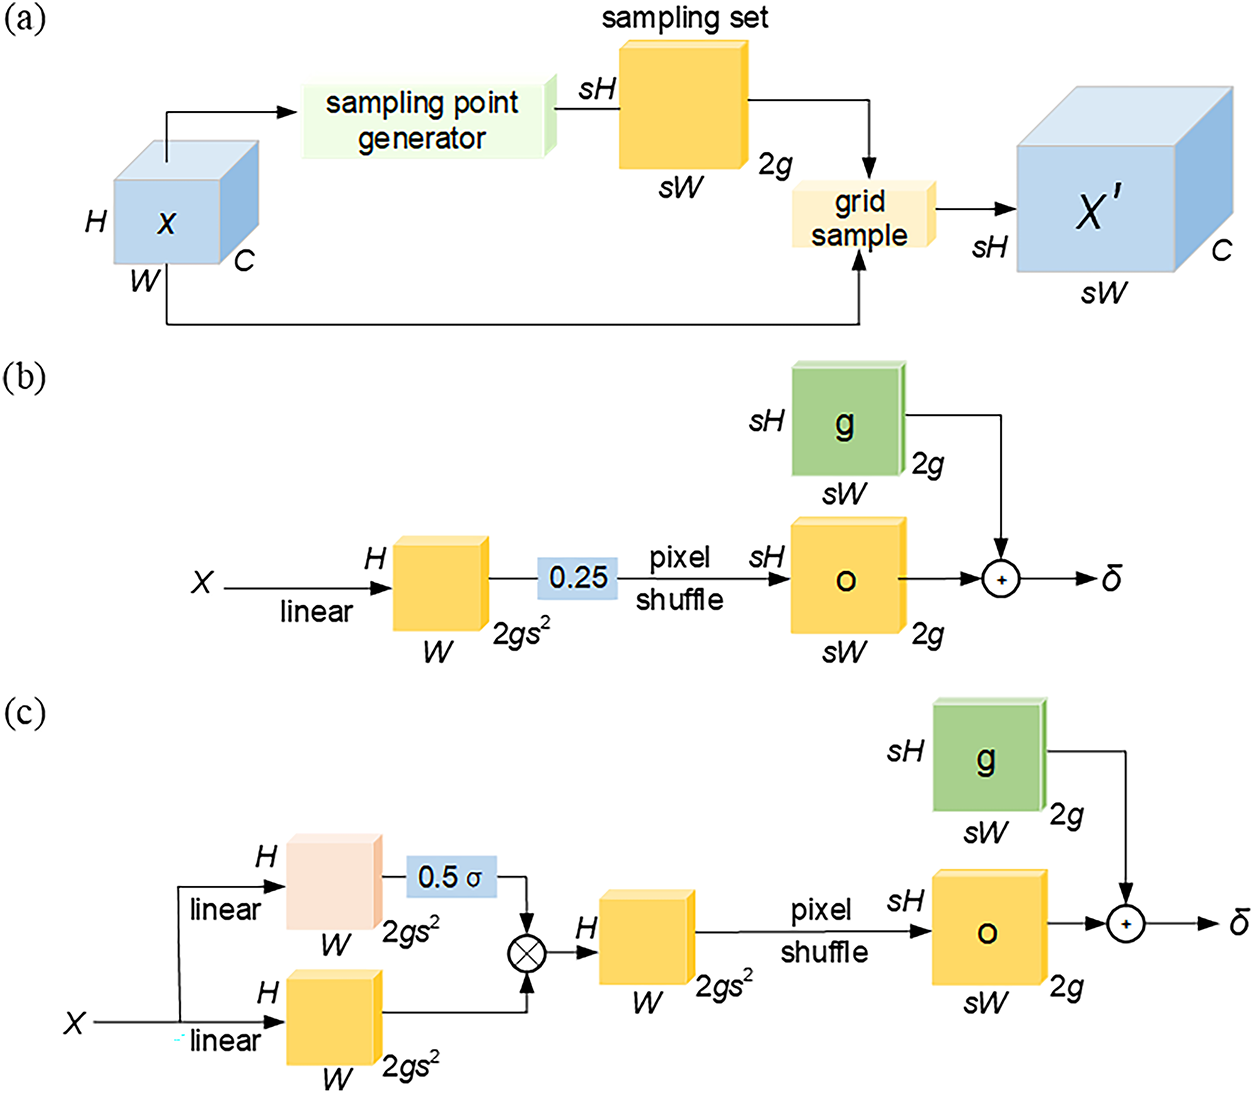
Figure 6: DySample module. (a) DySample process; (b) Generating a set of sampling points based on dynamic scope factors; (c) Generating a set of sampling points based on static scope factors
The second is the sample point generator in DySample, which includes two strategies: static range factor and dynamic range factor. The static range factor (as shown in Fig. 6b) generates a fixed set of static offsets Os by linear transformation with pixel shuffle technique and adds them with the original position set G to get the final set of sampling points Ss, which can be expressed by Eqs. (5) and (6):
This static offset factor has good stability and controllability, and is suitable for coping with scenarios with small changes in consistency. In order to enhance the adaptability, the module further introduces the dynamic range factor (as shown in Fig. 6c), which first generates the dynamic range factor and adaptively adjusts the sampling point position by the dynamic offset Od. This dynamic offset process can be described by Eq. (7):
where, linear1 and linear2 are independent linear transformation paths, and σ denotes the Sigmoid activation function, which is used to regulate the generation of dynamic range factor. The dynamic range mechanism can adaptively adjust the sampling range and scaling ratio according to the input features, which is especially suitable for image data with multi-scale characteristics or significant differences in resolution. Through this mechanism, the DySample module is able to effectively model different scale features and accurately capture fine-grained details, thus significantly improving the flexibility and adaptability of the network structure.
In summary, the integration of RepConv, MSFF-CBAM, and DySample modules substantially enhances the detection accuracy and robustness of the proposed RMD-YOLOv11 model. Specifically, RepConv facilitates fine-grained feature learning and stable representation under noisy conditions; MSFF-CBAM suppresses irrelevant background information and textural noise through its dual-attention mechanism; and DySample minimizes artifacts and noise amplification during upsampling by adaptively selecting sampling points. The synergistic interaction of these modules enables the model to perform reliable and noise-resistant defect detection even in complex imaging environments.
2.5 Flow of the Proposed Algorithm
To provide a clearer understanding of the proposed detection framework, the overall workflow of RMD-YOLOv11 is summarized as follows. The algorithm begins with parameter initialization, followed by iterative training. In each iteration, the dataset is randomized and divided into multiple mini-batches. Data augmentation techniques—such as image flipping, mosaic combination, and HSV transformation—are applied to increase data diversity. The augmented images are then processed through the backbone network, where RepConv extracts hierarchical features. These features are subsequently refined through MSFF-CBAM, and DySample performs dynamic upsampling and multi-scale fusion. Finally, the detection head outputs bounding boxes and class confidence scores, with the overall loss function—comprising classification, localization, and objectness losses—optimized via backpropagation. The complete process is illustrated in Fig. 7.
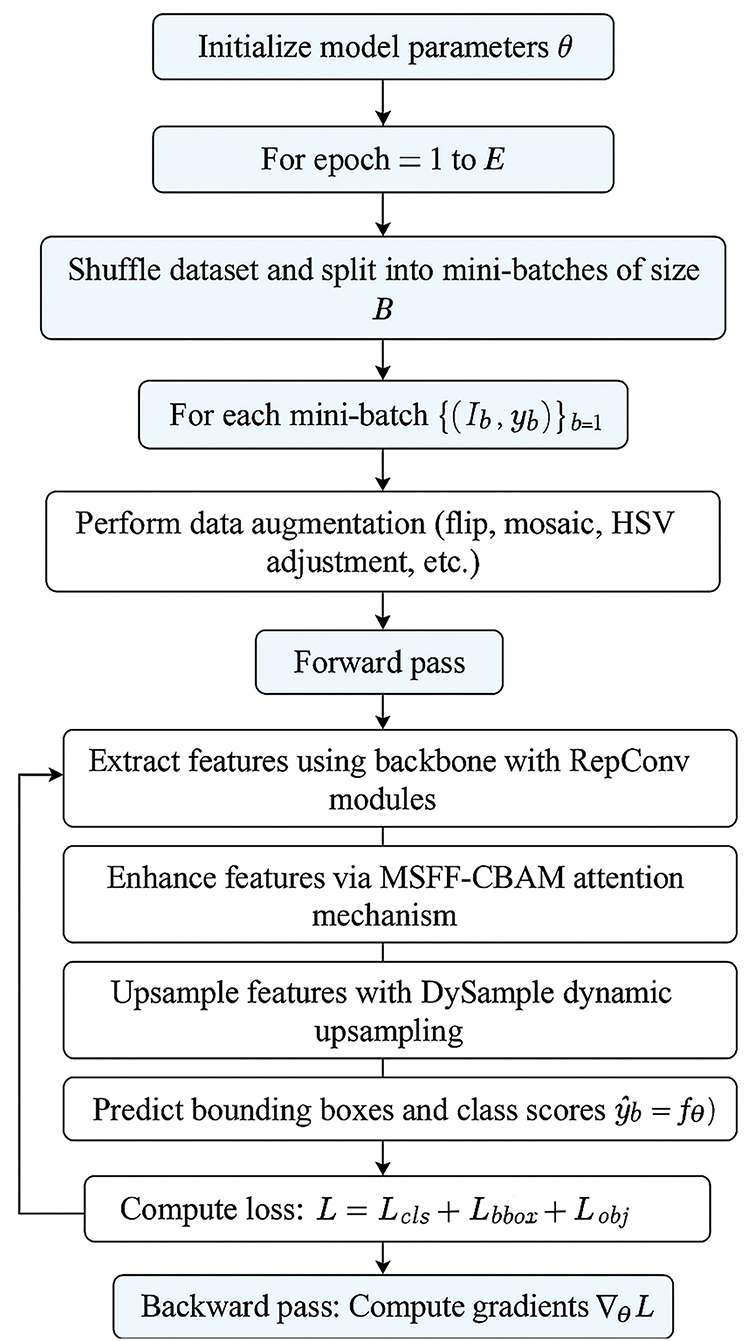
Figure 7: Flowchart of the proposed algorithm RMD-YOLOv11
3 Results Analysis and Discussion
3.1 Dataset Pre-Processing and Hyperparameter Tuning
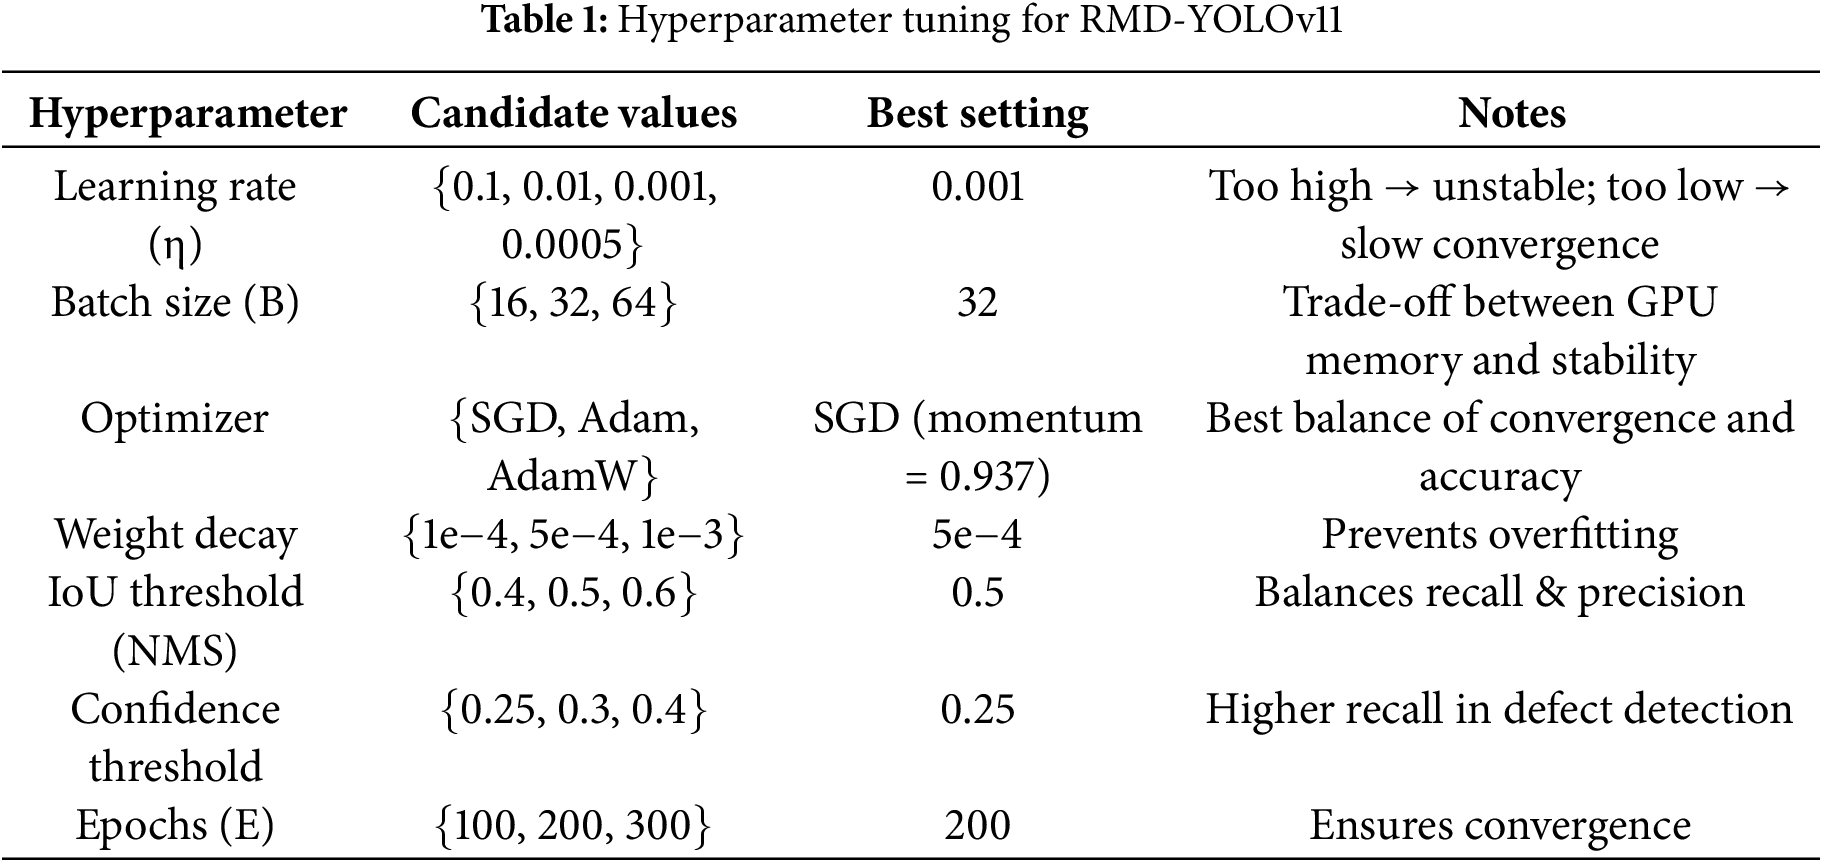
In this study, the PVEL-AD dataset, jointly released by Hebei University of Technology and Beihang University, was employed to validate the proposed model. This large-scale, publicly available dataset is specifically curated for PV cell defect detection. To ensure consistency and reliability, only the six most prevalent defect categories were retained, including defect-free samples, cracks (line and star), black cores, finger interruptions, fragments, and scratches, as illustrated in Fig. 8a–f. After removing rare and irregular defect categories, a total of 4837 valid images were selected for experiments, which were then randomly divided into training and validation sets at a ratio of 8:2. The predicted versus actual outcomes for both the training set and test set of the proposed RMD-YOLOv11 model are shown in Fig. 9a and 9b, respectively. To ensure effective model convergence, key hyperparameters were optimized through systematic parameter search, and the corresponding search ranges and final values are summarized in Table 1. These optimizations enable a well-balanced trade-off between inference speed, detection accuracy, and training stability.
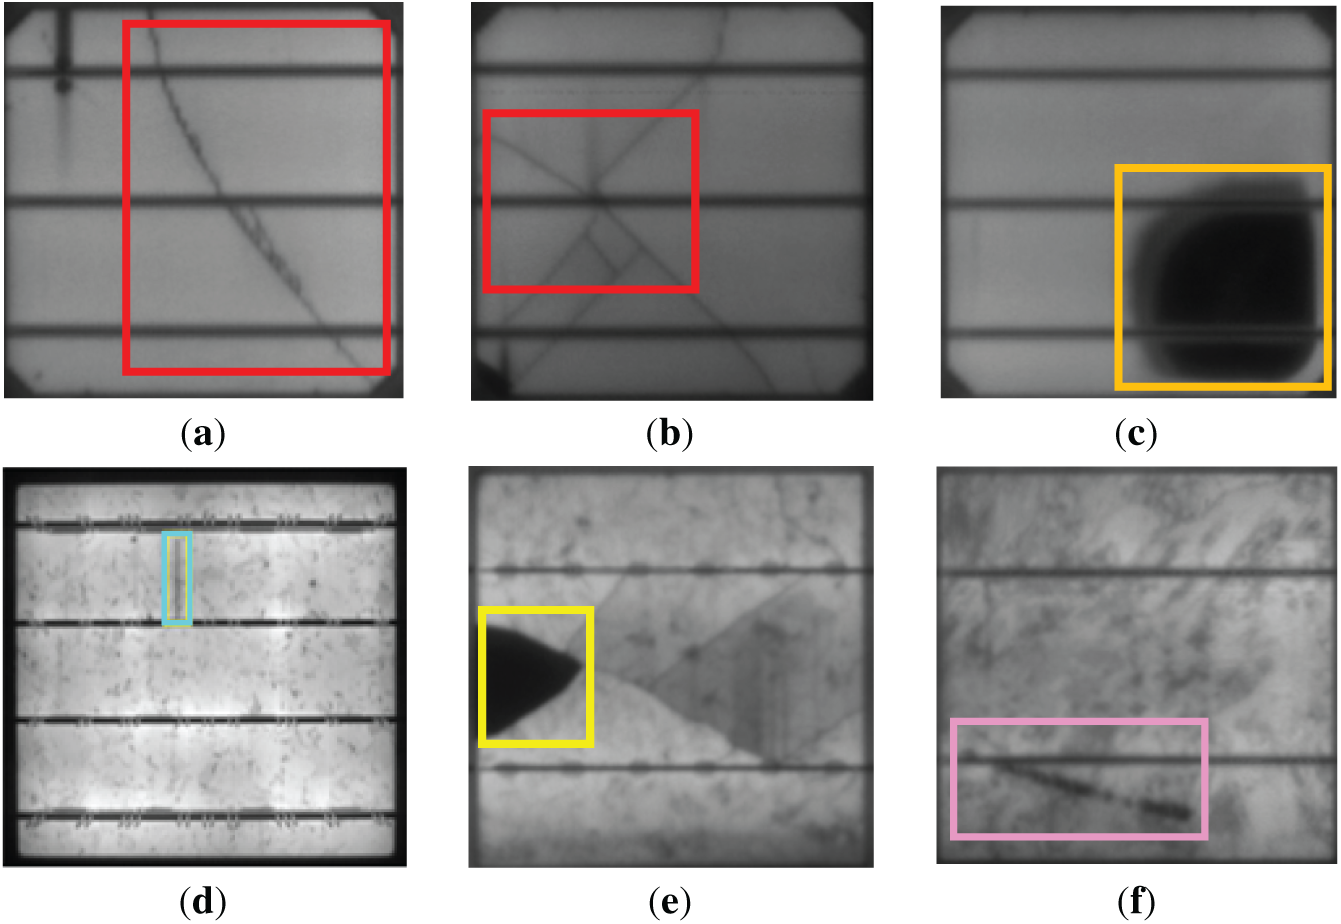
Figure 8: Different defect pictures of PV panels. (a) Line crack; (b) Star crack; (c) Black core; (d) Finger interruption; (e) Fragment; (f) Scratch
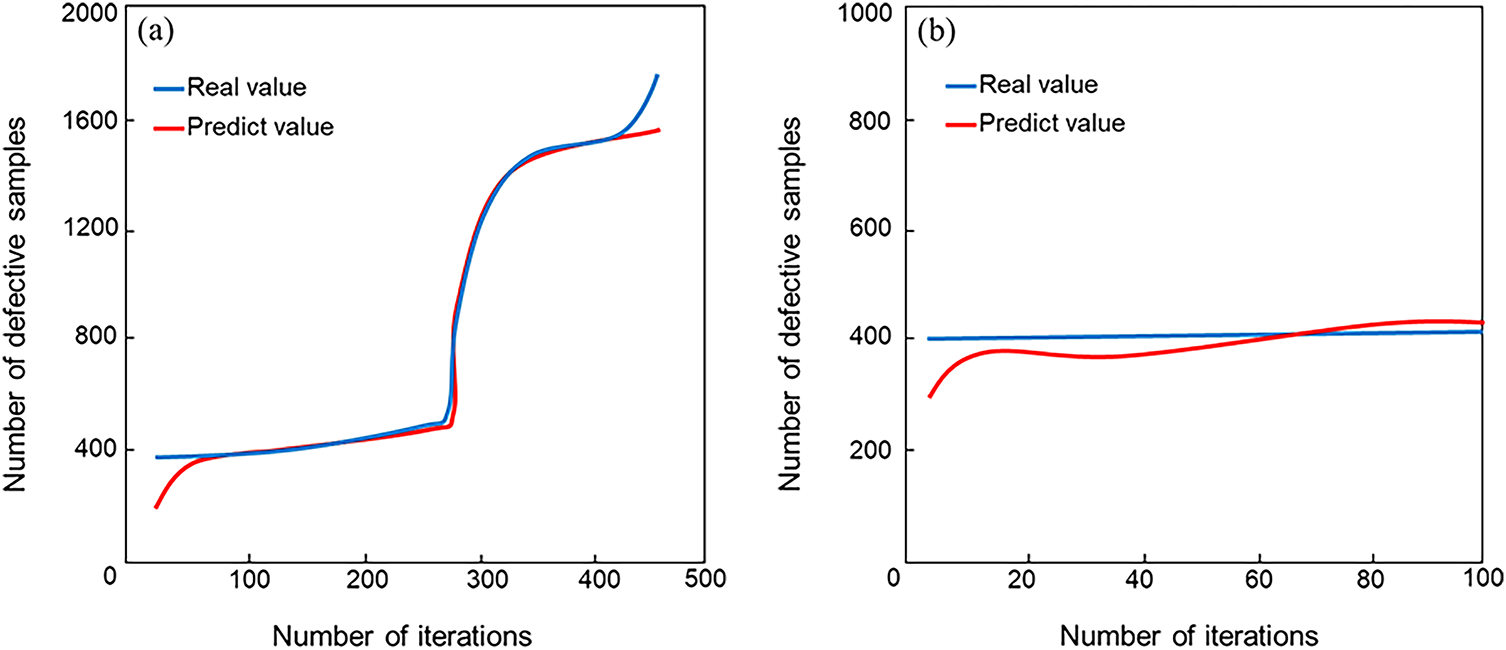
Figure 9: RMD-YOLOv11 model training comparison (a) Comparison of predicted values vs ground truth on the training set; (b) Comparison of predicted values vs ground truth on the validation set
3.2 Model Evaluation Indicators
The evaluation metrics used in this experiment include precision (P), recall (R), mAP, parameters (Params), floating point operations (FLOPs) and frames per second (FPS). P is the proportion of samples with positive predictions that are truly positive and R is the proportion of samples with truly positive predictions that are correctly predicted. As shown in Eqs. (8) and (9):
where TP denotes the detection frame with positive prediction and positive truth, FP the detection frame with positive prediction but negative truth, FN the target with positive truth but not detected. AP refers to the average precision rate of a single category under different recall rates, and the formula is shown in Eq. (10).
And average the AP of all categories to get mAP, which is calculated as shown in Eq. (11).
The inference speed frames per second (FPS) is a core indicator of the real-time performance of the model, which indicates the number of image frames that can be processed per second. The larger value of FPS, the faster the inference speed is indicated, and the formula is shown in Eq. (12).
where p denotes image pre-processing time; i denotes inference time; and non-maximum suppression (NMS) denotes post-processing time. In addition, the number of Params of the model is measured by Params, and the degree of consumption of computational resources by the model is measured by giga floating point operations (GFLOPs).
The P–R curves of YOLOv11 and the improved RMD-YOLOv11 for the five primary defect types—cracks, black cores, fragments, finger interruptions, and scratches—are shown in Fig. 10. Ideally, a P–R curve approaching the upper-right corner indicates strong precision–recall consistency. The results demonstrate notable differences between the two models. The baseline YOLOv11 exhibits a steep drop in recall for small-scale defects such as finger interruptions and scratches, suggesting performance degradation under high recall conditions and an increased rate of missed detections. In contrast, RMD-YOLOv11 exhibits significant improvement in the detection of cracks, black cores, and fragments, while achieving moderate gains in finger interruption and scratch categories.
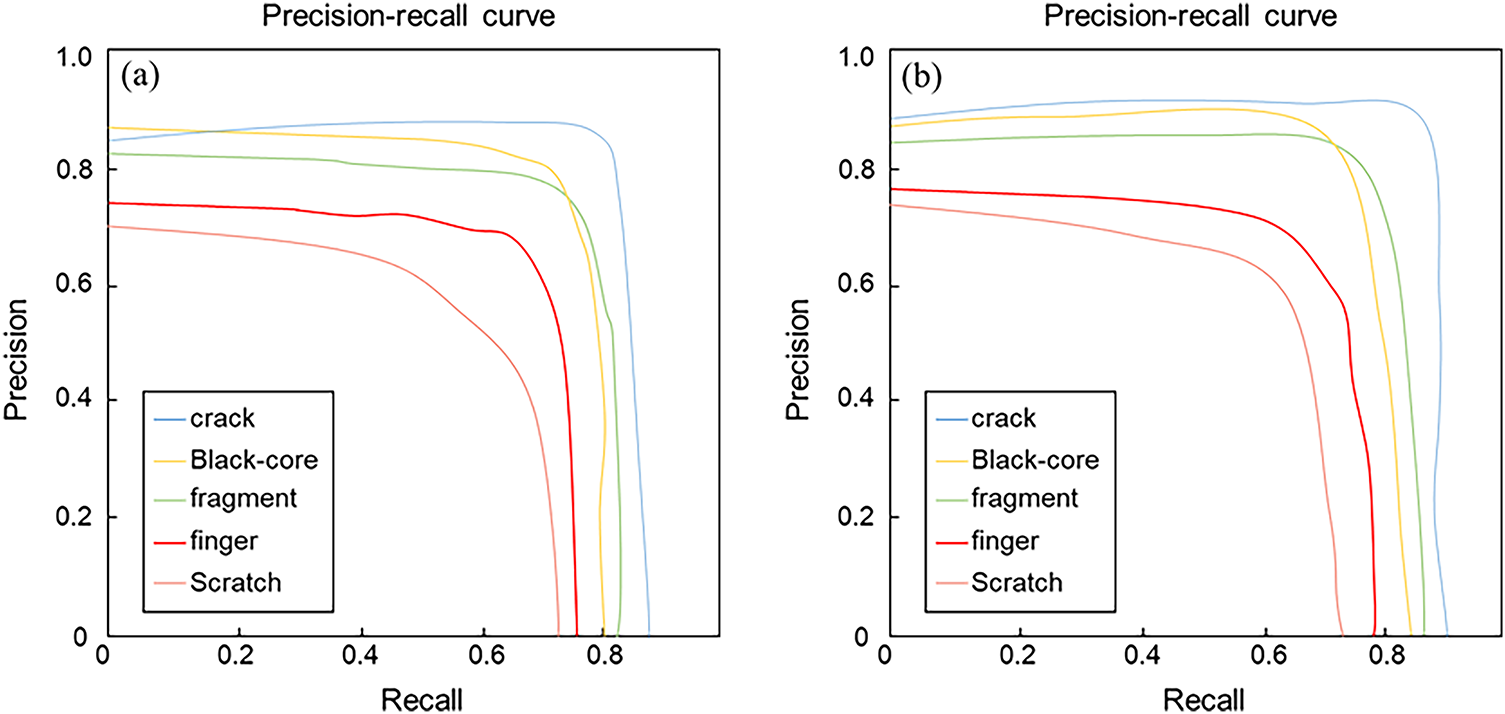
Figure 10: P-R plot. (a) YOLOv11 model; (b) RMD-YOLOv11 model
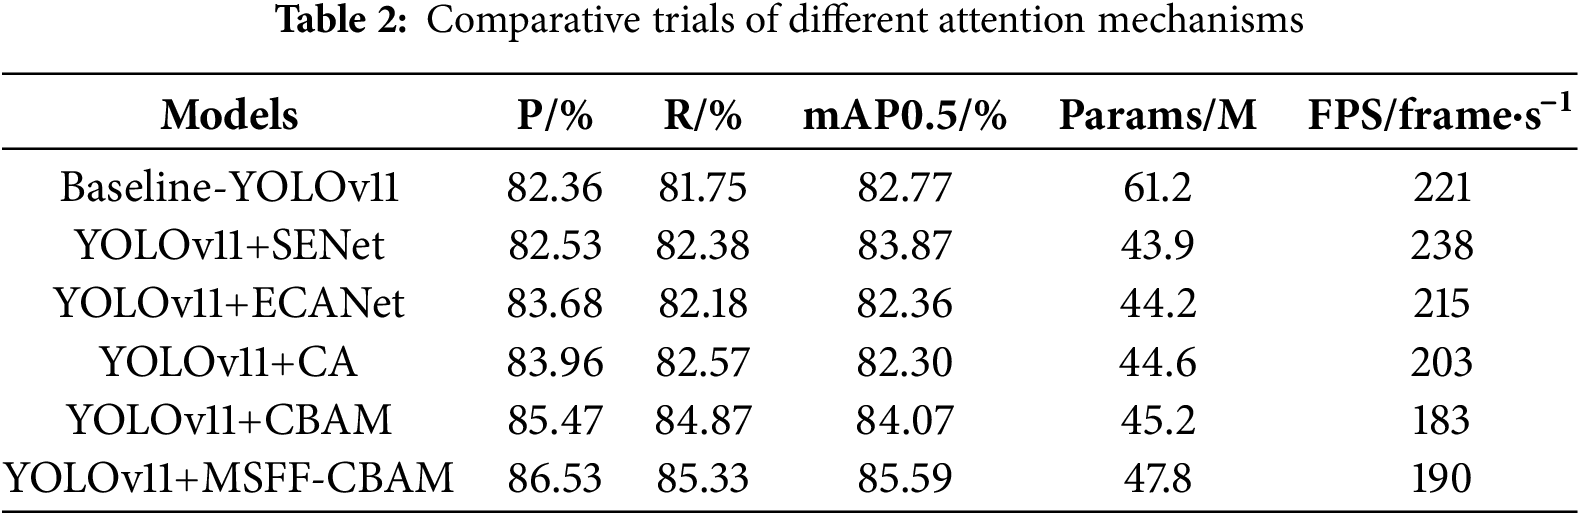
In order to verify the effectiveness of the improved convolutional block attention mechanism, Table 2 demonstrates the performance changes in the PV module defect detection task after introducing different attention mechanisms in the YOLOv11 model. It is evident that, in comparison with Baseline-YOLOv11, the model’s performance is enhanced to varying extents following the incorporation of attention mechanisms. The introduction of the MSFF-CBAM mechanism is of particular significance in this regard, as it enables the model to achieve optimal performance, with a mAP@0.5 of 85.59%, a p-value of 86.53%, and an R-value of 85.33%. This significantly surpasses the performance of other methods in terms of detection precision, accuracy, and recall, thereby verifying the effectiveness of the model in feature expression and defect region modelling. Despite the MSFF-CBAM model comprising 47.8 million parameters and its inference speed being marginally reduced to 190 frame per second, it attains an optimal equilibrium between performance and efficiency. Moreover, it evinces enhanced practicality and promotional value.
In order to assess the degree of optimization of the algorithm performance by each module in the improved model and its different combinations, ablation experiments are conducted on the PVEL-AD dataset with three modules, namely, the RepConv module, the DySample module, and the MSFF-CBAM, and the results of the experiments are shown in Table 3.
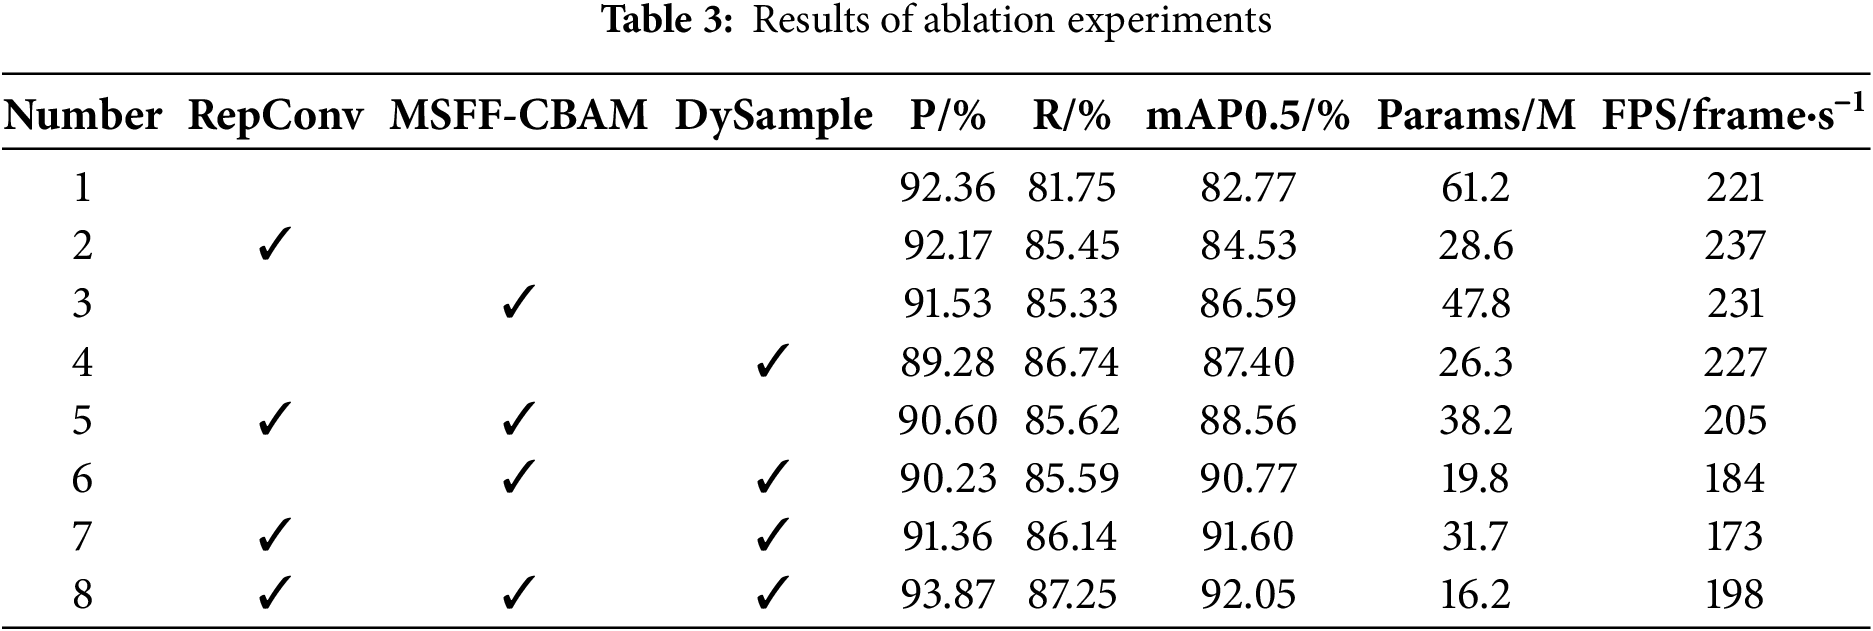
The experimental results demonstrate that the integration of individual modules yields varying degrees of performance enhancement. For instance, the incorporation of the RepConv module alone (configuration 2) elevates the mean Average Precision at IoU threshold 0.5 (mAP@0.5) to 84.53%, while significantly reducing the Params count to 28.6 million, indicating an improved detection accuracy with a compact model architecture. When two modules are combined, such as configuration 5 (RepConv+MSFF-CBAM) and configuration 6 (RepConv+DySample), the mAP@0.5 reaches 88.56% and 91.06%, respectively, thus demonstrating that the combination of modules results in a higher performance than that of single-module configurations, thus suggesting that there are strong complementary effects among modules. The integration of three modules in configuration 8 has been shown to result in optimal performance metrics, with detection precision (P) at 93.87%, recall (R) at 87.25%, and mAP@0.5 at 92.05%, alongside a reduced Params count of 16.2 million. The model attains inference speed of 198 frame/s, which is slightly below the baseline model’s 221 frame/s. However, it maintains a favorable balance between accuracy and real-time processing capability, thus exemplifying an excellent trade-off in precision-speed performance.
In this paper, we undertake a comparative analysis of the performance of various models, including YOLOv5, YOLOv8, YOLOv10, and YOLOv11, in the context of solar cell defect image detection. As demonstrated in Table 4, the proposed method achieves a satisfactory balance between accuracy, complexity, and speed, whilst also exhibiting significant comprehensive advantages.
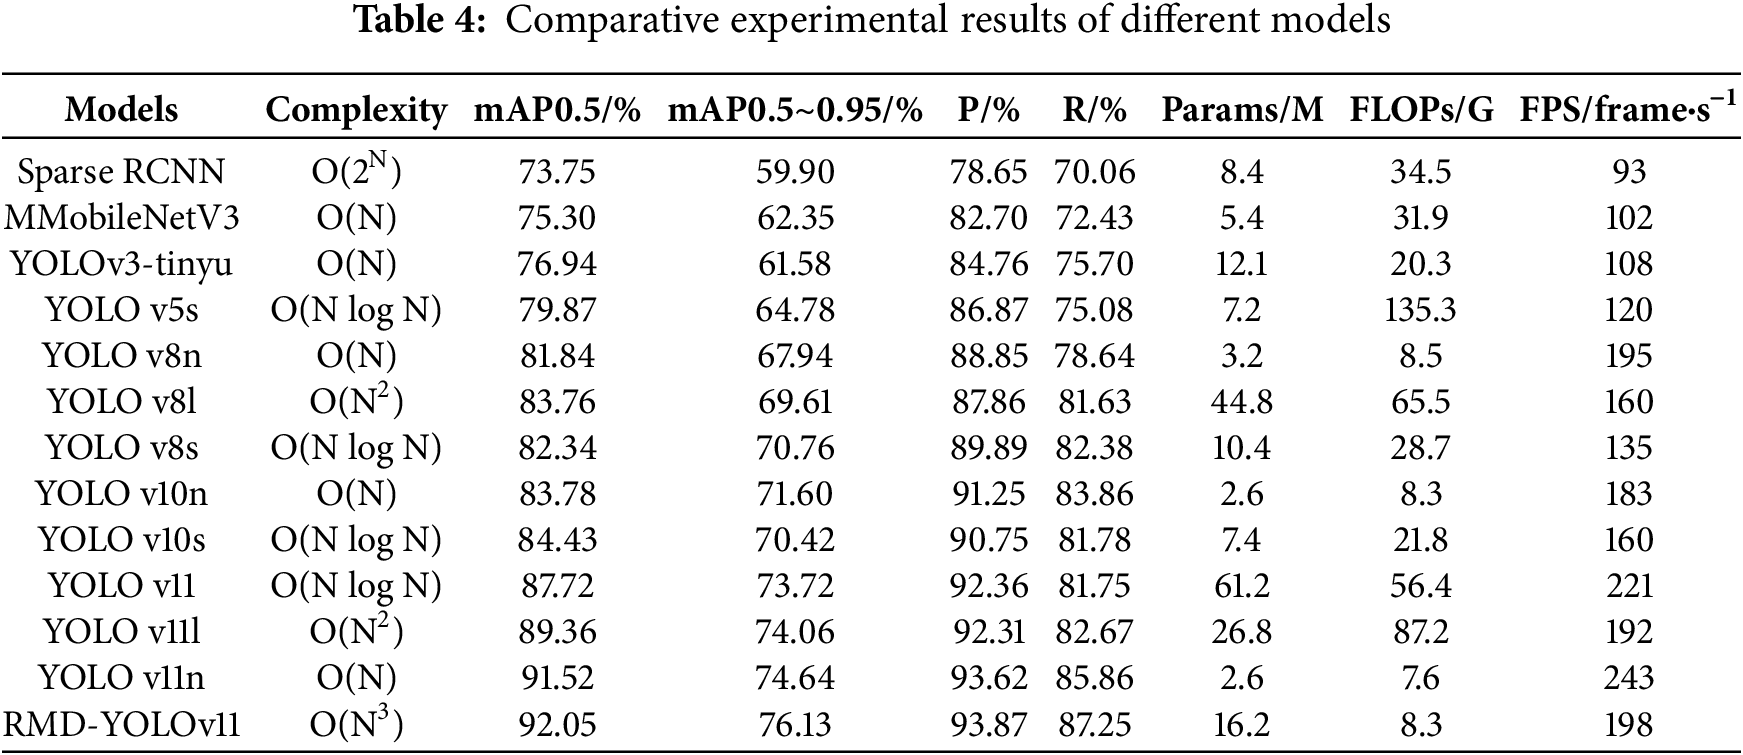
With regard to the accuracy of detection, the proposed methodology achieves optimal results across two primary mean Average Precision (mAP) metrics, with mAP@0.5 reaching 92.05% and mAP@0.5~0.95 attaining 76.13%. These represent enhancements of 4.33% and 2.41% over the baseline YOLOv1 model, respectively, indicating robust detection performance at elevated Intersection over Union (IoU) thresholds. Furthermore, the approach demonstrates a marked enhancement in precision over the high-accuracy variants YOLOv11l (89.36%) and YOLOv11n (91.52%) in mAP@0.5, with increases of 2.07% and 1.49% in mAP@0.5~0.95, respectively. The findings indicate that the proposed enhancements maintain overall detection efficacy while concomitantly providing advantages in the detection of small objects within complex scenes.
With regard to precision and recall, the performance of the proposed methodology is also at the optimal level, with 93.87% and 87.25%, respectively, which is superior to that of other models. The precision rate is 1.51% higher than that of YOLOv11, while the recall rate is 5.5% higher. This indicates that the model can distinguish defects from background more effectively, thus reducing false alarms and missed detections. In the meantime, a comparison of lightweight models such as YOLOv10n (P: 91.25%, R: 83.86%) with YOLOv11n (P: 93.62%, R: 85.86%) demonstrates that the method outlined in this paper continues to exhibit a superior comprehensive identification capability.
The number of parameters in this paper’s model is 16.2M, the smallest among all models, representing only 26.5% of that of YOLOv11 (61.2M for YOLOv11). The FLOPs are 8.3 G, which is considerably lower than the 56.4 G of YOLOv11 and the 256.9 G of YOLOv11l. Despite the substantial compression of the model, the proposed method maintains a high level of processing speed, with an FPS of 198 frames per second. This performance is comparable to that of YOLOv11 (221 frame/s) and YOLOv11n (243 frame/s), both of which are widely regarded as leading approaches in the field. Overall, lightweight models such as MobileNetV3, YOLOv3-tiny, and YOLOv8n/10n maintain linear complexity O(N)for real-time efficiency, while larger variants (YOLOv8l, YOLOv11l) and the proposed RMD-YOLOv11 increase to O(N2)–O(N3), reflecting the trade-off between accuracy and computational cost. This result demonstrates that high inference efficiency can be maintained whilst concomitantly effecting a substantial reduction in model size, thus satisfying the dual requirements of real-time and deployment flexibility in industrial inspection.
3.5 Comparison of Loss Function Effects
As illustrated in Fig. 11a,b, a comparison of the confusion matrix demonstrates the efficacy of the proposed methodology in comparison to the YOLOv11 base model for the solar cell defect classification task. The two models demonstrate significant enhancements in the domains of “Crack”, “Black core” and “Fragment” defects. For instance, the proportion of “Crack” and “Black core” has been shown to increase by 0.06. Due to the inconspicuous appearance of the features and the pixel effect, the percentage of “Finger interruption” and “Fragment” increased by 0.06. The occurrence of “Finger interruption” and “scratch” defects has been observed to exhibit minimal variance, with a marginal increase of 0.02 recorded for “scratch” defects.
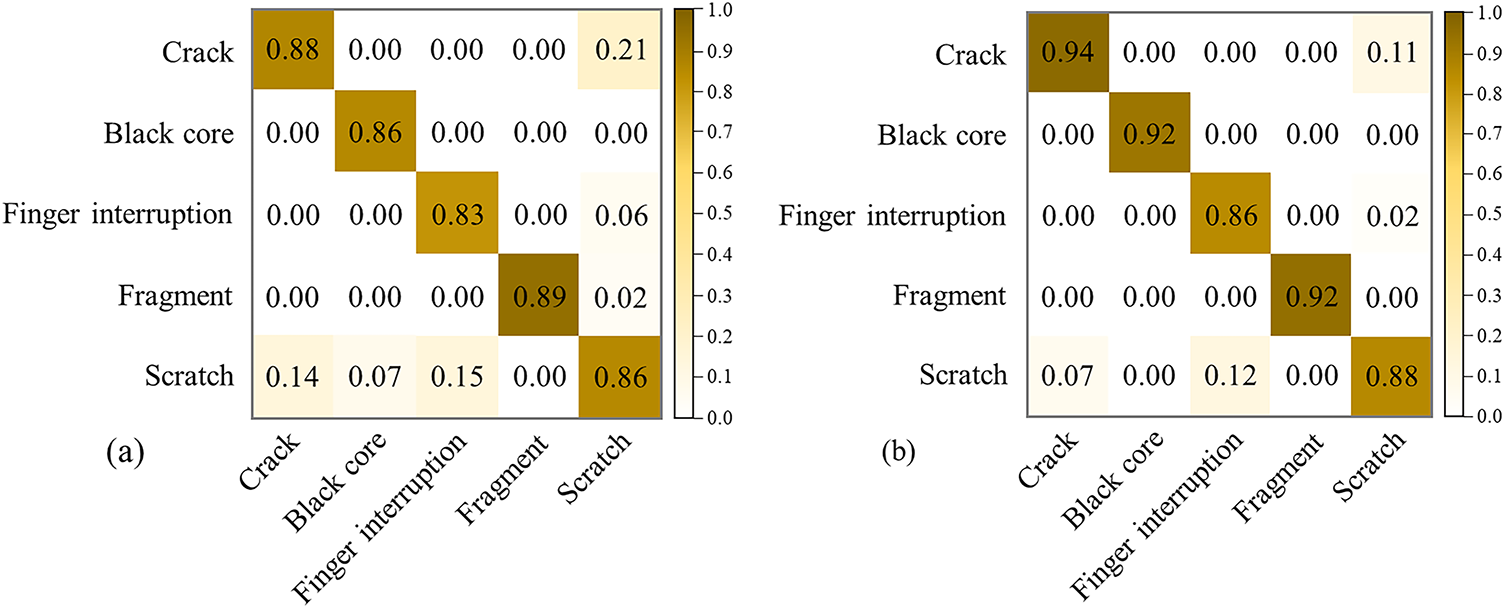
Figure 11: Confusion matrix. (a) YOLOv11; (b) Methods in this paper
Furthermore, the improved model exhibits a decline in the false positive rate across multiple categories, including “Scratch” and “Black core”, along with “Finger interruption” and “Black core”. For instance, the proportion of “Scratch” misclassified as “Crack” diminishes from 0.14 to 0.70, indicative of enhanced category differentiation capacity. In summary, the proposed methodology in this paper enhances the stability and classification accuracy of the model, while maintaining overall accuracy.
3.6 Generalizability Experiments
In order to further validate the generalizability and applicability of the improved YOLOv11n defect detection algorithm proposed in this paper, comparative experiments were conducted again using the ELPV dataset containing 2624 samples, each of which is an 8-bit grayscale image of 300 × 300 pixels, extracted from 44 different PV modules. Including defect types such as cracks (micro-cracks and hidden cracks), Fragment, Black core, corrosion, etc., the training and test sets are divided according to the ratio of 8:2, and the experimental results are shown in Fig. 12.
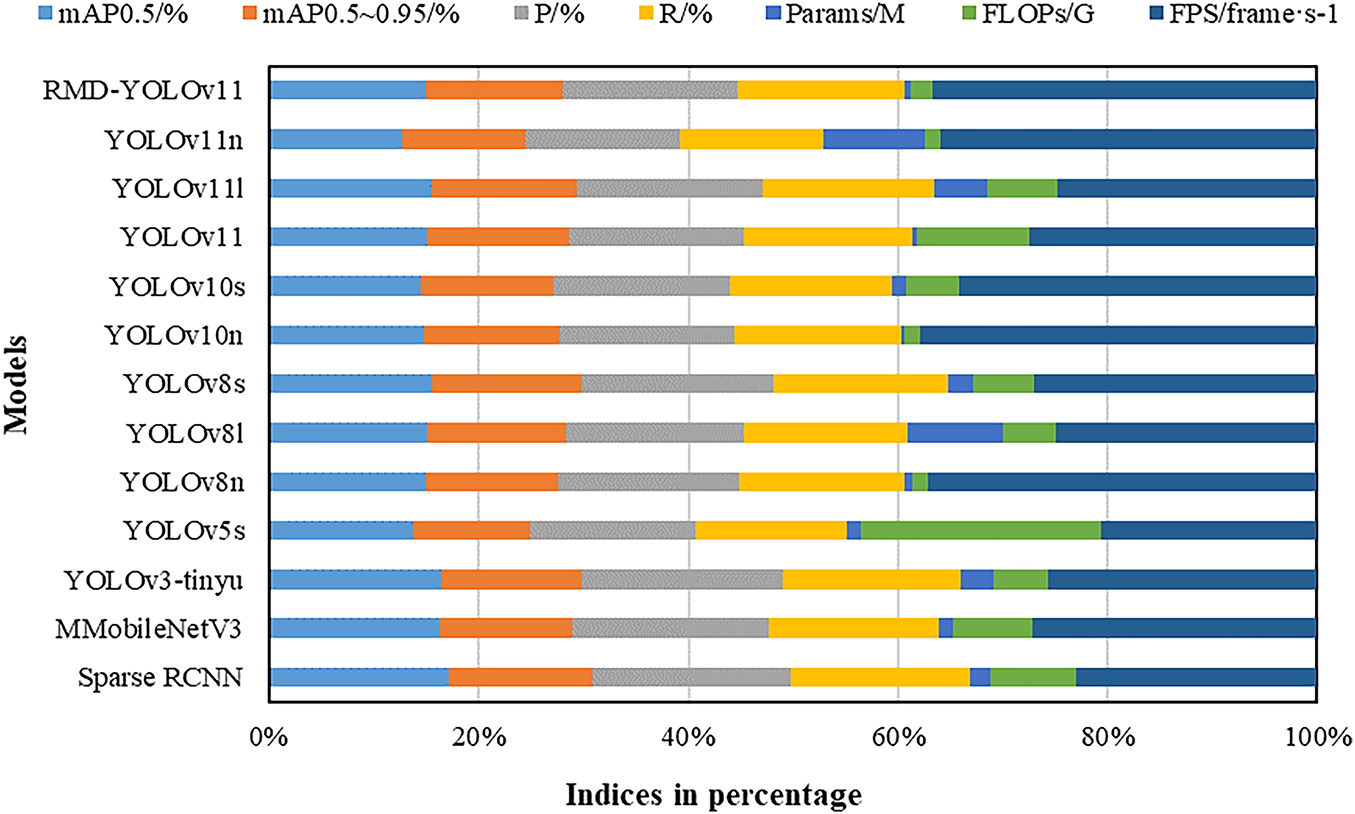
Figure 12: Results of the generalizability experiment
In order to facilitate a more intuitive comparison of the differences across various models in terms of accuracy, complexity, and other multidimensional metrics, this paper normalized the results from the generalized experiments and plotted them in the comprehensive statistical diagram shown in Fig. 10. The diagram reveals significant variations among different detection models in metrics such as mAP, precision (P), recall (R), number of parameters (Params), computational load (FLOPs), and inference speed (FPS). The enhanced models, exemplified by RMD-YOLOv11, evince optimal performance across both mAP 0.5 and mAP 0.5–0.95 metrics, while sustaining elevated precision and recall rates. This finding suggests a notable enhancement in the overall detection capability. Conversely, Sparse RCNN demonstrates comparatively diminished accuracy metrics yet possesses minimal parameters and computational load, rendering it well-suited for applications with limited computational resources. The YOLOv11 series has been demonstrated to exhibit strong scalability across different scales, with YOLOv11l and YOLOv11n achieving a favorable trade-off between accuracy and speed. Lightweight models such as YOLOv3-tiny and MobileNetV3, while exhibiting slightly inferior accuracy, offer outstanding computational efficiency and inference speed, rendering them more suitable for applications demanding high real-time performance. The proportional representation methodically delineates the trade-offs between accuracy and complexity across disparate models, thereby providing pivotal guidance for the selection of suitable detection algorithms in practical applications, with consideration for resource constraints and performance requirements.
3.7 Visualization of Detection Results
To empirically validate the efficacy of the proposed model enhancements, a random selection of representative PV module defect images from the PVEL-AD dataset was subjected to defect detection. The detection outcomes of the original YOLOv11 model were compared with those of the improved YOLOv11 model, as illustrated in Fig. 13.
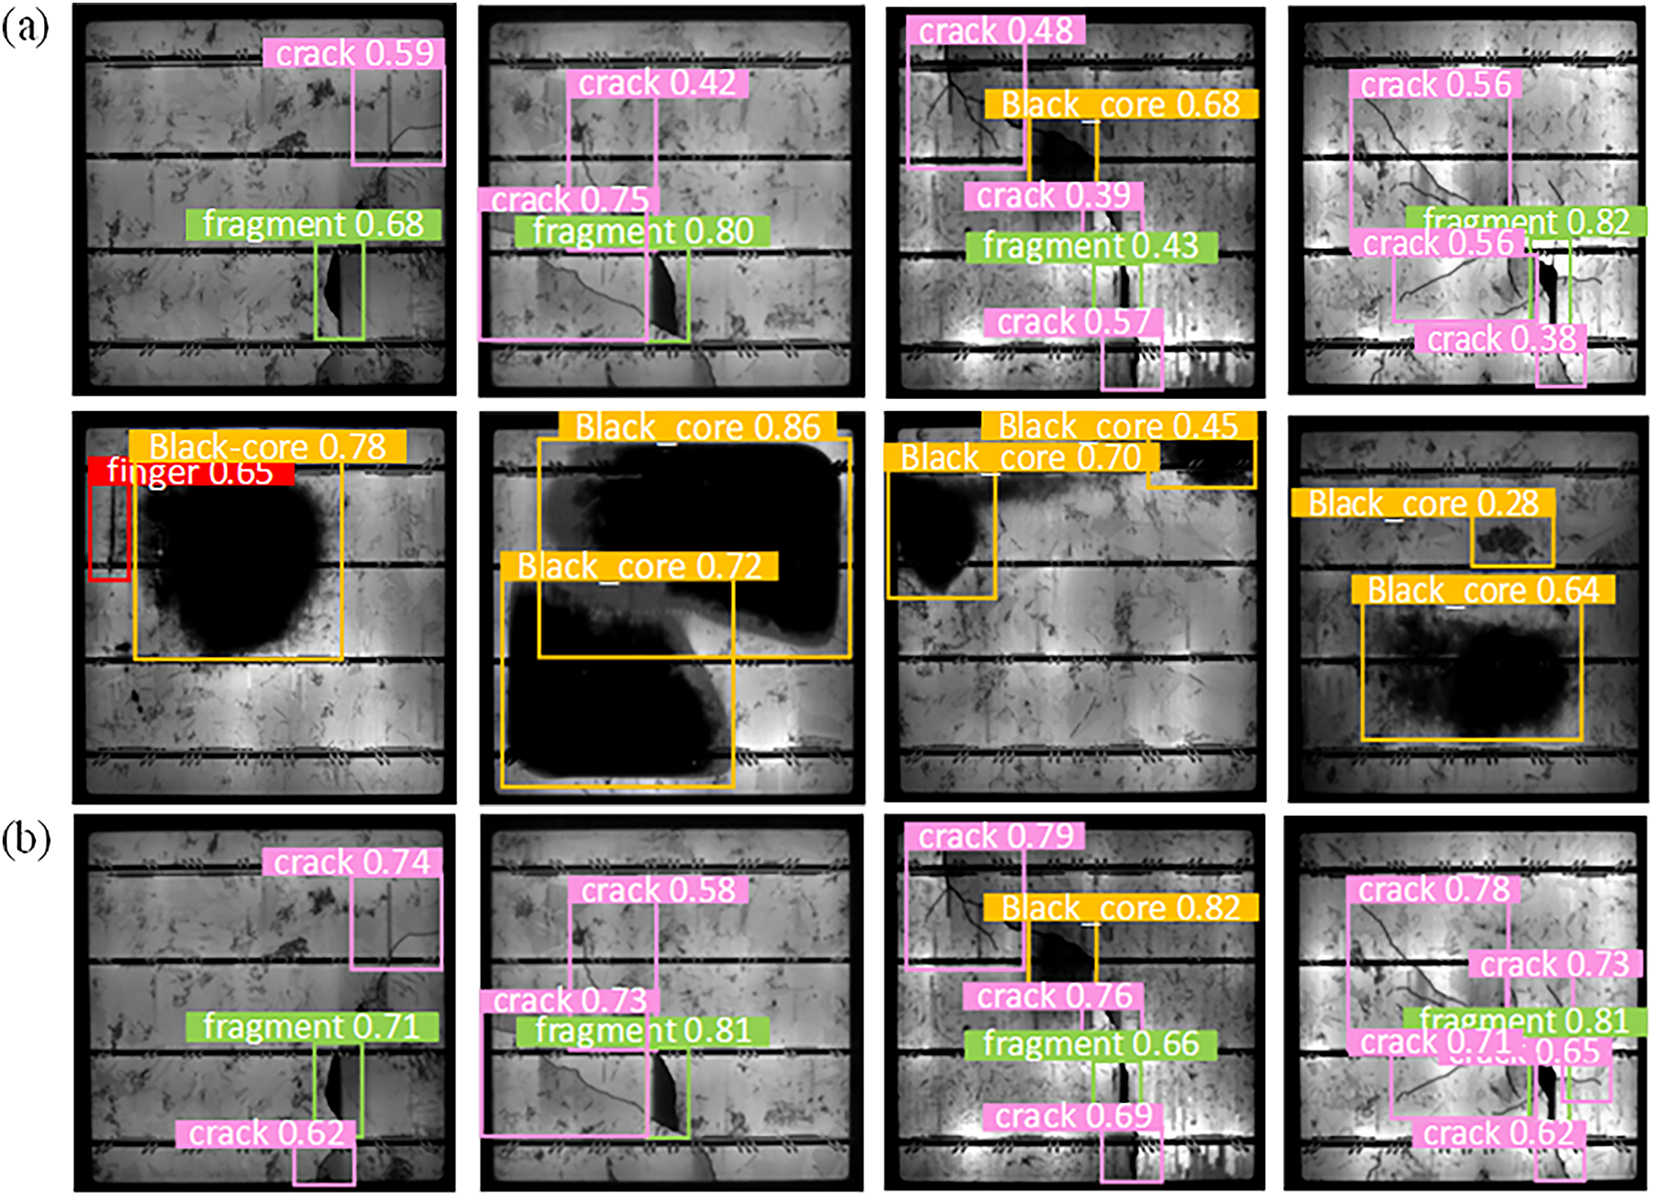
Figure 13: Comparison of detection results. (a) YOLOv11 detection results; (b) detection results of the model in this paper
The following study will make a comparison between the detection results of the aforementioned YOLOv11 and the improved YOLOv11 model. In this system, different colors are used to denote different defects, and numerical values are assigned to indicate the probability of occurrence of each defect. It is asserted that the higher the probability, the more accurate the defect detection. As illustrated in Fig. 13a, the YOLOn11 model demonstrates a propensity for leakage in the detection of minor crack and scratch defects. Furthermore, the model exhibits a reduction in detection accuracy for each defect type. As illustrated in Fig. 13b, the enhanced YOLOv11 model effectively addresses the aforementioned issues by incorporating the RepConv module, the CBAM attention mechanism and the DySample module. This results in more refined feature extraction and higher detection probability.
The present paper addresses the key challenges in the practical deployment of PV module defect detection, including the difficulty of identifying fine-grained defects, the limited robustness of traditional detection algorithms, and resource constraints in deploying deep learning models. The pro-posed enhanced YOLOv11-based defect detection algorithm, termed RMD-YOLOv11, integrates multiple structural improvements. The incorpor-ation of the RepConv module has been demonstrated to enhance the model’s capacity for feature extraction in relation to diverse and complex textural defects. This enhancement is particularly evident in the context of detecting blurred edges and irregular morphological targets, resulting in enhanced accuracy. Furthermore, the MSFF-CBAM has been developed to facilitate joint channel and spatial modelling across disparate receptive fields. This enhancement serves to enhance the model’s ability to focus on minute defect regions, thereby improving generalization without compromising detection precision. The integration of a lightweight dynamic upsampling module, designated as DySample, has been demonstrated to enhance resolution and semantic consistency for small target localization, thereby providing enhanced image reconstruction capabilities for defect detection. The experimental findings, drawn from the publicly accessible PVEL-AD and ELPV defect datasets, demonstrate the superior performance of the proposed RMD-YOLOv11 model in comparison to established YOLO series models across a range of metrics, including mAP@0.5, precision, and recall. The RMD-YOLOv11 model also exhibits notable advantages in terms of inference speed and model size. The performance of this study depends on the quality of the training data and imaging conditions. It has limited generalization capability when confronted with unknown defect types or extreme environments. Subsequent research endeavors will concentrate on augmenting the model’s adaptability within intricate environments, encompassing low-light conditions, multi-angle imaging, and variable weather scenarios. This will be undertaken to facilitate its practical implementation in intelligent PV maintenance.
Acknowledgement: Not applicable.
Funding Statement: This work was supported by the Gansu Provincial Department of Education Industry Support Plan Project (2025CYZC-018).
Author Contributions: The authors confirm their contributions to the paper as follows: Tao Geng: model architecture design, writing the first draft; Shuaibing Li: query the dataset, provide research resources and analysis results; Yunyun Yun, Yongqiang Kang, Hongwei Li and Junmin Zhu: The manuscript was critically reviewed for technical content and the final version was approved. All authors reviewed the results and approved the final version of the manuscript.
Availability of Data and Materials: The two datasets used in this study are publicly available. The PVEL-AD dataset can be accessed at: https://github.com/binyisu/PVEL-AD (accessed on 01 August 2025). The ELPV dataset is available from: https://github.com/zae-bayern/elpv-dataset (accessed on 01 August 2025).
Ethics Approval: Not applicable.
Conflicts of Interest: The authors declare no conflicts of interest to report regarding the present study.
References
1. EL-Rashidy N, Ali ZH, Sultan YA. A predictive machine learning approach for early fault identification in solar photovoltaic systems. Electr Power Syst Res. 2025;247(3):111856. doi:10.1016/j.epsr.2025.111856. [Google Scholar] [CrossRef]
2. Su B, Chen H, Chen P, Bian G, Liu K, Liu W. Deep learning-based solar-cell manufacturing defect detection with complementary attention network. IEEE Trans Ind Inform. 2021;17(6):4084–95. doi:10.1109/TII.2020.3008021. [Google Scholar] [CrossRef]
3. Ghahremani A, Adams SD, Norton M, Khoo SY, Kouzani AZ. Advancements in AI-driven detection and localisation of solar panel defects. Adv Eng Inform. 2025;64(1):103104. doi:10.1016/j.aei.2024.103104. [Google Scholar] [CrossRef]
4. Skoczek A, Sample T, Dunlop ED, Ossenbrink HA. Electrical performance results from physical stress testing of commercial PV modules to the IEC 61215 test sequence. Sol Energy Mater Sol Cells. 2008;92(12):1593–604. doi:10.1016/j.solmat.2008.07.008. [Google Scholar] [CrossRef]
5. Bashahu M, Habyarimana A. Review and test of methods for determination of the solar cell series resistance. Renew Energy. 1995;6(2):129–38. doi:10.1016/0960-1481(94)E0021-V. [Google Scholar] [CrossRef]
6. Cubukcu M, Akanalci A. Real-time inspection and determination methods of faults on photovoltaic power systems by thermal imaging in Turkey. Renew Energy. 2020;147:1231–8. doi:10.1016/j.renene.2019.09.075. [Google Scholar] [CrossRef]
7. Tsai DM, Wu SC, Li WC. Defect detection of solar cells in electroluminescence images using Fourier image reconstruction. Sol Energy Mater Sol Cells. 2012;99:250–62. doi:10.1016/j.solmat.2011.12.007. [Google Scholar] [CrossRef]
8. Shen Z, Dai H, Mei H, Tu Y, Wang L. Defect detection in c-Si photovoltaic modules via transient thermography and deconvolution optimization. Chin J Electr Eng. 2024;10(1):3–11. doi:10.23919/CJEE.2023.000043. [Google Scholar] [CrossRef]
9. Cuevas E, Zaldivar D, Pérez-Cisneros M. A novel multi-threshold segmentation approach based on differential evolution optimization. Expert Syst Appl. 2010;37(7):5265–71. doi:10.1016/j.eswa.2010.01.013. [Google Scholar] [CrossRef]
10. Peric N. Fuzzy logic and fuzzy set theory based edge detection algorithm. Serb J Electr Eng. 2015;12(1):109–16. doi:10.2298/sjee1501109p. [Google Scholar] [CrossRef]
11. Cing DL, Soe KM. Improving accuracy of part-of-speech (POS) tagging using hidden Markov model and morphological analysis for Myanmar Language. Int J Electr Comput Eng IJECE. 2020;10(2):2023. doi:10.11591/ijece.v10i2.pp2023-2030. [Google Scholar] [CrossRef]
12. Ghahremani A, Adams SD, Norton M, Khoo SY, Kouzani AZ. Detecting defects in solar panels using the YOLO v10 and v11 algorithms. Electronics. 2025;14(2):344. doi:10.3390/electronics14020344. [Google Scholar] [CrossRef]
13. Pan W, Sun X, Wang Y, Cao Y, Lang Y, Qian Y. Enhanced photovoltaic panel defect detection via adaptive complementary fusion in YOLO-ACF. Sci Rep. 2024;14(1):26425. doi:10.1038/s41598-024-75772-9. [Google Scholar] [PubMed] [CrossRef]
14. Zhang M, Yin L. Solar cell surface defect detection based on improved YOLO v5. IEEE Access. 2022;10(10):80804–15. doi:10.1109/ACCESS.2022.3195901. [Google Scholar] [CrossRef]
15. Cao Y, Pang D, Zhao Q, Yan Y, Jiang Y, Tian C, et al. Improved YOLOv8-GD deep learning model for defect detection in electroluminescence images of solar photovoltaic modules. Eng Appl Artif Intell. 2024;131(5):107866. doi:10.1016/j.engappai.2024.107866. [Google Scholar] [CrossRef]
16. Aktouf L, Shivanna Y, Dhimish M. High-precision defect detection in solar cells using YOLOv10 deep learning model. Solar. 2024;4(4):639–59. doi:10.3390/solar4040030. [Google Scholar] [CrossRef]
17. Zhu J, Zhou D, Lu R, Liu X, Wan D. C2DEM-YOLO: improved YOLOv8 for defect detection of photovoltaic cell modules in electroluminescence image. Nondestruct Test Eval. 2025;40(1):309–31. doi:10.1080/10589759.2024.2319263. [Google Scholar] [CrossRef]
18. Yadav DP, Sharma B, Olague G. Explainable attention-based fuzzy residual convolution network for solar cell defect identification and classification. Eng Appl Artif Intell. 2025;158(1):111475. doi:10.1016/j.engappai.2025.111475. [Google Scholar] [CrossRef]
19. Liu Y, Wu Y, Yuan Y. DMR-RTDETR: a multiscale and context-aware measurement framework for quantitative characterization of photovoltaic module thermal anomalies with uncertainty analysis. IEEE Trans Instrum Meas. 2025;74(3):5039614–14. doi:10.1109/TIM.2025.3586353. [Google Scholar] [CrossRef]
20. Cui X, Zhu L, Zhao B, Wang R, Han Z, Zhang W, et al. Parallel RepConv network: efficient vineyard obstacle detection with adaptability to multi-illumination conditions. Comput Electron Agric. 2025;230(32):109901. doi:10.1016/j.compag.2025.109901. [Google Scholar] [CrossRef]
21. Wang W, Tan X, Zhang P, Wang X. A CBAM based multiscale transformer fusion approach for remote sensing image change detection. IEEE J Sel Top Appl Earth Obs Remote Sens. 2022;15:6817–25. doi:10.1109/JSTARS.2022.3198517. [Google Scholar] [CrossRef]
22. Chen L, Yao H, Fu J, Tai Ng C. The classification and localization of crack using lightweight convolutional neural network with CBAM. Eng Struct. 2023;275:115291. doi:10.1016/j.engstruct.2022.115291. [Google Scholar] [CrossRef]
23. Na C, Zhou Y, Li F, Pan H. MAMBA2NILM: a non-intrusive load monitoring approach combined the SENet attention mechanism and Mamba2. Electr Power Syst Res. 2025;247(12):111805. doi:10.1016/j.epsr.2025.111805. [Google Scholar] [CrossRef]
24. Xia Y, Guan D, Zhou Z. CNN-SENet: a GNSS-R ocean wind speed retrieval model integrating CNN and SENet attention mechanism. Satell Navig. 2025;6(1):3. doi:10.1186/s43020-024-00157-2. [Google Scholar] [CrossRef]
25. Tian W, Li B, Cao J, Di F, Li Y, Liu J. An improved YOLOv5 model for concrete bubble detection based on area K-means and ECANet. Mathematics. 2024;12(17):2777. doi:10.3390/math12172777. [Google Scholar] [CrossRef]
26. Li G, Shi G, Jiao J. YOLOv5-KCB: a new method for individual pig detection using optimized K-means, CA attention mechanism and a bi-directional feature pyramid network. Sensors. 2023;23(11):5242. doi:10.3390/s23115242. [Google Scholar] [PubMed] [CrossRef]
27. Liu H, Yang G, Deng F, Qian Y, Fan Y. MCBAM-GAN: the Gan spatiotemporal fusion model based on multiscale and CBAM for remote sensing images. Remote Sens. 2023;15(6):1583. doi:10.3390/rs15061583. [Google Scholar] [CrossRef]
28. Du Z, Liang Y. Object detection of remote sensing image based on multi-scale feature fusion and attention mechanism. IEEE Access. 2024;12(2):8619–32. doi:10.1109/ACCESS.2024.3352601. [Google Scholar] [CrossRef]
29. Wang Y, Zhang P, Tian S. Tomato leaf disease detection based on attention mechanism and multi-scale feature fusion. Front Plant Sci. 2024;15:1382802. doi:10.3389/fpls.2024.1382802. [Google Scholar] [PubMed] [CrossRef]
30. Wang T, Xia H, Xie J, Li J, Liu J. A multi-scale feature focus and dynamic sampling-based model for Hemerocallis fulva leaf disease detection. Agriculture. 2025;15(3):262. doi:10.3390/agriculture15030262. [Google Scholar] [CrossRef]
Cite This Article
 Copyright © 2026 The Author(s). Published by Tech Science Press.
This work is licensed under a Creative Commons Attribution 4.0 International License , which permits unrestricted use, distribution, and reproduction in any medium, provided the original work is properly cited.
 Downloads
 Citation Tools