
 Submit a Paper
 Propose a Special lssue
 Open Access
ARTICLE
Machine Learning Based Simulation, Synthesis, and Characterization of Zinc Oxide/Graphene Oxide Nanocomposite for Energy Storage Applications
1 Department of Electronics, Institute of Physics, Government College University, Lahore, 54000, Pakistan
2 Department of Information Sciences, Division of Science and Technology, University of Education, Township Campus, Lahore, 54000, Pakistan
3 Date Palm Research Centre of Excellence, King Faisal University, Al-Ahsa, 31982, Saudi Arabia
* Corresponding Authors: Tahir Mahmood. Email: ; Muhammad Waseem Ashraf. Email:
(This article belongs to the Special Issue: Advanced Modeling of Smart and Composite Materials and Structures)
Computers, Materials & Continua 2026, 86(3), 16 https://doi.org/10.32604/cmc.2025.072436
Received 27 August 2025; Accepted 23 October 2025; Issue published 12 January 2026
 View Full Text
 Download PDF
Abstract
Artificial intelligence (AI) based models have been used to predict the structural, optical, mechanical, and electrochemical properties of zinc oxide/graphene oxide nanocomposites. Machine learning (ML) models such as Artificial Neural Networks (ANN), Support Vector Regression (SVR), Multilayer Perceptron (MLP), and hybrid, along with fuzzy logic tools, were applied to predict the different properties like wavelength at maximum intensity (444 nm), crystallite size (17.50 nm), and optical bandgap (2.85 eV). While some other properties, such as energy density, power density, and charge transfer resistance, were also predicted with the help of datasets of 1000 (80:20). In general, the energy parameters were predicted more accurately by hybrid models. The hydrothermal method was used to synthesize graphene oxide (GO) and zinc oxide (ZnO) nanocomposites. The increased surface area, conductivity, and stability of graphene oxide in zinc oxide nanoparticles make the composite an ideal option for energy storage. X-ray diffraction (XRD) confirmed the crystallite size of 17.41 nm for the nanocomposite and the presence of GO (12.8°) peaks. The scanning electron microscope (SEM) showed anchored wrinkled GO sheets on zinc oxide with an average particle size of 2.93 μm. Energy-dispersive X-ray spectroscopy (EDX) confirmed the elemental composition, and Fourier-transform infrared spectroscopy (FTIR) revealed the impact of GO on functional groups and electrochemical behavior. Photoluminescence (PL) wavelength of (439 nm) and band gap of (2.81 eV) show that the material is suitable for energy applications in nanocomposites. Smart nanocomposite materials with improved performance in energy storage and related applications were fabricated by combining synthesis, characterization, fuzzy logic, and machine learning in this work.Keywords
New developments in science and technologies need more advanced and smart nanocomposite materials, integration of nanostructures, and nanocomposites for the storage of charges, such as supercapacitors, batteries, and fuel cells. Wearable electronic devices and the Internet of Things (IoT) have created a need for innovative energy harvesting and storage solutions with the development of advanced nanomaterials like graphene oxide-doped ZnO [1]. Graphene oxide-doped ZnO nanocomposites are an exciting field for researchers, giving rise to innovation in nanoscience, material science, and smart nanocomposite materials for energy storage devices. Zinc oxide (ZnO) is a material belonging to the semiconductor family. It has a wide band gap value of 3.37 eV [2], a high value of exciton binding energy (60 meV), a large value of electron mobility (100–200 cm2·V−1·s−1) [3,4], low cost, besides being easily available and having unique optical, electrical, and mechanical properties [5]. So, it is the best nanocomposite for smart energy storage devices, the Triboelectric Nanogenerator [6], flexible self-powered electronics, and nanostructures. ZnO-based charge storage gadgets lie between the capacitor and battery range [7]. These devices contain a dielectric medium placed between the two electrodes, which electrostatically attracts the oppositely charged plates, and there is no transfer of charges through this dielectric [8]. The electrodes are fabricated with a material having a large value of surface area, such as graphene oxide and activated carbon.
Many research articles have been published on materials belonging to transition metal oxides (TMOs) due to their huge amount in nature, low cost, and economic workability. These are efficient electrode materials that are under observation thanks to their large range of applications and the benefits of their electrochemical properties [9]. Zinc oxide is an inorganic compound also known as zinc white and calamine [10]. It is an n-type semiconductor material, highly used in various devices like physical sensors, biosensors, smart nanocomposite materials for energy storage devices, piezoelectric devices, solar cells, supercapacitors, and as catalysts [11].
In contrast, graphene oxide is a two-dimensional material made up of a single sheet of hexagonally organized carbon atoms [12]. In graphene oxide, carbon atoms are packed in a planar honeycomb network. It is an allotropic form of carbon [13]. It has a strong light-absorption ability [14]. Zinc oxide and graphene oxide together have the potential to create a new class of nanocomposite with improved electrical conductivity, mechanical strength, optical properties [15], and thermal properties [16]. It is expected to be an excellent material for flexible self-powered electronic devices, physical sensors, flexible devices, smart nanocomposite material for energy storage devices, and nanostructures due to its superior properties of electrical conductance and vast active surface area, besides having good thermal, electrical, mechanical, and electrochemical properties [17]. It has a large surface area and provides a platform for the synthesis of nanocomposites [18,19].
The fabrication of ZnO/GO nanocomposite has been the subject of immense research because of its huge demand in different areas, such as energy conversion and storage, catalysis, piezo electronics, and nano electronics [20]. One of the major challenges in the fabrication of graphene oxide-doped ZnO nanocomposites is achieving good dispersion of graphene oxide in the ZnO matrix [21]. The graphene oxide sheets tend to agglomerate, limiting their effective surface area and hindering their interaction with ZnO [22]. The addition of graphene oxide to zinc oxide increases the charge transportation and structural stability of the nanocomposite [1]. The combined effect of a nanocomposite enhances the electrochemical characteristics [23]. The impact of different deposition parameters like current density, deposition time, and electrolytic composition on the morphology, structures, and characteristics of nanocomposites can be investigated [13].
The synergistic mechanism on the ZnO/GO nanocomposite can be observed in such a way that ZnO gives the pseudocapacitance behavior through the mechanics of reversible redox reaction, while graphene oxide gives the electric double layer capacitance (EDLC) due to the high conductivity and large surface area. The addition of graphene oxide into zinc oxide not only improves the dispersion of zinc oxide it also improves the energy density, capacitance, and stable cycling by reducing the charge transfer resistance of the nanocomposite.
To enhance the speed and develop a new and smart nanocomposite material in the field of material science, Machine learning (ML) is an important tool to study the characteristics of nanomaterials and to optimize the synthesis parameters [24]. Machine learning techniques reduce the need for previously used trial-and-error techniques by introducing new steps in experimental data to design and develop new and advanced nanomaterials for energy applications [25]. By training widely and effectively using ML models such as Artificial Neural Networks, Multilayer Perceptrons, Support Vector Regression, and hybrid models, a strong agreement has been developed with the synthesis parameters, functional aspect, and structural traits of the nanocomposites. By using these models, all key energy-related parameters, such as optical energy bandgap, crystalline size, photoluminescence wavelength at maximum intensity, energy density, power density, and charge storage capacity, were accurately estimated. By using these predictive tools, experimental costs are reduced, and rapid material screening and quicker development of efficient energy storage devices are achieved.
Specific parameters can be achieved by using machine learning techniques because these facilitate investigating the nonlinear and complex interactions. We can correlate the simulated and experimental data for designing the supercapacitor and batteries for advanced energy storage applications by using the ML models. By implementing the ML techniques on semiconductor nanocomposites for the properties of bandgap and electrical structure, different studies show a high value of prediction accuracy [26]. While Fuzzy logic simulation is effectively used for optimizing the parameters.
The hydrothermal process was used to fabricate the ZnO/GO nanocomposites, which is the key result of this study. The prior research did not have integration of ML, FL, and experimental results, so it provides slow material optimization with a low value of precision. The experimental results give a strong correlation with the results of FL and ML. While this research incorporates the experimental results with the ML and FL results, with a high value of accuracy, we can design these nanocomposites for the application of energy storage devices.
This study is a novel integration of ML, FL, and experimental techniques to fabricate the (ZnO/GO) nanocomposites for the energy storage application. This research gives the optimization of key properties like optical band gap, crystallite size, and charge storage capacity. It also combines the hydrothermal synthesis technique with the ML models, such as ANN, MLP, SVR, and hybrid, as well as fuzzy logic simulation. This technique is also useful for the enhancement of electromechanical properties, electrical conductivity, and stability of the structure. It also addresses the issue of graphene oxide dispersion to prepare the nanocomposite with zinc oxide. SEM and XRD were used to understand the morphological and structural analysis. The incorporation of computational and experimental study designs a new and advanced nanocomposite for energy storage applications, as well as for flexible electronic devices for the next generation.
A fuzzy logic tool is used for numerical calculation, visualization, and complex data analysis. Simulation can be conducted for a variety of purposes, including understanding complex systems, testing hypotheses, predicting future states, and optimizing performance. Here, the band gap value, wavelength at the maximum intensity, and crystal size of the nanocomposites have been estimated using fuzzy-logic-based access. In this work, we used the fuzzy tool; the input ranges and membership function (MF) in fuzzy logic (FL) specify how each input value corresponds to a fuzzy set’s degree of belonging, which ranges from 0 to 1, were chosen based on both our experimental work and values reported in the literature [27]. Triangular membership functions with the Mamdani model were employed. The input ranges used to cover the real synthesis window pertinent to ZnO/GO nanocomposites were as follows: ZnO% (10–90), GO% (10–90), and molarity (0.1–1 M). We synthesized samples at 90 wt.% ZnO and 10 wt.% GO for our investigations, although the wider ranges represent compositions frequently investigated in related research to enable interpolation over realistic boundaries. Our experimental observations yielded the following output ranges: crystal size (15–20 nm), band gap (2.2–3.5 eV), and wavelength (375–500 nm). Fig. 1 displays the visualization interface for fuzzy logic.
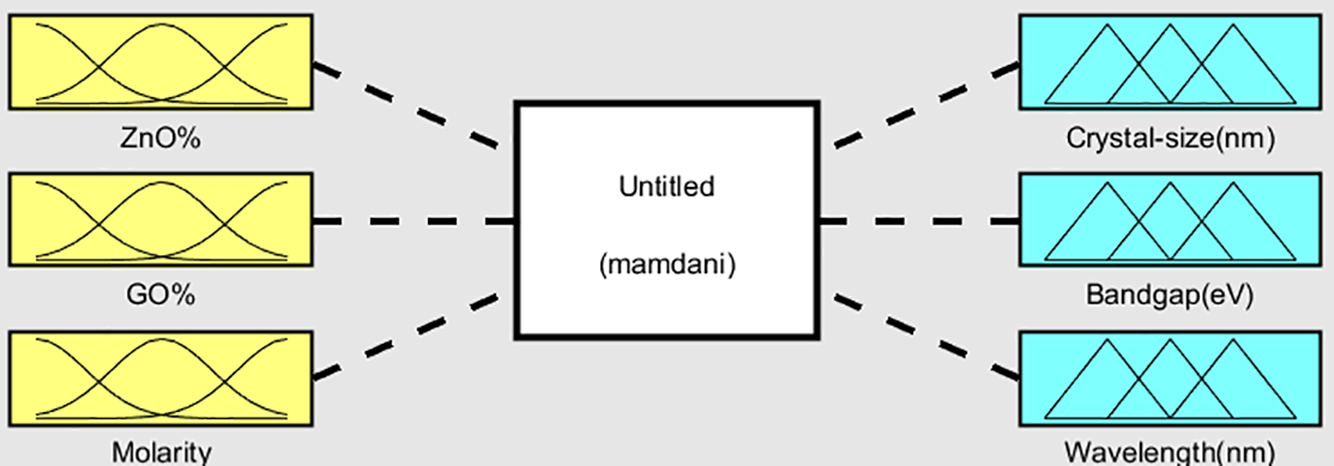
Figure 1: Fuzzy logic interface
Since the study focuses on ZnO/GO nanocomposites, where these components critically define material properties, ZnO% and GO% were chosen as fuzzy logic inputs. Since molarity has a direct impact on the nanocomposite’s composition and structural development, it was included. To guarantee smooth overlap and precise modeling of parameter interactions, triangular membership functions with low, medium, and high terms were designed. We set inference rules for its operation and get the results. The ranges and membership functions were managed in the function editor for the fuzzy-based algorithm. As a result, the membership design and input selection are both in line with accepted Mamdani fuzzy modeling practices and directly supported by experimental findings. Membership functions interface with three possible options, low, medium, and high, for output variables are shown in Fig. 2a–c.
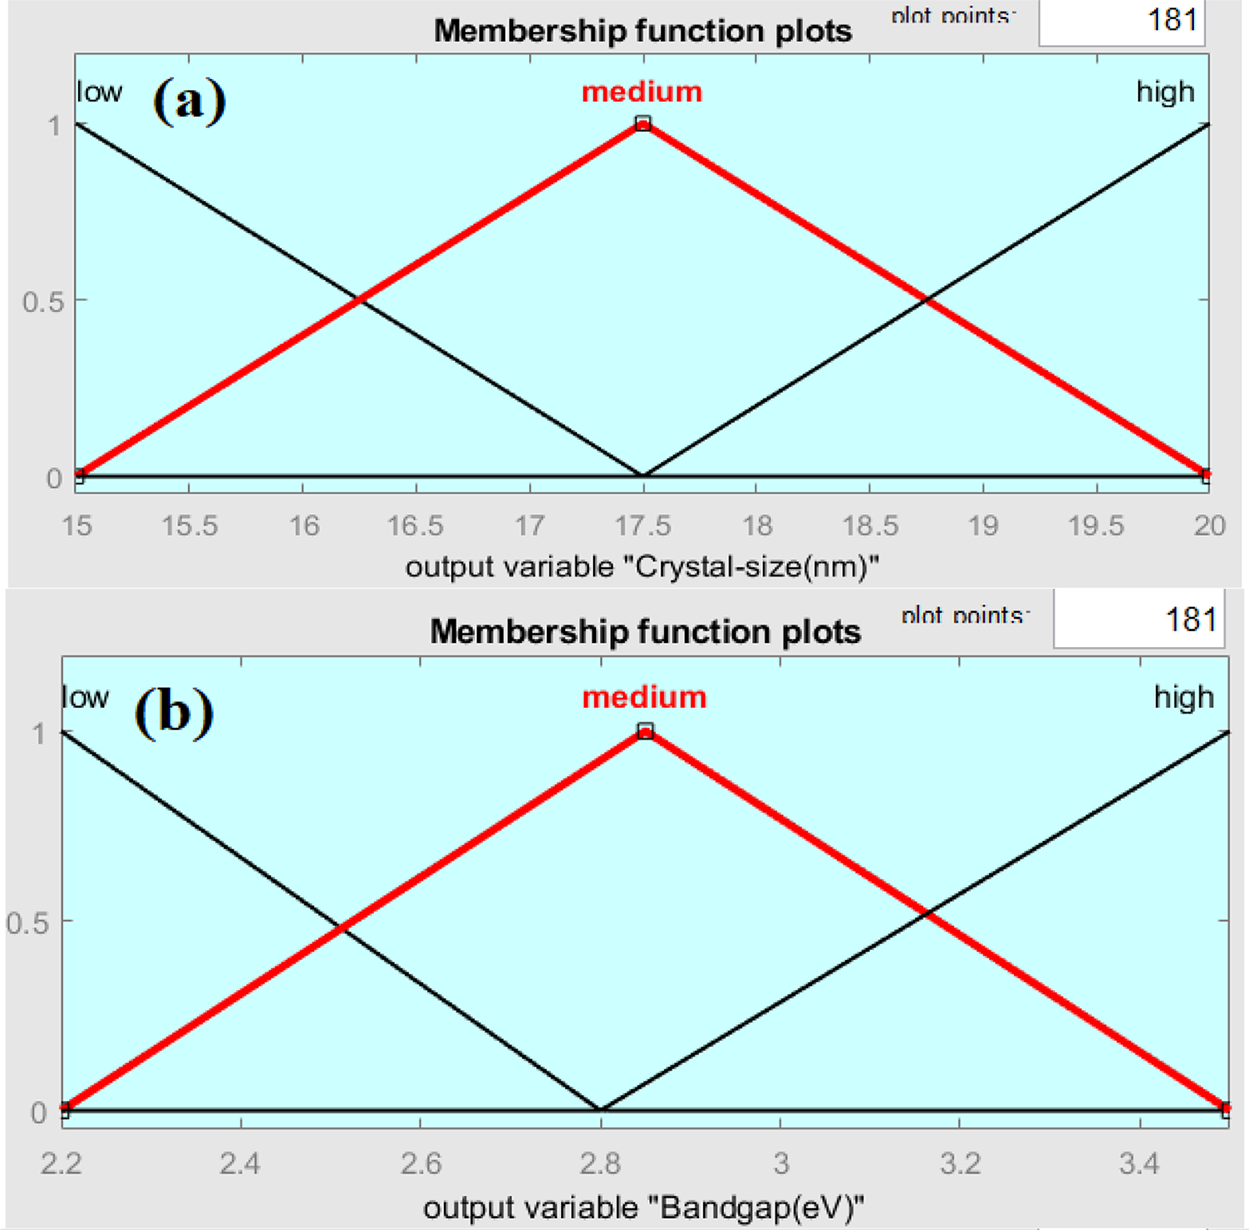
Figure 2: Membership function plot for output crystal size (a), Band gap (b), and Wavelength (c) Variables
Fig. 2a–c shows comparable curve shapes produced by the triangle membership functions utilized in the fuzzy logic model; however, each plot corresponds to a different parameter domain (crystallite size, band gap, wavelength). While the various x-axis ranges capture the unique properties of each variable, this standard form guarantees consistency. The fuzzy logic access has been utilized for the approximation of the optical energy band gap, wavelength at maximum intensity, and crystal size of graphene oxide-doped ZnO nanocomposite. Fig. 3 shows the rules viewer for crisp values, which provides the real-time optimized values of the optical band gap, peak wavelength value, and crystal size using 90 wt.% ZnO, 10 wt.% graphene oxide, and a molarity of solution 0.3 mol/L as an input, it was possible to get the value of 2.85 eV band gap as an output with wavelength 444 nm and crystal size 17.5 nm for this nanocomposite. The fuzzy logic rules based on two-dimensional (2D) and three-dimensional (3D) resultant plots, depending on the values of the inputs and outputs, are shown in Figs. 4a,b and 5a–d, respectively.
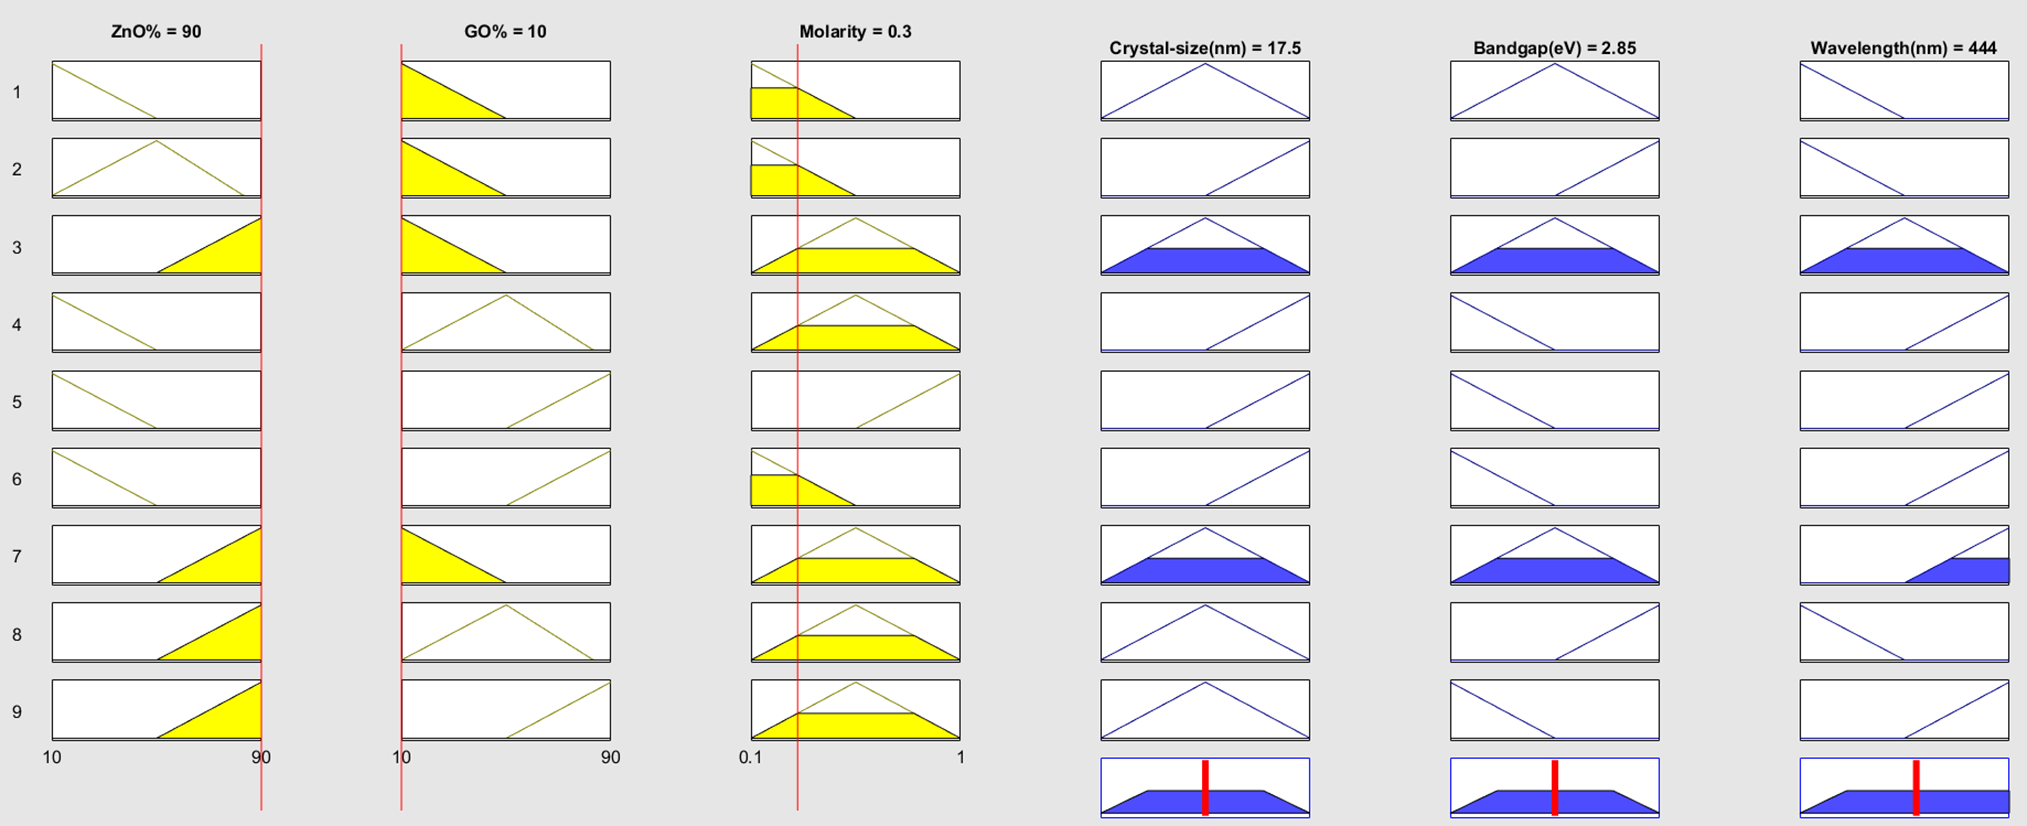
Figure 3: Rules viewer graph for crisp values
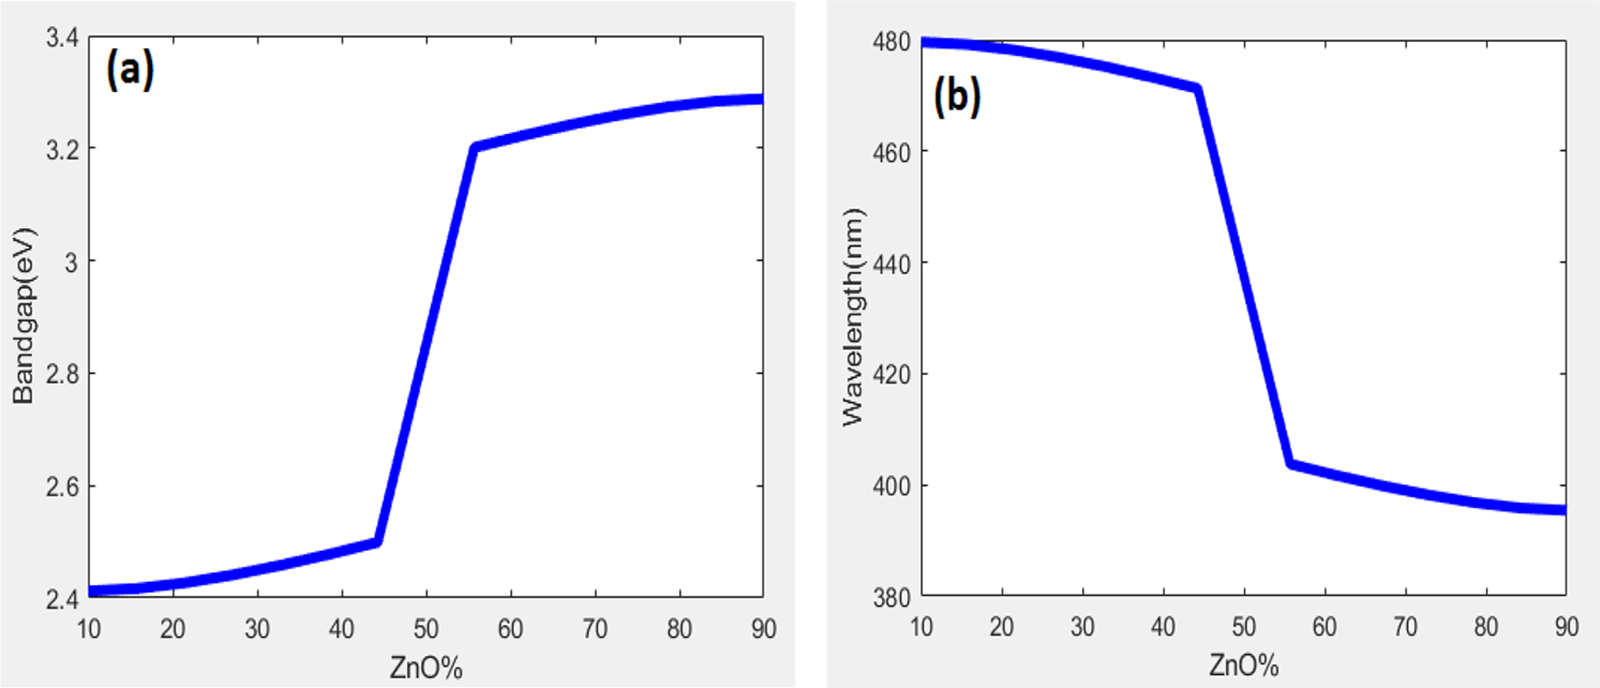
Figure 4: Two-dimensional plot for band gap vs. ZnO% (a) and wavelength vs. ZnO% (b)
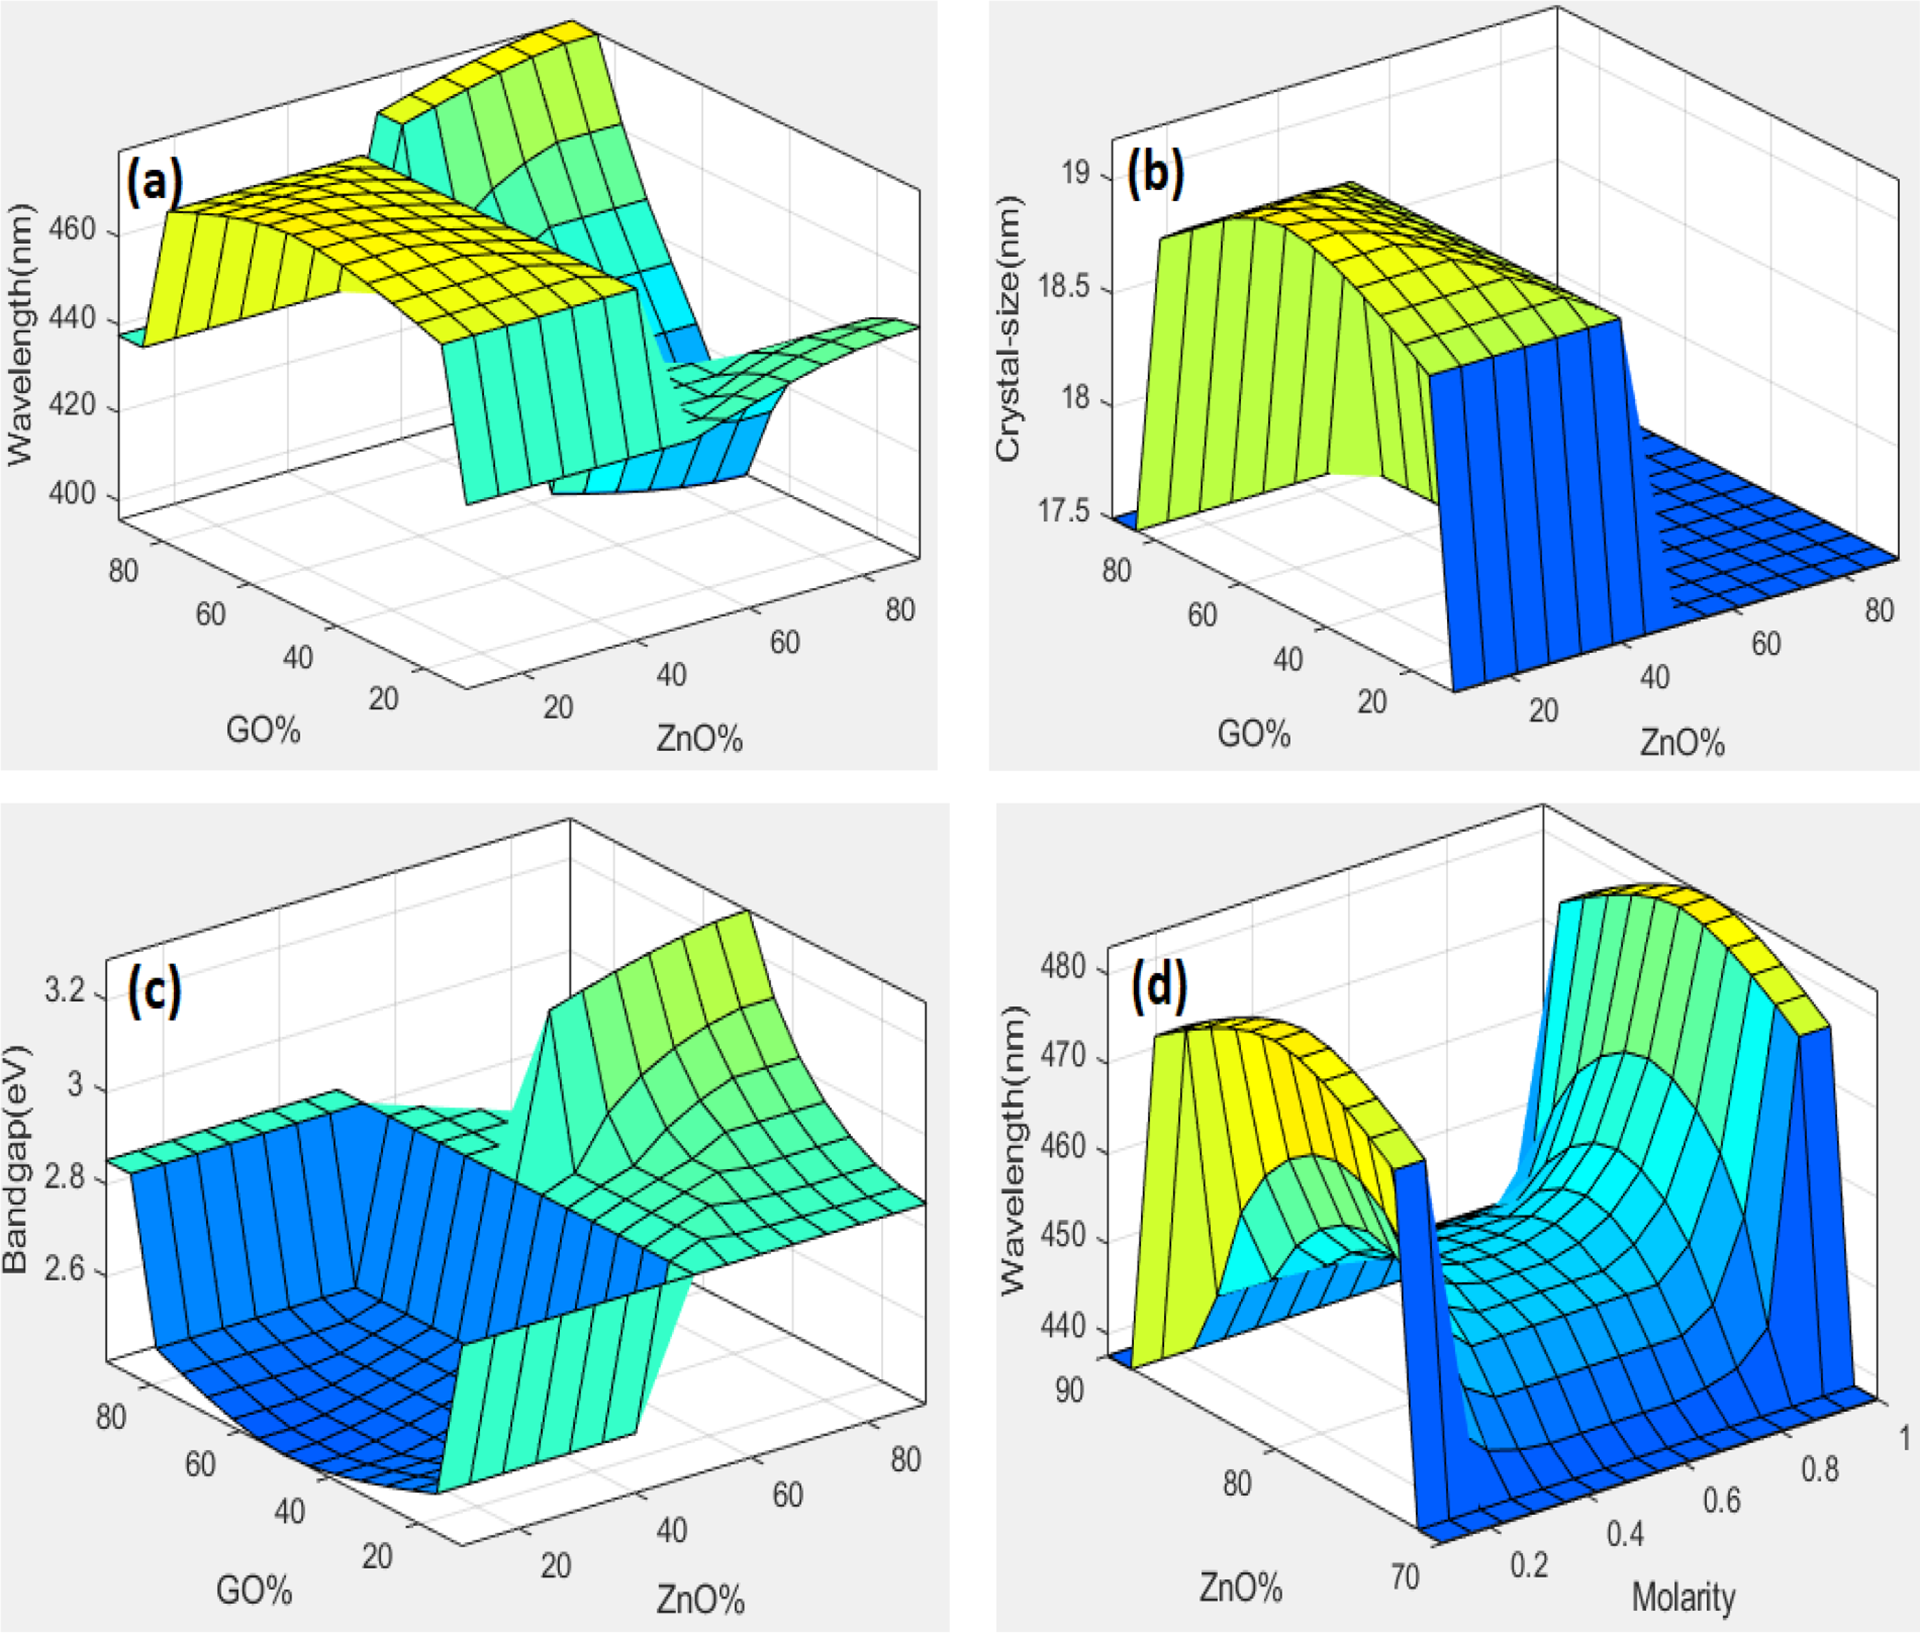
Figure 5: Three-dimensional fuzzy logic graph for input GO% and ZnO%, with wavelength as output (a), GO% and ZnO% as input with crystal size output (b), GO% and ZnO% as input and band gap as an output (c), molarity and ZnO% as input and wavelength as output (d)
The relationship between the synthesized ZnO% vs. band gap and ZnO% vs. wavelength at maximum intensity by PL was also examined using a two-dimensional fuzzy logic plot. To show the relation between ZnO% with bandgap and optical wavelength two-dimensional plots were shown. The zinc oxide optical behavior can be best understood by using these trends, which also support the experimental results to fabricate the materials for energy storage applications. This tool is also used to understand the synthesis parameters under the optimization conditions.
A fuzzy logic modeling tool was used to estimate the optical and structural behavior of ZnO-based material in this study. Surface plots in three dimensions were used to show the connection between the input and output parameters. Different graphs were plotted with wavelength, crystal size, and bandgap as output, and ZnO%, GO%, and molarity as input. The fuzzy logic simulations show that doping plays an important role in designing the nanocomposite for energy applications and show the nonlinear dependence of optical properties on material composition and synthesis conditions.
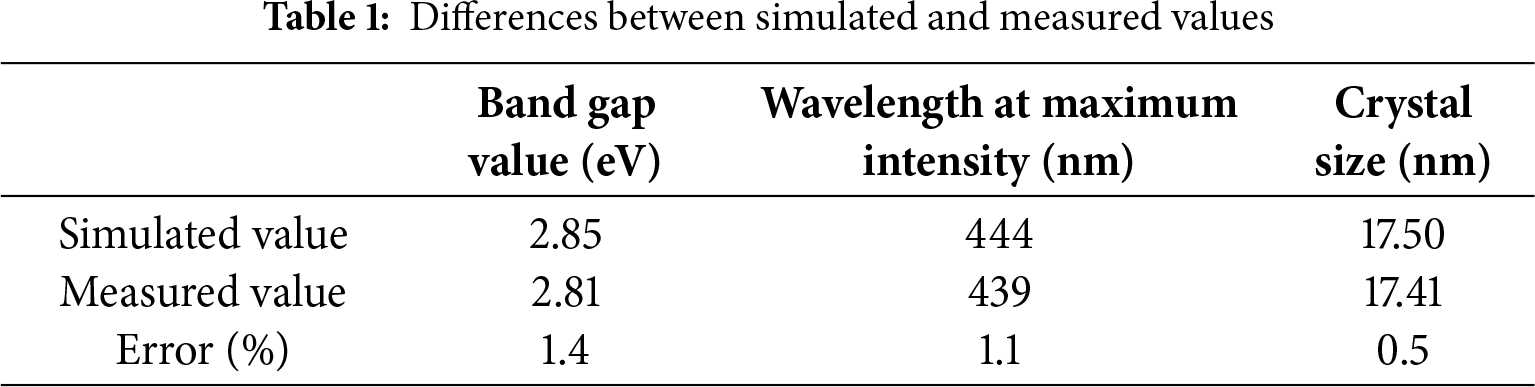
The Mamdani model was used to find the optical band gap, wavelength at maximum intensity, and crystal size using the rules viewer’s numerical values [28]. An important rule-based interface system is the Mamdani fuzzy model, which is commonly used for control and decision-making applications. Both inputs and outputs are represented by fuzzy sets in their fuzzy IF-THEN rules. To develop the output following steps are used such as fuzzification, rule evaluation, aggregation, and defuzzification. This paradigm is often used in fuzzy logic tools and is famous for its interpretability. The simulated and measured values were then divided. The measured and simulated values are shown in Table 1 for comparison. There is a very minor error, showing that the inputs and their response to the output correspond to the expected and logical outcomes.
3 Machine Learning Based Analysis
In this work, machine learning (ML) techniques were used to predict the basic optical, structural, and electrochemical characteristics of (ZnO/GO) nanocomposites for energy storage applications. By using the experimentally measured data such optical band gap energy (eV), crystal size (nm), photoluminescence (PL) wavelength at maximum intensity (nm), and other energy related parameters like specific capacitance (F/g), charge transfer resistance (Ω), energy density (Wh/kg), power density (W/kg), and popular models such as Artificial Neural Networks (ANN), Support Vector Regression (SVR), Multilayer Perceptron (MLP), and hybrid were trained and designed.
These techniques show an effective role in traditional machine learning (ML) models. We can use these models in this research as a reference for analysis to determine how well the hybrid fuzzy model is used. A strong agreement was found between the estimated and experimental values to analyze the model accuracy. The overall prediction accuracy of the hybrid model was excellent over the other models used in this research. To determine the precision of the used models, various parameters such as the Mean Absolute Error (MAE) and the R2 score were used. These parameters show a good agreement between the predicted and experimental results. The datasets were divided into a ratio of (80:20), trained, and predicted for 1000 experimental data points. Different data processing techniques, such as transformation, scaling, and cleaning, were used for model stability. The grid search method was applied to maximize the hyperparameters, like kernel type, hidden layers, learning rate, and regularization, to improve the accuracy of models [29]. By using the ML techniques, we were able to get the required nanocomposite for the energy applications with refined experimental results and materials behavior [30].
Fig. 6 shows the relative significance of various structural and synthetic parameters in observing the electrical properties of the nanocomposite. Some parameters over the others have a high impact on the charge storage behavior, such as chemical stability, molarity, and diffusion density. While some other parameters, such as ZnO% and crystalline size, also give good results, this shows that they are also important for the energy application. Interestingly, GO (%) and thermal stability appear to have some influence in this model, but formation temperature and capacity retention seem to have received little attention. These can be used to modify the experimental setup in order to maximize the energy storage material’s electrical performance. In order to focus on the energy applications, the relative importance of synthetic and structural factors was measured based on their contribution to expected electrical properties. Values were ordered and normalized to gauge the influence of each parameter. According to this analysis, the most important factors influencing electrical characteristics are molarity, diffusion density, and chemical stability.
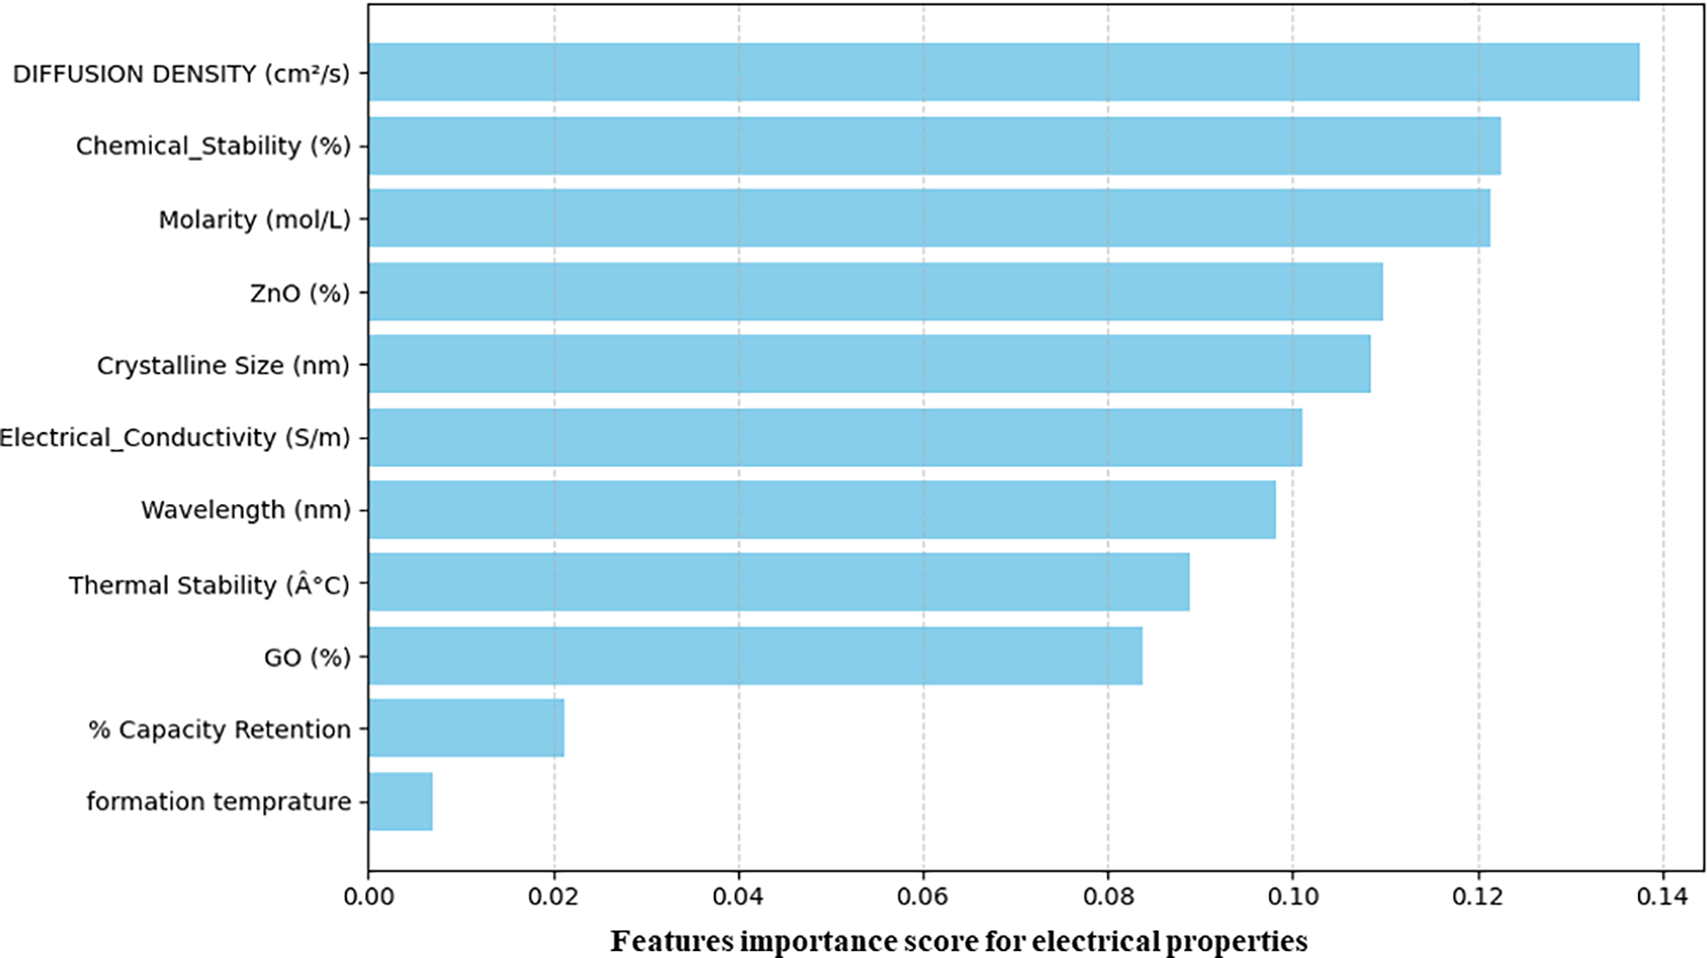
Figure 6: Feature importance analysis for predicting electrical properties of ZnO/GO nanocomposites
The band gap gradually drops as the GO content rises, suggesting improved electrical conductivity, which is a desirable property for energy storage systems. Fig. 7 shows how the band gap of ZnO/GO nanocomposites changes as the GO% rises. The band gap drops from around 3.4 to about 2.2 eV when the GO concentration increases from 0% to 30%. With the inclusion of GO, the band gap is reduced because of improved defect states and charge transfer. The suitability for smart nanocomposite materials for energy storage is enhanced by its tunability. The trend supports the accuracy of the ML-based simulation technique by being in good agreement with predictions from fuzzy logic and machine learning models.
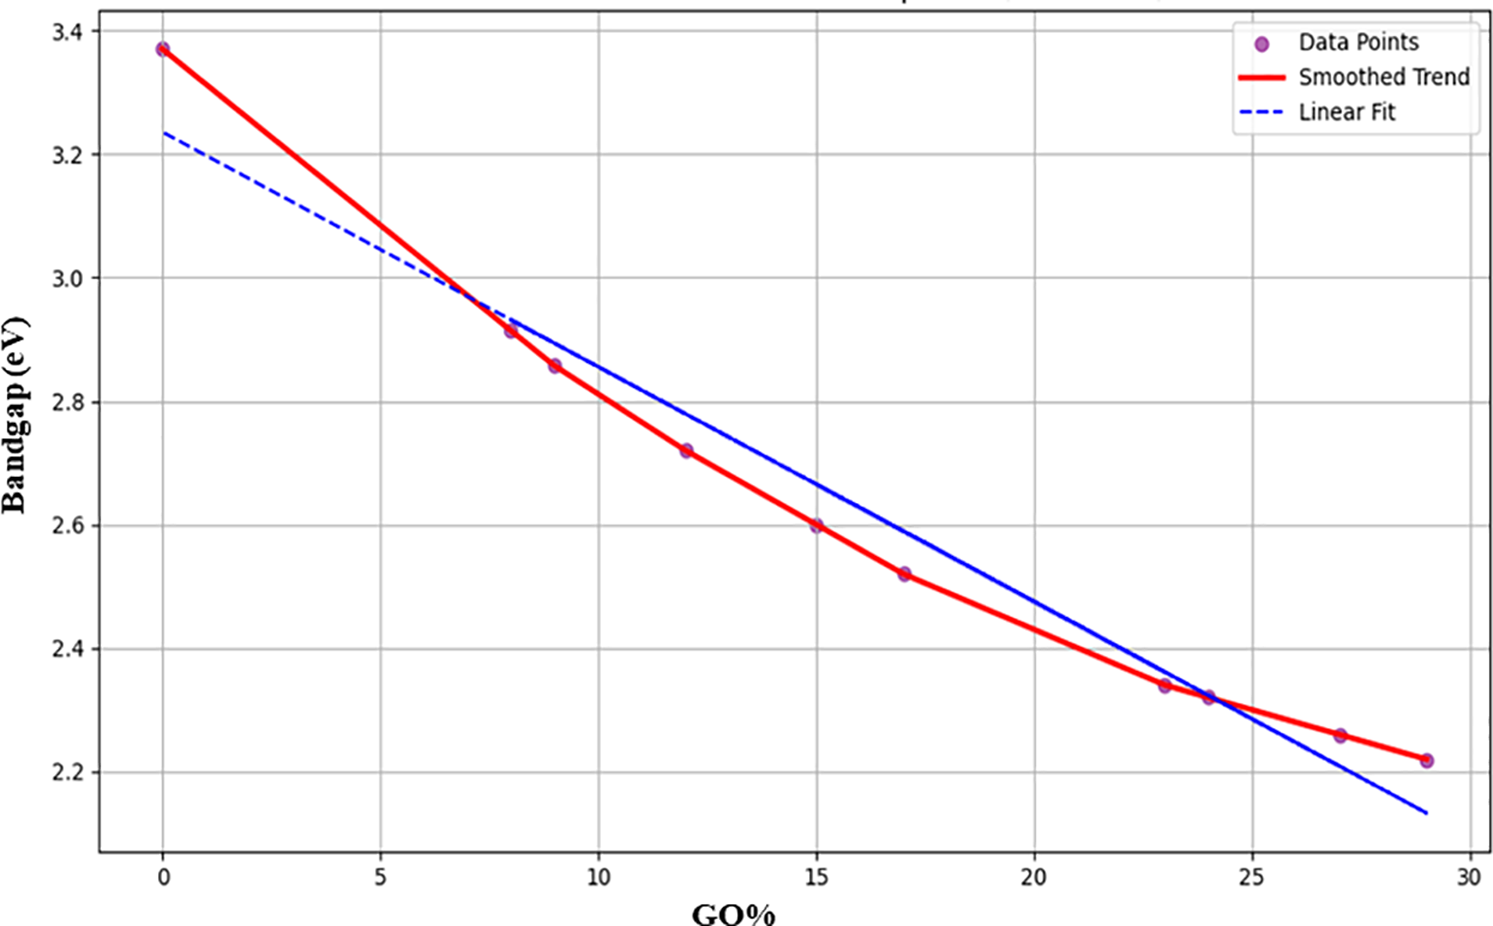
Figure 7: Effect of GO% on band gap for ZnO/GO nanocomposites
The effect of GO% on the ZnO/GO nanocomposites charge transfer resistance (Ω) is shown in Fig. 8 below. Because of GO’s high surface area and conductivity, the resistance decreases dramatically from about 26 to about 5.5 Ω as GO increases. But after 10%–12%, the resistance rises once more, hitting about 14 Ω at 29% GO. This increasing trend is probably the result of too much GO obstructing electron transport pathways and causing agglomeration [31]. The non-linear effect of GO content on electrochemical performance in smart nanocomposite materials for energy storage is accurately captured by the ML and F.L. models, as evidenced by this behaviour.
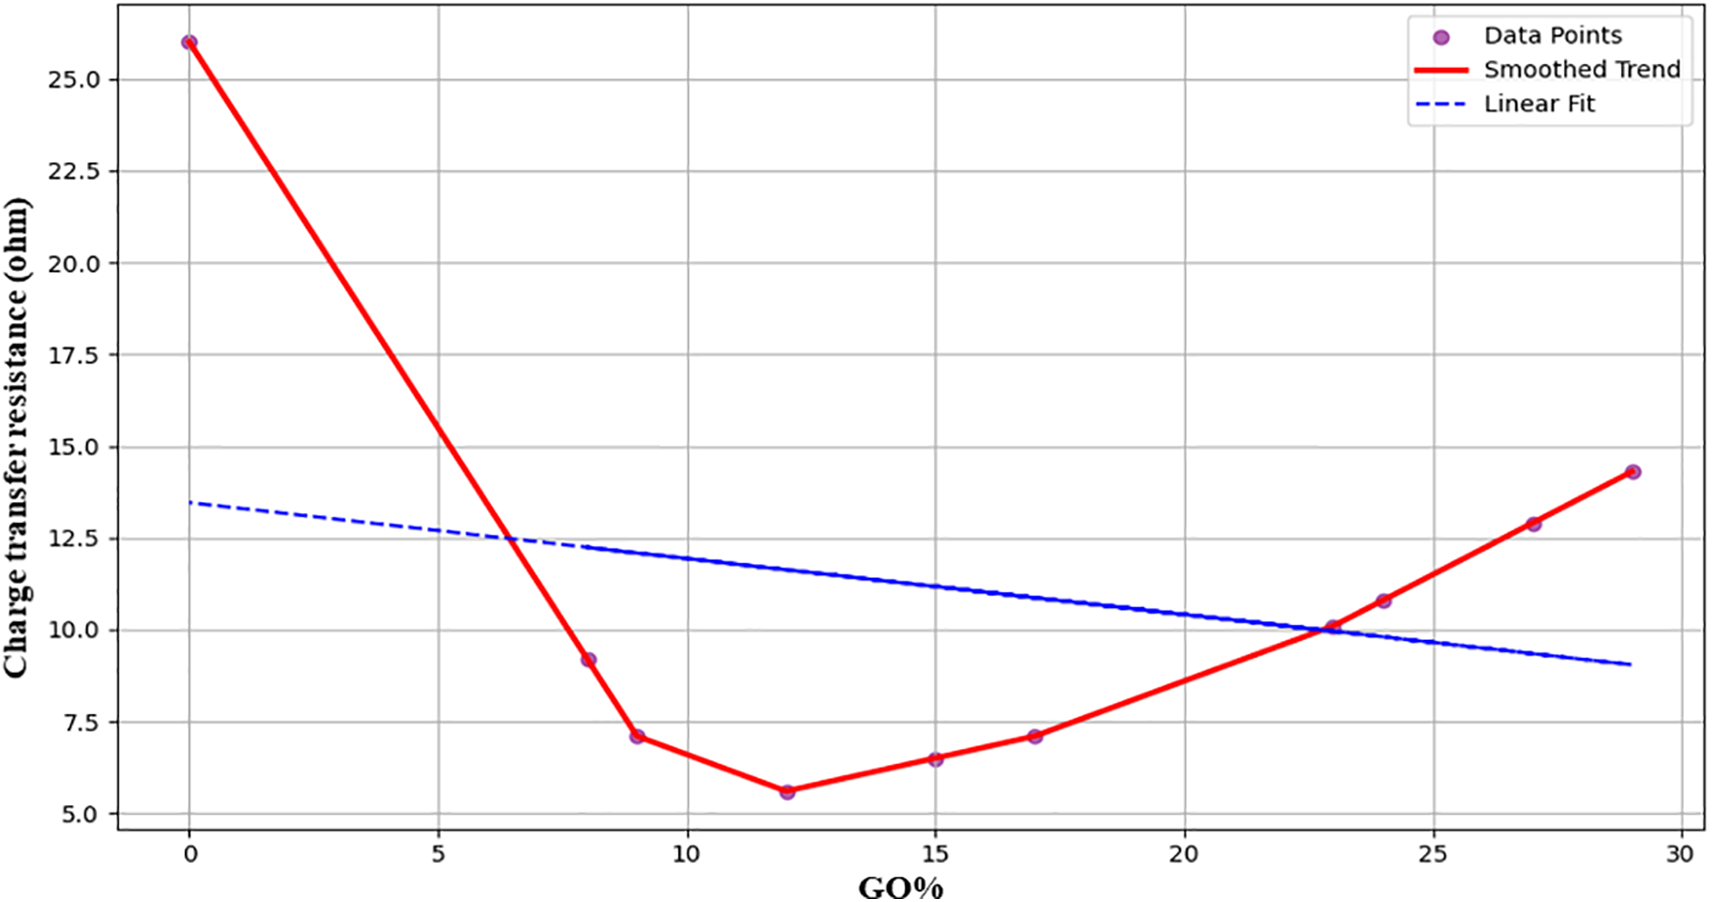
Figure 8: Effect of GO% on charge transfer resistance
The impact of thermal stability on the band gap energy of ZnO/GO nanocomposites is depicted in Fig. 9. The band gap decreases from roughly 3.4 to 2.2 eV as the thermal stability rises from about 300 to about 440°C. Improved thermal stability and a decreased band gap imply that increased heat treatment improves crystallinity, lowers defects, and facilitates better ZnO-GO interaction. Better electrical and optical behaviour results from these effects [32]. The observed trend validates the predictive accuracy of fuzzy logic and machine learning models for creating smart nanocomposite materials for energy storage with optimal thermal and electrical properties. As a straightforward baseline, linear regression in Fig. 9 was employed to readily compare the experimental and anticipated values. This is supported by the direct relationship between bandgap and thermal stability [33], as well as the fact that the data points are dispersed along a linear trend, which means that linear fitting is adequate without adding complication from exponential functions.
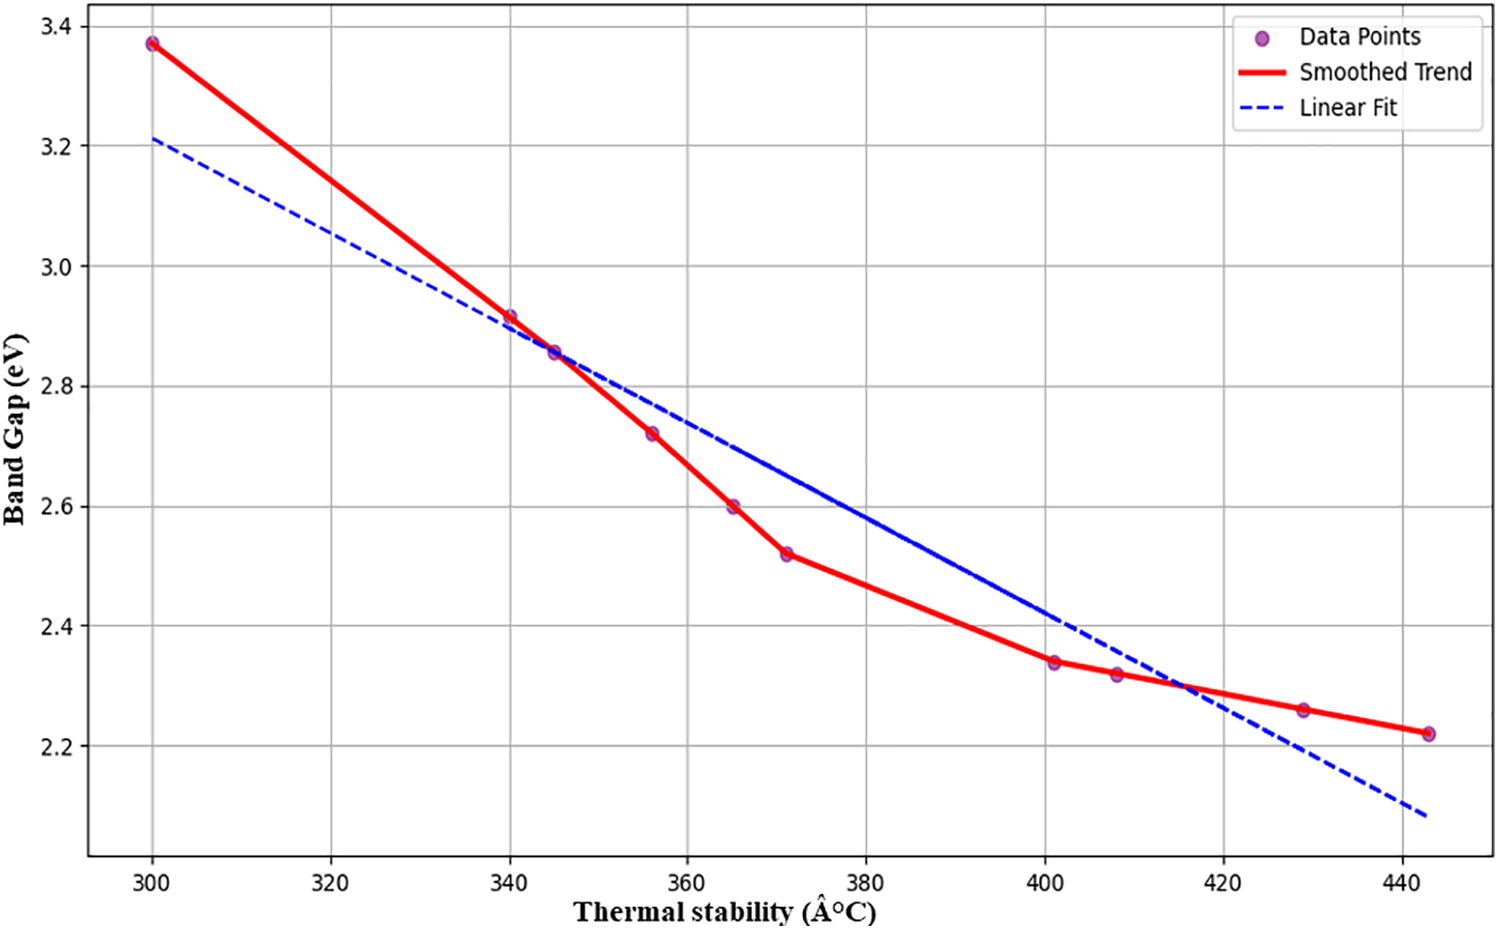
Figure 9: Thermal stability vs. band gap for ZnO/GO nanocomposites
A comparison of the predicted and observed band gap values (in eV) for ZnO/GO nanocomposites using various machine learning (ML) models, ANN (Fig. 10a), MLP (Fig. 10b), SVR (Fig. 10c), and a hybrid model (Fig. 10d), is depicted in the bar graphs. These algorithms were trained using input information from synthesized nanomaterials to predict band gap values. The precision and resilience of ML-based simulations in forecasting material properties are demonstrated by the strong agreement between the experimental and anticipated. When combining different methods, the hybrid model in particular exhibits the least variation, indicating a better optimized prediction framework. By decreasing reliance on experiments, speeding up material screening, and increasing forecast accuracy, this ML integration improves the characterization process. Accurate band gap prediction is essential for maximizing electronic properties [34] in energy storage applications, and these findings support ZnO/GO nanocomposites’ potential as tunable materials. Therefore, using machine learning to supplement experimental synthesis and characterizations in the creation of new energy materials is the main focus of our paper.
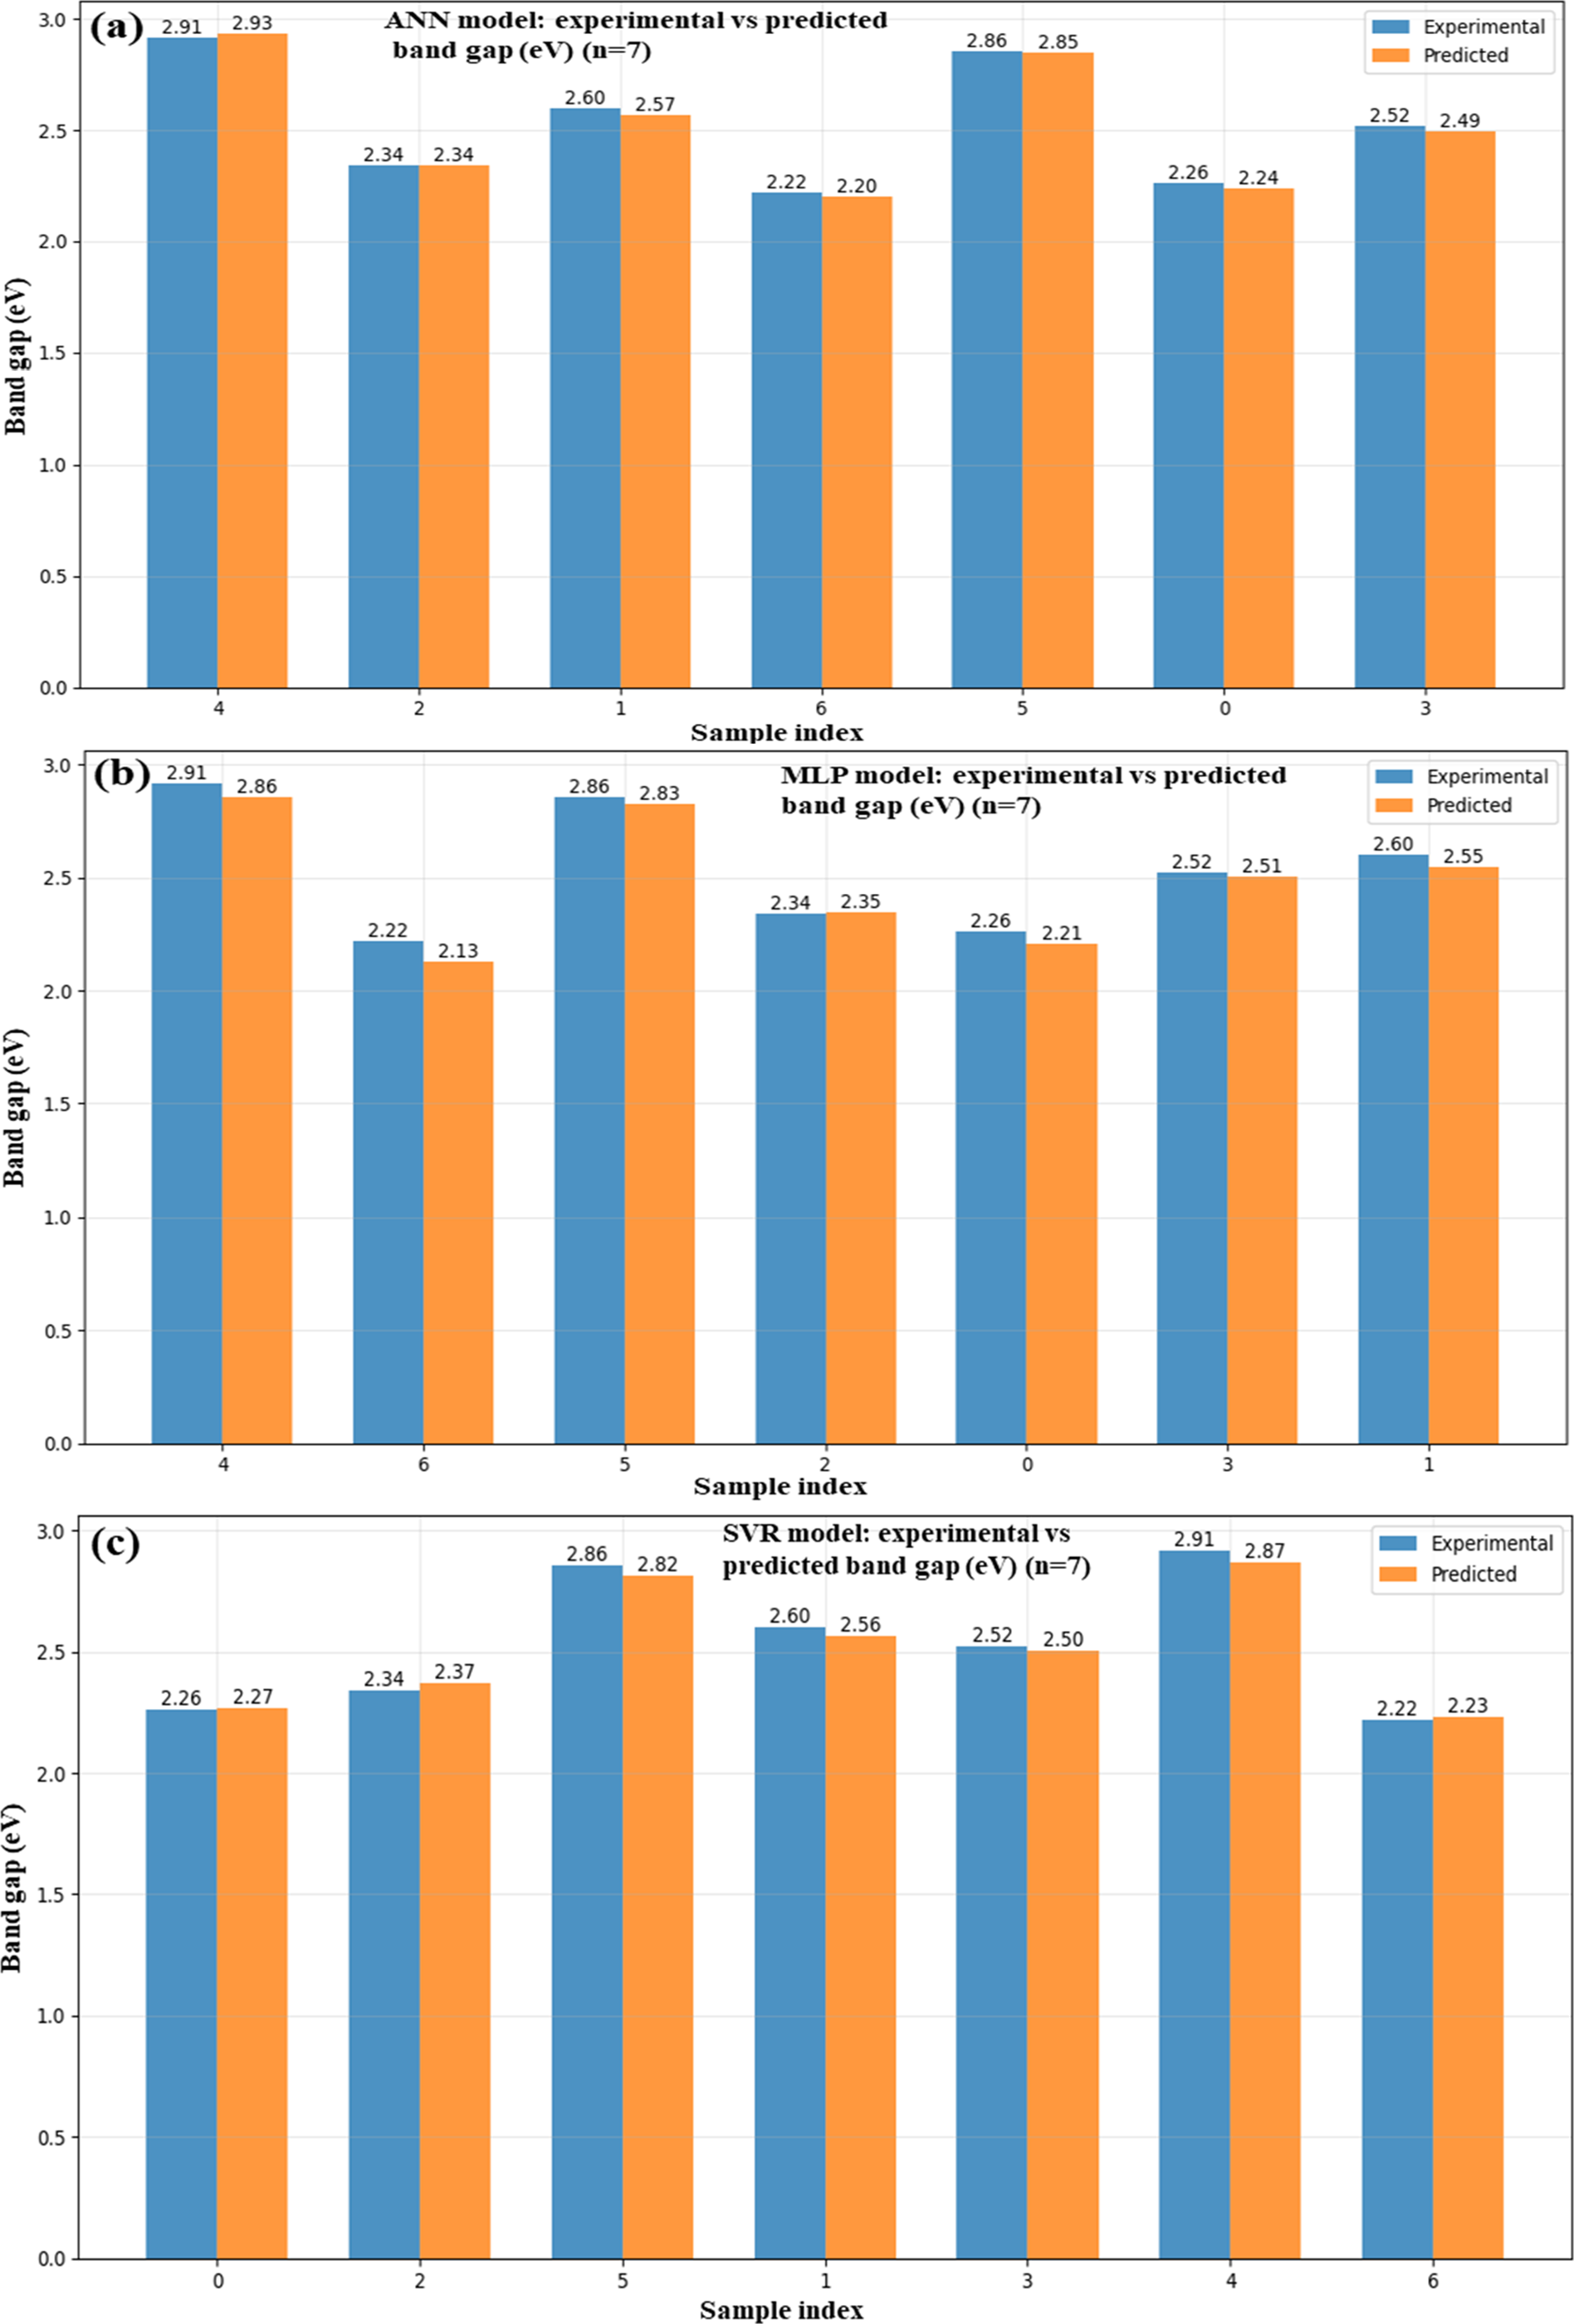
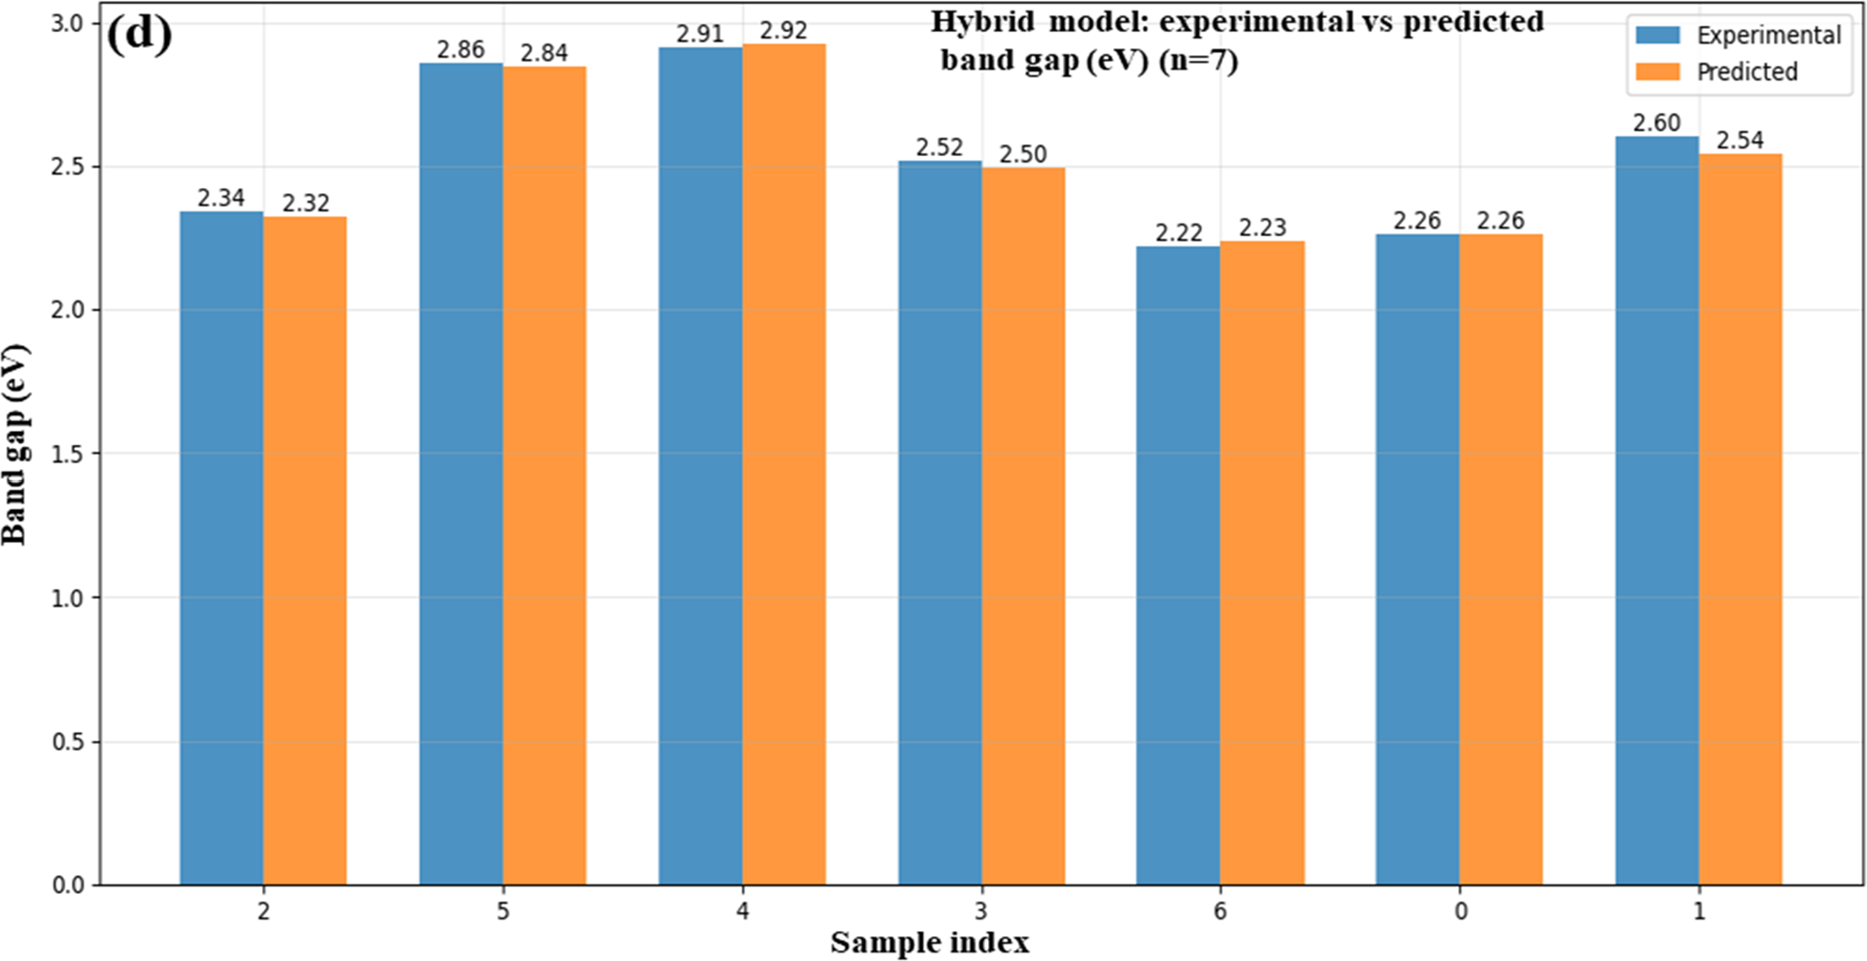
Figure 10: ML-based vs. experimental band gap for ANN (a), MLP (b), SVR (c), and a hybrid (d) of the ZnO/GO nanocomposites
Four models, as shown below, were used: ANN (Fig. 11a), MLP (Fig. 11b), SVR (Fig. 11c), and a hybrid model (Fig. 11d) to determine the predicted and experimental charge transfer resistance values for ZnO/GO nanocomposites. Electrochemical data were used to train the models to find the accuracy for the internal resistance, which is an important parameter for energy storage. The competency of each model is demonstrated by the close alignment of the projected values with the experimental data across all graphs, especially in the lower resistance region (~6.5–10). The potential of the hybrid model (Fig. 11d) as a dependable instrument for simulating electrochemical behaviour is highlighted by its exceptional prediction consistency and low divergence from experimental values. At peak resistance points (e.g., ~14 Ω). By enabling quick and precise calculation of charge transfer resistance, this effective ML integration aids in the optimization of electrode materials for high-performance supercapacitors.
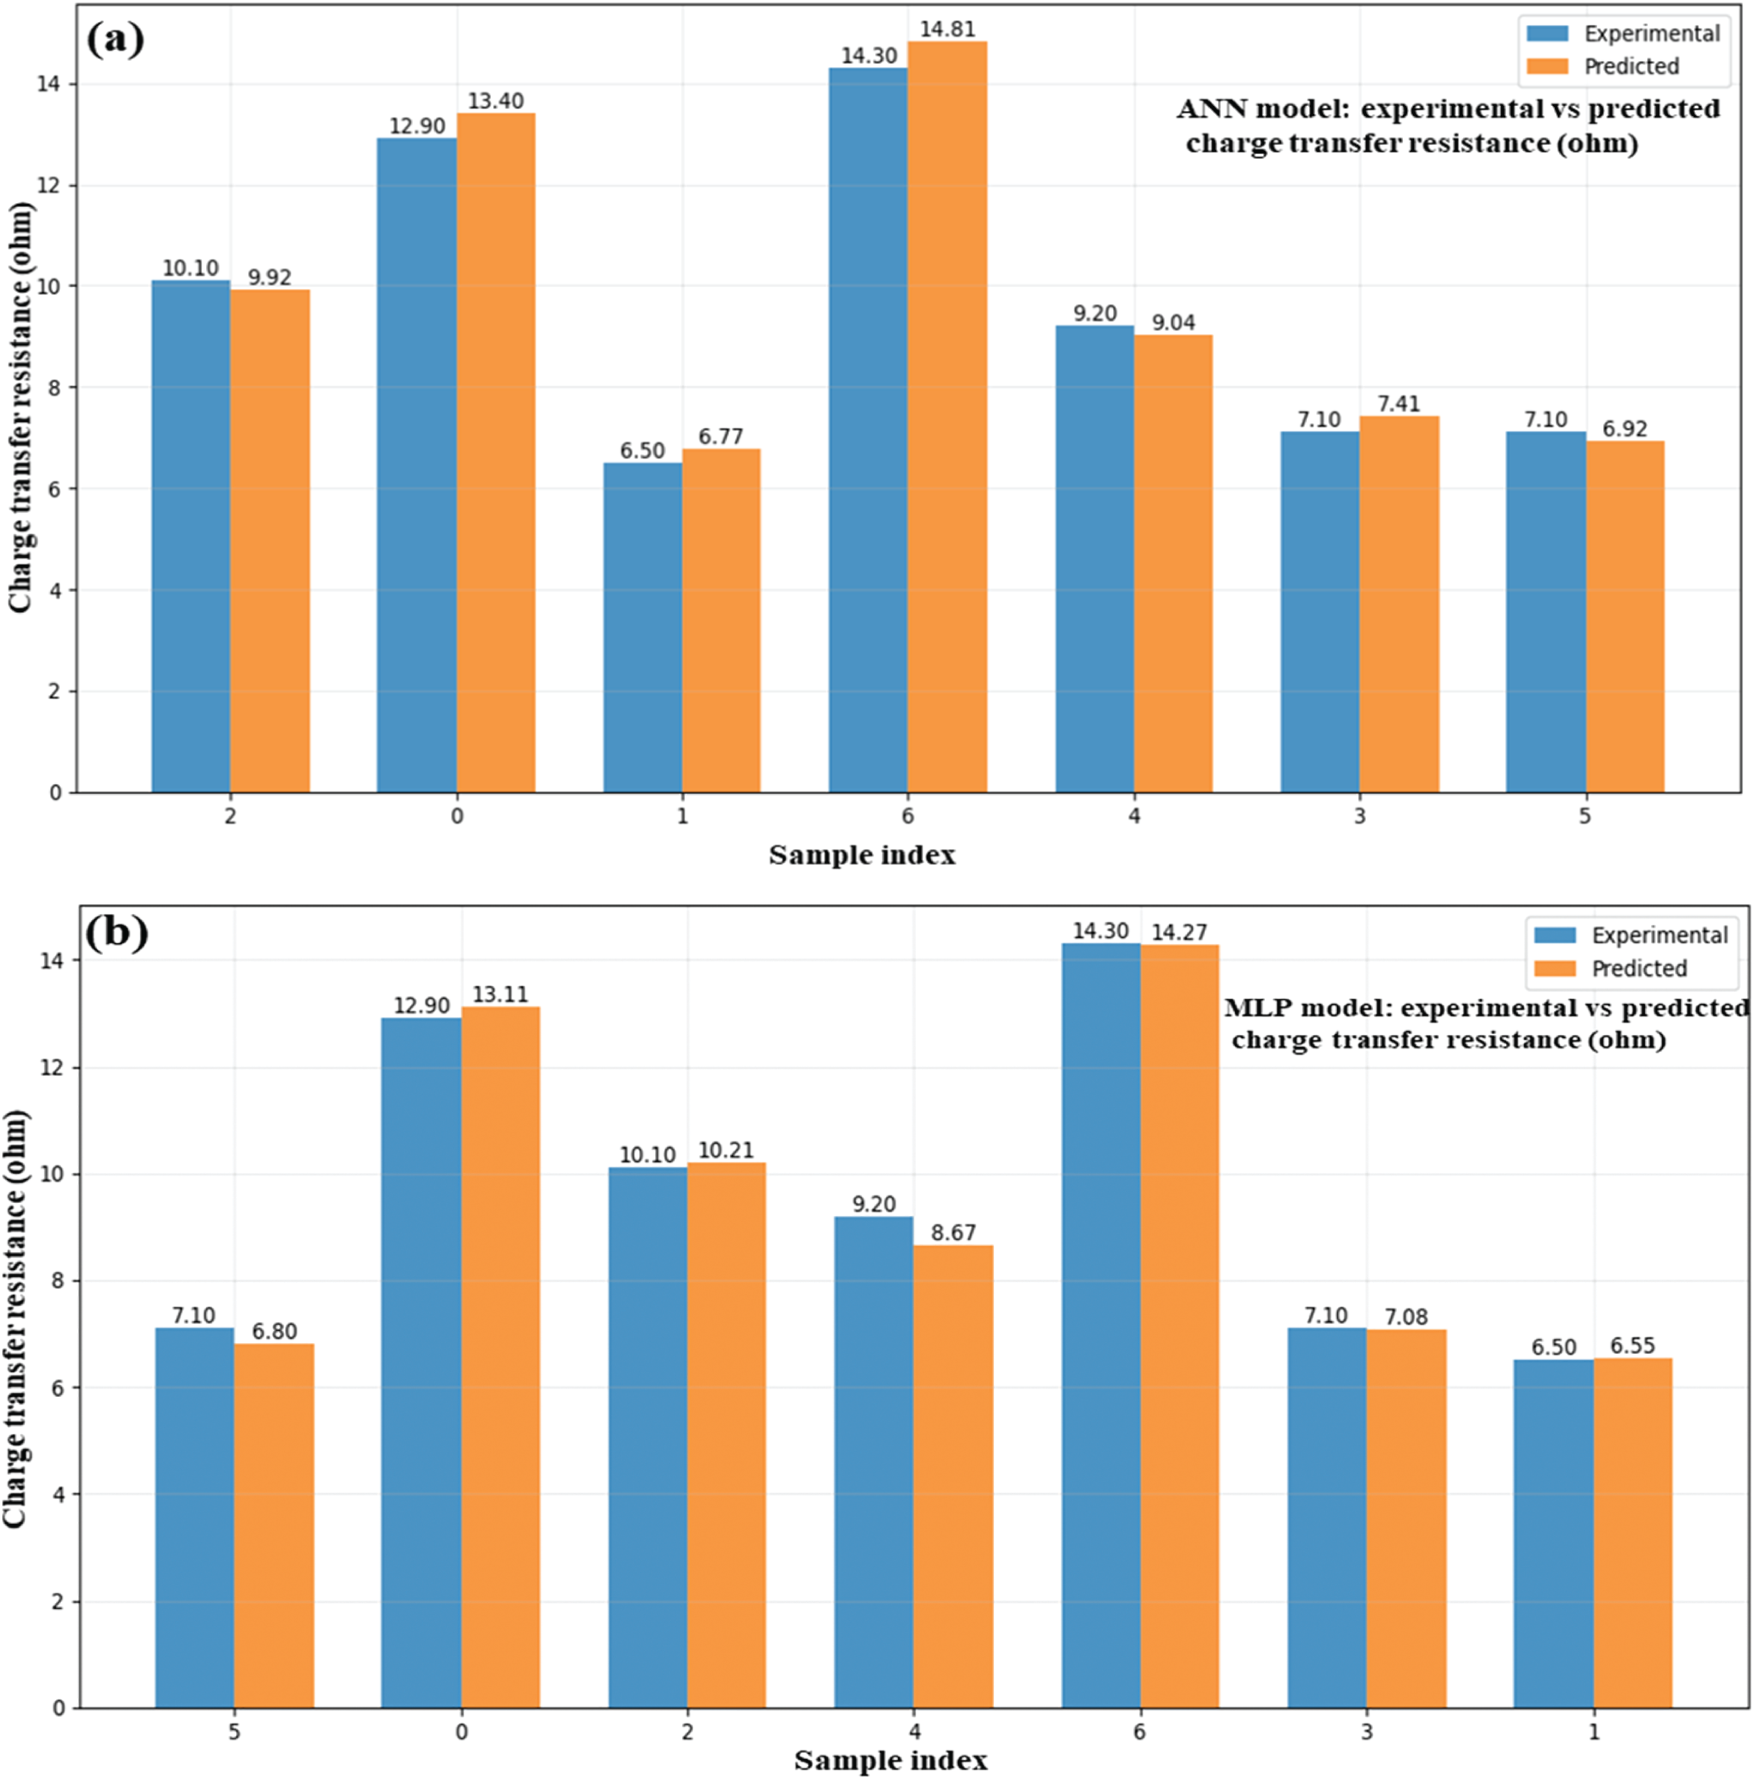
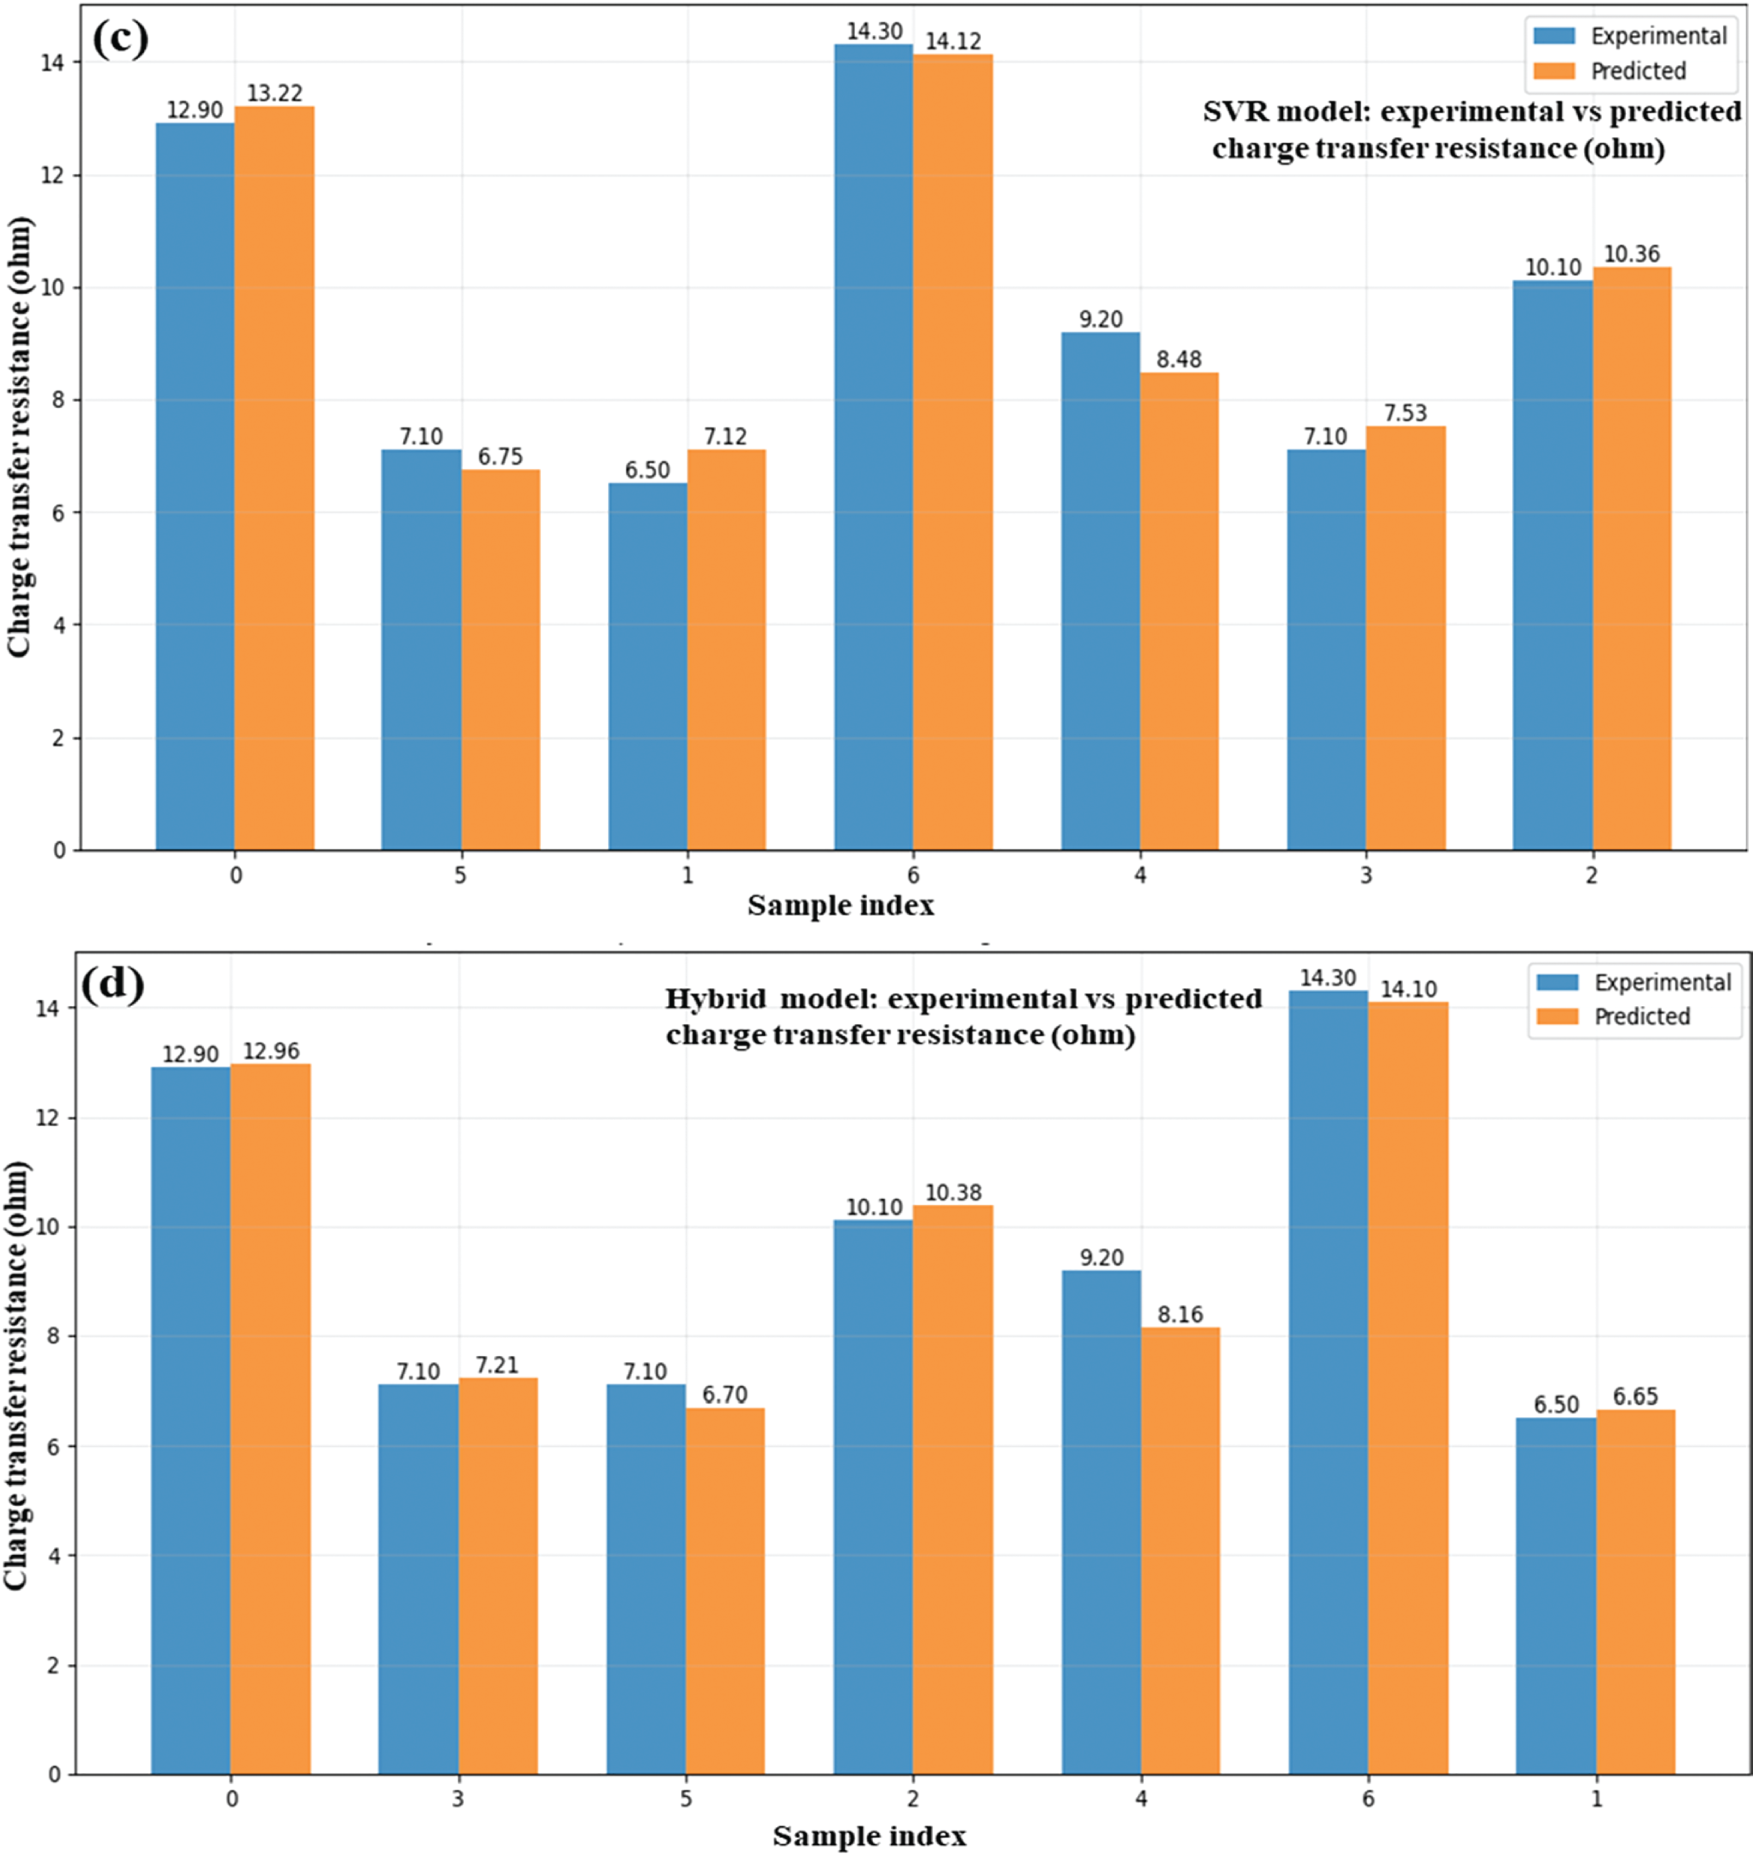
Figure 11: Experimental and ML-based charge transfer resistance ANN (a), MLP (b), SVR (c), and hybrid (d) in ZnO/GO nanocomposites
An ANN, MLP, SVR, and a hybrid model are among the machine learning models that demonstrate how well they predict important characteristics of ZnO/GO nanocomposites for energy storage applications, as shown in Fig. 12. The projected vs. experimental band gap values are displayed in Fig. 12a. At greater band gaps, the hybrid model most closely resembles the observed trend, whereas at lower levels, ANN and SVR exhibit minor variations. The predictions for charge storage capacity are compared in Fig. 12b. All models reasonably match the experimental values. Still, the hybrid model exhibits the best overall alignment, especially at high capacities exceeding 700 F/g. The charge transfer resistance is shown in Fig. 12c, where all models closely match experimental data, particularly for values higher than 10 Ω, with ANN and hybrid once more showing the highest accuracy. A comparison of experimental and predicted values for energy density (Wh/kg) is shown in Fig. 12d. The efficiency was obtained by using these four models, like ANN, MLP, SVR, and hybrid. The overall performance of the hybrid model for all parameters related to energy storage and to design the ML-driven smart energy nanomaterials was found to be best over the other models. The X-axis shows the sample indices arranged by experimental energy density, while the Y-axis represents the relevant energy density value. The accuracy of models to describe the material behavior gave very close agreement between the experimental and predicted values, especially for the hybrid model [35].
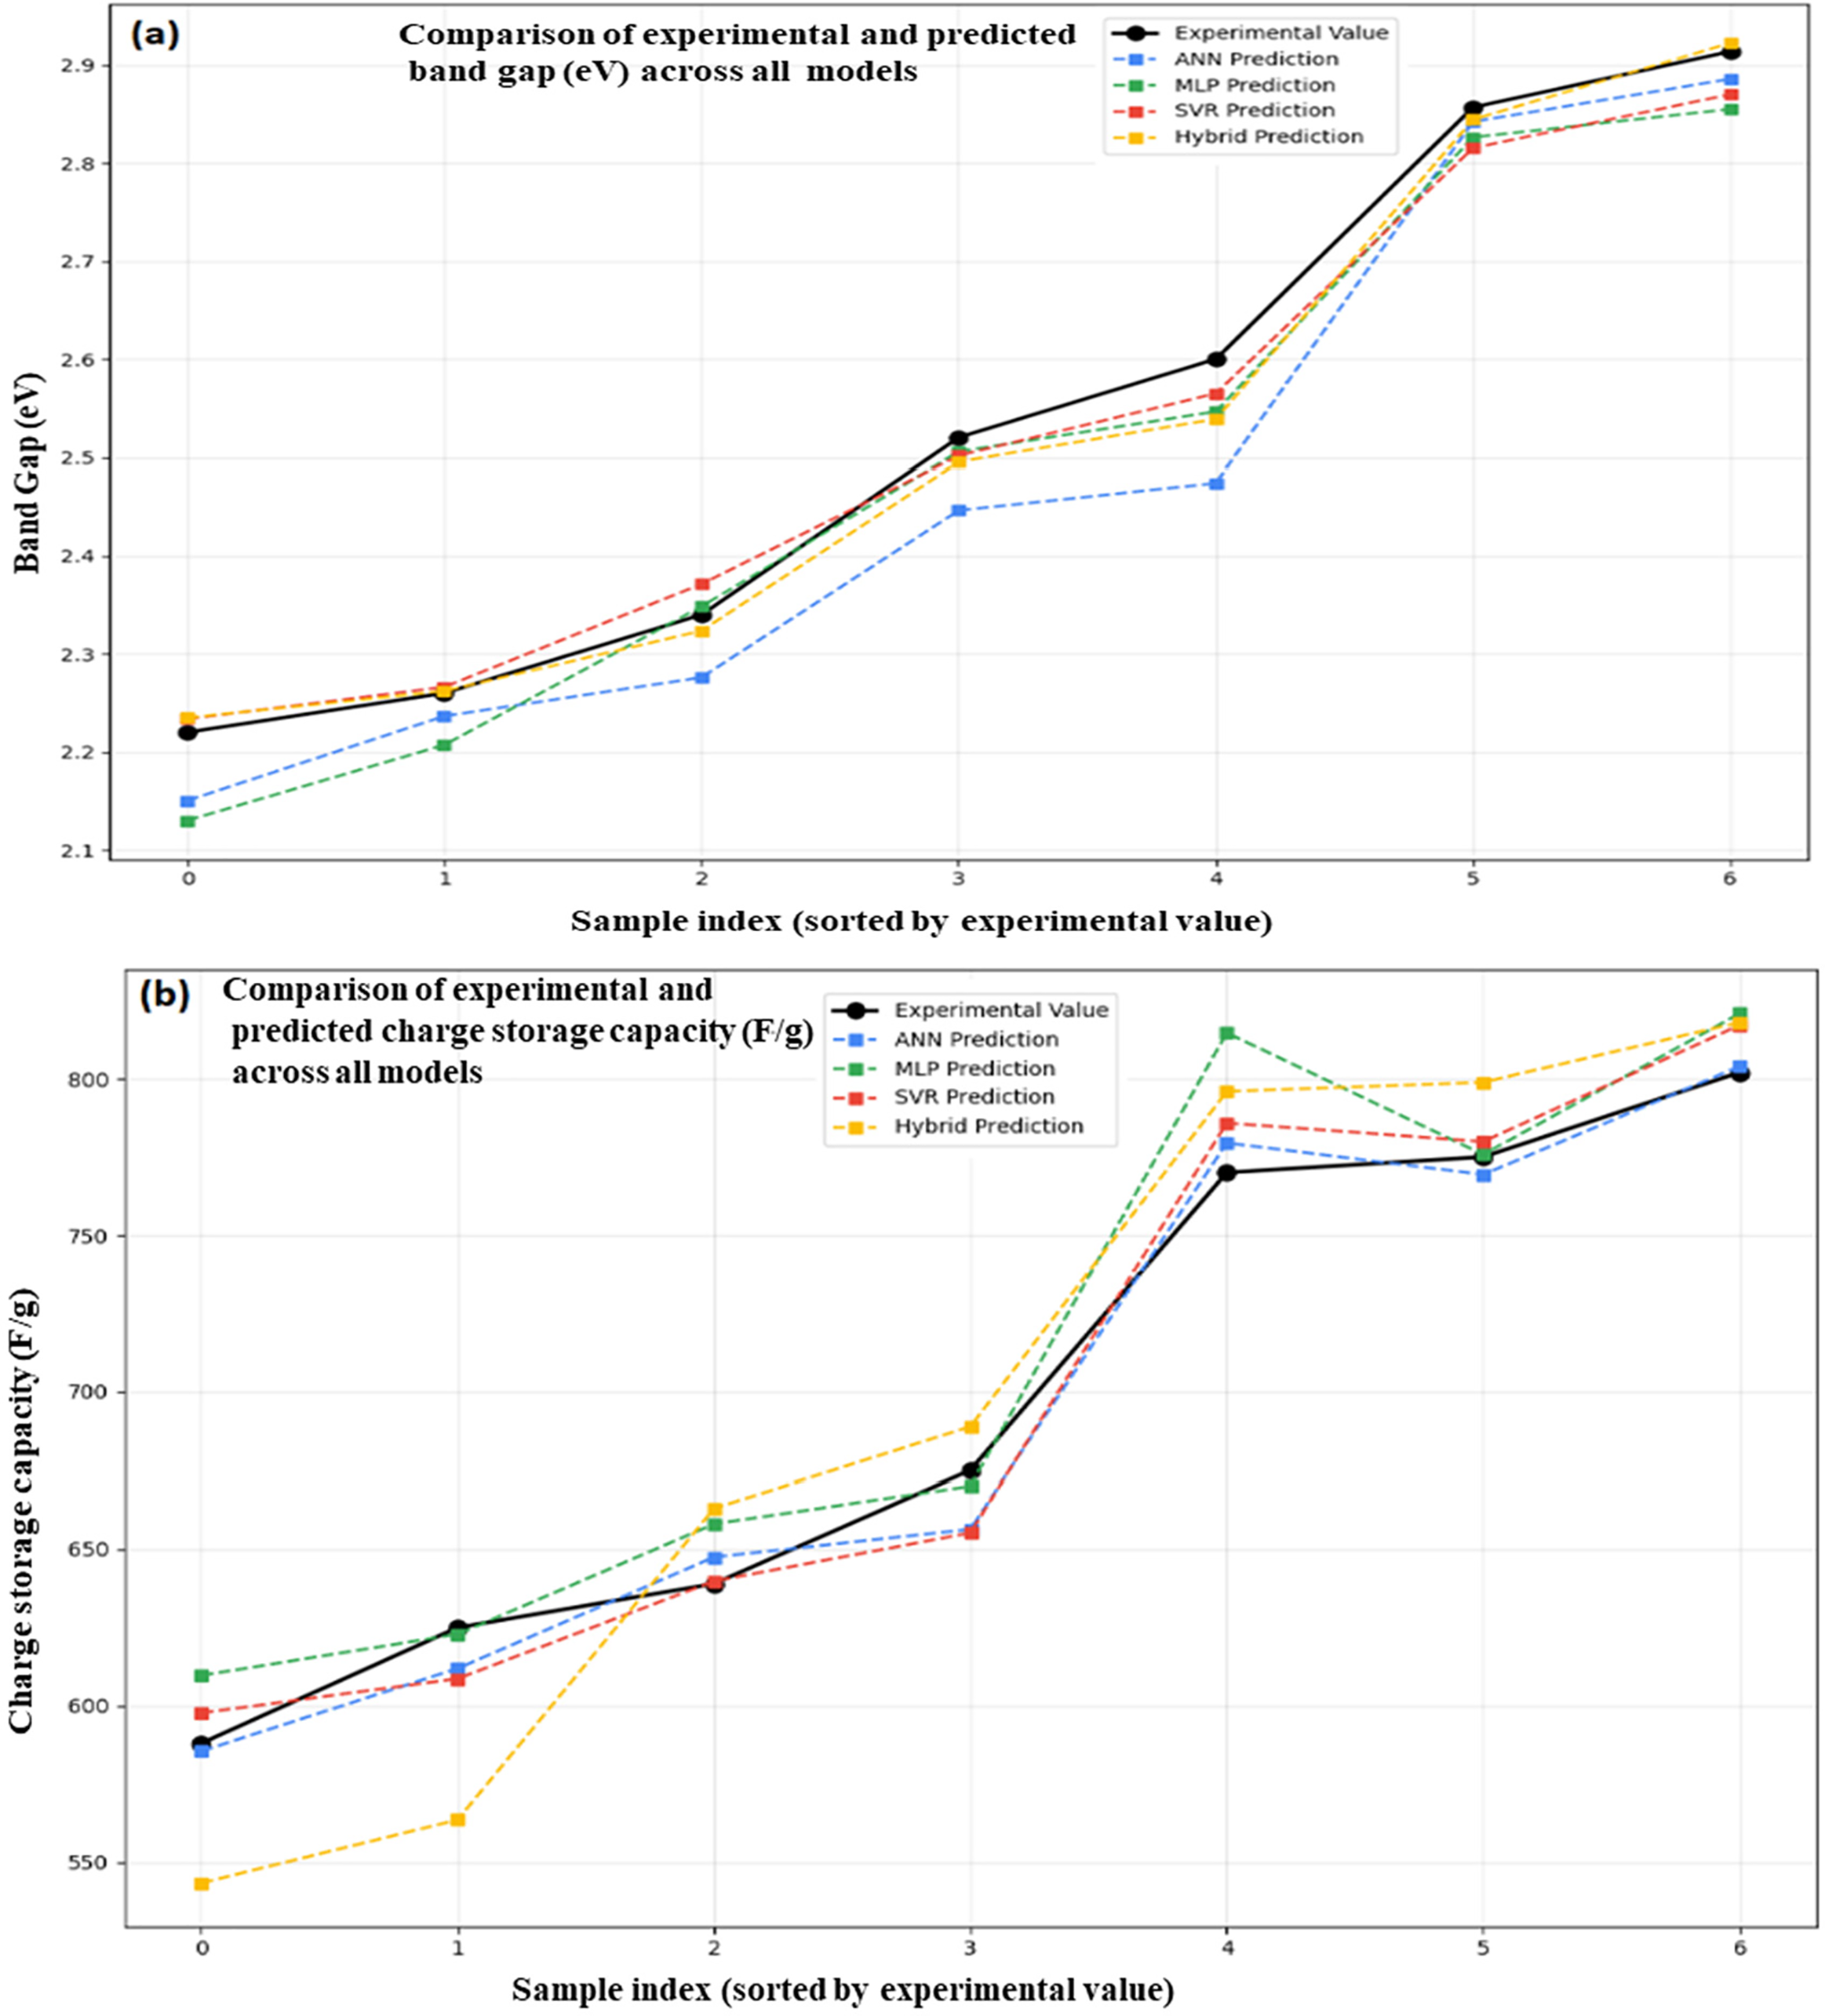
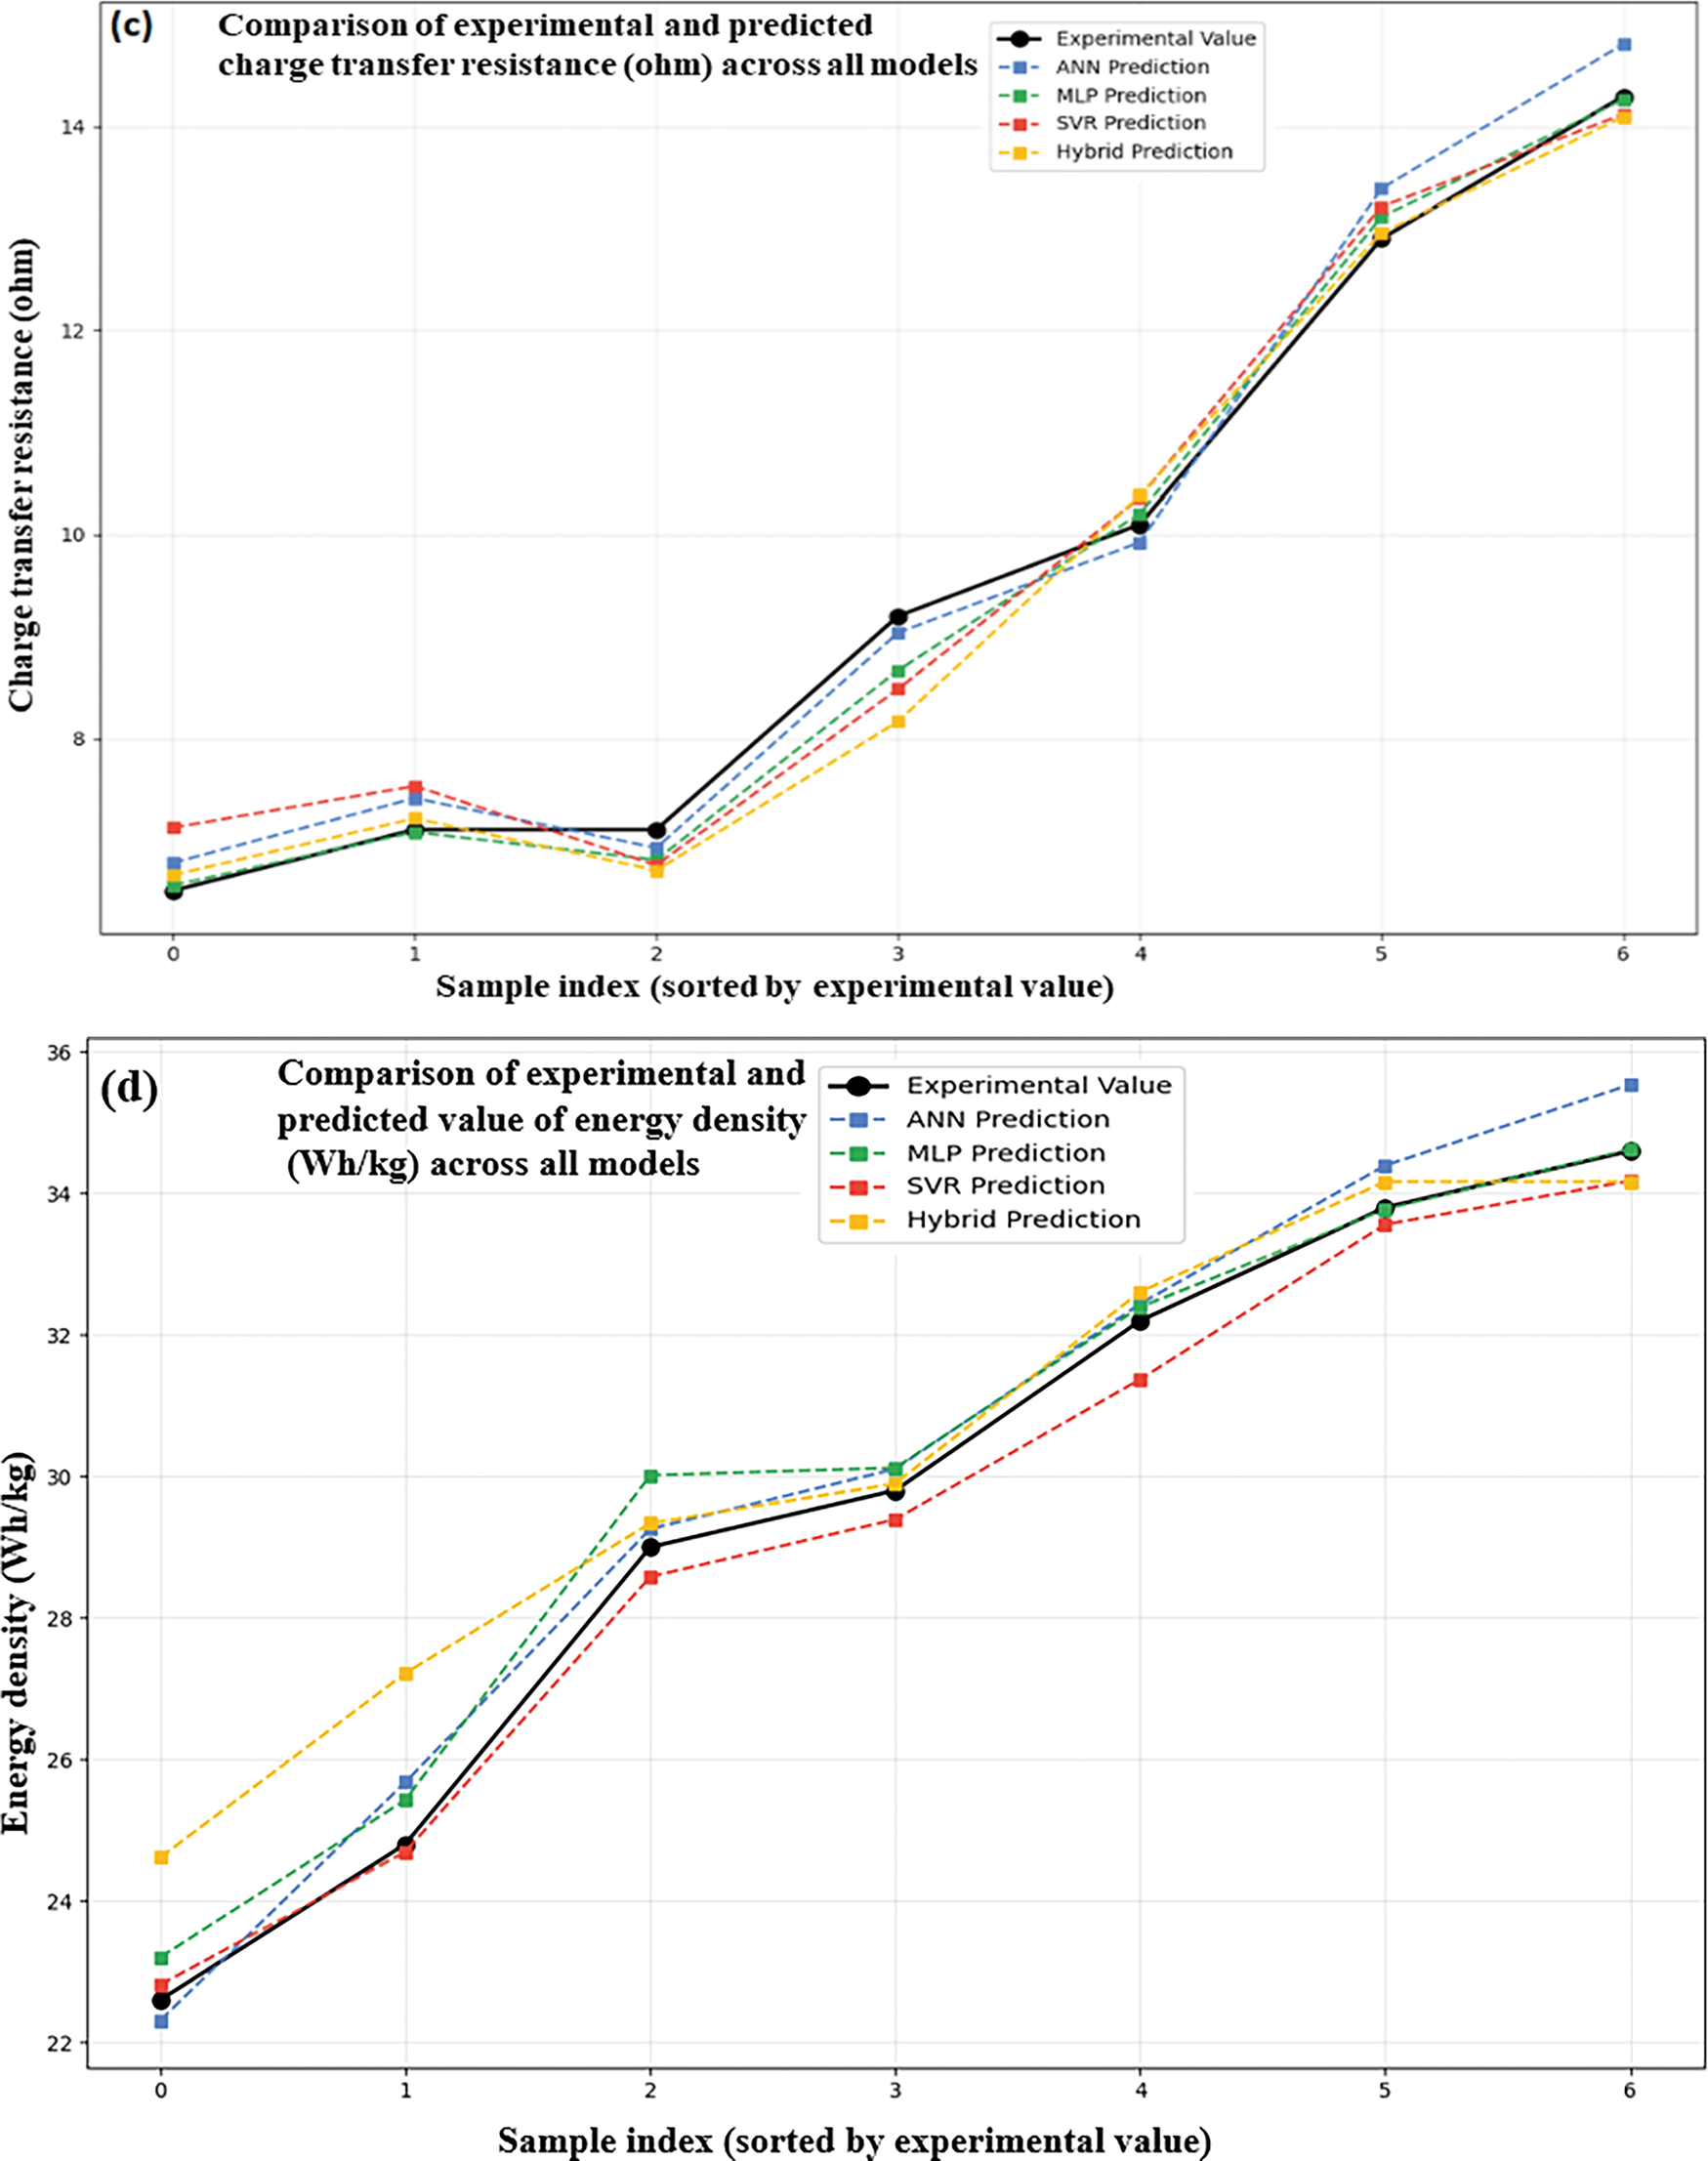
Figure 12: Experimental vs. ML-based band gap (a), energy storage capacity (b), charge transfer resistance (c), and energy density (d) ZnO/GO
This supports the use of machine learning in smart nanocomposite materials for energy storage research for predictive modeling and optimization.
Although their trends vs. GO content differed because of variations in learning processes, their distinct learning mechanisms and nonlinear mapping capabilities, all four models (ANN, MLP, SVR, and hybrid) accurately predicted the properties of ZnO/GO nanocomposite materials. Although each model has its uses, the hybrid model demonstrated greater generalization and reliability, which makes it better suited for forecasting the properties of smart energy materials.
To forecast the ZnO/GO nanocomposite’s physicochemical and electrochemical characteristics, an Artificial Neural Network (ANN) model was designed as shown in Fig. 13. Eleven neurons in the input layer represent important factors such as molarity, wavelength, crystalline size, formation temperature, ZnO%, and GO%. In order to capture nonlinear relationships, the model incorporates four hidden layers (Dense1, Residual Block1, Residual Block2, and Dense2) with 64–32 neurons driven by Switch, ReLU, and GELU functions. The values of energy density, power density, band gap, and charge transfer resistance were predicted by the output layer, which contains the five neurons. To train the model, the backpropagation with mean squared error (MSE) loss and Adam optimizer were used. The input synthesis and the material performance output by enhancing the prediction accuracy and convergence of a multilayer structure were successfully connected.
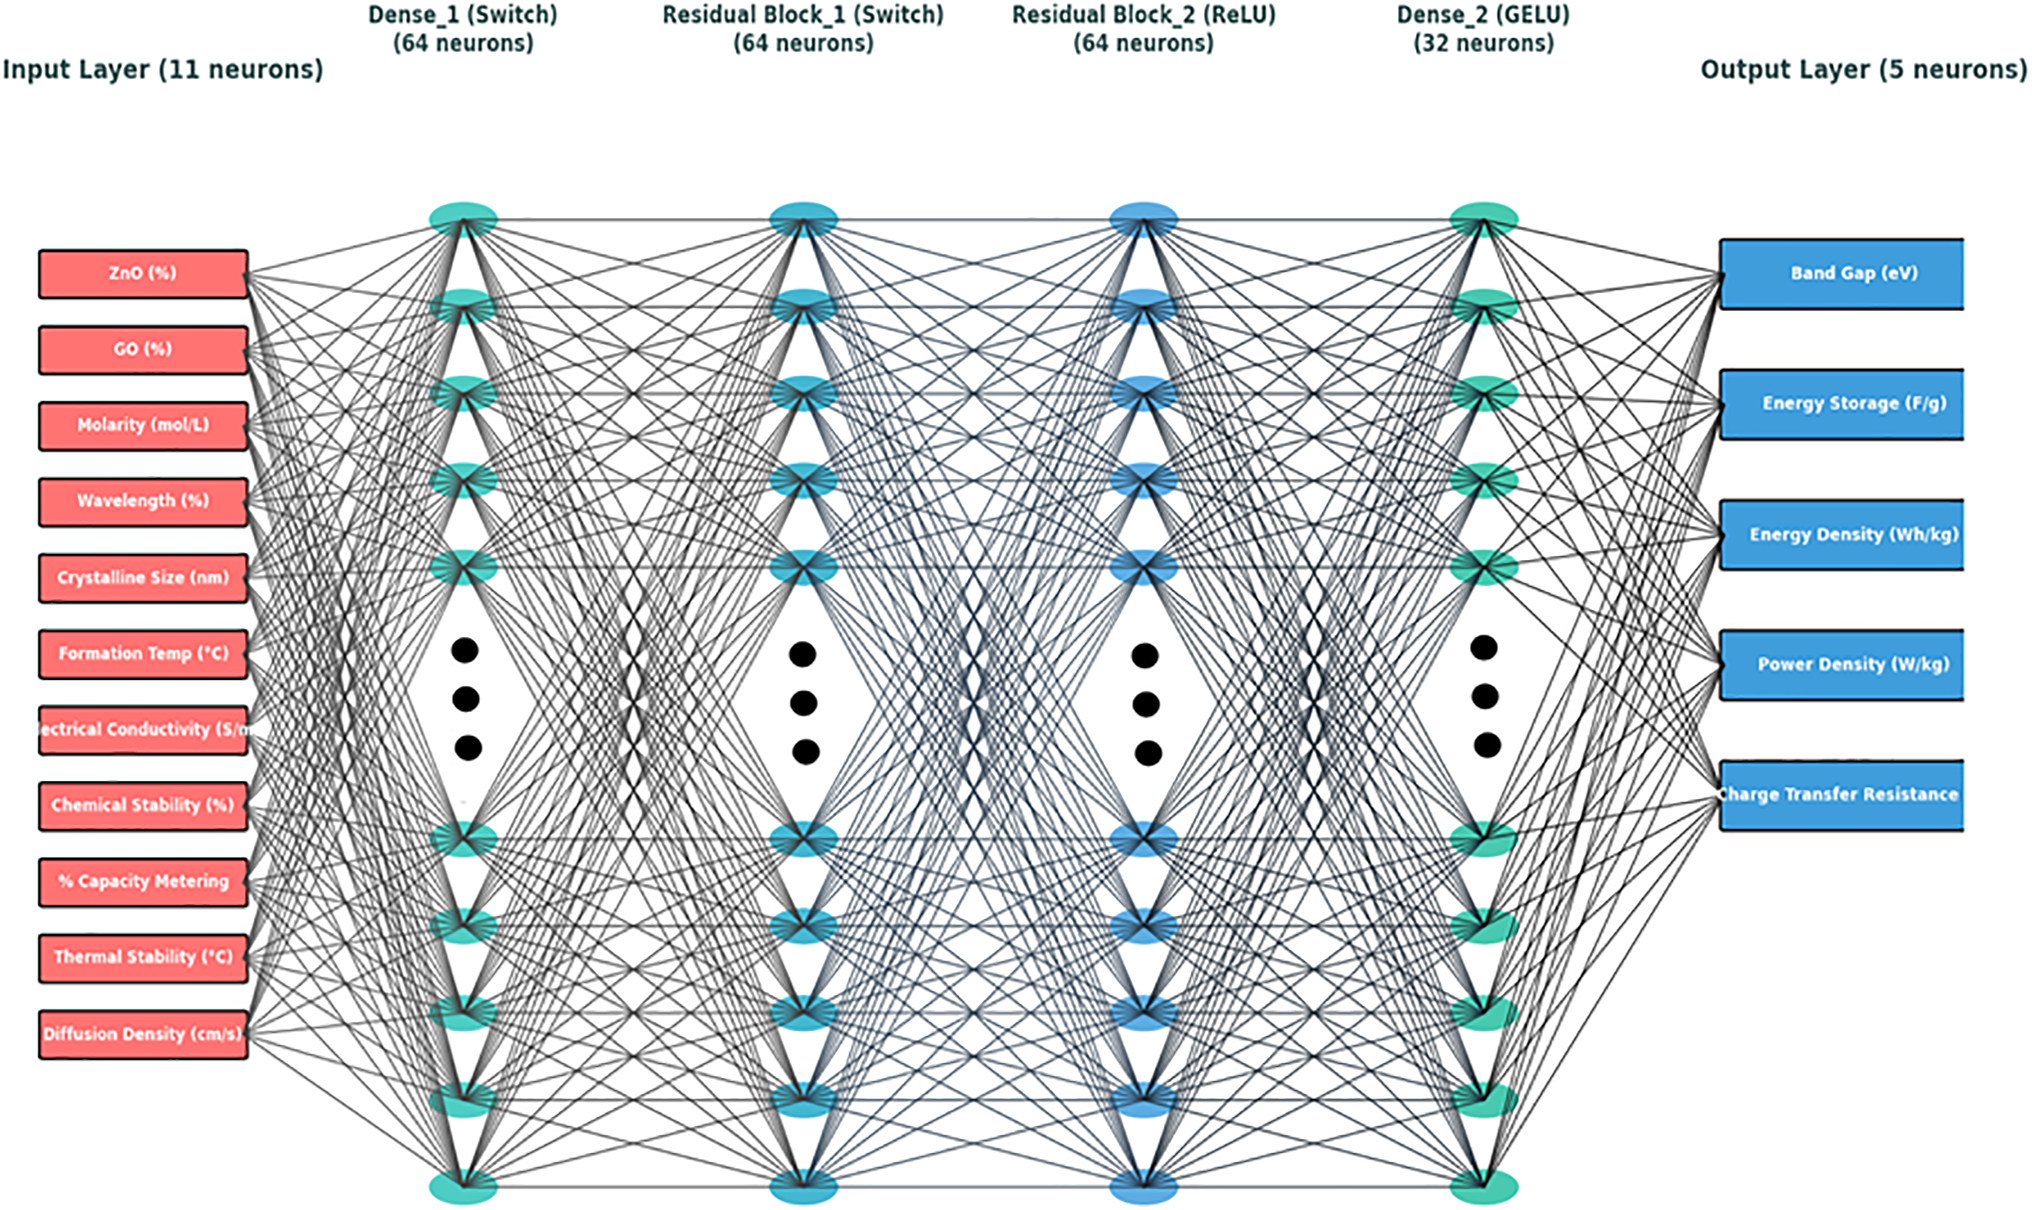
Figure 13: Artificial Neural Network (ANN) architecture for ZnO/GO nanocomposite prediction
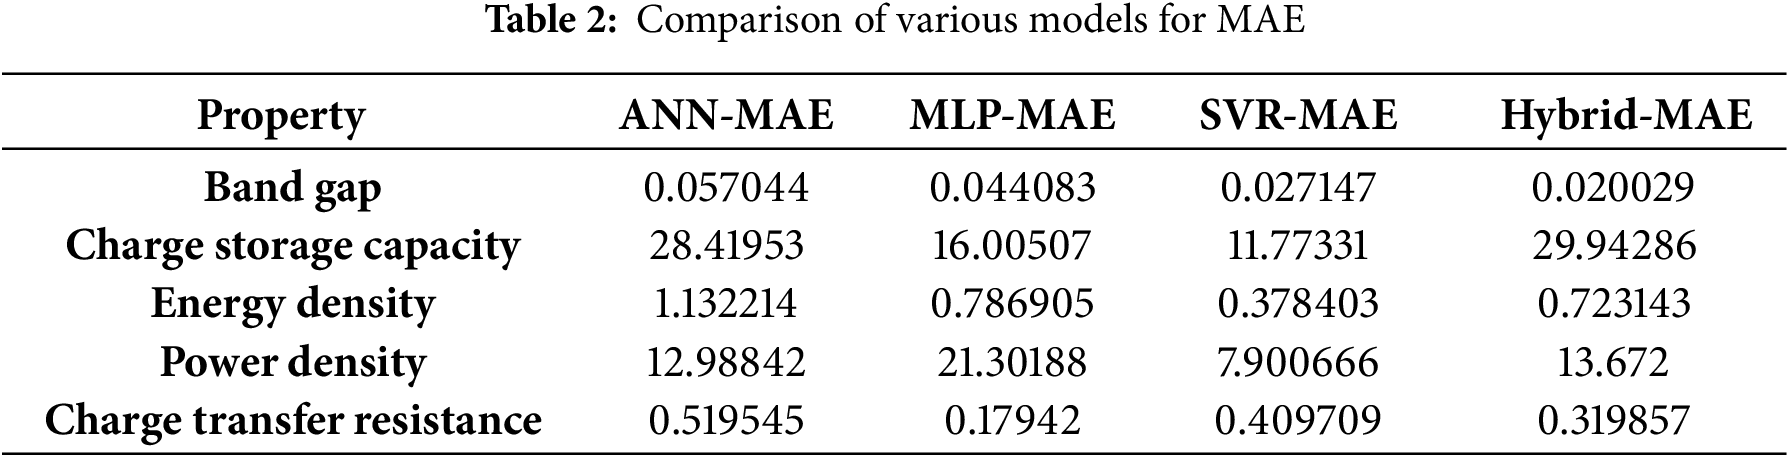
Different ML models like ANN, MLP, SVR, and hybrid models were used to observe the comparative performance. Support Vector Regression (SVR) uses the Radial Basis Function (RBF) Kernel to handle nonlinear data, and its hyperparameters (C, ε, γ) were optimized through grid search to get the lowest prediction error. To study the complex pattern in the input variables, the MLP model has two hidden layers with ReLU activations. The combination of fuzzy logic and machine learning is used to control and ease the data understanding, while in the hybrid fuzzy model, input fuzzy variables were used with the trained ANN and SVR models. Table 2 gives the Mean Absolute Error (MAE) values of different parameters for ZnO/GO nanocomposites for four ML models, like ANN, MLP, SVR, and hybrid.
The R2 scores (coefficient of determination) for five predicted parameters for each of the four machine learning models, ANN, MLP, SVR, and hybrid, are compared. Charge storage capacity (F/g), band gap (eV), energy density (Wh/kg), power density (W/kg), and charge transfer resistance (Ω) are among the metrics as shown in Fig. 14. All models show excellent prediction reliability for band gap and charge transfer resistance, with R2 values greater than 0.85. The advantage of combining the strengths of several models is demonstrated by the hybrid model’s slight lead in band gap prediction. This analysis shows that SVR and hybrid models show an excellent performance in understanding the complex characteristics of ZnO/GO nanocomposites for energy applications.
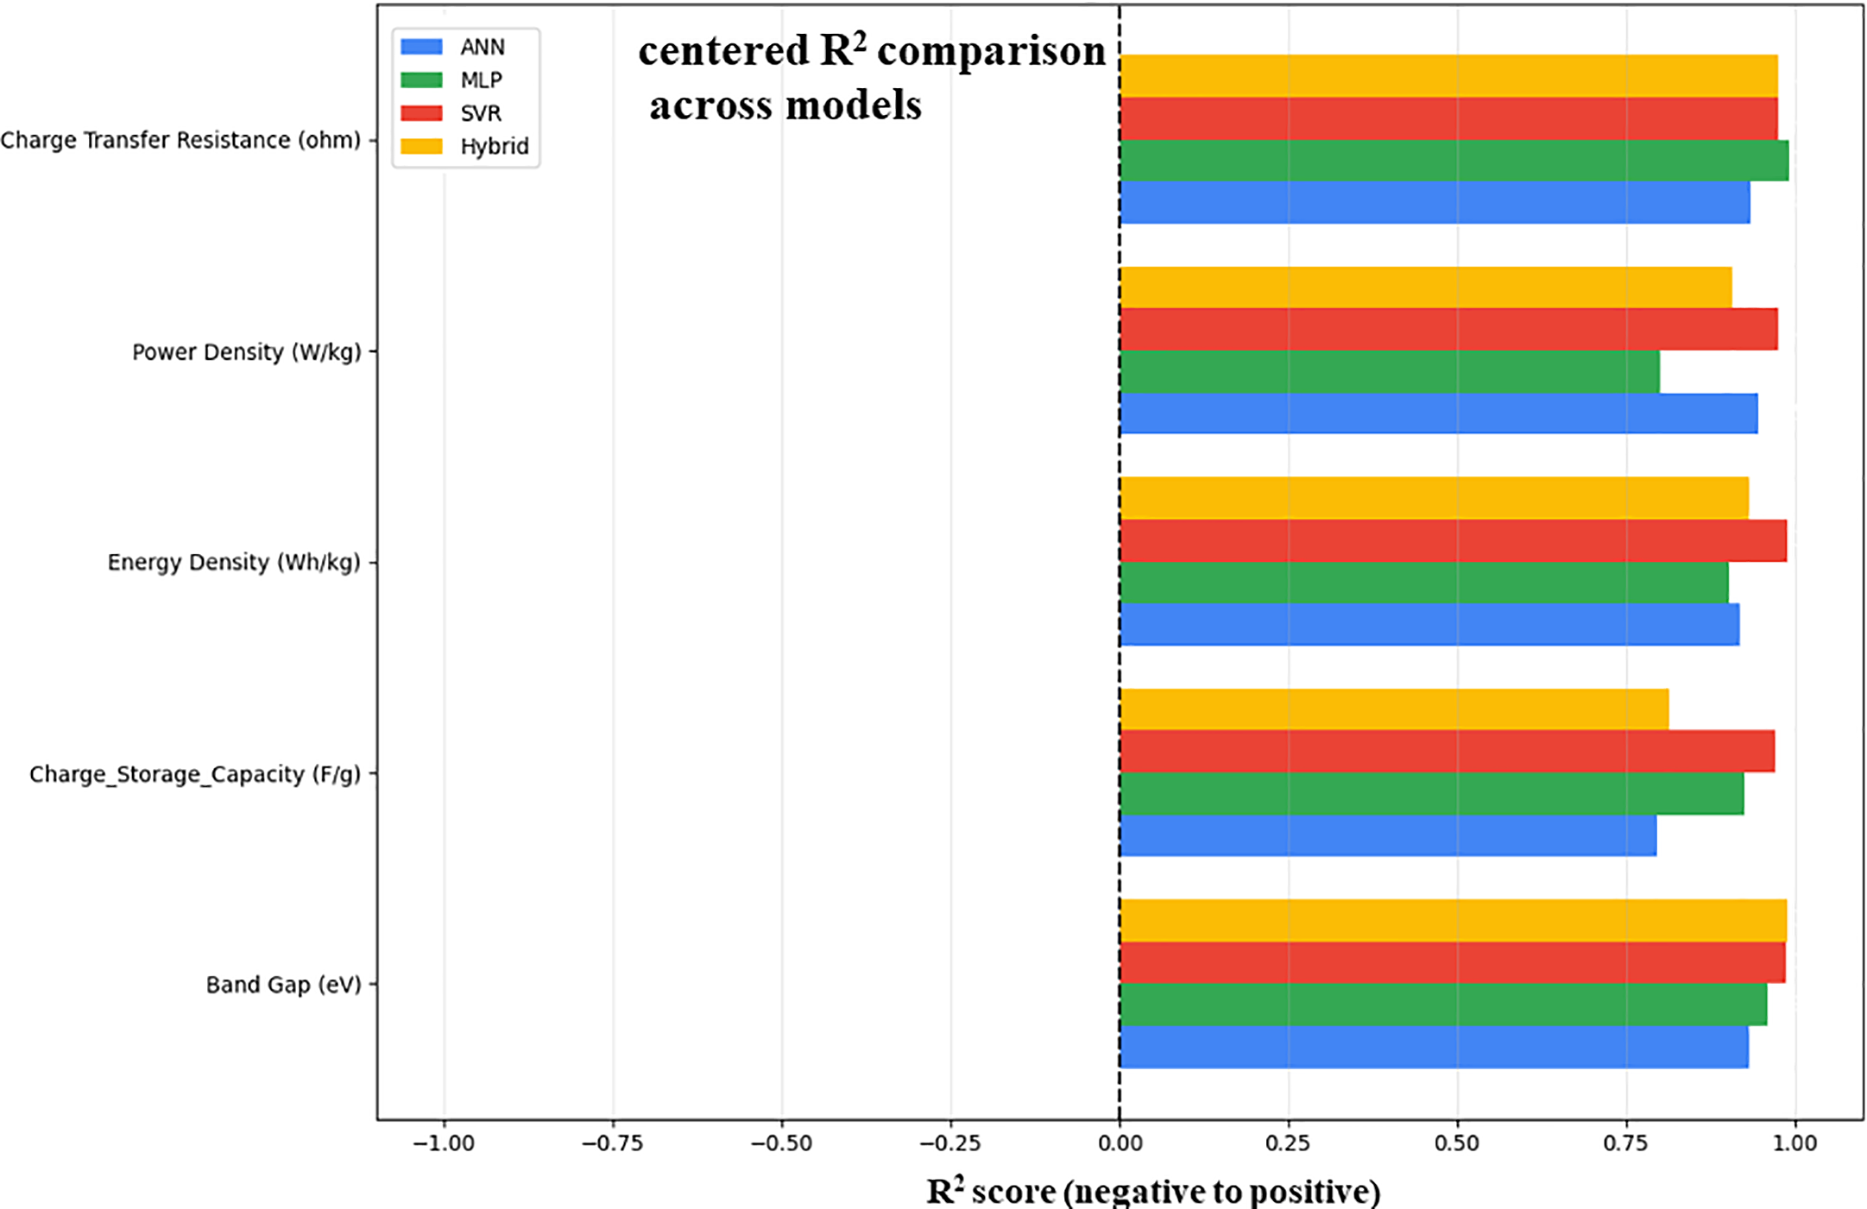
Figure 14: R2 (coefficient of determination) comparison across the ML models for ZnO/GO
To predict the different features for the ZnO/GO nanocomposites, for four models, like ANN, MLP, SVR, and a hybrid model, Table 3 is given below. The precise prediction of bandgap and energy density proves that these models can be used to predict the electrical and energy-related properties of the nanocomposites. A hybrid model shows an excellent prediction performance for the bandgap, but it is less consistent for some other parameters, demonstrating the complexity of ensemble techniques. In summary, by using this model-wise review, we can say that the ensemble and hybrid technique is effective in designing the smart nanocomposite for energy storage applications.
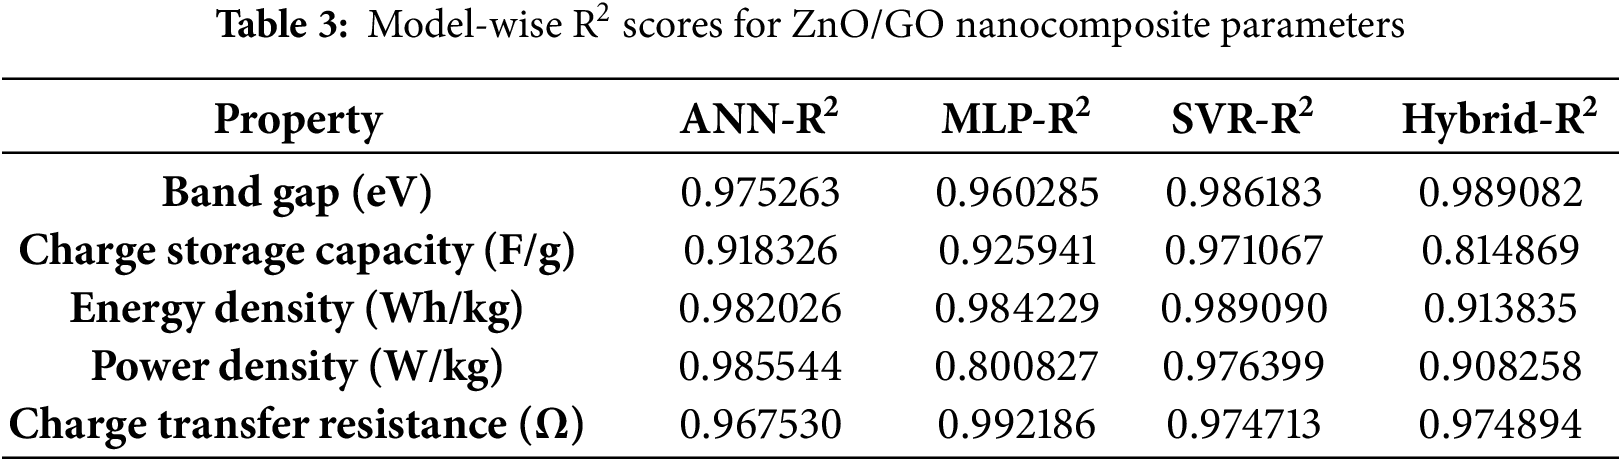
By combining several models and techniques hybrid model is overall better and consistent in prediction, while in some cases, SVR also performs better for smaller datasets and for nonlinear patterns under restricted conditions. In summary, each model has its advantages and limitations, while the hybrid approach gives the ideal reliability and precision [36]. Overfitting reduction techniques, including the Bayesian method and early stopping, were applied [37]. System non-linearity, small dataset size, and experimental uncertainty are the main drivers of inaccuracy. Potential ANN/MLP overfitting, sensitivity to SVR hyperparameters, and hybrid model complexity are some of the model’s drawbacks [38]. These elements demonstrate how the dataset’s properties and the property being predicted affect the model’s performance [39].
4 Synthesis and Characterizations
Zinc oxide (ZnO) nanopowder was synthesized by using sodium hydroxide NaOH, Sigma Aldrich 99%), zinc acetate dihydrate (from Sigma Aldrich 99%), and doubly ionized water (DI). Graphene oxide was synthesized using ethanol, hydrogen peroxide (H2O2, Sigma Aldrich 30 wt.%), sulphuric acid (H2SO4, Sigma Aldrich 98%), phosphorus acid (Sigma Aldrich 85%), potassium permanganate (KMnO4, Sigma Aldrich 98%), graphite powder (Sigma Aldrich 99%), and doubly ionized water. Every chemical employed was analytical grade and had not undergone further purification.
For the preparation of ZnO nanopowder, deionized water was mixed with 0.3 mol/L of zinc acetate dehydrate (Aldrich, St. Louis, MI, USA, 99%), and 0.3 mol/L of sodium hydroxide (Sigma Aldrich, St. Louis, MI, USA, 99%) was then added, and it was mechanically agitated for four hours at 55°C–60°C. The suspension was then set aside for 12 h to prepare a gel-like solution. It was then repeatedly cleaned using a mixture of ethanol and deionized water, and it was dehydrated for four hours at 65°C–70°C in a heating oven. To prepare nanopowder, the powder was dried and then pulverized using a ceramic pestle and mortar.
Graphite powder was used in the Modified Hummers’ method to prepare the graphene oxide [40]. For cooling purposes, 60 mol/L of phosphorous acid (Sigma Aldrich 85%) and 540 mol/L of sulphuric acid (Sigma Aldrich 98%) (9:1 ratio) were combined and allowed to cool for two hours. Next, under continuous magnetic stirring, 4.50 g of graphite powder (Sigma Aldrich 99%) was added to the liquid, pinch by pinch. After that, 26.4 g of KMnO4 (Sigma Aldrich 98%) was poured into a mixture, and the sample was finally agitated for 14 h using a magnetic stirrer until it turned dark green. 80 mol/L of hydrogen peroxide (H2O2; Sigma Aldrich 30 wt.%) was put in and agitated for 20 h to eliminate the surplus KMnO4. Following the exothermic chemical reaction, this solution was allowed to cool to ambient temperature. After adding 600 mol/L of deionized water to the graphene oxide solution, it was centrifuged for 25 min at 3500 rpm. The resulting solid residue was cleaned with ethanol and baked for 20 h at 90°C in an oven to produce graphene oxide. A ceramic pestle and mortar were then used to grind it into a nanopowder.
To prepare the ZnO nanocomposite material combination doped with graphene oxide, an ultrasonic homozenizer/probe sonicator was used to sonicate 2 g of zinc oxide and 0.2 g of graphene oxide (GO) (10% of zinc oxide) in a solution of 40 mol/L deionized water and 40 mol/L ethanol for two hours at 25°C. This sample was then moved to a poly (tetrafluoroethylene) receiver, which was placed inside a 100 mol/L hydrothermal stainless steel autoclave. For 20 h, this autoclave was kept in a heating oven set at 180°C–190°C. In the end, the resulting powder was pounded using a pestle and mortar to get the fine powder, centrifuged multiple times, and then dehydrated in an oven at 80°C for eight hours. ZnO/GO was the name of this sample. All syntheses were carried out with standardized precursors and strictly regulated hydrothermal conditions (180°C–190°C, constant ratios) to guarantee reproducibility [41]. Three repetitions of each experiment produced consistent optical and structural characteristics. Variations in temperature or molarity, GO dispersion, or instrumental effects like XRD peak broadening and PL intensity fluctuations could still cause small uncertainties. The schematic synthesis diagram is shown in Fig. 15.
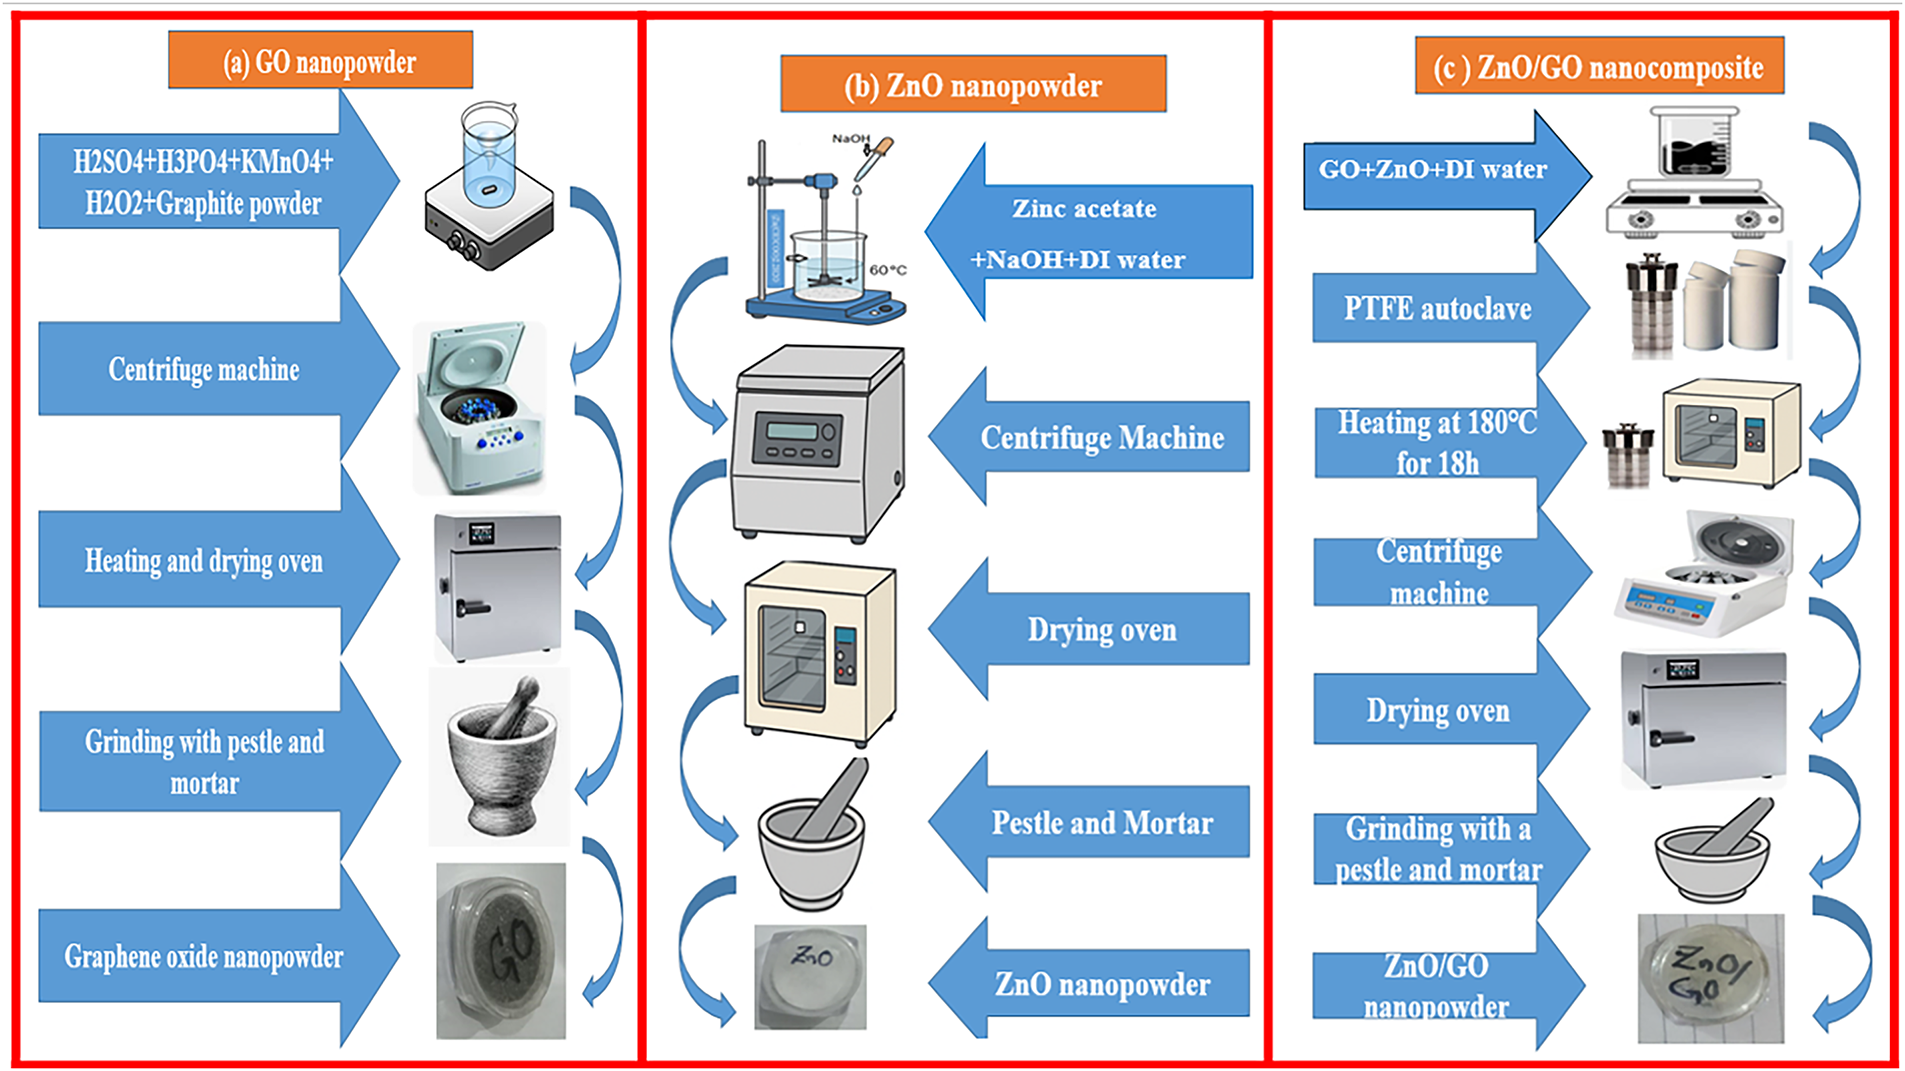
Figure 15: Schematic diagram for the synthesis of GO powder (a), ZnO nanopowder (b), and ZnO/GO nanopowder (c)
The material’s crystalline nature was observed by operating the Rigaku D/Max-2400 diffractometer at a 2θ angle between 10° and 80° with CuKα radiation at 40 kV to investigate the X-ray diffraction (XRD) peaks. The energy-dispersive X-ray spectra (EDS) and outer layer snaps are visualized using a Field Emission Scanning Electron Microscope (FESEM, Hitachi SU-6600, Tokyo, Japan) operating at an accelerating voltage of 15 kV. Using a PerkinElmer RXI spectrometer (Shelton, CT, USA), the samples were functionally observed using Fourier Transform Infrared (FTIR) spectroscopy at room temperature in the 4000–500 cm−1 range. A 450 W xenon arc lamp was used as the excitation source for a Horiba Jobin Yvon Fluorolog-3 spectrofluorometer, which was used to perform photoluminescence (PL) spectroscopy at room temperature. With a wavelength detection range of 200–800 nm, the device provides a high-resolution study of the nanomaterials’ emission and defect features while operating in steady-state mode.
The phase composition and crystal nature of graphene oxide-doped ZnO nanocomposite with GO 10 wt.% and 90 wt.% ZnO was examined by X-ray diffraction Fig. 16. With conspicuous peaks indexed to the (100), (002), (101), (102), (110), (103), and (112) planes at 2θ = 31.7, 34.4, 36.2, 47.4, 56.5, 62.7, and 67.8°, respectively, Fig. 16 displays the distinctive reflections of hexagonal wurtzite ZnO (JCPDS Card No. 36-1451) [42]. Additionally, the presence of layered graphene oxide structures was confirmed by a low-angle diffraction peak at 12.8° that corresponds to the (001) plane of GO [43]. GO/graphitic (002) stacking is responsible for a wide feature at around 28.0°, which suggests partial ordering or reduction of GO sheets [44]. It is to be noted that two extra peaks, which are not exactly matched with the zinc oxide, were observed at 32.8 and 59.5°. A shifted or overlapped ZnO (100) reflection could be represented by the 32.8° peak, whereas a shifted (110) plane is most likely represented by the 59.5° peak. These peak shifts are frequently observed in ZnO/GO composites and are typically attributed to interfacial interactions between the GO sheets and ZnO nanoparticles, lattice strain, and crystallite size effects [44]. These findings demonstrate that adding GO causes minor structural changes in the ZnO lattice in addition to introducing its distinctive peaks. Lattice strain, oxygen vacancies, or leftover intermediate phases that may occur during precursor breakdown can be the cause of weak shoulders or large minor peaks in our situation. These characteristics are frequently observed in ZnO/GO systems, though, and usually indicate transitory or interfacial effects as opposed to bulk impurities. According to recent research, the dominant ZnO phase and its suitability for electrochemical applications are unaffected by these extra reflections [45].
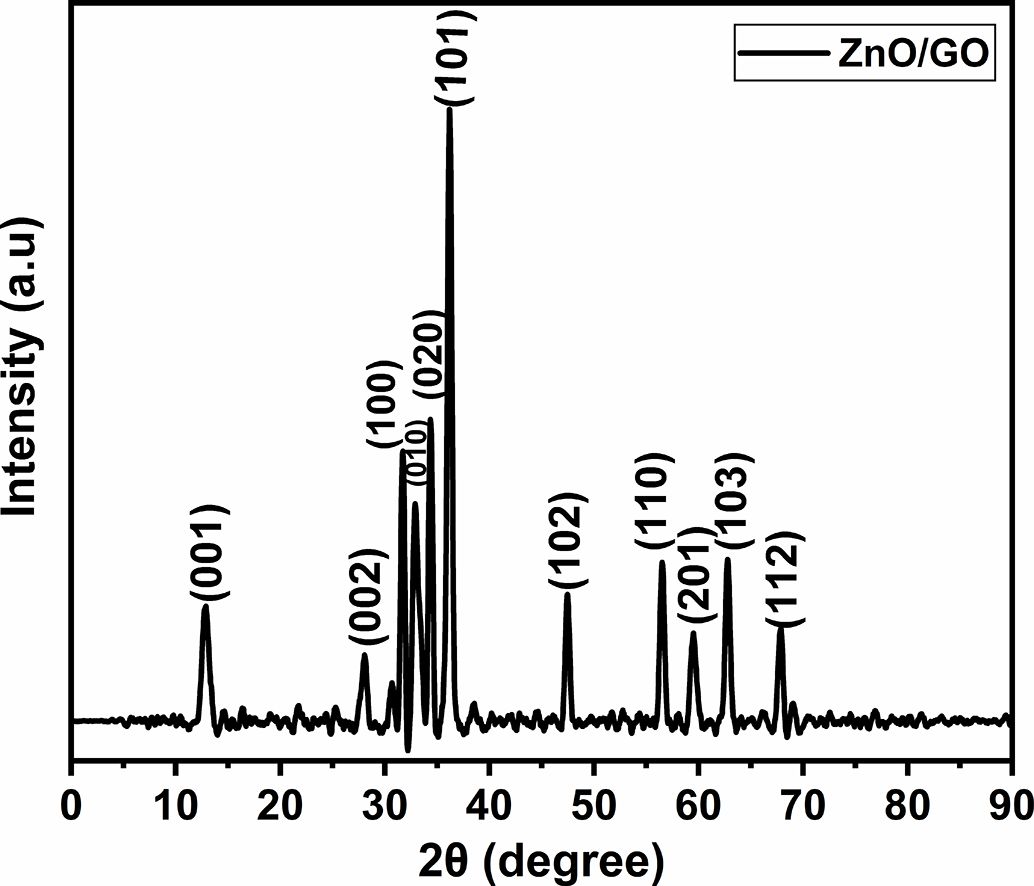
Figure 16: XRD pattern of ZnO/GO nanocomposite with GO 10 wt.%
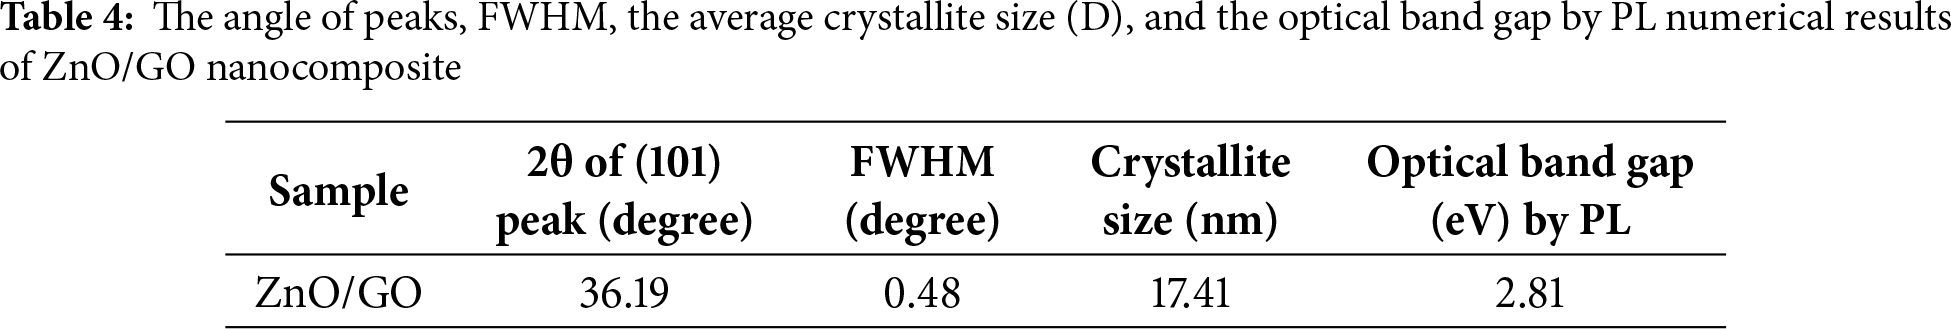
The peak intensity and broadness indicate the amorphous or crystalline nature of the prepared samples. The broadness of the peaks suggests a small average crystallite size, for the graphene oxide-doped ZnO nanocomposite was measured by following the Debye-Scherrer formula [20] of the (101) ZnO crystal planes of diffraction. The results are shown in Table 4. The average crystallite size of ZnO/GO nanocomposite was 17.41 nm. This can be viewed from the XRD results and may be because of the chemical properties of graphene oxide with zinc oxide particles and the decrease in the crystalline size of the ZnO. The change of the crystal parameter of ZnO with various graphene oxide amounts can be measured by using a hexagonal crystal formula shown in Eq. (1) [46,47].
here, d is the distance between the planes, while h, l, and k show the Miller indices “a” and “c” denoting the lattice parameters of the hexagonal wurtzite crystal structure of zinc oxide. The mean value of crystallite size (D) of nanocomposites with GO-doped ZnO can be measured by following the Debye-Scherrer Eq. (2) [48].
here, K is a dimensionless form factor, the Bragg angle value is denoted by θ, the X-ray beam’s wavelength by λ, and the line broadening at full width at half maximum (FWHM) intensity by β. The values of crystallite sizes and band gap (eV) are given in Table 4.
The high resolving power of the scanning electron microscope image of graphene oxide-doped ZnO nanocomposite is shown in Fig. 17a. Strong interfacial interaction between ZnO and GO is suggested by the ZnO nanoparticles’ consistent anchoring on the surface of GO sheets in the ZnO/GO nanocomposite. For a variety of uses, including smart nanocomposite materials for energy storage devices, photocatalysis, and energy storage, this hybrid shape may improve charge transfer and surface area. Due to van der Waals forces, graphene oxide sheets were roughly clear, and as their quantity increases, the sheets get dumpy because they tend to be compiled [49]. This confirms the fabrication of graphene oxide-doped ZnO nanocomposite [50,51]. The EDS analysis showed the atomic composition of ZnO/GO by using the (FE-SEM, Hitachi SU-6600) microscope working at 15 kV to describe the spectra. The EDX spectrum (Fig. 17b) displays the predicted elemental composition with C (63.96 wt.%), O (26.89 wt.%), and Zn (9.14 wt.%). The Zn/O ratio is in line with ZnO stoichiometry, while the comparatively larger carbon content is associated with the GO matrix. Therefore, quantitative validation of the uniform dispersion of ZnO over GO sheets can be obtained by combining EDX compositional mapping with SEM-based particle size distribution. According to recent studies on ZnO/GO composites, this degree of structural homogeneity is essential for improving charge transport and stability in energy storage applications [52]. The EDS peaks and expected chemical composition were in good agreement with each other, which reveals that a ZnO/GO nanocomposite was fabricated. The EDS results indicate that reasonable percentages of specific elements are available in the fabricated material [51]. Fig. 17c displays the SEM/EDS discussion along with a quantitative grain size distribution analysis that was acquired using ImageJ software. A somewhat uniform distribution is confirmed by the histogram, which shows particle sizes ranging from around 0.5 to 6 µm with an average grain size of 2.93 µm. This feature enhances the descriptive SEM/EDS observations and offers a more thorough evaluation of particle dispersion. While the larger particle size (~2.93 µm, from SEM) shows agglomerated clusters of many crystallites, the ZnO/GO crystallite size (17.41 nm, from XRD) depicts coherent crystal domains. Because of surface energy and van der Waals interactions, polycrystalline nanocomposites frequently exhibit this type of nanoscale-to-microscale aggregation [53].
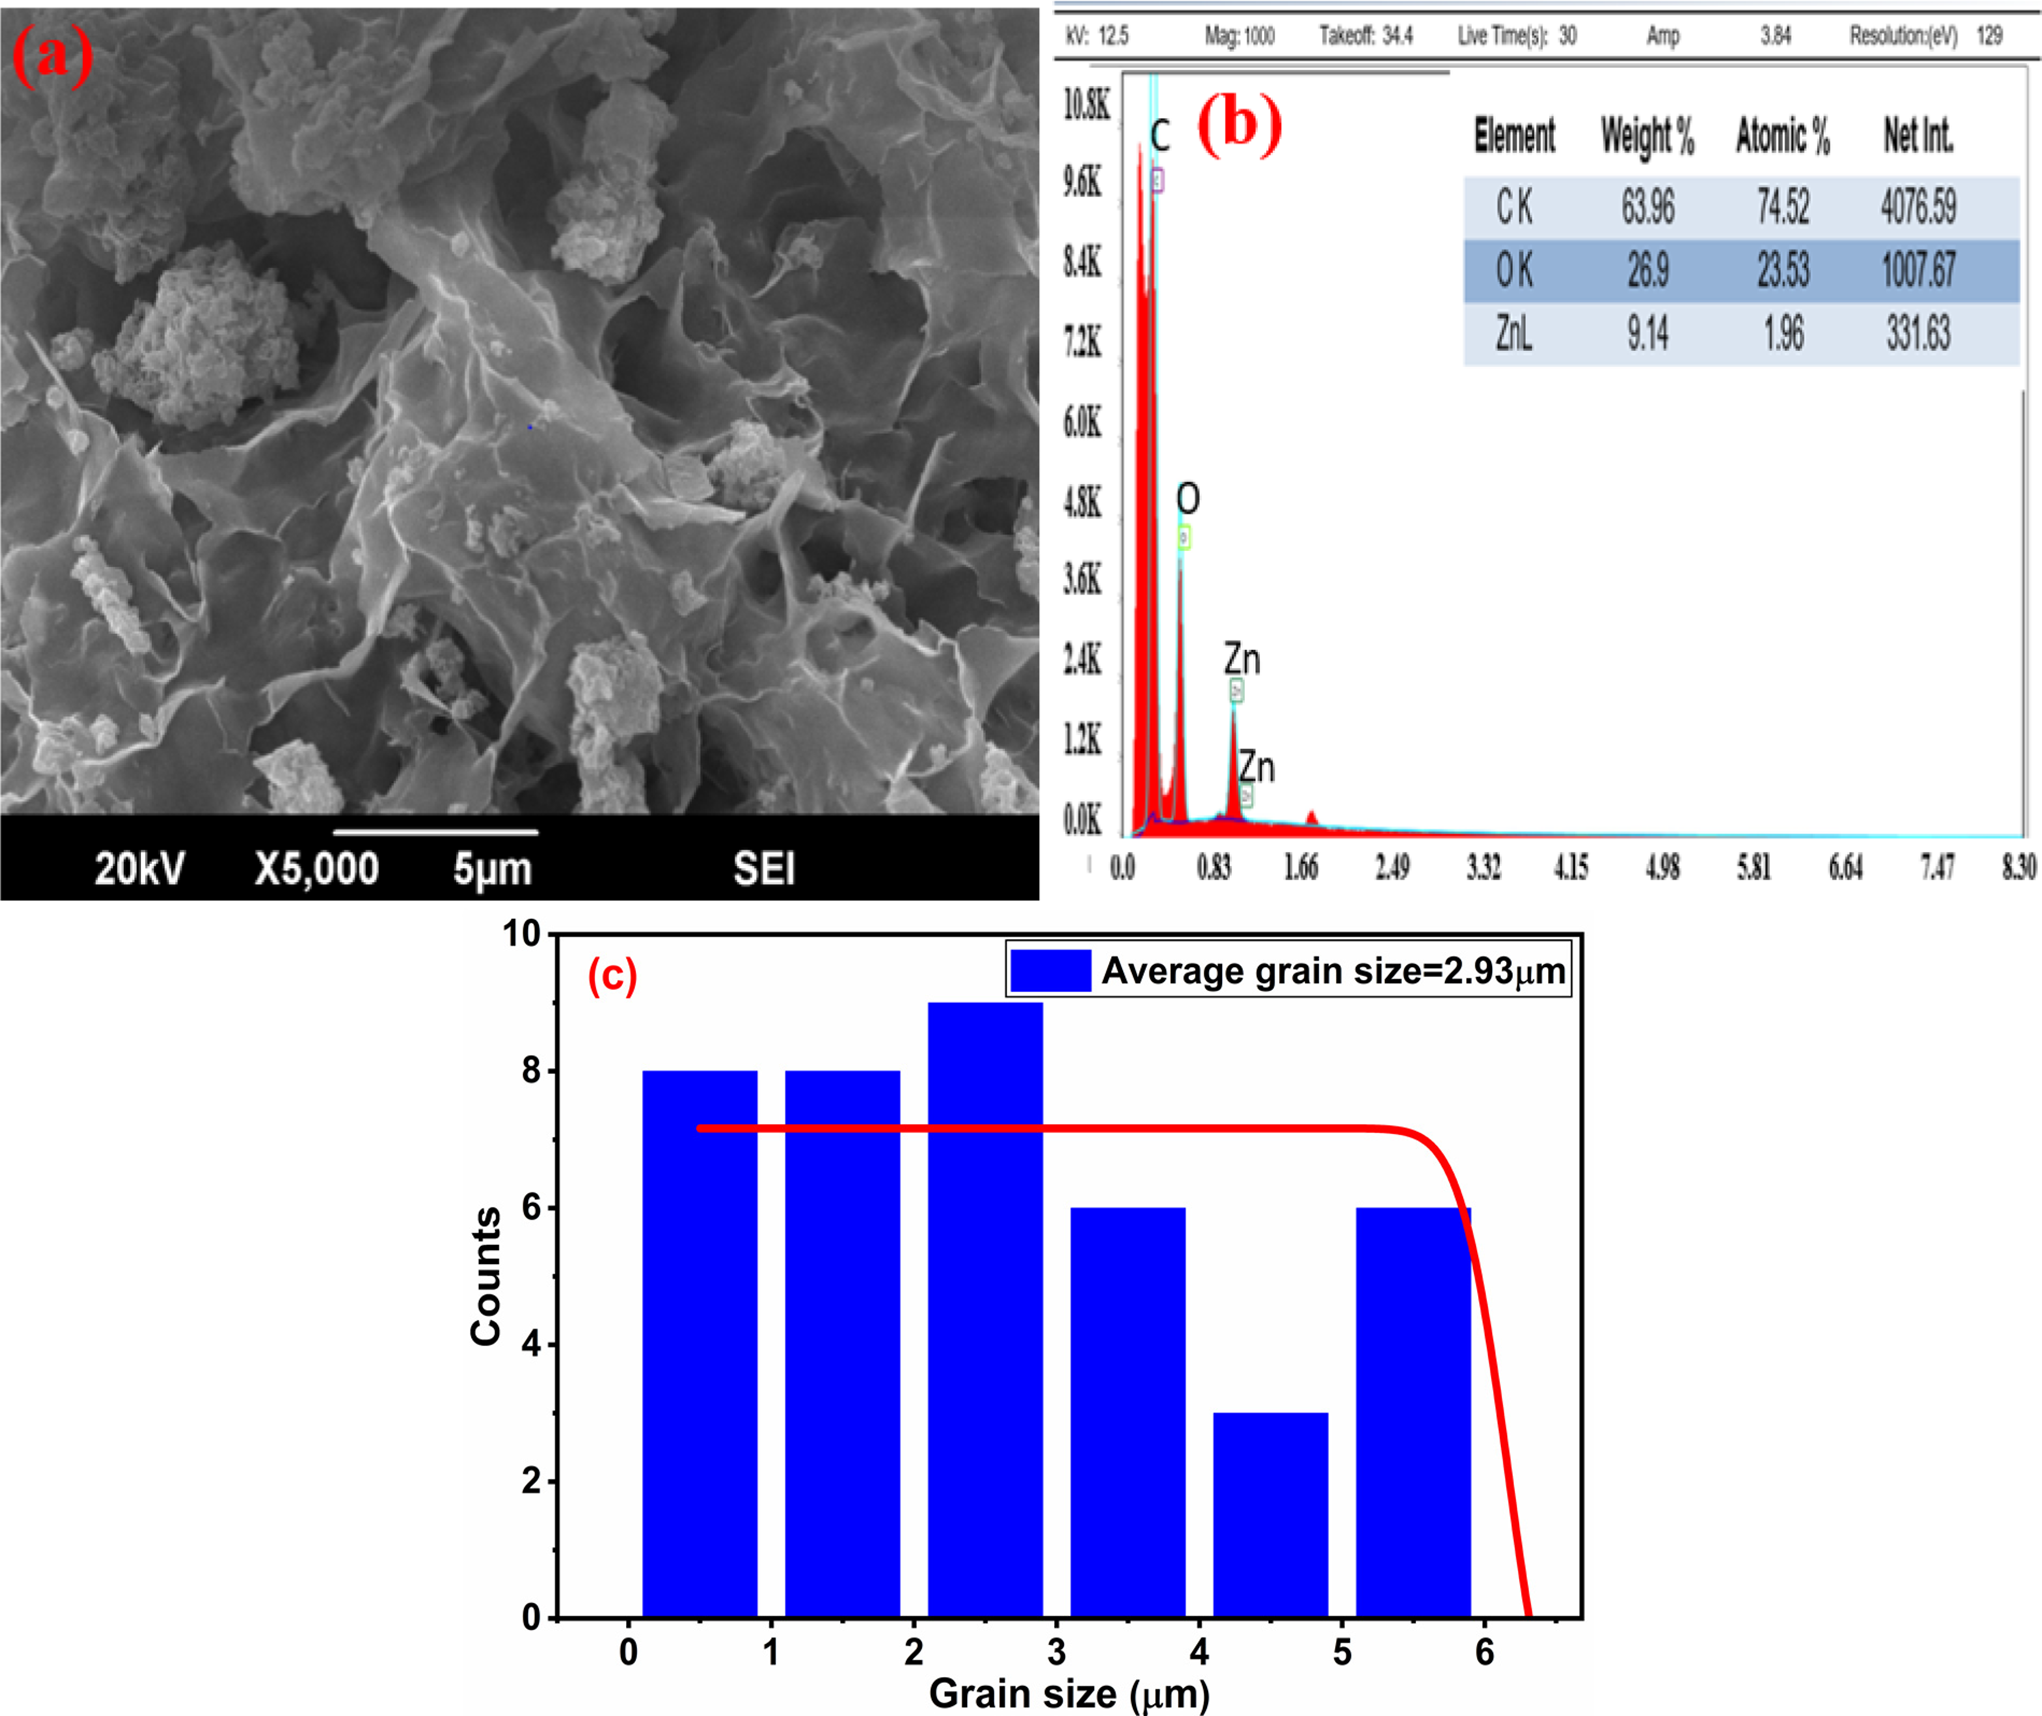
Figure 17: (a) SEM (b) EDS (c) Particle size distribution pictures at 5000× zoom and 5 μm scale for ZnO/GO (a–c)
FTIR spectroscopy explains the functional groups in the graphene oxide-doped zinc oxide nanocomposite. Fig. 18 shows the availability of different bands of absorption in the FTIR results of graphene oxide-doped zinc oxide. FTIR spectra of ZnO/GO nanocomposite show several bands lying between the ranges of 400 to 4000 cm−1. The peaks of absorption lie at 3541 and 3367 cm−1, and represent the O-H functional group elastic vibration [54]. Different bands viewed at 1725, and 1416 cm−1 belong to C=O, and C-OH elastic vibration, respectively [55,56]. In addition, peaks observed near 1266 cm−1 can be described as a C-O elastic vibration [57] that moves from 1222 cm−1 for graphene oxide due to the fabrication of the composite. The values of peaks at 550 and 850 cm−1 were described as Zn-O elastic vibration, thus indicating the availability of ZnO in the prepared sample [58].
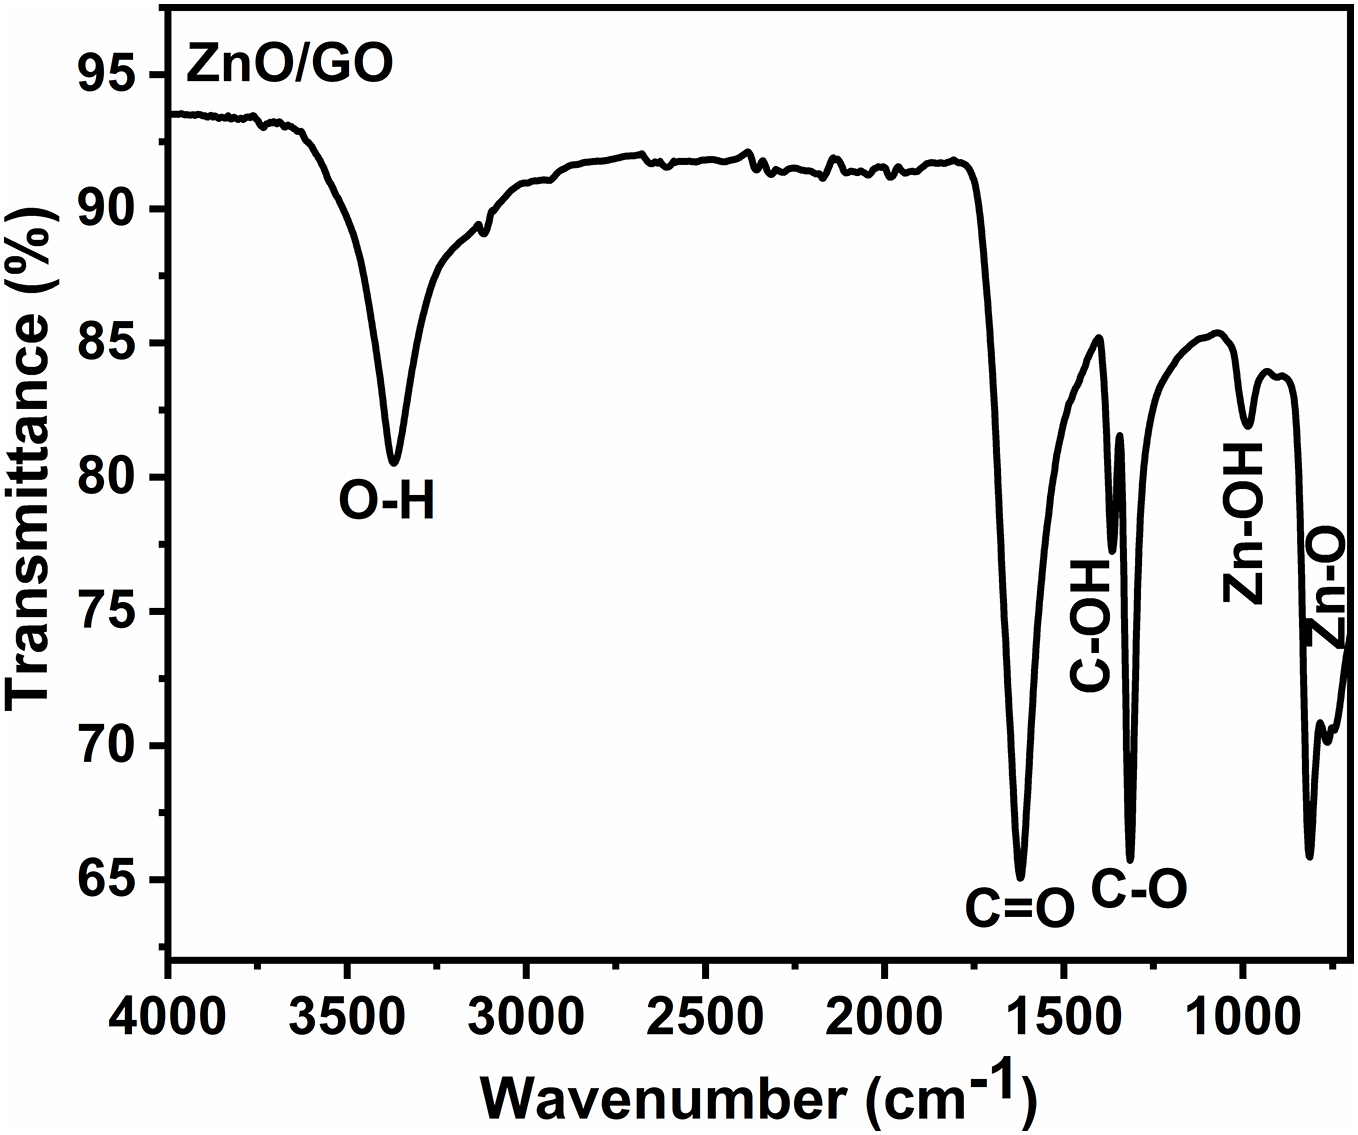
Figure 18: FTIR plots ZnO/GO nanocomposite
4.6 Photoluminescence Spectroscopy (PL)
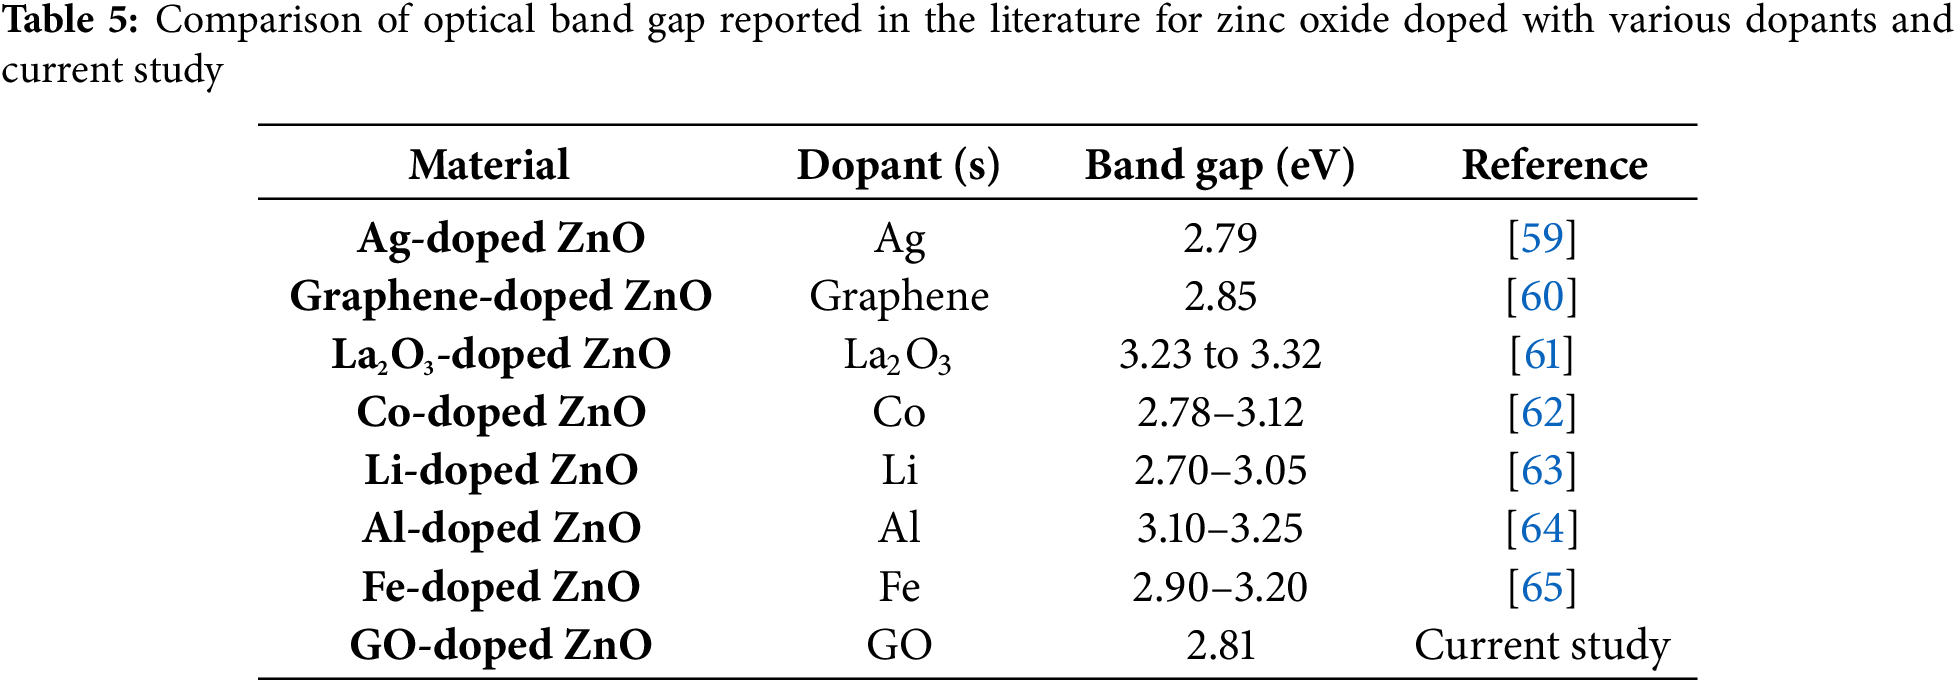
To examine the optical characteristics and defect states of ZnO/GO nanocomposite, photoluminescence (PL) spectroscopy was used. Strong interfacial interactions between GO and ZnO were shown by the PL emission peak shifting to 439 nm for the ZnO/GO nanocomposite. By decreasing exciton recombination and increasing electron mobility, the redshift in emission points to better charge transfer at the GO-ZnO interface [4]. The reduction in emission intensity brought on by defects also supports the passivation of trap states by GO addition, which is important for enhancing the performance of the nanocomposite in energy applications [5], as seen in Fig. 19a. Photoluminescence (PL) spectroscopy was used to estimate the band gap energy of the ZnO/GO nanocomposite. The ZnO/GO nanocomposite’s projected band gap energy of 2.81 eV showed how GO inclusion affected ZnO’s electrical structure (Fig. 19b). The band gap decreases for the ZnO/GO nanocomposites as compared to the pristine ZnO due to the improved charge transfer mechanism, and this is an outstanding property for energy storage devices [2]. The mutual interaction between the zinc oxide and the graphene oxide nanocomposites decreases the value of the optical bandgap due to the oxygen-containing functional groups, which improve the defect passivation and charge mobility [3]. When we incorporate the graphene oxide into zinc oxide, it improves the absorption of visible light, changes the density of states, and varies the electronic structure of the nanocomposites [4]. The variation in the value of the bandgap is an important parameter for energy storage materials used in advanced and smart energy storage devices [5]. Table 5 shows the comparison of previously published work and the current study with different dopants. This bandgap property is ideal for energy storage applications.
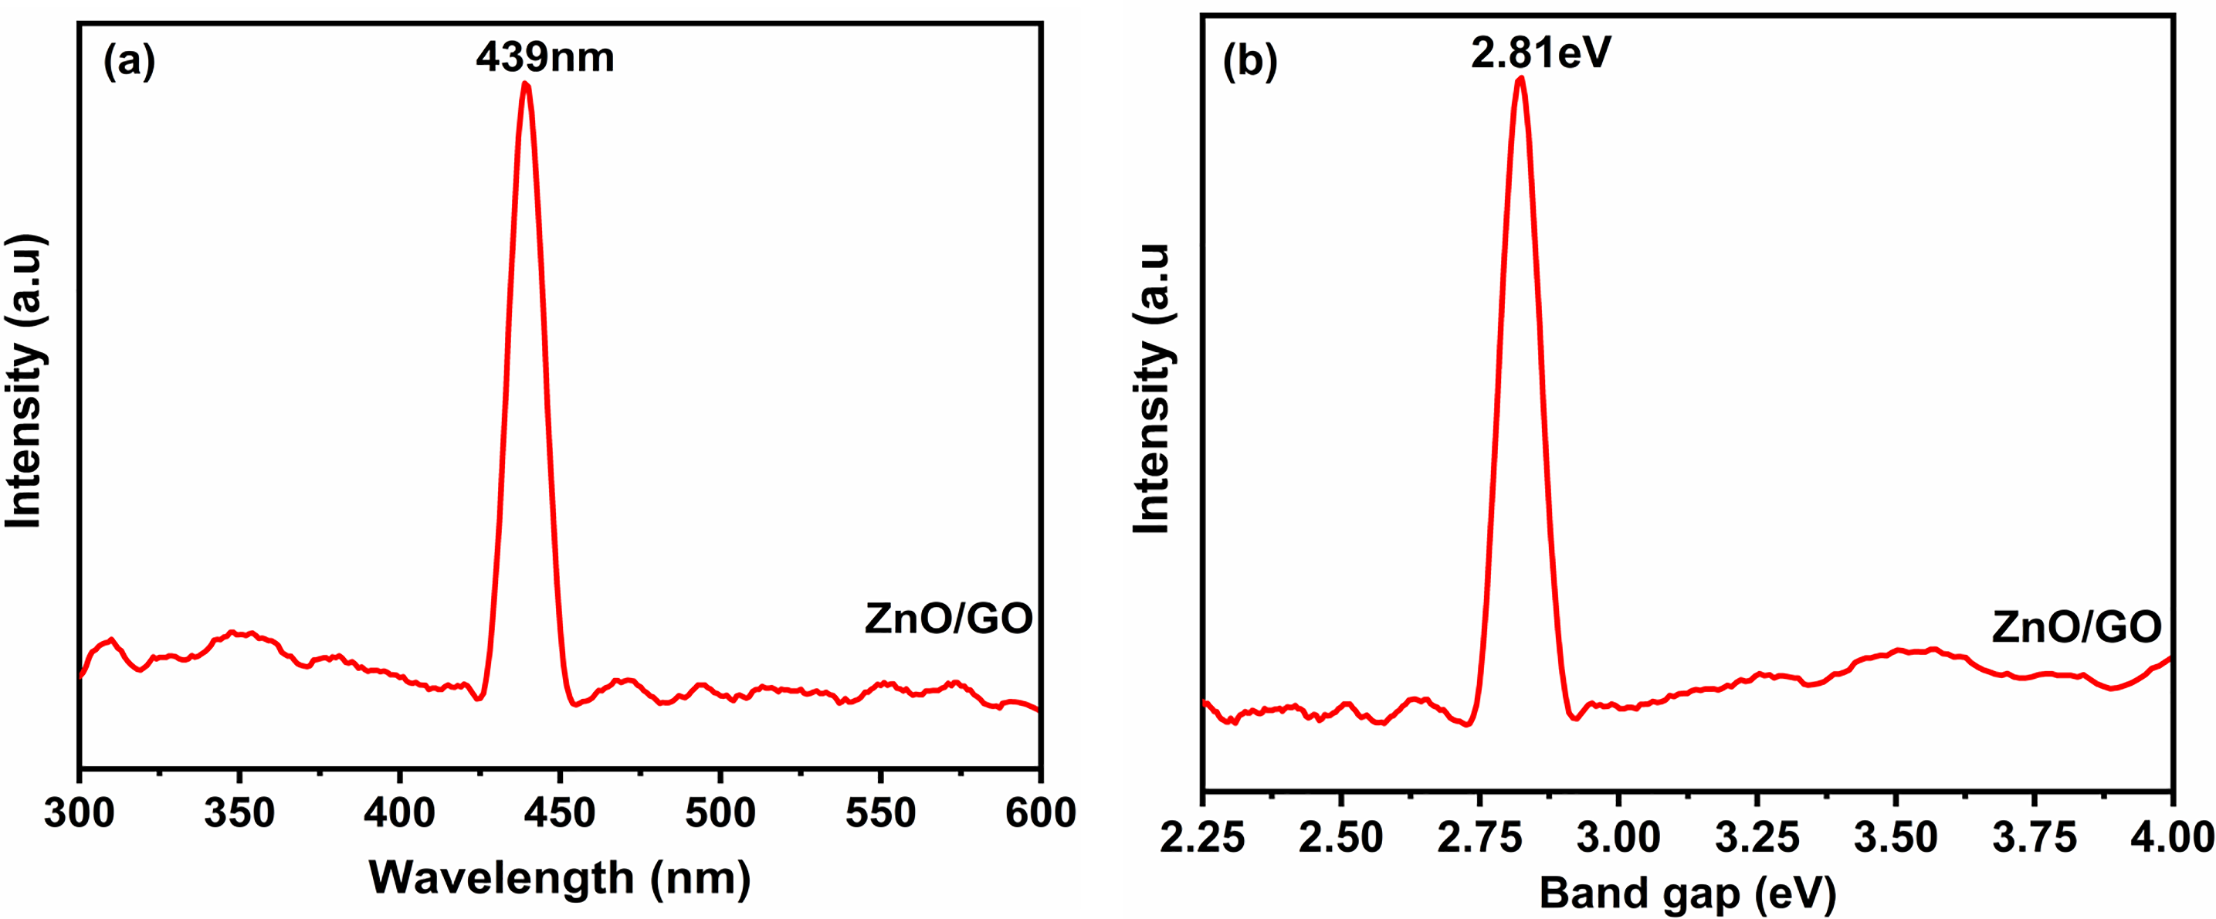
Figure 19: Photoluminescence (PL) emission spectra (a) and optical band gap spectra (b) for ZnO/GO nanocomposite
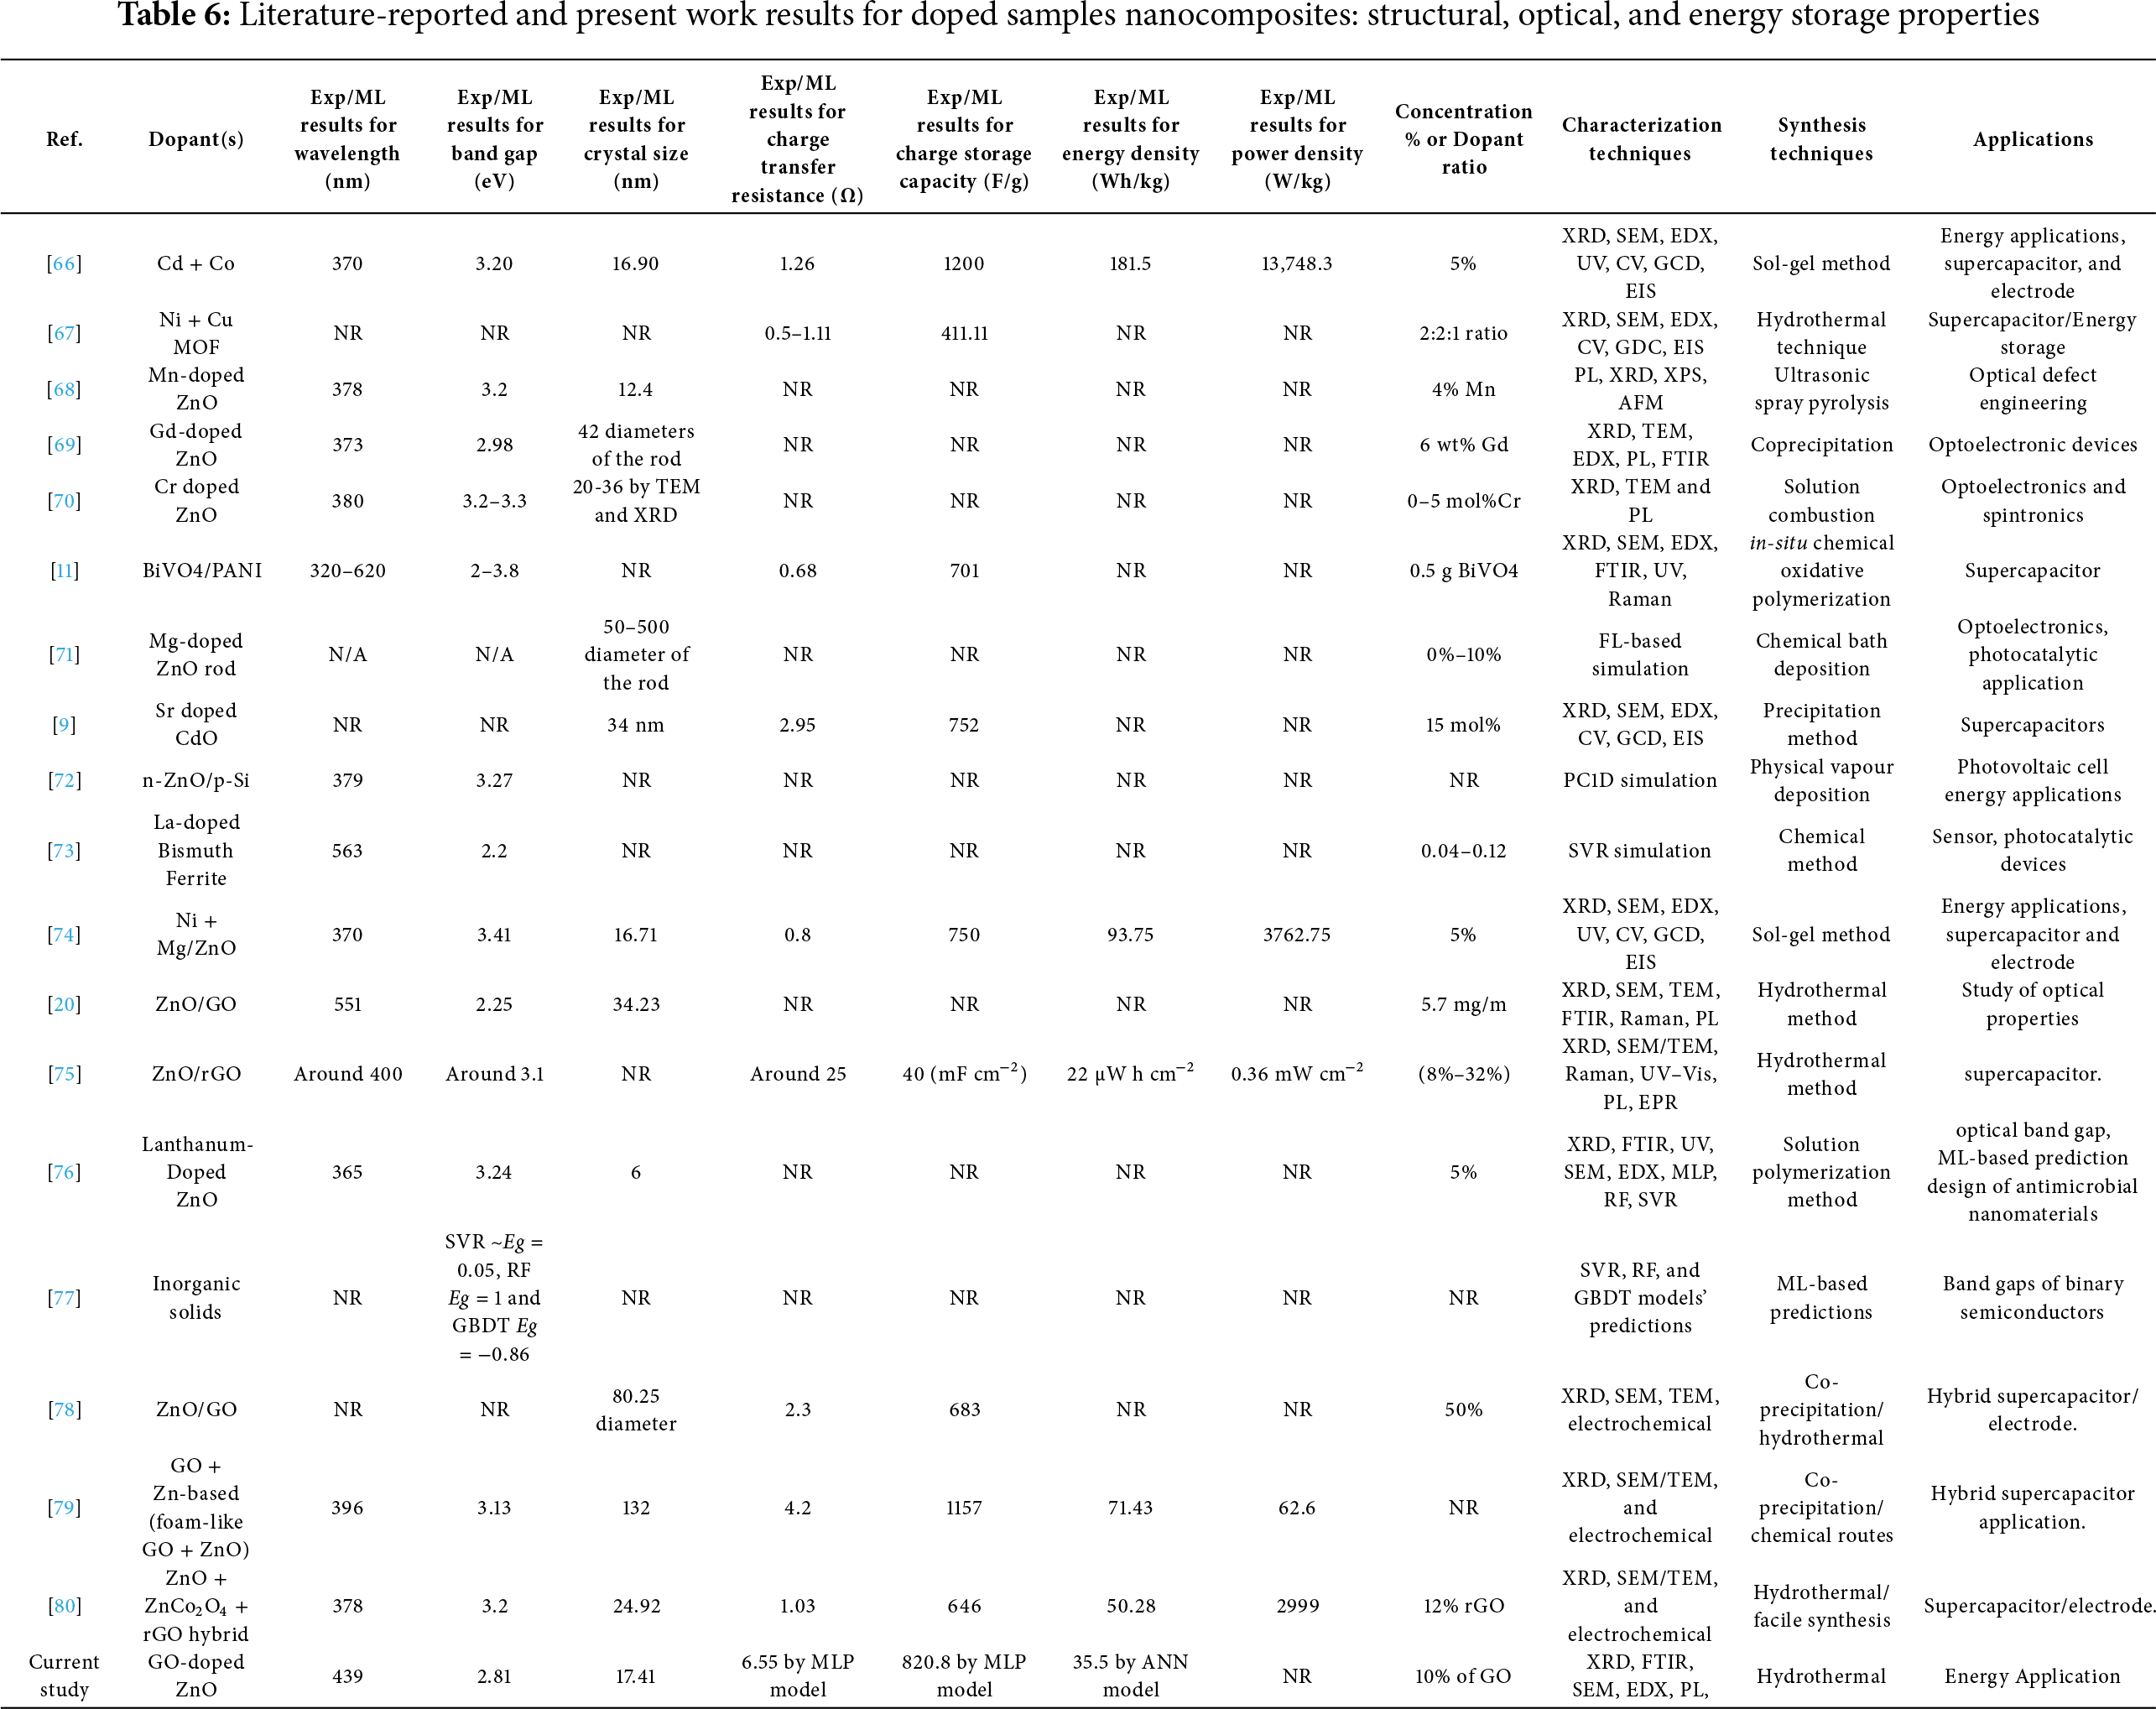
Its performance for charge and discharge can be enhanced, and it has a long-term cycling, which is ensured by the connection of GO with ZnO, and it has a strong impact on electrochemical stability and reduces the recombination of electrons with holes. Due to this reason, these ideal nanocomposites produce a perfect and fast energy storage system with ideal supercapacitive abilities. The difference with conventional dopant GO produces a structural stability and alignment with an exceptional bandgap. This synergetic effect produces the fast diffusion of ions and energy conversions. GO-doped ZnO is an excellent nanocomposite having a bright and novel performance for friendly energy application related to the environment. This study combines fuzzy logic, machine learning, and experimental analysis for a smart nanocomposite material for energy storage applications, unlike the previous research, as shown in Table 6. The whole process and methods in combination with each other give us valuable parameter values, including crystal size, bandgap, wavelength, charge transfer resistance, charge storage capacity, energy storage capacity, and power density. Previously, most studies have only concentrated on isolated simulations or experimental measurements. Crucially, this work’s experimental results validate the accuracy and resilience of the constructed models by demonstrating a very close agreement with both FL and ML predictions. This work is superior to traditional studies published in the literature because of its unique combination of experimental and computational methods, which not only shows the predictive power of sophisticated ML and FL techniques but also offers a useful road map for the design and optimization of high-performance nanocomposites for practical smart energy storage applications.
Materials with a high energy density and long cycle stability are best suited for energy storage. Carbon-based materials, especially activated carbon and graphene oxide [24] are used as supercapacitors due to the large surface area that allows for more electrode-electrolyte interface contact, enabling a fast charge-discharge rate. We can also use this material for novel energy devices, sensors [81] like chemical [82] or electrochemical [83]. From the above discussion, it can be concluded that we can use this smart nanocomposite of graphene oxide-doped ZnO for energy applications, piezoelectric [84], nano energy materials, weighted and stretchable, and smart energy devices, nanostructures, and electrochemical sensors [85], and especially for electrode materials. Our work is unique in that it combines synthesis and characterization (XRD, PL, FTIR, SEM/EDX) with machine-learning predictions (ANN, MLP, SVR, and hybrid model) of crystal size, band gap, and emission wavelength, which are directly validated against experimental measurements. This contrasts with recent 2025 studies (Refs. [78–80]), which primarily focus on synthesis and electrochemical testing of ZnO/GO systems. Additionally, we offer an interpretable evaluation of material suitability for energy storage that takes experimental uncertainty into account by combining a fuzzy-logic framework with ML outputs. To the best of our knowledge, this combined simulation, synthesis, and characterization methodology creates a novel predictive and validation pathway that hasn’t been documented in current ZnO/GO energy-storage research.
By promoting quicker charge transfer and providing more active sites, GO improves ZnO conductivity and surface area at lower concentrations, hence enhancing energy storage. But as the amount of GO increases, it starts to aggregate and obstruct ZnO’s porous structure. Consequently, at higher GO levels, the energy storage capacity begins to decrease. The values of important electrochemical parameters for ZnO/GO nanocomposites charge storage capacity (F/g), compared between experimental and machine learning predicted values, are shown in Fig. 20a–d. Fig. 20a for ANN, Fig. 20b for MLP, Fig. 20c for SVR, and Fig. 20d for the hybrid model display predictions of particular capacitance. These findings demonstrate that machine learning models are capable of accurately simulating electrochemical behaviour, minimizing experimental burden, and directing material design optimization.
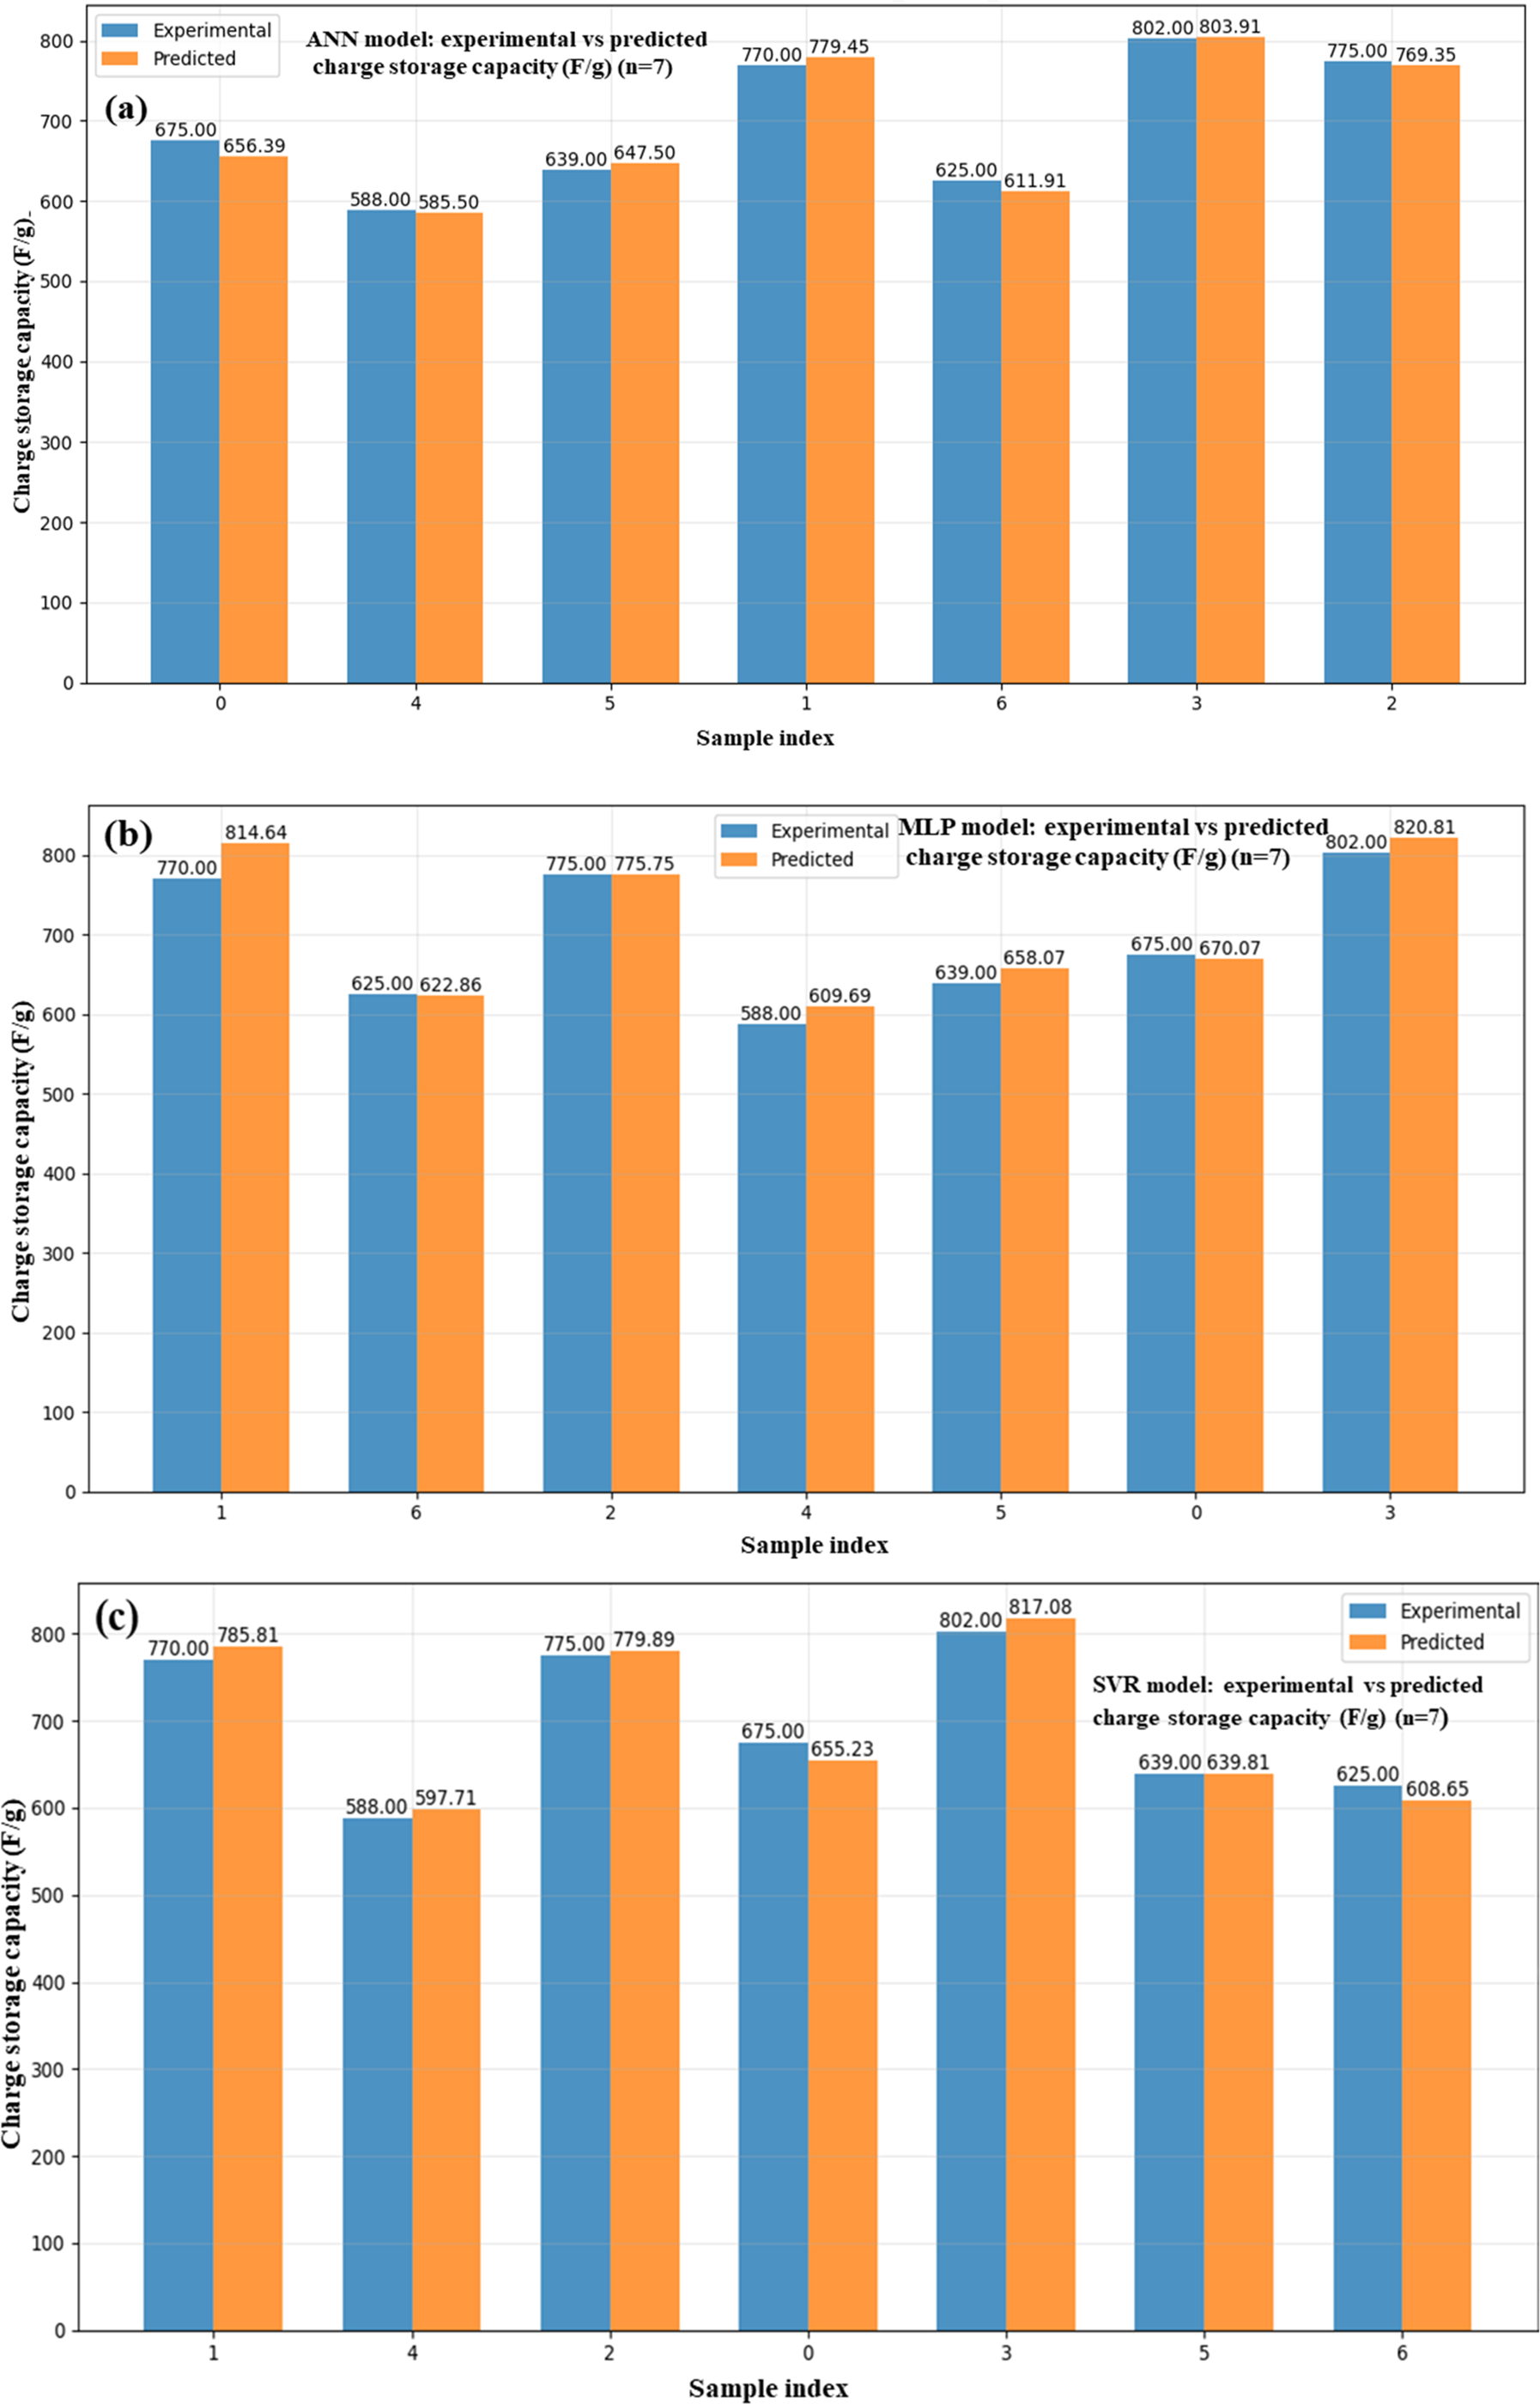
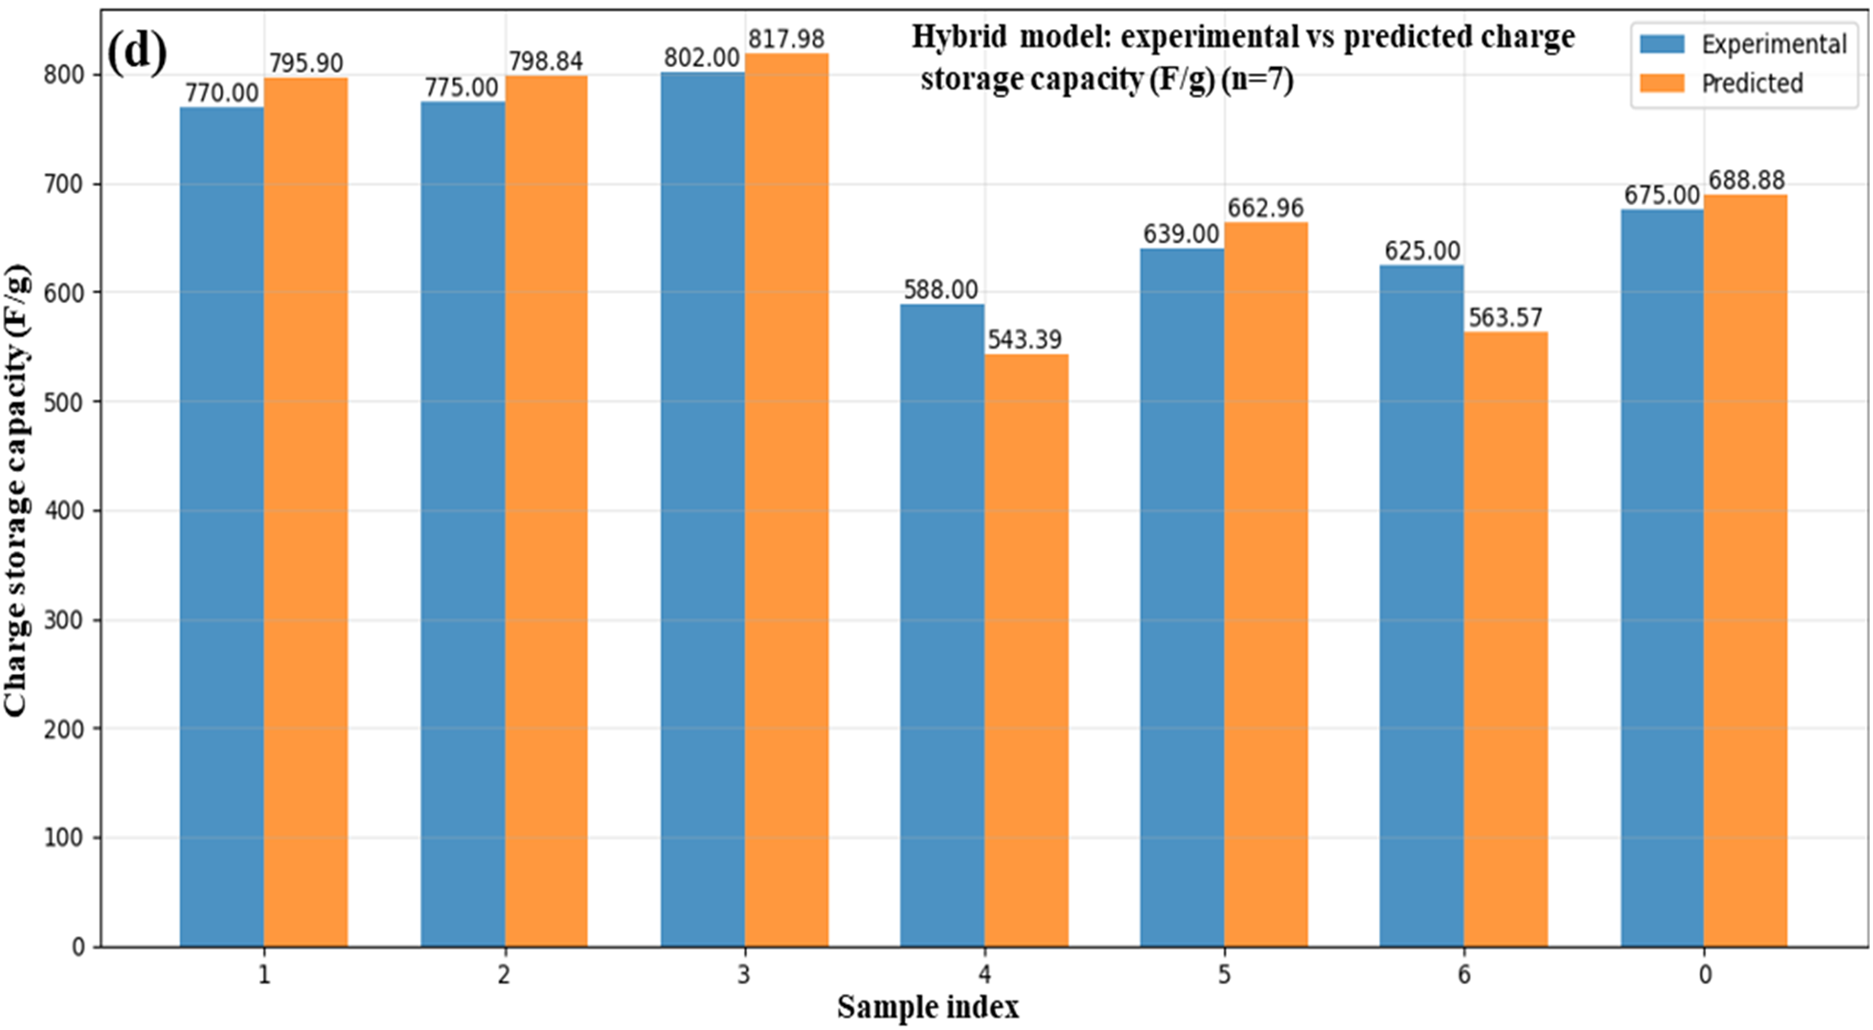
Figure 20: Experimental and ML-based prediction of charge storage capacity ANN (a), MLP (b), SVR (c), and hybrid (d) in ZnO/GO nanocomposites
The dependability of the synthesized smart nanocomposite is highlighted by the striking consistency between experimental data, fuzzy logic simulations, and machine learning predictions (ANN, MLP, SVR, and hybrid models). Band gap, energy density, power density, emission wavelength, charge transfer resistance, and crystallite size are critical parameters that closely resemble the benchmark values found in high-impact studies on energy storage materials. This synthesis shows that this excellent innovation fulfills the needs that are required for a better performance of the supercapacitor and battery system, which can also be verified by multimodal methodology. These characteristics are correlated with the ideal ranges by showing that these materials can be widely used in the real world for energy devices. This whole process gives us a novel, unique, and fresh approach for the formation of highly sophisticated nanocomposite materials for future energy storage systems. Our research basically focuses on the development of a smart next-generation nanocomposite material for energy storage because it integrates the material properties with ML-based analysis. The materials that are under observation have a low value of internal resistance, a high value of energy storage capacity, and ideal band gaps. These are the important properties for energy storage applications. These samples are very promising for next-generation and novel energy storage devices, i.e., batteries and supercapacitors, because they combine experimental and intelligent approaches.
ML-based approaches provide significant advantages in ZnO/GO nanocomposite optimizations for energy applications, resulting in more focused and effective material development. The development of effective and scalable energy storage solutions is directly aided by the combination of ML-based simulation and experimental synthesis. The smart nanocomposite for energy applications was prepared successfully by using the chemical route (hydrothermal) method. The morphology and structure of the synthesized sample were analyzed and investigated by different quantitative and qualitative methods. The formation of the hexagonal ZnO/GO nanocomposite with a crystallite size of 17.41 nm was explained by the XRD measurements. The EDS and SEM investigations demonstrate the production of GO nanoparticles over the ZnO. The PL investigation revealed strong optical activity at a wavelength of 439 nm for an emission peak with a band gap of 2.81 eV. The effective synthesis of the composite was demonstrated by Zn-O bonding and GO functional groups found by FTIR. The energy storage devices, like supercapacitors, can be fabricated by using smart nanocomposite materials such as ZnO/GO nanocomposites. Due to their excellent energy storage ability and high mechanical strength, these composites are commonly used for electrode materials in supercapacitors and batteries. The results obtained from these nanocomposites show a strong agreement with the properties of the materials already used for electronic and energy storage applications. To understand the complete properties of the nanocomposites, we integrate the FL, ML, and experimental data. The results obtained from these techniques show that these nanocomposites can be effectively used for the piezoelectric, nano energy system, and energy storage devices such as supercapacitors.
Acknowledgement: The authors are thankful to the Deanship of Scientific Research, Vice Presidency for Graduate Studies and Scientific Research, King Faisal University, Saudi Arabia, for supporting the study and the collaboration work of Nano Electronics Research Lab, GC University Lahore, Pakistan.
Funding Statement: The authors extend their gratitude to the Deanship of Scientific Research, Vice Presidency for Graduate Studies and Scientific Research, King Faisal University, Saudi Arabia, for funding the publication of this work under the Ambitious Researcher program (Project No. KFU253806).
Author Contributions: Tahir Mahmood contributed conceptualization, experimentation, methodology, software, validation, formal analysis, investigation, data curation, and writing—original draft; Muhammad Waseem Ashraf and Shahzadi Tayyaba contributed supervision, simulation, validation, resources, writing—review and editing, visualization, and project administration; Muhammad Munir contributed resources, visualization, funding, reviewing and editing the paper. Babiker M. A. Abdel-Banat and Hassan Ali Dinar helped in visualization, resources, reviewing, and editing this paper. All authors reviewed the results and approved the final version of the manuscript.
Availability of Data and Materials: On reasonable request, the corresponding authors will provide the data that has been presented in this paper.
Ethics Approval: Not applicable.
Conflicts of Interest: The authors declare no conflicts of interest to report regarding the present study.
References
1. Amiri MH, Namdar N, Mashayekhi A, Ghasemi F, Sanaee Z, Mohajerzadeh S. Flexible micro supercapacitors based on laser-scribed graphene/ZnO nanocomposite. J Nanopart Res. 2016;18(8):237. doi:10.1007/s11051-016-3552-5. [Google Scholar] [CrossRef]
2. Qin J, Zhang X, Xue Y, Kittiwattanothai N, Kongsittikul P, Rodthongkum N, et al. A facile synthesis of nanorods of ZnO/graphene oxide composites with enhanced photocatalytic activity. Appl Surf Sci. 2014;321:226–32. doi:10.1016/j.apsusc.2014.10.008. [Google Scholar] [CrossRef]
3. Van Khai T, Maneeratanasarn P, Choi BG, Ham H, Shim KB. Diameter- and density-controlled synthesis of well-aligned ZnO nanowire arrays and their properties using a thermal evaporation technique. Phys Status Solidi A. 2012;209(8):1498–510. doi:10.1002/pssa.201127494. [Google Scholar] [CrossRef]
4. Van Khai T, Van Thu L, Huu NT, Lam TD. Vertically well-aligned ZnO nanowire arrays directly synthesized from Zn vapor deposition without catalyst. J Electron Mater. 2016;45(5):2601–7. doi:10.1007/s11664-016-4429-1. [Google Scholar] [CrossRef]
5. Drmosh QA, Yamani ZH, Hendi AHY, Gondal MA, Moqbel RA. P1GS.3—a low temperature H2 gas sensor based on Pt-loaded reduced graphene oxide/ZnO nanocomposites. In: Proceedings of the IMCS 2018; 2018 Jul 15–19; Vienna, Austria. doi:10.5162/imcs2018/p1gs.3. [Google Scholar] [CrossRef]
6. Xie B, Guo Y, Chen Y, Zhang H, Xiao J, Hou M, et al. Advances in graphene-based electrode for triboelectric nanogenerator. Nano Micro Lett. 2024;17(1):17. doi:10.1007/s40820-024-01530-1. [Google Scholar] [PubMed] [CrossRef]
7. Liang R, Du Y, Xiao P, Cheng J, Yuan S, Chen Y, et al. Transition metal oxide electrode materials for supercapacitors: a review of recent developments. Nanomaterials. 2021;11(5):1248. doi:10.3390/nano11051248. [Google Scholar] [PubMed] [CrossRef]
8. Chen SM, Ramachandran R, Mani V, Saraswathi R. Recent advancements in electrode materials for the highperformance electrochemical supercapacitors: a review. Int J Electrochem Sci. 2014;9(8):4072–85. doi:10.1016/S1452-3981(23)08076-8. [Google Scholar] [CrossRef]
9. Xavier AR, Ravichandran AT, Vijayakumar S, Angelin MD, Rajkumar S, Merlin JP. Synthesis and characterization of Sr-doped CdO nanoplatelets for supercapacitor applications. J Mater Sci Mater Electron. 2022;33(11):8426–34. doi:10.1007/s10854-021-06329-z. [Google Scholar] [CrossRef]
10. Ezhil Vilian AT, Rajkumar M, Chen SM, Hu CC, Piraman S. A promising photoelectrochemical sensor based on a ZnO particle decorated N-doped reduced graphene oxide modified electrode for simultaneous determination of catechol and hydroquinone. RSC Adv. 2014;4(89):48522–34. doi:10.1039/c4ra09260k. [Google Scholar] [CrossRef]
11. Srinivasan R, Elaiyappillai E, Anandaraj S, Duvaragan BK, Johnson PM. Study on the electrochemical behavior of BiVO4/PANI composite as a high performance supercapacitor material with excellent cyclic stability. J Electroanal Chem. 2020;861(33):113972. doi:10.1016/j.jelechem.2020.113972. [Google Scholar] [CrossRef]
12. Adil SF, Khan M, Shaik MR, Kuniyil M, Siddiqui MR, Al-Warthan A. Ag2O-MnO2/graphene oxide nanocomposite. Encyclopedia. 2020;1–17. doi:10.32545/encyclopedia202007.0007.v1. [Google Scholar] [CrossRef]
13. Sablok K, Bhalla V, Sharma P, Kaushal R, Chaudhary S, Suri CR. Amine functionalized graphene oxide/CNT nanocomposite for ultrasensitive electrochemical detection of trinitrotoluene. J Hazard Mater. 2013;248–249:322–8. doi:10.1016/j.jhazmat.2013.01.022. [Google Scholar] [PubMed] [CrossRef]
14. Ghosh TK, Gope S, Mondal D, Bhowmik B, Mollick MMR, Maity D, et al. Assessment of morphology and property of graphene oxide-hydroxypropylmethylcellulose nanocomposite films. Int J Biol Macromol. 2014;66:338–45. doi:10.1016/j.ijbiomac.2014.02.054. [Google Scholar] [PubMed] [CrossRef]
15. Sood K, Kaur J, Singh H, Kumar Arya S, Khatri M. Comparative toxicity evaluation of graphene oxide (GO) and zinc oxide (ZnO) nanoparticles on Drosophila melanogaster. Toxicol Rep. 2019;6:768–81. doi:10.1016/j.toxrep.2019.07.009. [Google Scholar] [PubMed] [CrossRef]
16. Soldano C, Mahmood A, Dujardin E. Production, properties and potential of graphene. Carbon. 2010;48(8):2127–50. doi:10.1016/j.carbon.2010.01.058. [Google Scholar] [CrossRef]
17. Pumera M. Graphene in biosensing. Mater Today. 2011;14(7–8):308–15. doi:10.1016/S1369-7021(11)70160-2. [Google Scholar] [CrossRef]
18. Mohd Yazid SNA, Md Isa I, Abu Bakar S, Hashim N, Ab Ghani S. A review of glucose biosensors based on graphene/metal oxide nanomaterials. Anal Lett. 2014;47(11):1821–34. doi:10.1080/00032719.2014.888731. [Google Scholar] [CrossRef]
19. Zhang D, Ashraf MA, Liu Z, Li C, Peng W. Effect of graphene nanoplatelets addition on the elastic properties of short ceramic fiber-reinforced aluminum-based hybrid nanocomposites. Mech Based Des Struct Mach. 2022;50(4):1417–33. doi:10.1080/15397734.2020.1753535. [Google Scholar] [CrossRef]
20. Khai TV, Long LN, Khoi NHT, Hoc Thang N. Effects of hydrothermal reaction time on the structure and optical properties of ZnO/graphene oxide nanocomposites. Crystals. 2022;12(12):1825. doi:10.3390/cryst12121825. [Google Scholar] [CrossRef]
21. Hu W, Li Z, Yang J. Electronic and optical properties of graphene and graphitic ZnO nanocomposite structures. J Chem Phys. 2013;138(12):124706. doi:10.1063/1.4796602. [Google Scholar] [PubMed] [CrossRef]
22. AlZoubi T, Qutaish H, Al-Shawwa E, Hamzawy S. Enhanced UV-light detection based on ZnO nanowires/graphene oxide hybrid using cost-effective low temperature hydrothermal process. Opt Mater. 2018;77(10):226–32. doi:10.1016/j.optmat.2018.01.045. [Google Scholar] [CrossRef]
23. Wanderley KA, Leite AM, Cardoso G, Medeiros AM, Matos CL, Dutra RC, et al. Graphene oxide and a GO/ZnO nanocomposite as catalysts for epoxy ring-opening of epoxidized soybean fatty acids methyl esters. Braz J Chem Eng. 2019;36(3):1165–73. doi:10.1590/0104-6632.20190363s20180540. [Google Scholar] [CrossRef]
24. Kuznetsova V, Coogan Á, Botov D, Gromova Y, Ushakova EV, Gun’ko YK. Expanding the horizons of machine learning in nanomaterials to chiral nanostructures. Adv Mater. 2024;36(18):e2308912. doi:10.1002/adma.202308912. [Google Scholar] [PubMed] [CrossRef]
25. Liu Y, Esan OC, Pan Z, An L. Machine learning for advanced energy materials. Energy AI. 2021;3:100049. doi:10.1016/j.egyai.2021.100049. [Google Scholar] [CrossRef]
26. Zhang Y, Xu W, Liu G, Zhang Z, Zhu J, Li M. Bandgap prediction of two-dimensional materials using machine learning. PLoS One. 2021;16(8):e0255637. doi:10.1371/journal.pone.0255637. [Google Scholar] [PubMed] [CrossRef]
27. Hir MZA, Alam NM, Shaari AS, Rafaie HA. One-pot Sol-gel synthesis of a zinc oxide-reduced graphene oxide composite: photocatalysis and kinetics studies using a fuzzy inference system. Malays J Chem. 2022;24(2):37–46. doi:10.55373/mjchem.v24i2.46. [Google Scholar] [CrossRef]
28. Salahuddin H, Imdad K, Chaudhry MU, Nazarenko D, Bolshev V, Yasir M. Induction machine-based EV vector control model using mamdani fuzzy logic controller. Appl Sci. 2022;12(9):4647. doi:10.3390/app12094647. [Google Scholar] [CrossRef]
29. Franceschi L, Donini M, Perrone V, Klein A, Archambeau C, Seeger M, et al. Hyperparameter optimization in machine learning. arXiv:2410.22854. 2024. [Google Scholar]
30. Olubosede O, Abd Rahman M, Alqahtani A, Souiyah M, Latif M, Oke W, et al. Tailoring the energy harvesting capacity of zinc selenide semiconductor nanomaterial through optical band gap modeling using genetically optimized intelligent method. Crystals. 2022;12(1):36. doi:10.3390/cryst12010036. [Google Scholar] [CrossRef]
31. Wang H, Wang Y, Yin X, Zhu M. Formation and agglomeration of nanoparticles and carbon debris in MnO2@C/GO. Appl Surf Sci. 2025;682:161663. doi:10.1016/j.apsusc.2024.161663. [Google Scholar] [CrossRef]
32. Kaviyarasu K. Investigation of structural, optical, photocatalytic, and antibacterial properties of ZnO doped GO nanoparticles for environment applications. Microsc Res Tech. 2025;88(1):73–91. doi:10.1002/jemt.24672. [Google Scholar] [PubMed] [CrossRef]
33. Yadav A, Varshan AG, Nayak S, Wu JY, Thanasekaran P. Structural, morphological, dielectric and semiconducting properties of ZnO nanoparticles calcined at 500°C. RSC Adv. 2025;15(44):36749–59. doi:10.1039/d5ra06276d. [Google Scholar] [PubMed] [CrossRef]
34. Lai Q, Zhu S, Luo X, Zou M, Huang S. Ultraviolet-visible spectroscopy of graphene oxides. AIP Adv. 2012;2(3):032146. doi:10.1063/1.4747817. [Google Scholar] [CrossRef]
35. Adogbeji VO, Atofarati EO, Sharifpur M, Meyer JP. Experimental investigation and machine learning modeling of the effects of hybridization mixing ratio, nanoparticle type, and temperature on the thermophysical properties of Fe3O4/TiO2, Fe3O4/MgO, and Fe3O4/ZnO-DI water hybrid ferrofluids. J Therm Anal Calorim. 2025;150(13):10549–73. doi:10.1007/s10973-025-14399-y. [Google Scholar] [CrossRef]
36. Küçüktopçu E, Cemek B, Simsek H. Comparative analysis of single and hybrid machine learning models for daily solar radiation. Energy Rep. 2024;11(2):3256–66. doi:10.1016/j.egyr.2024.03.012. [Google Scholar] [CrossRef]
37. Adun H, Wole-Osho I, Okonkwo EC, Bamisile O, Dagbasi M, Abbasoglu S. A neural network-based predictive model for the thermal conductivity of hybrid nanofluids. Int Commun Heat Mass Transf. 2020;119(3):104930. doi:10.1016/j.icheatmasstransfer.2020.104930. [Google Scholar] [CrossRef]
38. Logakannan KP, Guven I, Odegard G, Wang K, Zhang C, Liang Z, et al. A review of artificial intelligence (AI)-based applications to nanocomposites. Compos Part A Appl Sci Manuf. 2025;197:109027. doi:10.1016/j.compositesa.2025.109027. [Google Scholar] [CrossRef]
39. Delpisheh M, Ebrahimpour B, Fattahi A, Siavashi M, Mir H, et al. Leveraging machine learning in porous media. J Mater Chem A. 2024;12:20717–82. [Google Scholar]
40. Yang Y, Toyoda M, Yamaguchi A, Cho Y, El Aisnada AN, Abe H, et al. Bandgap widening through doping for improving the photocatalytic oxidation ability of narrow-bandgap semiconductors. Phys Chem Chem Phys. 2023;25(1):255–61. doi:10.1039/D2CP02994D. [Google Scholar] [PubMed] [CrossRef]
41. Sugianto S, Astuti B, Rahayu EF, Sulistyaningsih T, Yasiroh N, Yanti IF, et al. Hydrothermal synthesis of GO/ZnO composites and their micromorphology and electrochemical performance. Int J Electrochem Sci. 2023;18(5):100109. doi:10.1016/j.ijoes.2023.100109. [Google Scholar] [CrossRef]
42. Klingshirn C. ZnO: from basics towards applications. Phys Status Solidi B. 2007;244(9):3027–73. doi:10.1002/pssb.200743072. [Google Scholar] [CrossRef]
43. Dreyer DR, Park S, Bielawski CW, Ruoff RS. The chemistry of graphene oxide. Chem Soc Rev. 2010;39(1):228–40. doi:10.1039/b917103g. [Google Scholar] [PubMed] [CrossRef]
44. Stobinski L, Lesiak B, Malolepszy A, Mazurkiewicz M, Mierzwa B, Zemek J, et al. Graphene oxide and reduced graphene oxide studied by the XRD, TEM and electron spectroscopy methods. J Electron Spectrosc Relat Phenom. 2014;195:145–54. doi:10.1016/j.elspec.2014.07.003. [Google Scholar] [CrossRef]
45. Al-Rawashdeh NAF, Allabadi O, Aljarrah MT. Photocatalytic activity of graphene oxide/zinc oxide nanocomposites with embedded metal nanoparticles for the degradation of organic dyes. ACS Omega. 2020;5(43):28046–55. doi:10.1021/acsomega.0c03608. [Google Scholar] [PubMed] [CrossRef]
46. Li WJ, Shi EW, Zhong WZ, Yin ZW. Growth mechanism and growth habit of oxide crystals. J Cryst Growth. 1999;203(1–2):186–96. doi:10.1016/S0022-0248(99)00076-7. [Google Scholar] [CrossRef]
47. Boukhoubza I, Khenfouch M, Achehboune M, Leontie L, Galca AC, Enculescu M, et al. Graphene oxide concentration effect on the optoelectronic properties of ZnO/GO nanocomposites. Nanomaterials. 2020;10(8):E1532. doi:10.3390/nano10081532. [Google Scholar] [PubMed] [CrossRef]
48. Sharma N, Panneer Selvam S, Yun K. Electrochemical detection of amikacin sulphate using reduced graphene oxide and silver nanoparticles nanocomposite. Appl Surf Sci. 2020;512:145742. doi:10.1016/j.apsusc.2020.145742. [Google Scholar] [CrossRef]
49. Paul R, Gayen RN, Biswas S, Bhat SV, Bhunia R. Enhanced UV detection by transparent graphene oxide/ZnO composite thin films. RSC Adv. 2016;6(66):61661–72. doi:10.1039/c6ra05039e. [Google Scholar] [CrossRef]
50. Wang P, Wang D, Zhang M, Zhu Y, Xu Y, Ma X, et al. ZnO nanosheets/graphene oxide nanocomposites for highly effective acetone vapor detection. Sens Actuat B Chem. 2016;230(140):477–84. doi:10.1016/j.snb.2016.02.056. [Google Scholar] [CrossRef]
51. Saranya M, Garg S, Singh I, Ramachandran R, Santhosh C, Harish C, et al. Solvothermal preparation of ZnO/graphene nanocomposites and its photocatalytic properties. Nanosci Nanotechnol Lett. 2013;5(3):349–54. doi:10.1166/nnl.2013.1536. [Google Scholar] [CrossRef]
52. Rathod PP, Bhosle VK, Ubale AU, Khan ZS. Ultrasonically synthesized ZnO-GO nanocomposite for photocatalytic and antibacterial applications. Compos Commun. 2025;57:102457. doi:10.1016/j.coco.2025.102457. [Google Scholar] [CrossRef]
53. Yildirim F, Canpolat N, Aydogan S, Yilmaz M. Investigating the synergistic effect of ZnO/GO nanocomposite films for methylene blue removal. J Am Ceram Soc. 2024;107(9):6091–107. doi:10.1111/jace.19864. [Google Scholar] [CrossRef]
54. Kumar PS, Padmalaya G, Elavarasan N, Sreeja BS. GO/ZnO nanocomposite—as transducer platform for electrochemical sensing towards environmental applications. Chemosphere. 2023;313:137345. doi:10.1016/j.chemosphere.2022.137345. [Google Scholar] [PubMed] [CrossRef]
55. Muda MR, Ramli MM, Isa SSM, Jamlos MF, Murad SAZ, Norhanisah Z, et al. Fundamental study of reduction graphene oxide by sodium borohydride for gas sensor application. AIP Conf Proc. 2017;1808(1):020034. doi:10.1063/1.4975267. [Google Scholar] [CrossRef]
56. Albiter E, Merlano AS, Rojas E, Barrera-Andrade JM, Salazar Á, Valenzuela MA. Synthesis, characterization, and photocatalytic performance of ZnO-graphene nanocomposites: a review. J Compos Sci. 2021;5(1):4. doi:10.3390/jcs5010004. [Google Scholar] [CrossRef]
57. Zhang T, Zhang D, Shen M. A low-cost method for preliminary separation of reduced graphene oxide nanosheets. Mater Lett. 2009;63(23):2051–4. doi:10.1016/j.matlet.2009.06.050. [Google Scholar] [CrossRef]
58. Bano N, Hussain I, EL-Naggar AM, Albassam AA. Reduced graphene oxide nanocomposites for optoelectronics applications. Appl Phys A. 2019;125(3):215. doi:10.1007/s00339-019-2518-8. [Google Scholar] [CrossRef]
59. Hussain A, Fiaz S, Almohammedi A, Waqar A. Optimizing photocatalytic performance with Ag-doped ZnO nanoparticles: synthesis and characterization. Heliyon. 2024;10(15):e35725. doi:10.1016/j.heliyon.2024.e35725. [Google Scholar] [PubMed] [CrossRef]
60. Jia W, Yuan X. Concurrent and dual N-doping of graphene/ZnO nanocomposites for enhanced Cr(VI) photoreduction activity under visible-light irradiation. RSC Adv. 2020;10(51):30832–9. doi:10.1039/d0ra05284a. [Google Scholar] [PubMed] [CrossRef]
61. Ganesh V, AlAbdulaal TH, AlShadidi M, Hussien SA, Bouzidi M, Algarni A, et al. Enhancement in the structural, electrical, optical, and photocatalytic properties of La2O3-doped ZnO nanostructures. Materials. 2022;15(19):6866. doi:10.3390/ma15196866. [Google Scholar] [PubMed] [CrossRef]
62. Malhotra JS, Singh AK, Khosla R, Sharma SK, Sharma G, Kumar S. Investigations on structural, optical and magnetic properties of Fe and Dy Co-doped ZnO nanoparticles. J Mater Sci: Mater Electron. 2018;29(5):3850–5. doi:10.1007/s10854-017-8321-4. [Google Scholar] [CrossRef]
63. Shanthi SI, Poovaragan S, Arularasu MV, Nithya S, Sundaram R, Magdalane CM, et al. Optical, magnetic and photocatalytic activity studies of Li, Mg and Sr doped and undoped zinc oxide nanoparticles. J Nanosci Nanotechnol. 2018;18(8):5441–7. doi:10.1166/jnn.2018.15442. [Google Scholar] [PubMed] [CrossRef]
64. Srivastava A, Katiyar A. Zinc oxide nanostructure. In: Ceramic science and engineering. Amsterdam, The Netherlands: Elsevier; 2022. p. 235–62. doi:10.1016/b978-0-323-89956-7.00012-7. [Google Scholar] [CrossRef]
65. Bousslama W, Elhouichet H, Férid M. Enhanced photocatalytic activity of Fe doped ZnO nanocrystals under sunlight irradiation. Optik. 2017;134:88–98. doi:10.1016/j.ijleo.2017.01.025. [Google Scholar] [CrossRef]
66. Raza S, Baig F, Fahad HM, Naeem I. Investigation of Cd and Co Co-doped ZnO nanopowder for supercapacitor applications. J Sol Gel Sci Technol. 2024;109(2):407–20. doi:10.1007/s10971-023-06272-x. [Google Scholar] [CrossRef]
67. Bashir MI, Imran M, Anjum F, Nasir A, Taimur S, Baig F, et al. A single electrode comparison of Ni & Cu MOF for supercapacitor applications. Solid State Commun. 2025;403(2):115991. doi:10.1016/j.ssc.2025.115991. [Google Scholar] [CrossRef]
68. Zehar E, Ouerdane A, Chetti B, Çoruh A. Improving optical and morphological properties of Mn-doped ZnO via Ar ion sputtering followed by high-temperature UHV annealing. Mater Sci Pol. 2023;41(2):325–38. doi:10.2478/msp-2023-0024. [Google Scholar] [CrossRef]
69. Obeid MM, Jappor HR, Al-Marzoki K, Al-Hydary IA, Edrees SJ, Shukur MM. Unraveling the effect of Gd doping on the structural, optical, and magnetic properties of ZnO based diluted magnetic semiconductor nanorods. RSC Adv. 2019;9(57):33207–21. doi:10.1039/c9ra04750f. [Google Scholar] [PubMed] [CrossRef]
70. Meng A, Xing J, Li Z, Li Q. Cr-doped ZnO nanoparticles: synthesis, characterization, adsorption property, and recyclability. ACS Appl Mater Interfaces. 2015;7(49):27449–57. doi:10.1021/acsami.5b09366. [Google Scholar] [PubMed] [CrossRef]
71. Manzoor S, Akhlaq M, Tariq Butt N, Wasim MF. Structural parameter analysis of Mg doped ZnO nano rods by fuzzy logic controller. Int J Recent Contrib Eng Sci IT. 2021;9(2):20. doi:10.3991/ijes.v9i2.21911. [Google Scholar] [CrossRef]
72. Hussain B, Aslam A, Khan TM, Creighton M, Zohuri B. Electron affinity and bandgap optimization of zinc oxide for improved performance of ZnO/Si heterojunction solar cell using PC1D simulations. Electronics. 2019;8(2):238. doi:10.3390/electronics8020238. [Google Scholar] [CrossRef]
73. Owolabi TO, Abd Rahman MA. Energy band gap modeling of doped bismuth ferrite multifunctional material using gravitational search algorithm optimized support vector regression. Crystals. 2021;11(3):246. doi:10.3390/cryst11030246. [Google Scholar] [CrossRef]
74. Naeem I, Baig F, Fahad HM, Raza S. Analysis of Mg and Ni Co-doped ZnO nanopowder for supercapacitor applications. Ionics. 2024;30(5):2989–3002. doi:10.1007/s11581-024-05447-y. [Google Scholar] [CrossRef]
75. Altaf CT, Colak TO, Rostas AM, Socaci C, Lazar MD, Tudoran LB, et al. Zinc oxide nanoflake/reduced graphene oxide nanocomposite-based dual-acting electrodes for solar-assisted supercapacitor applications. Energy Adv. 2024;3(8):1965–76. doi:10.1039/d4ya00253a. [Google Scholar] [CrossRef]
76. Navarro-López DE, Perfecto-Avalos Y, Zavala A, de Luna MA, Sanchez-Martinez A, Ceballos-Sanchez O, et al. Unraveling the complex interactions: machine learning approaches to predict bacterial survival against ZnO and lanthanum-doped ZnO nanoparticles. Antibiotics. 2024;13(3):220. doi:10.3390/antibiotics13030220. [Google Scholar] [PubMed] [CrossRef]
77. Huo S, Zhang S, Wu Q, Zhang X. Feature-assisted machine learning for predicting band gaps of binary semiconductors. Nanomaterials. 2024;14(5):445. doi:10.3390/nano14050445. [Google Scholar] [PubMed] [CrossRef]
78. Aiswarya R, Kalaivani T. Facile synthesis of highly porous hierarchical ZnO nano-flowers array over graphene oxide nanocomposite for high performance supercapacitor applications. Electrochim Acta. 2025;515(1):145676. doi:10.1016/j.electacta.2025.145676. [Google Scholar] [CrossRef]
79. Jasim SH, Al-Asadi AS. Enhancing the supercapacitor performance by manufacturing hybrid electrode based on foam-like graphene oxide/zinc oxide nanoparticles. Mater Sci Eng B. 2025;314(1):118064. doi:10.1016/j.mseb.2025.118064. [Google Scholar] [CrossRef]
80. Maity S, Dutta A, Tantubay K, Bairy B, Saha S, Bhowmick S, et al. Fabrication of a hybrid reduced graphene oxide functionalized ZnO/ZnCo2O4 nanocomposite for electrochemical energy storage. Hybrid Adv. 2025;10:100466. doi:10.1016/j.hybadv.2025.100466. [Google Scholar] [CrossRef]
81. Rajala S, Lekkala J. Film-type sensor materials PVDF and EMFi in measurement of cardiorespiratory signals—a review. IEEE Sens J. 2012;12(3):439–46. doi:10.1109/JSEN.2010.2089510. [Google Scholar] [CrossRef]
82. Wilson DM, Hoyt S, Janata J, Booksh K, Obando L. Chemical sensors for portable, handheld field instruments. IEEE Sens J. 2001;1(4):256–74. doi:10.1109/7361.983465. [Google Scholar] [CrossRef]
83. Büyükkürkçü H, Durmuş A, Çolak H, Kurban R, Şahmetlioğlu E, Karaköse E. Investigation of the performance and properties of ZnO/GO double-layer supercapacitor. J Phys Chem Solids. 2024;191:111984. [Google Scholar]
84. Bhadwal N, Ben Mrad R, Behdinan K. Review of zinc oxide piezoelectric nanogenerators: piezoelectric properties, composite structures and power output. Sensors. 2023;23(8):3859. doi:10.3390/s23083859. [Google Scholar] [PubMed] [CrossRef]
85. Meskher H, Achi F, Zouaoui A, Ha S, Peacock M, Belkhalfa H. Simultaneous and selective electrochemical determination of catechol and hydroquinone on a nickel oxide (NiO) reduced graphene oxide (rGO) doped multiwalled carbon nanotube (fMWCNT) modified platinum electrode. Anal Lett. 2022;55(9):1466–81. doi:10.1080/00032719.2021.2008951. [Google Scholar] [CrossRef]
Cite This Article
 Copyright © 2026 The Author(s). Published by Tech Science Press.
This work is licensed under a Creative Commons Attribution 4.0 International License , which permits unrestricted use, distribution, and reproduction in any medium, provided the original work is properly cited.
 Downloads
 Citation Tools